

Abstract
RAG endonuclease initiates IgH V(D)J recombination in pro-B cells by binding a JH-recombination signal sequence (RSS) within a recombination center (RC) and then linearly scanning upstream chromatin, presented by cohesin-mediated loop extrusion, for convergent D-RSSs1,2. Utilization of convergently-oriented RSSs and cryptic RSSs is intrinsic to long-range RAG scanning3. RAG scanning from the DJH-RC-RSS to upstream convergent VH-RSSs is impeded by D-proximal CTCF-binding elements (CBEs)2–5. Primary pro-B cells undergo a mechanistically-undefined VH locus contraction proposed to provide distal VHs access to the DJH-RC6–9. Here, we report that a 2.4 mega-base VH locus inversion in primary pro-B cells abrogates rearrangement of both VH-RSSs and normally convergent cryptic RSSs, even though locus contraction still occurs. In addition, this inversion activated both utilization of cryptic VH-locus RSSs normally in opposite orientation and RAG scanning beyond the VH locus through multiple convergent-CBE domains to the telomere. Together, these findings imply that broad deregulation of CBE impediments in primary pro-B cells promotes loop extrusion-mediated RAG VH locus-scanning. We further found that expression of Wapl10, a cohesin-unloading factor, is low in primary pro-B cells versus v-Abl-transformed pro-B lines that lack contraction and RAG-scanning of the VH locus. Correspondingly, Wapl depletion in v-Abl-tranformed lines activated both processes, further implicating loop extrusion in the locus contraction mechanism.
Introduction of ectopic RCs into non-antigen receptor loci across v-Abl-transformed pro-B cell lines (hereafter “v-Abl cells”) genomes allows RAG to scan convergent CBE-anchored chromatin domains until terminated at convergent CBE loop anchors3. During such scanning, orientation of initiating bona fide RSSs in ectopic RCs programs RC-bound RAG to scan, over mega-base (Mb) distances, flanking chromatin presented by cohesin-mediated loop extrusion in one direction or the other3. In this context, RAG utilizes 100s of cryptic RSSs, as short as the conserved first 3 bp CAC motif of a bona fide RSS, when in convergent orientation with the initiating bona fide RSS of the ectopic RC3. Cryptic RSSs in the same orientation as the RC-RSS (e.g. GTGs) are not used unless they lie very close (within 20kb) to the RC, allowing access by diffusion1,3. Additional v-Abl cell studies demonstrated loop extrusion-mediated RAG scanning in promoting orientation-specific D to JH joining in the downstream IgH loop domain1. Thus, chromosomal orientation of JH-RSSs in the IgH RC programs RC-bound RAG to scan upstream D-containing chromatin; and, even though Ds have downstream and upstream bona fide RSSs in opposite orientations, only downstream D-RSSs convergently-oriented with initiating JH-RSSs are robustly used for D-to-JH joining1.
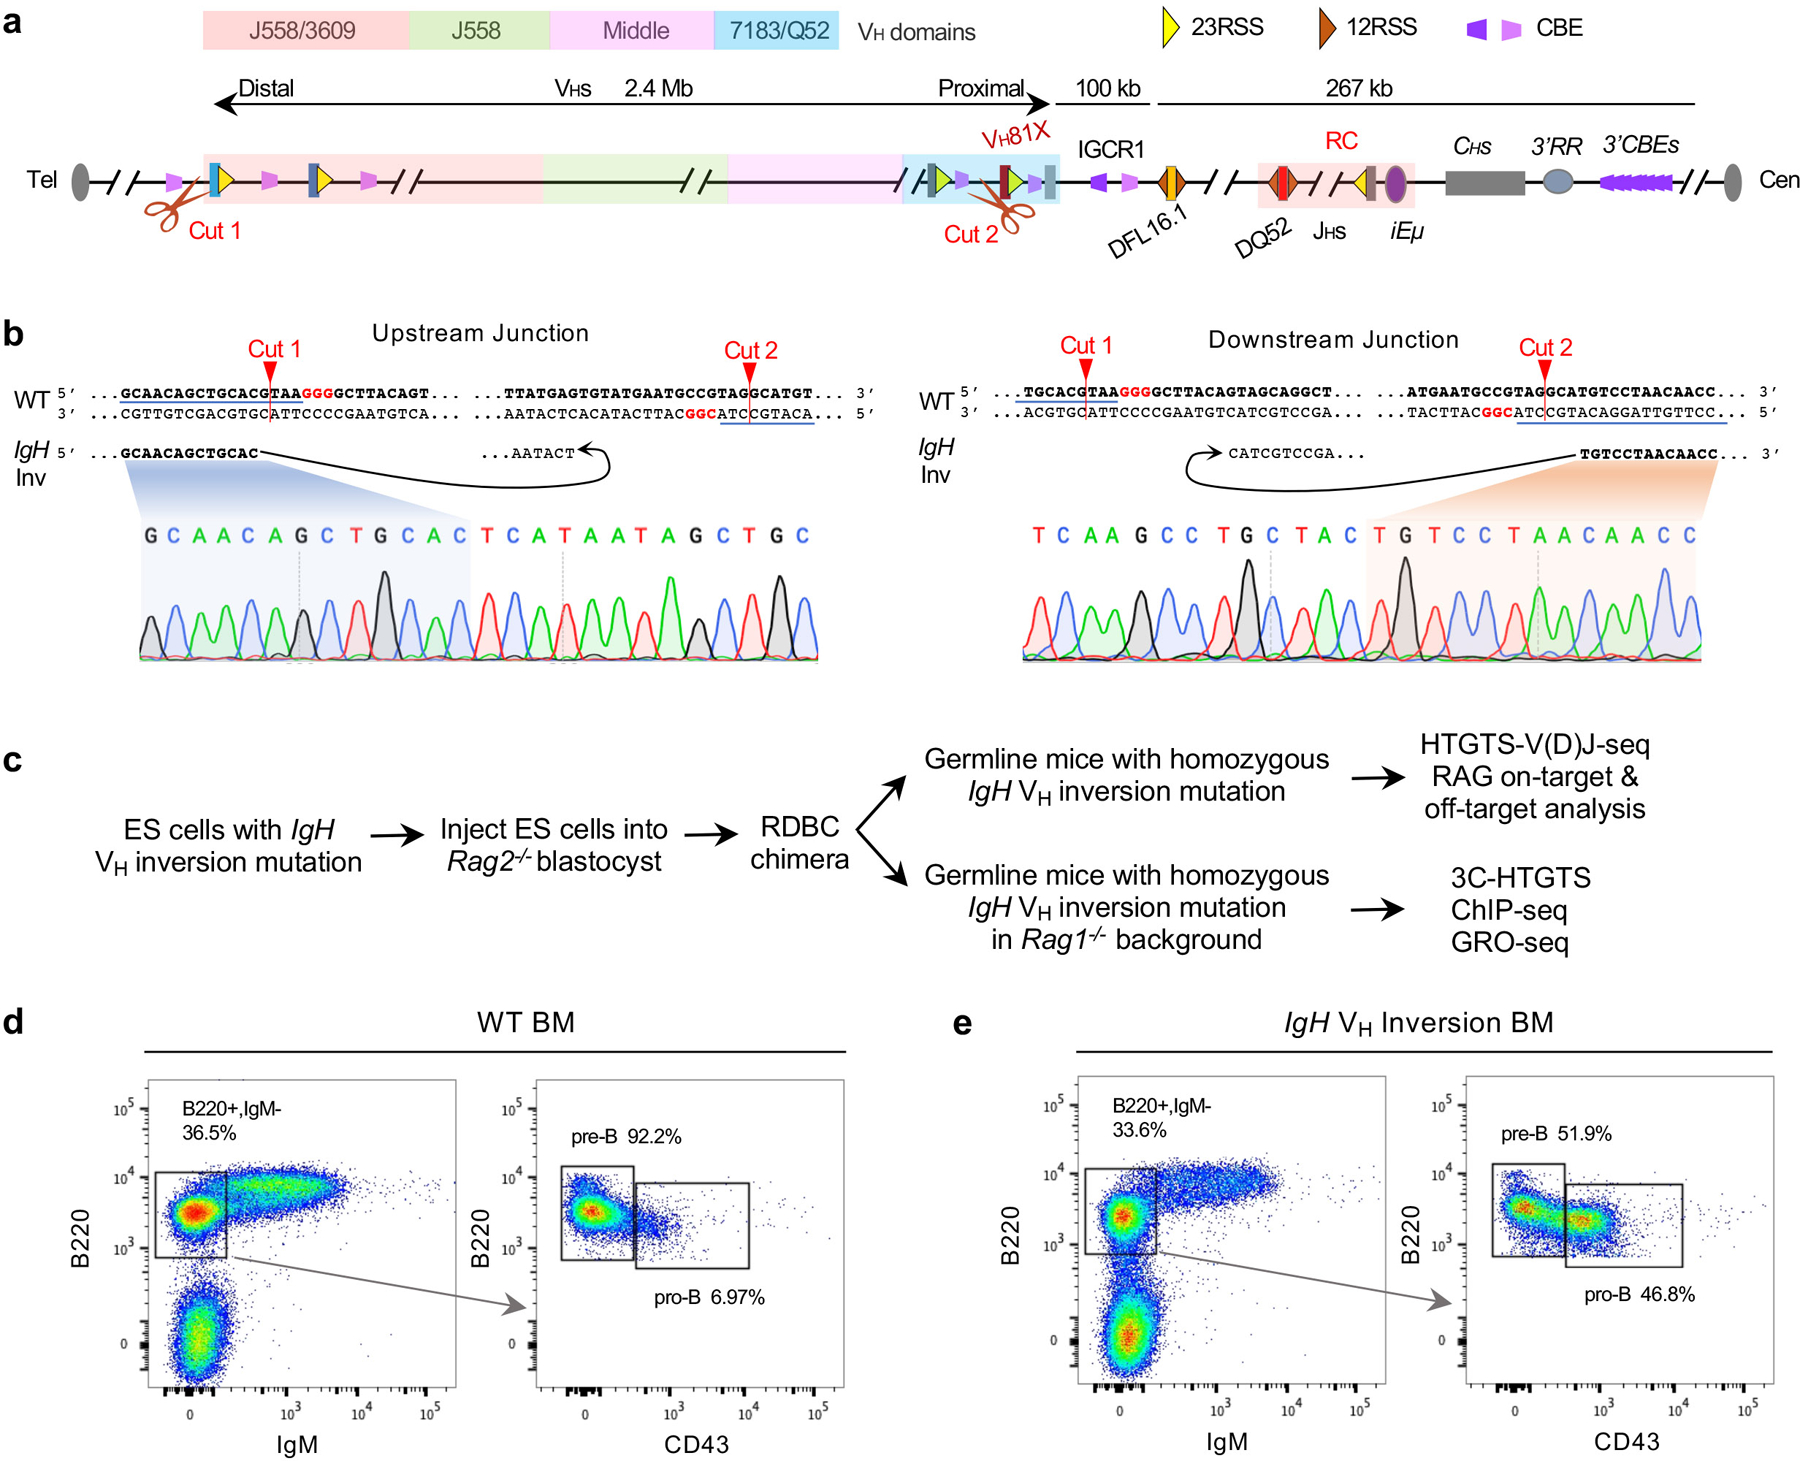
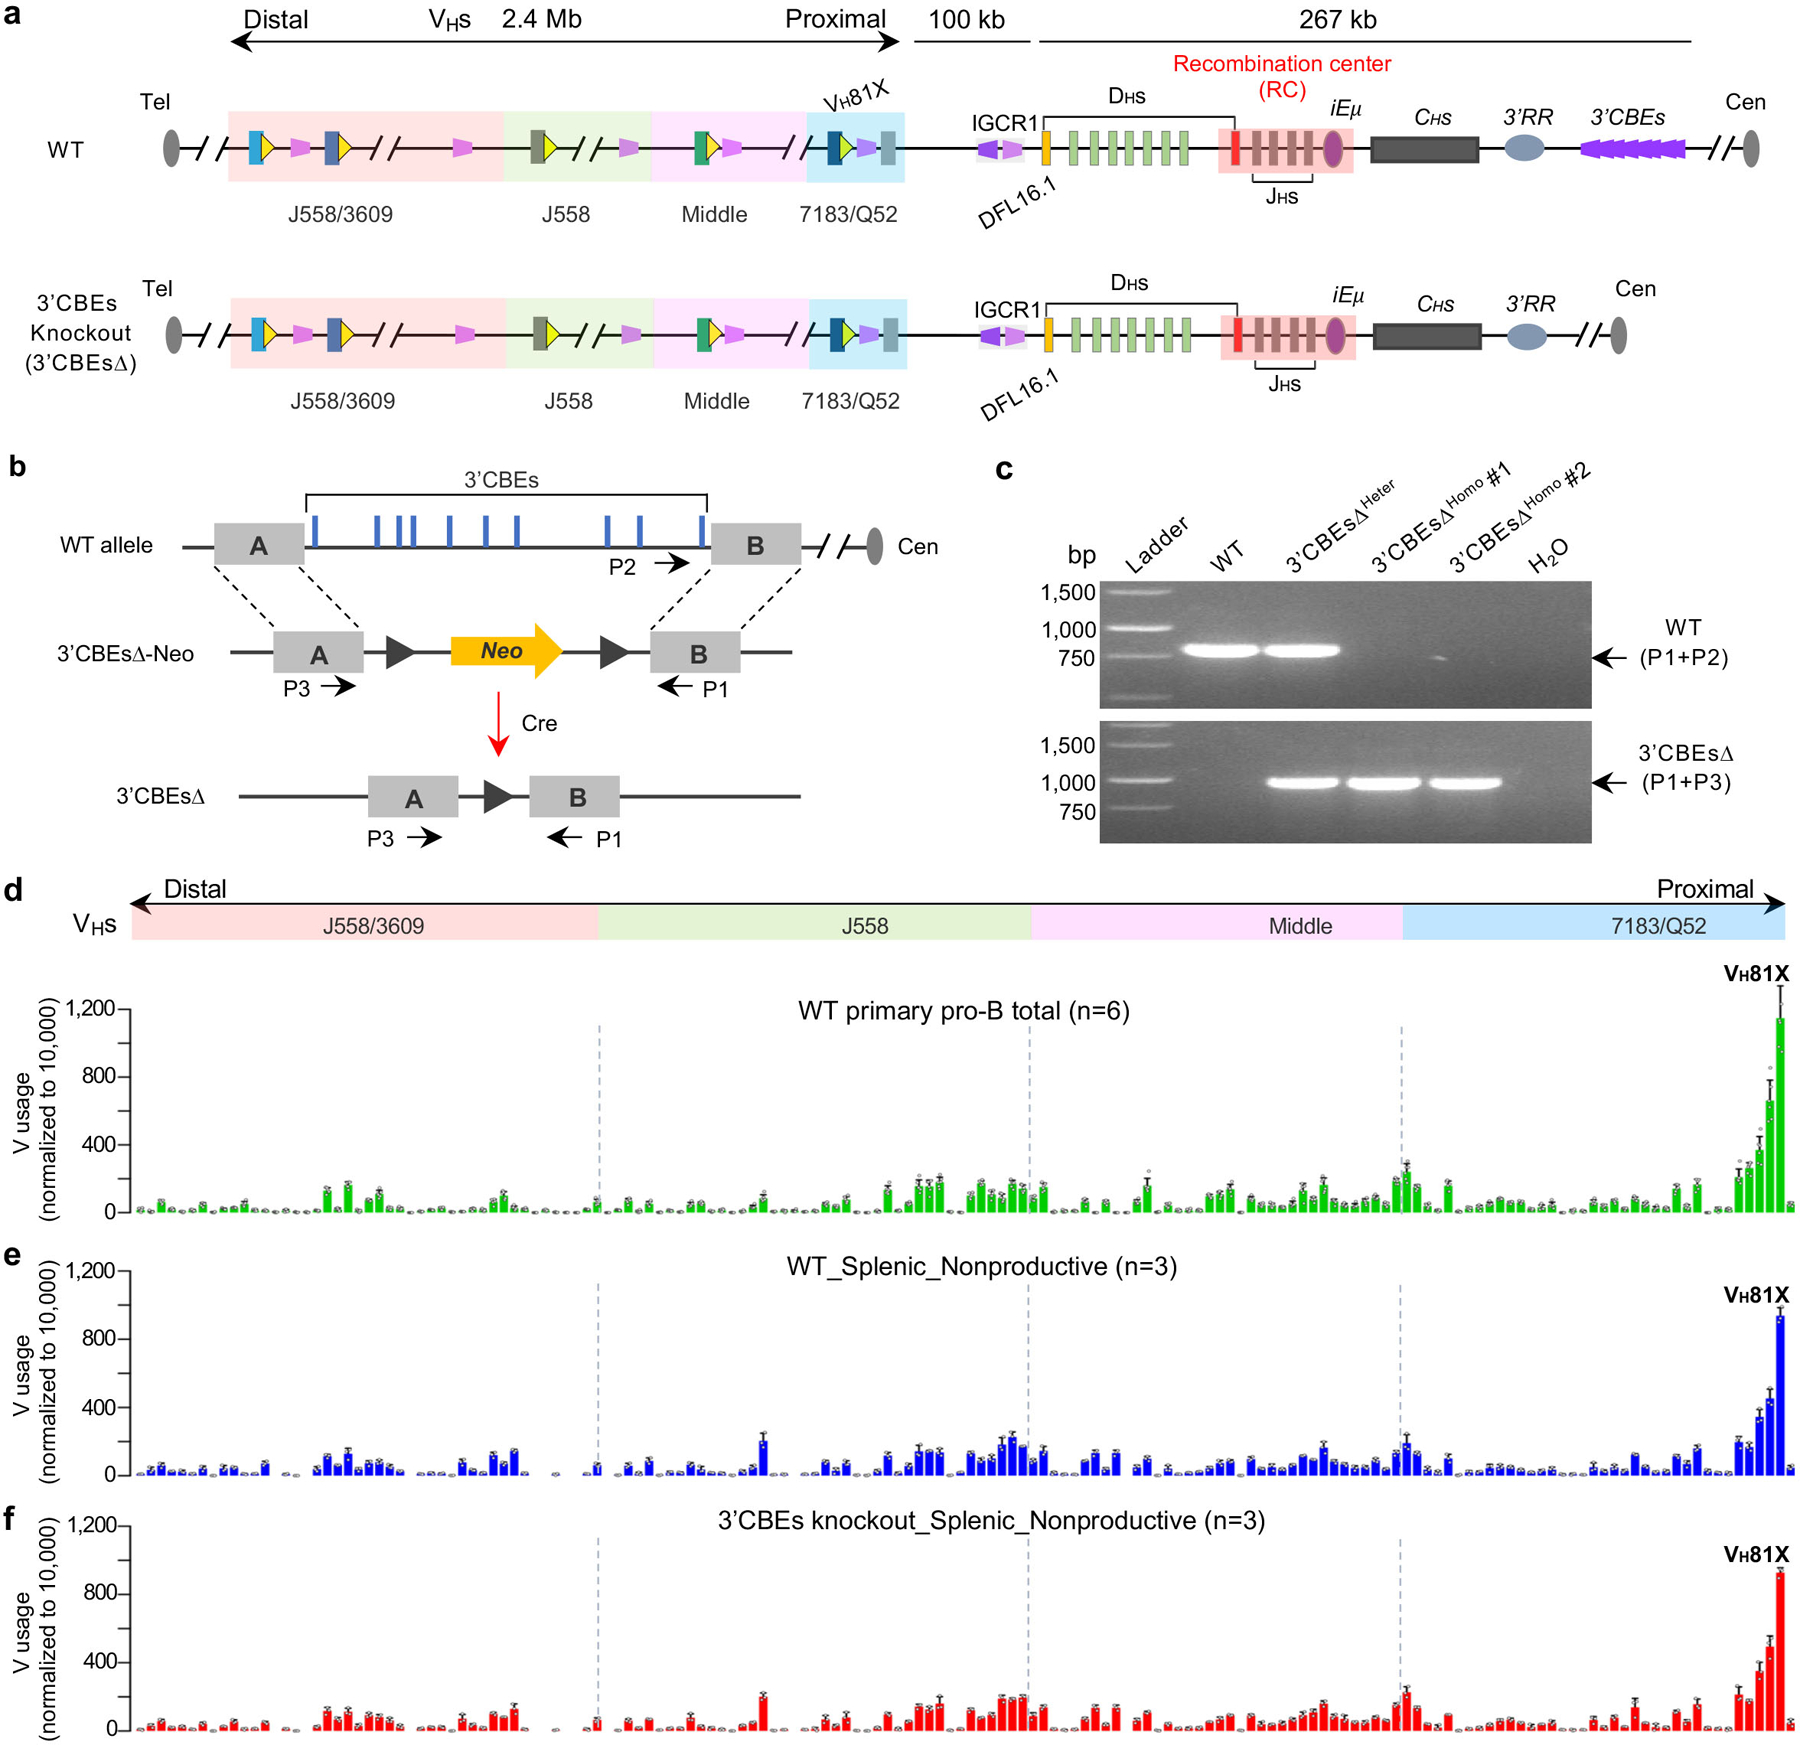
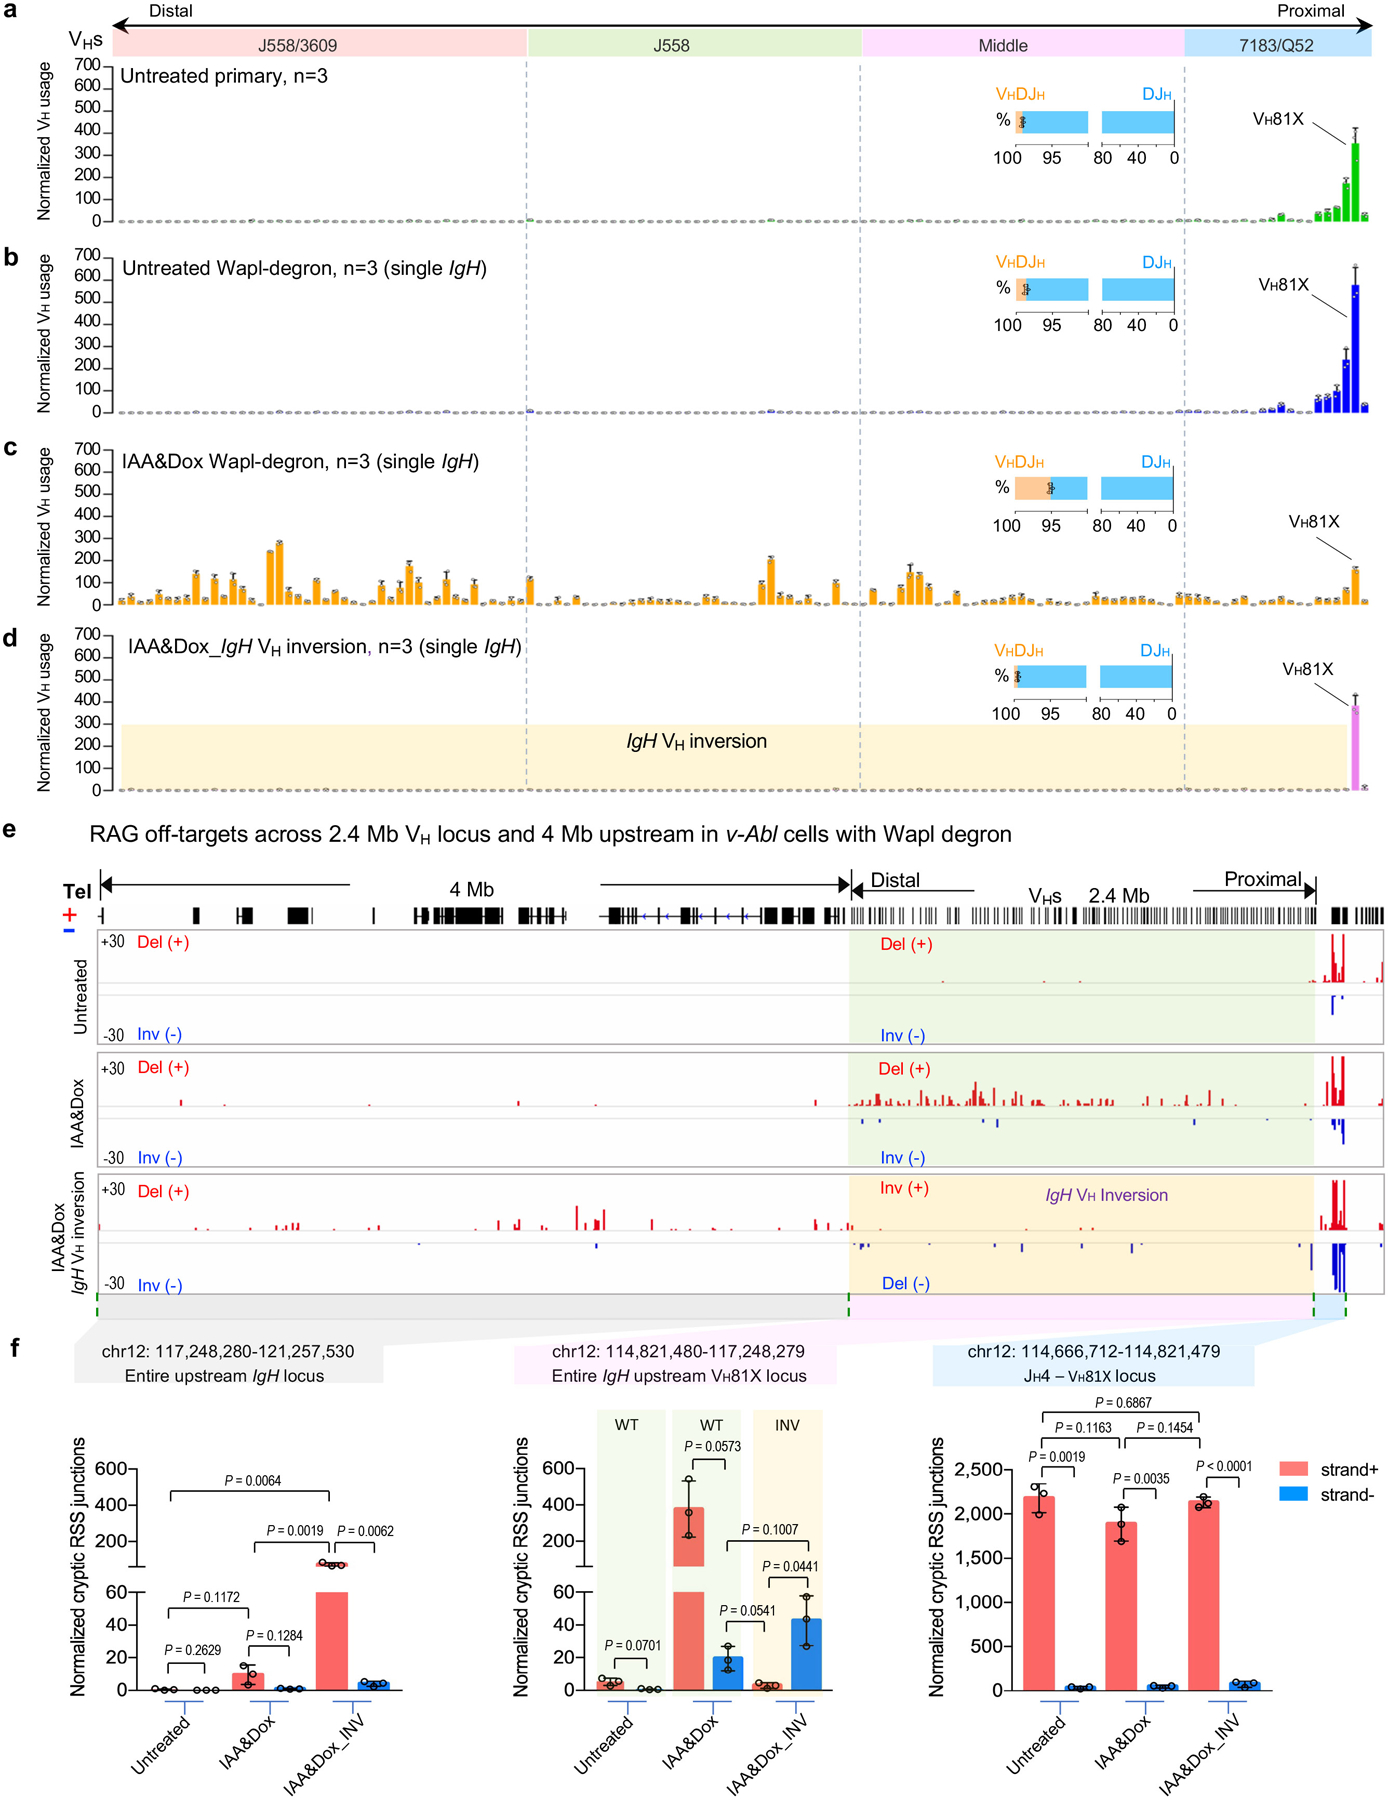
While all VH-RSSs are in convergent orientation with the upstream DJH-RC-RSS3, their RC scanning access at the D-to-JH rearrangement stage is impeded by CTCF-bound CBEs in intergenic control region 1 (IGCR1) upstream of the most distal D segment3–5. Inactivation of IGCR1 CBEs allows scanning of the most D-proximal VHs, during which their RSS-associated CBEs promote robust rearrangement and impede further upstream scanning5. 100s of CBEs, mostly not closely-associated with VHs, lie throughout the upstream VH locus and may also impede scanning if CTCF-bound2. Distal VHs are thought to access the DJH-RC-RSS in primary pro-B cells by diffusion upon gaining proximity via VH locus contraction6–9. To test potential contributions of loop extrusion-mediated RAG-scanning to locus contraction and long-range VH utilization in primary pro-B cells, we inverted the entire 2.4 Mb VH locus upstream of D-proximal VH81X in the genome of C57BL/6 mice; VH81X was left in normal position and orientation as a control (Fig. 1a; Extended Data Fig. 1). The VH locus contains 109 functional VHs within four VH domains from D-proximal to distal7,11,12 (Fig. 1a, top; Supplementary Table 1). The VH locus inversion placed the distal J558/3609 VHs in the proximal VH location and the proximal VH7183/Q52 locus, other than VH81X, in the distal location, with all 108 functional VHs and their RSSs across the locus inverted in orientation relative to the DJH-RC RSS (Fig. 1a middle, bottom). Based on our sensitive HTGTS-V(D)J-seq assay13,14, this inversion essentially abrogated rearrangement of all VH-RSSs within the inverted region in primary bone marrow pro-B cells, with utilization of normally-oriented and positioned VH81X doubling, perhaps due to lack of competition from upstream VHs5 (Fig. 1b, top versus bottom panel; Supplementary Table 1).
Figure. 1 |. A 2.4 Mb inversion of the VH locus nearly abrogates rearrangement of VHs within it in primary pro-B cells.
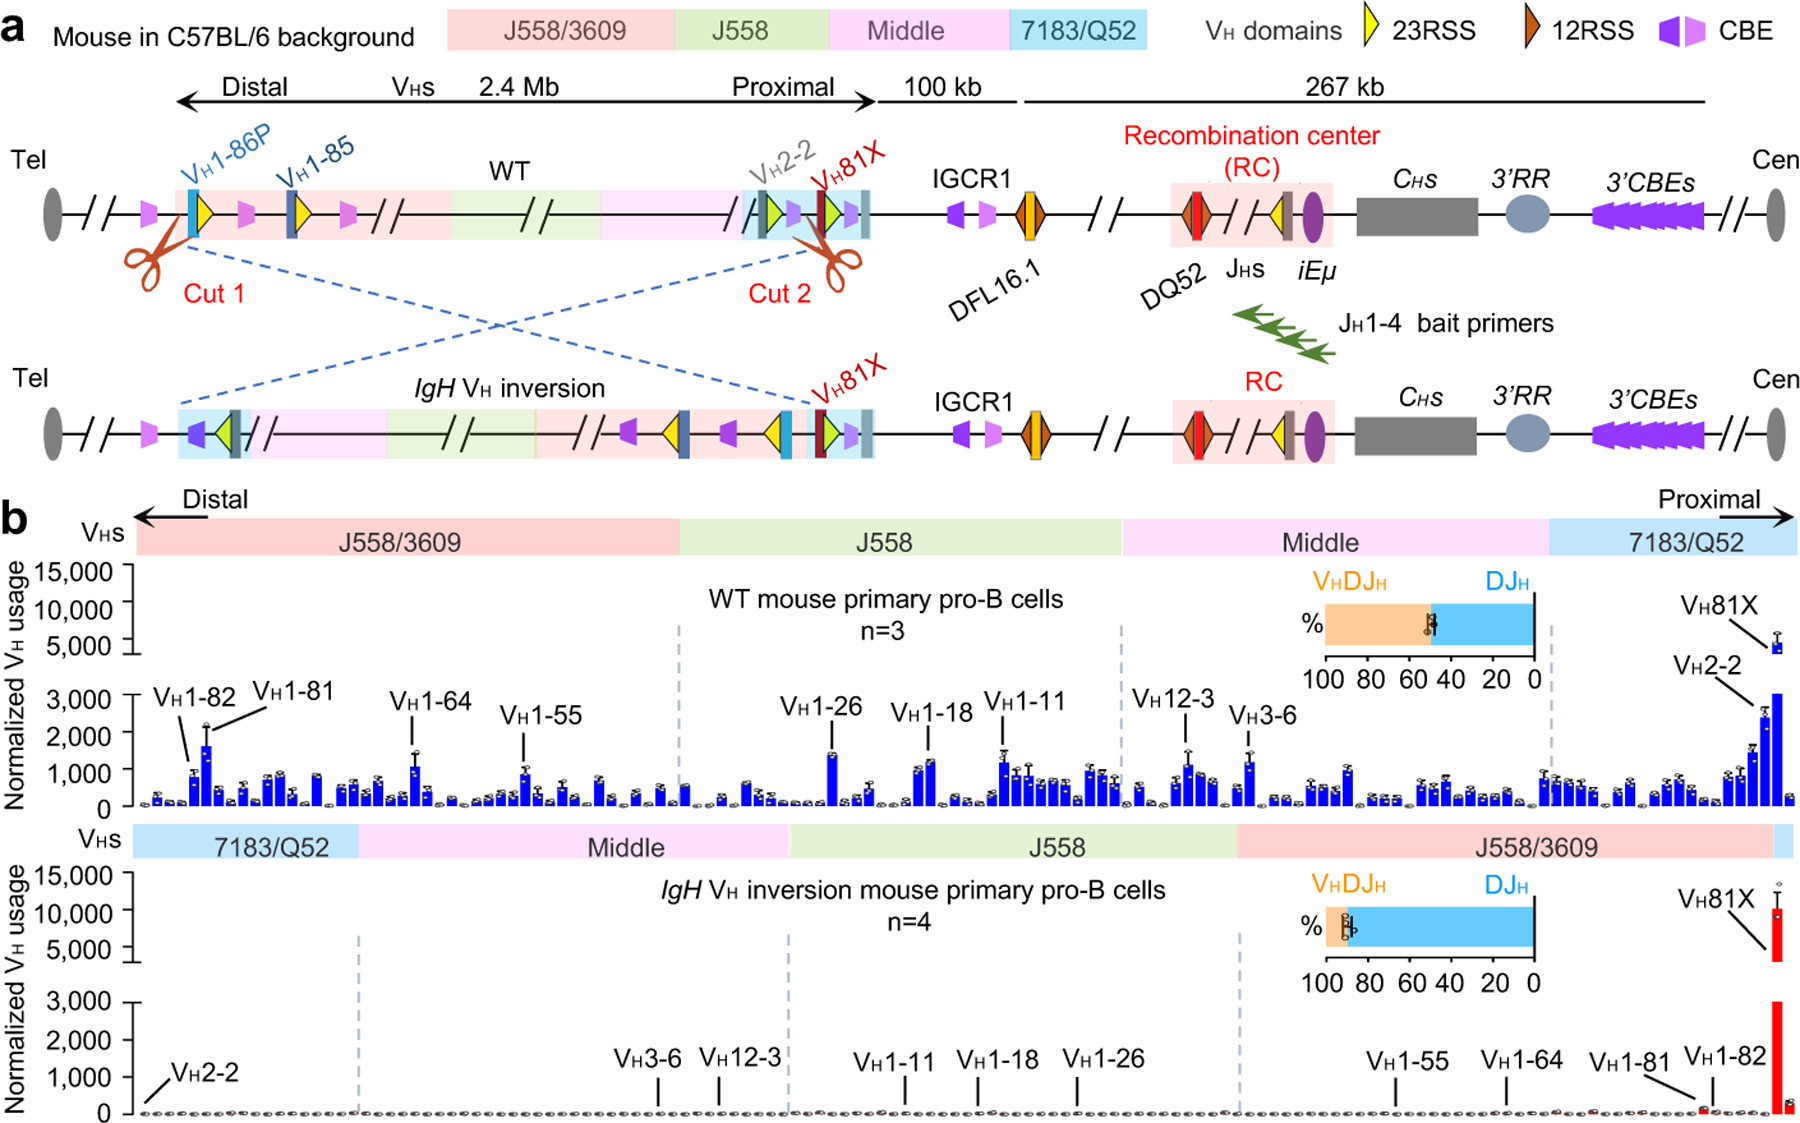
a, Schematic of the strategy of targeted IgH VH locus inversion. Diagram of the murine IgH locus showing the first two proximal VHs (VH81X and VH2–2), the last two distal VHs (VH1–86P and VH1–85), Ds, JHs, CHs, and regulatory elements as indicated (not to scale), with RC that comprises JH-proximal DQ52 segment, four JH segments, and the intronic enhancer (iEμ) highlighted. All VH segments are indicated and divided into four VHs domains (7183/Q52, Middle, J558 and J558/3609) from most proximal to distal. Yellow and dark orange triangles represent position and orientation of bona fide 23RSS and 12RSS, respectively. Purple and pink trapezoids represent position and orientation of CBEs. Green arrows denote the JH1–4 coding end bait primers used for generating HTGTS-V(D)J-seq libraries. Cut1 and Cut2 show the location of 2 sgRNAs. Tel denotes telomere. Cen denotes centromere. b, Average utilization frequencies ± s.d. of all VHs in WT (top) and IgH VH inversion (bottom) primary pro-B cells. Average percentage ± s.d. of VHDJH and DJH rearrangements are shown. For comparison, the VH usage data in the inverted locus is shown in inverted orientation (b, bottom), and several highly utilized VHs in each VH domain are indicated. n, number of independent experiments. See Supplementary Table 1 and Methods for more details.
While abrogation of all bona fide VH-RSS-mediated rearrangements within the inverted VH locus strongly implicates RAG chromatin scanning in their utilization, such an inversion could conceivably prevent locus contraction, or in some other way, impede VH-RSS access to the DJH-RC-RSS via diffusion. Therefore, we analyzed RAG utilization of cryptic RSSs across normal and inverted VH loci in primary pro-B cells (Fig. 2a, top). These analyses demonstrated that cryptic RSSs across the length of the normal 2.4 Mb VH locus in convergent orientation with the DJH-RC-RSS were utilized for RAG-mediated joining to the DJH complex, but those in the same orientation as the DJH-RC-RSS were not, further supporting linear scanning of the VH locus by RC-bound RAG in primary pro-B cells (Fig. 2b, top and 2c; Extended Data Fig.2a, top, and 2b). Moreover, the VH-inverted locus provided an even more stringent test of potential RAG scanning contributions. Thus, long-range RAG VH locus scanning predicts that cryptic RSSs across the normal VH locus in the same orientation as the DJH-RC-RSS that are not utilized by RAG scanning would be activated as scanning targets when placed in convergent orientation with the DJH-RC-RSS by the VH locus inversion (Fig. 2a, bottom). Strikingly, this was the case (Fig. 2b, bottom and 2c; Extended Data Fig. 2a, bottom, 2c). These findings strongly support a major role for cohesin-mediated loop extrusion-driven RAG chromatin scanning of the upstream VH locus in generating VH to DJH rearrangements in primary pro-B cells.
Figure. 2 |. V(D)J recombination of cryptic RSSs in normal and inverted IgH loci in primary pro-B cells.
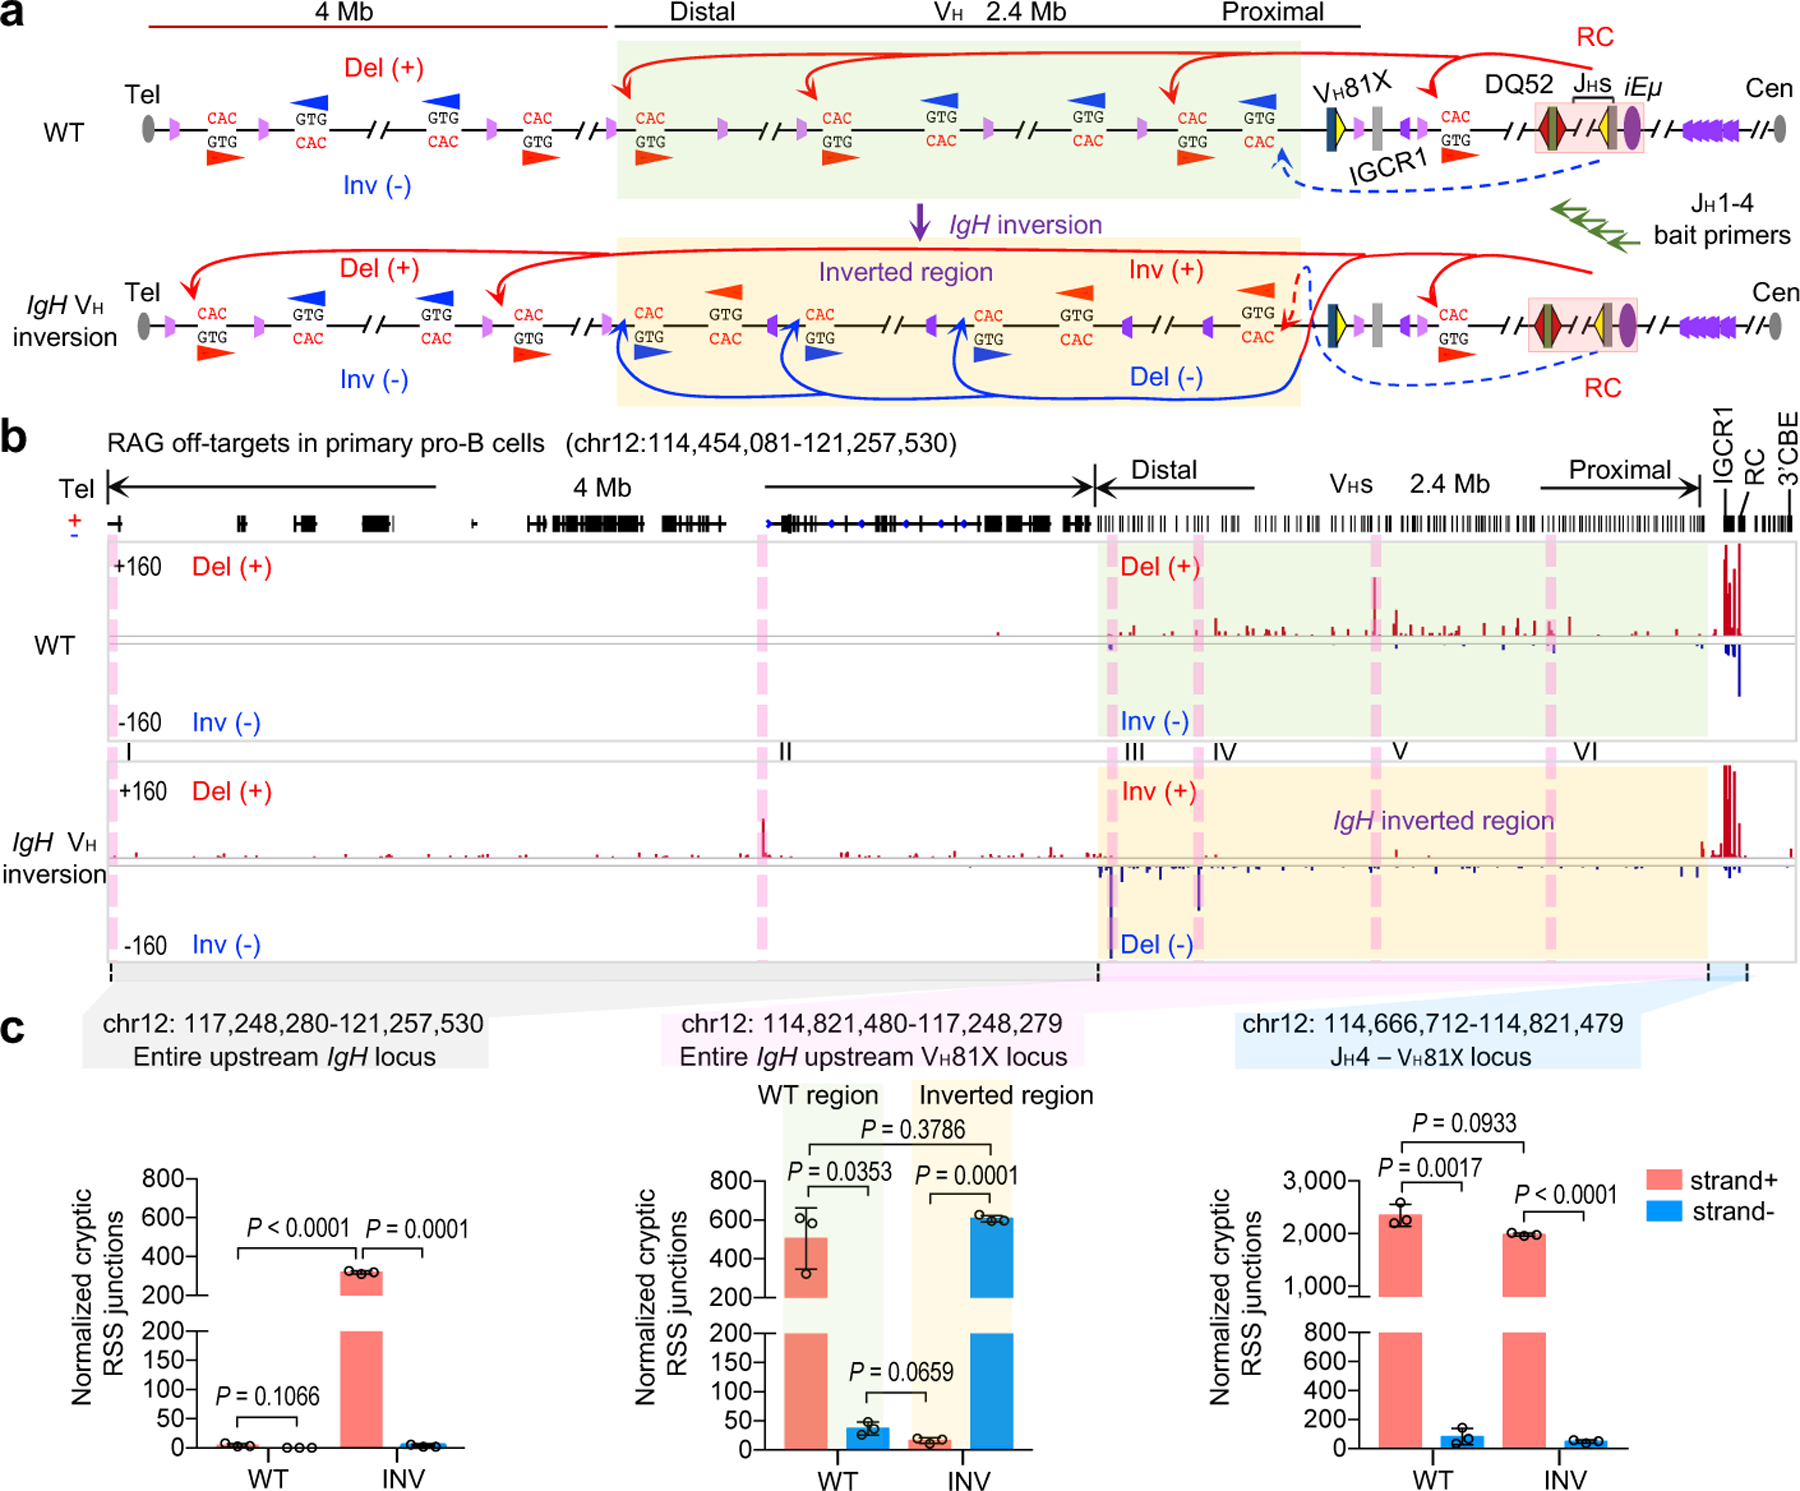
a, Illustration of possible joining outcomes between bona fide IgH locus RSSs from JH1–4 coding-end baits to cryptic RSSs mostly represented by CAC motifs in the upstream D, VHs and domains upstream of VHs to the telomere in WT (top) and IgH VH inversion (bottom) primary pro-B cells. Red and blue arches with arrows show possible deletional and inversional junctions, respectively, except for the IgH VH inverted region (red for inversional, blue for deletional). Green arrows indicate the position and orientation of HTGTS primers. Details as shown in Fig. 1a. b, RAG off-target junction profiles at IgH locus and upstream 4 Mb region in WT and IgH VH inversion primary pro-B cells. Junctions are displayed in a linear scale as stacked tracks. I-VI peaks indicated by pink lines are the RAG off-target examples plotted at single-base-pair resolution in Extended Data Fig. 2a. For comparison, RAG off-target junction profiles in the inverted region are shown in normal orientation (b, bottom). The IgH VH inverted region is highlighted in transparent green (a, b, WT) and transparent gold (a, b, IgH VH inversion), respectively. Del (+) indicates deletional junction. Inv (−) indicates inversional junction. c, Average frequencies ± s.d. of plus strand (red, +) and minus strand (blue, -) joining events within indicated regions in wide-type (WT, n=3) and IgH VH inversion (INV, n=3) primary pro-B cells. n, number of independent experiments. Indicated P values were calculated using unpaired two-tailed t-test. See Methods and related Extended Data Fig. 2 for more details.
To examine effects of the 2.4 Mb inversion on interactions of VH locus sequences with the RC, we performed high-resolution 3C-HTGTS5 with a RC bait in RAG1-deficient cultured primary pro-B cells with or without the inversion (Fig. 3a). RAG-deficient cells are used to prevent confounding V(D)J recombination events5. These studies revealed a series of robust RC interaction peaks across the VH locus (Fig. 3b, labeled 1–15), many of which, including those involving Pax5-activated intergenic repeat (PAIR) elements15 (Fig. 3b, purple lines with gray background), are hallmarks of VH locus contraction7. Notably, all major RC-VH locus interaction peaks were maintained within the inverted VH locus, despite the several Mb exchange in distance from the RC between proximal and distal portions of the locus (Fig. 3b, also labeled 1–15; Extended Data Fig. 3). Indeed, overall RC interactions within the different regions of the inverted locus were essentially mirror-image patterns of the normally-oriented locus (Fig. 3b; Extended Data Fig. 3). Cohesin and CTCF binding patterns determined by ChIP-seq and germline VH transcription patterns determined by GRO-seq across the different VH domains were maintained in detail in the inverted VH-locus, also largely as mirror images of those of the normal VH-locus (Extended Data Fig. 3,4). Notably, the majority of the major RC interaction peaks corresponded to peaks of sense/antisense VH locus transcription maintained in the inverted VH locus with orientation relative to the RC reversed (Fig. 3b; Extended Data Fig. 3). Thus, despite causing major alterations in VH-RSS and cryptic RSS utilization, the 2.4 Mb inversion did not appear to disrupt VH locus contraction, major looping factor binding patterns, and transcription per se, supporting the role of long-range RAG scanning in VH utilization.
Figure. 3 |. 3C-HTGTS interactions in normal and inverted IgH loci in cultured RAG1-deficient primary pro-B cells.
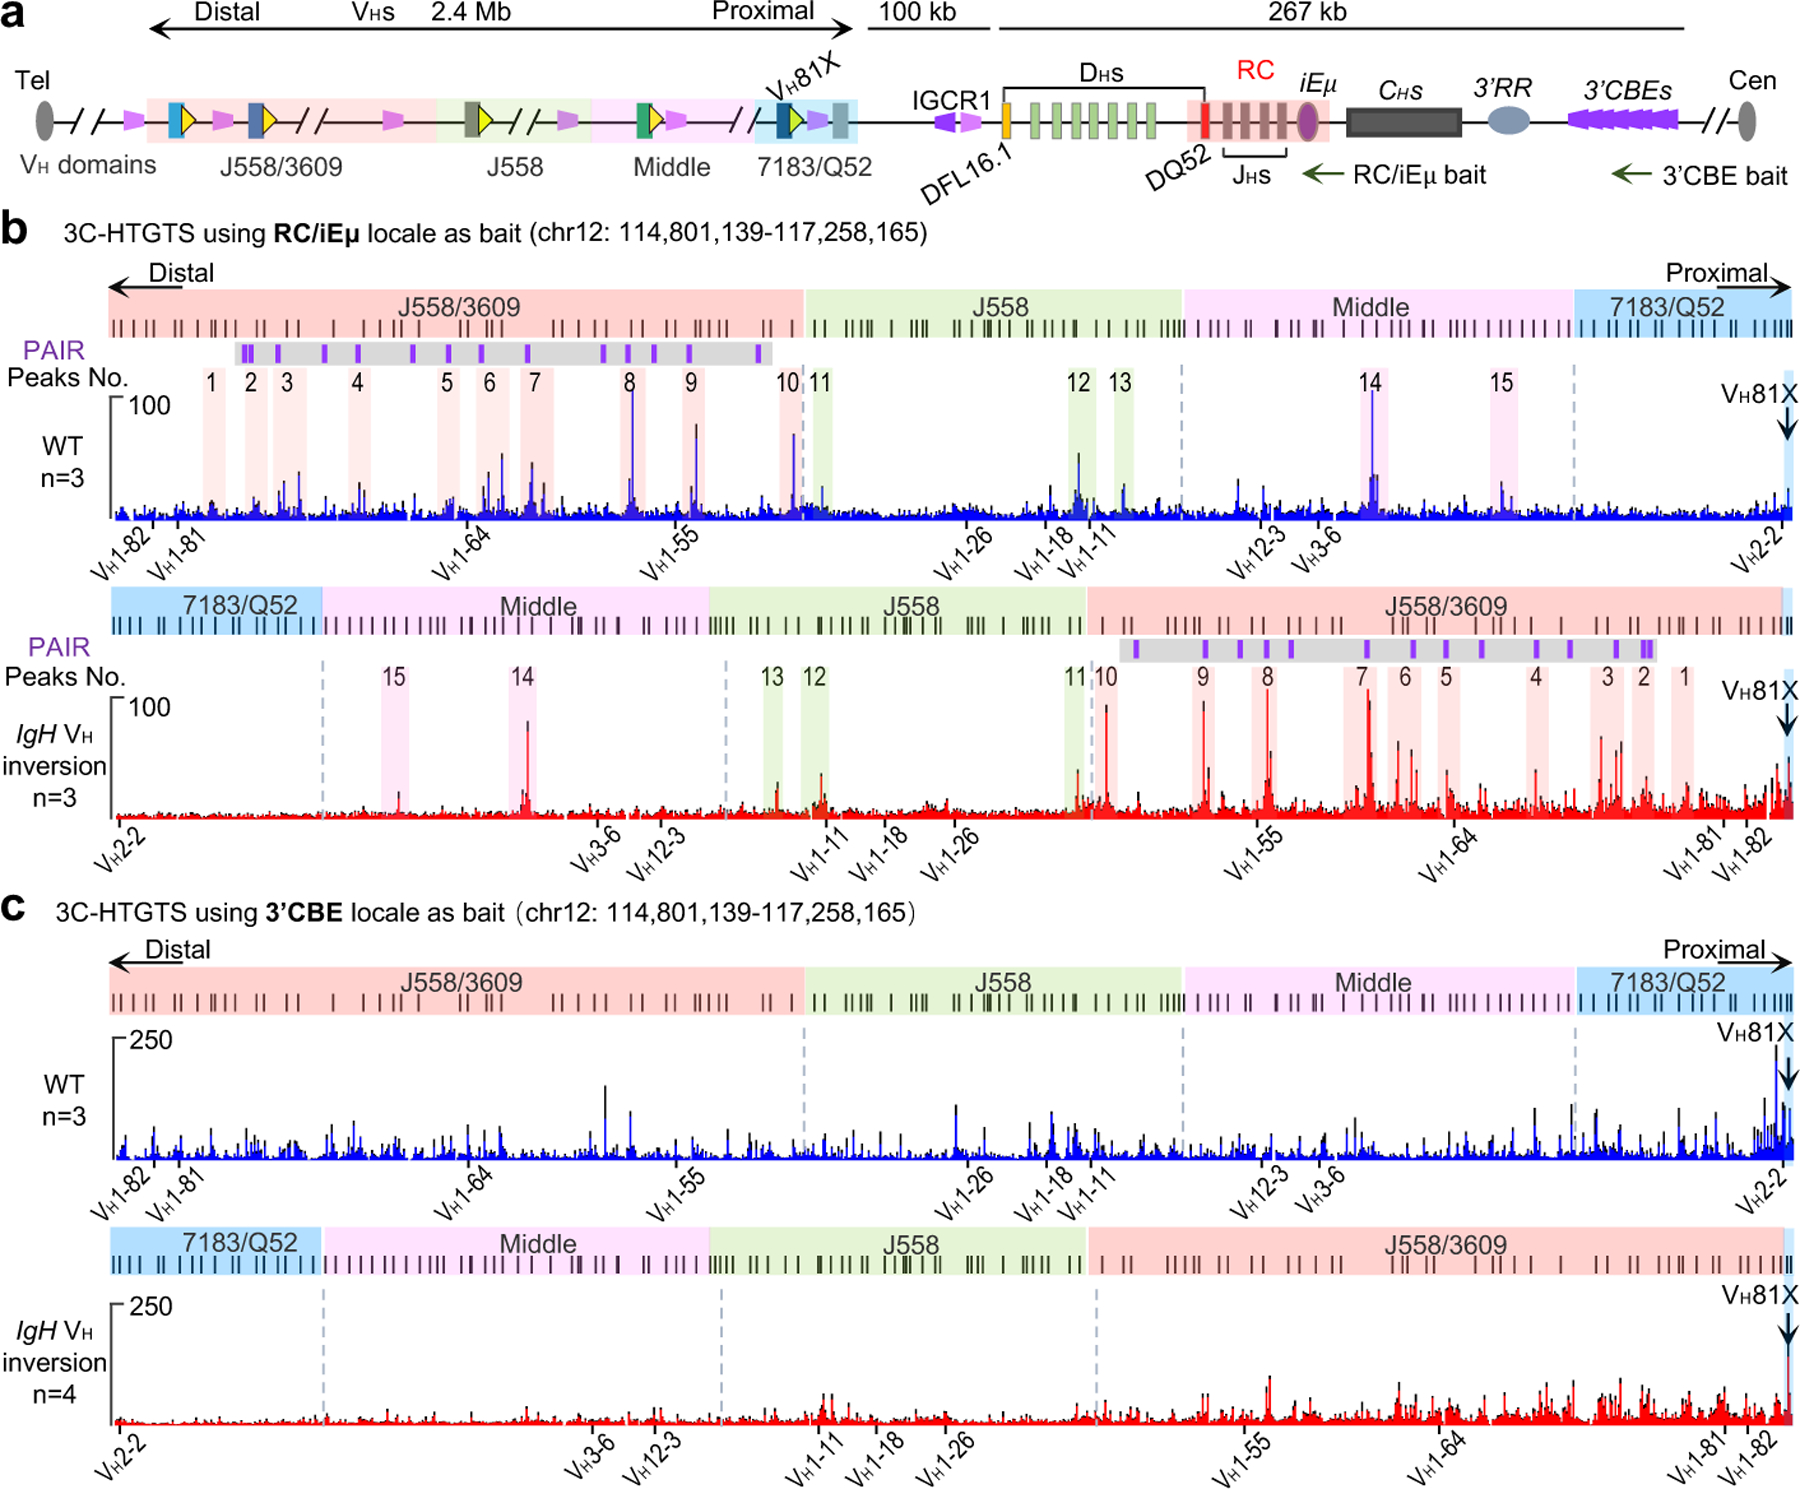
a, Diagram of the entire murine IgH locus with details as shown in Fig. 1a. The primer regions of RC/iEμ bait and 3’CBE bait used for 3C-HTGTS are shown. b, Average RC/iEμ baited 3C-HTGTS signal counts ± s.e.m. across the four VH domains in cultured WT (top) and IgH VH inversion (bottom) RAG1-deficient primary pro-B cells. 15 representative major interaction peaks/clusters are indicated with color shades and numbers. PAIR elements are indicated as purple lines with gray background. n indicates the number of biological repeats. c, Average 3’CBE baited 3C-HTGTS signal counts ± s.e.m. across the four VH domains in cultured WT (top) and IgH VH inversion (bottom) RAG1-deficient primary pro-B cells. n indicates the number of biological repeats. The WT and inverted VH locus/domains are diagrammed at the top of each panel (b, c). For comparison, the 3C-HTGTS results in the inverted region are shown in inverted orientation (b, bottom; c, bottom), and the highly utilized VHs in Fig. 1b are labeled at each panel (b, c). See Supplementary Data 1 for individual repeats of RC or 3’CBE interactions with entire IgH locus.
In contrast to our findings that, in v-Abl cells1,2,5 and primary pro-B cells (see above), the RC serves as a major downstream loop extrusion anchor for RAG scanning of upstream chromatin, CBE loop anchors are proposed to play this role in primary pro-B cells, including 10 consecutive CBEs downstream of the IgH locus (3’IgH CBEs) in convergent orientation with VH locus CBEs8,16. Based on 3C-HTGTS analyses, we confirmed that 3’IgH CBEs interact with convergent CBEs across the VH locus in primary pro-B cells (Fig. 3c, upper). Our VH locus inversion places most CBEs across the VH locus in the same orientation as 3’IgH CBEs. However, while 3’IgH CBE interaction levels with proximal VH domain CBEs were diminished when inverted in the distal position; 3’IgH CBE interaction levels with CBEs of the CBE-rich distal VH domain were mostly maintained or even increased (Fig. 3c, bottom). Based on this unanticipated finding, we directly addressed proposed critical functional roles of convergent VH locus CBE interactions with the 3’CBEs by testing effects of complete deletion of all ten 3’IgH CBEs and found no measurable influence of their deletion on utilization of VHs across the VH locus (Extended Data Fig. 5). While not ruling out unknown, redundant roles of convergent CBEs within IgH or further downstream upon 3’IgH CBE deletion17, these findings, coupled with those described in the preceding paragraph, support a major role of the RC as a dynamic downstream loop extrusion anchor for RAG VH-locus scanning in primary pro-B cells.
In normal primary pro-B cells, cryptic RSS utilization via RAG scanning from the DJH-RC-RSS did not extend beyond the IgH locus (Fig. 2b, top and 2c; Extended Data Fig. 2a, top, and 2b; Extended Data Fig. 5 legend and discussion). Strikingly, the VH locus inversion resulted in RC-based RAG scanning beyond the IgH locus, over distances of 4 Mb upstream through multiple convergent CBE-anchored loop domains to the telomere (Fig. 2b, bottom and 2c; Extended Data Fig. 2a, bottom, 2c). Consistent with linear scanning through these far upstream convergent CBE domains, only cryptic RSSs in convergent orientation with the DJH-RC-RSS were utilized (Fig. 2b, bottom and 2c; Extended Data Fig. 2a, bottom, 2c). Correspondingly, overall RC interactions within these upstream IgH locus domains were significantly increased upon the VH locus inversion (Extended Data Fig. 2d; Supplementary Data 1a, b). Activation of RAG scanning beyond the VH locus through multiple upstream convergent CBE-based domains in primary pro-B cells with inverted VH loci is a striking phenomenon that indicates primary pro-B cells neutralize VH locus-associated CBE-based impediments to loop-extrusion mediated scanning by mechanism that functions broadly within the genome and not just within VH locus.
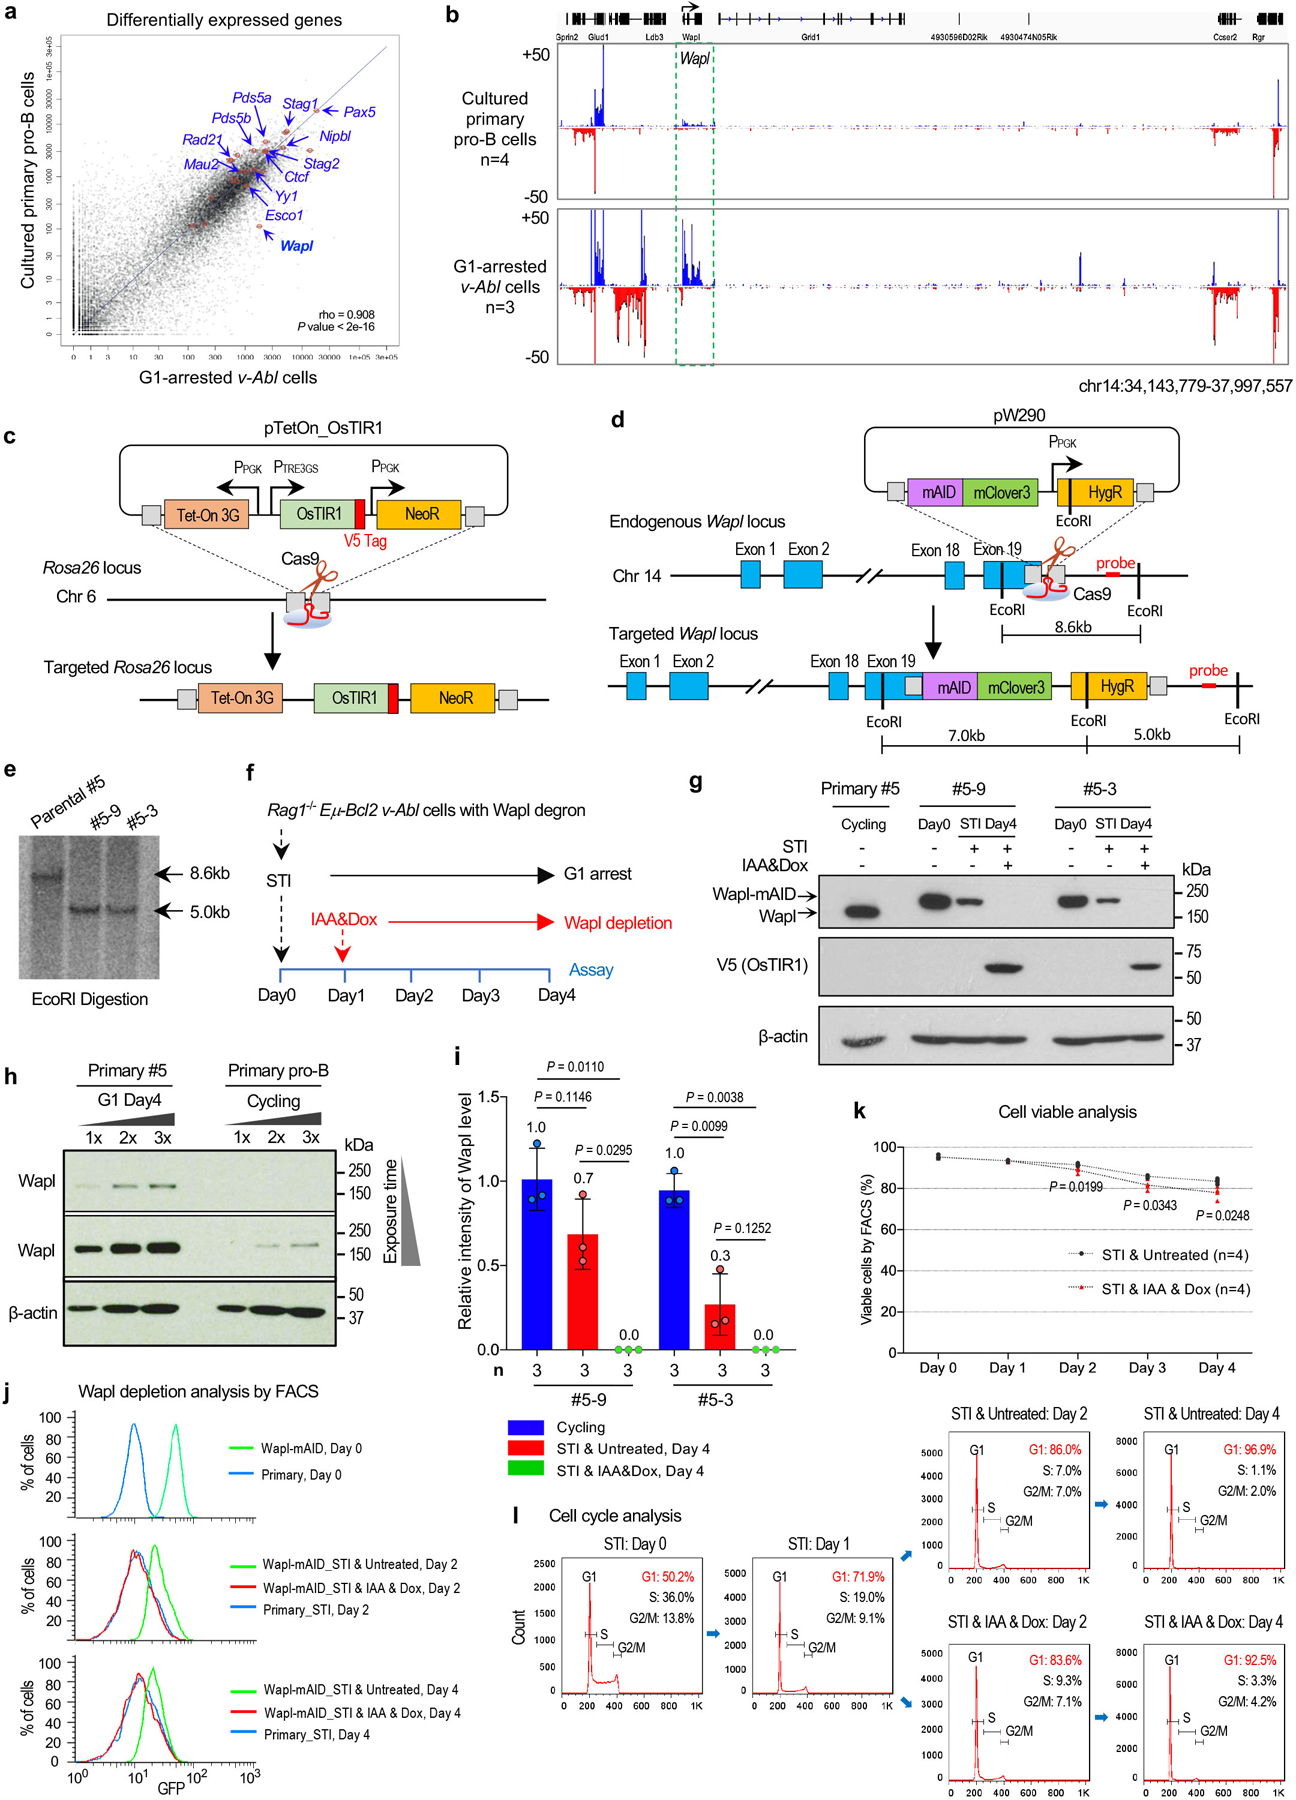
Very low-level IgH D-to-JH V(D)J recombination occurs in cycling v-Abl cells presumably as they pass through the G1 cell cycle stage in which RAG is activated18. However, when v-Abl cells are viably arrested in G1 by treatment with a v-Abl tyrosine kinase inhibitor (STI-571)19, they activate robust D-to-JH rearrangement; but essentially skip IgH locus contraction and VH-to-DJH rearrangement pro-B cell processes and move-on to the precursor (pre) B cell-specific process of robustly rearranging Vκs across the 3Mb Igκ light chain locus to Jκs20. Thus, to elucidate candidate factors for involvement in IgH locus contraction and distal VH rearrangement, we employed GRO-seq to compare transcriptional activity of genes encoding proteins potentially involved in long-range RAG scanning in primary pro-B cells versus G1-arrested v-Abl cells (Extended Data Fig. 6a). Notably, the Wings apart-like (Wapl) factor gene10 stood out as having very low transcription, relative to other cohesin-complex factor genes in primary pro-B cells versus v-Abl cells (Extended Data Fig. 6a, b; see legend to Extended Data Fig. 6). Western blotting revealed Wapl protein levels in cycling v-Abl cells were approximately 9-fold higher than those of cultured primary pro-B cells (Fig. 4a, b). Wapl unloads cohesin from chromosomes by transiently opening the cohesin ring21–23 and collaborates with transcription and CTCF-binding to position cohesin in genomes24,25. Relevant to VH locus contraction and RAG-scanning, Wapl-depletion extends CTCF-anchored loop sizes in association with increasing cohesin density26, by increasing probability of extending loop extrusion past CTCF-bound CBE loop anchors27,28. Thus, our findings potentially implicate Wapl down-regulation in mediating contraction and long-range RAG scanning of the IgH locus in primary pro-B cells. A study published while this paper was under review reached related conclusions regarding reduced pro-B cell Wapl expression due to Pax5 transcriptional repression16.
Figure. 4 |. Wapl depletion activates IgH VH locus contraction and long-range VH utilization in G1-arrested v-Abl cells.
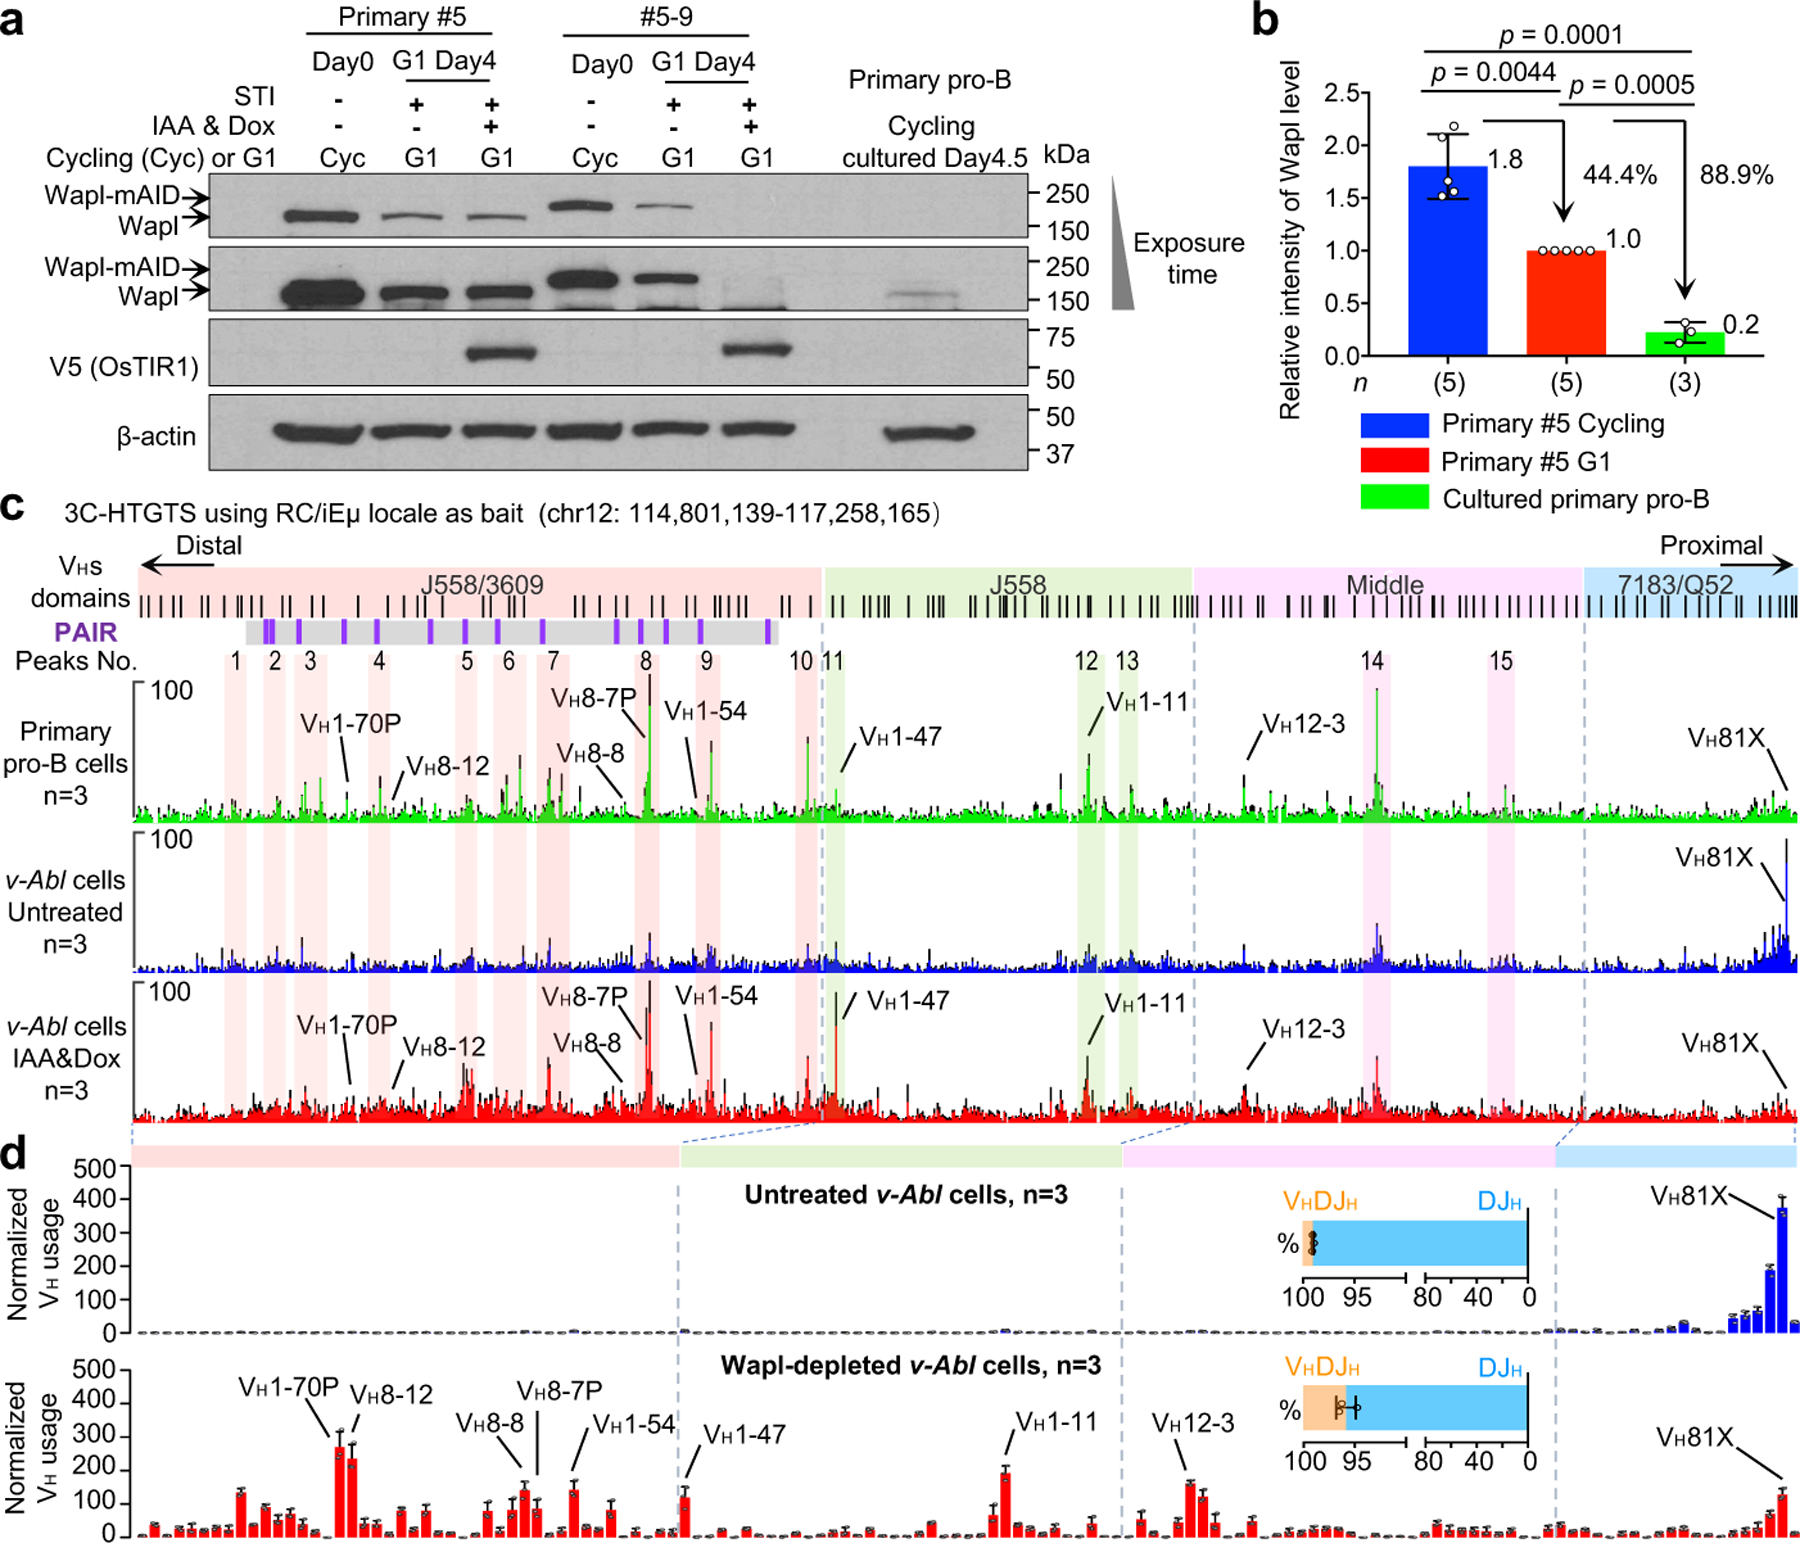
a, Western blotting to detect Wapl protein levels in the primary #5 cycling v-Abl cells and the derived Wapl-degron #5–9 v-Abl cells before (day0) and after STI&IAA&Dox treatment (day4) and cultured primary pro-B cells. One of the two experiments is shown. b, Western blotting results to determine relative expression of Wapl protein levels in cycling and G1 arrested primary #5 v-Abl cells and cultured primary pro-B cells. Average values ± s.d. of Wapl protein levels are shown. For comparison, the intensity of the Wapl band in G1-arrested primary #5 v-Abl cells is set as 1.0. Average value is indicated at each bar. n, number of independent repeats. Indicated P values were calculated using unpaired two-tailed t-test. c, Average 3C-HTGTS signal counts ± s.e.m. across the four VH domains in cultured RAG1-deficient primary pro-B cells (top), G1-arrested RAG1-deficient v-Abl cells without (middle) or with Wapl depletion (bottom). n, number of independent experiments. For comparison, 15 representative major interaction peaks/clusters are shown as in Fig. 3b. d, Average utilization frequencies ± s.d. of all VH segments in RAG1-complemented, G1-arrested Wapl-degron v-Abl cells without (Untreated) or with (IAA&Dox) Wapl depletion are indicated. Average percentage ± s.d. of VHDJH and DJH rearrangements are shown. n, number of independent experiments. See Supplementary Table 2 and Methods for more details.
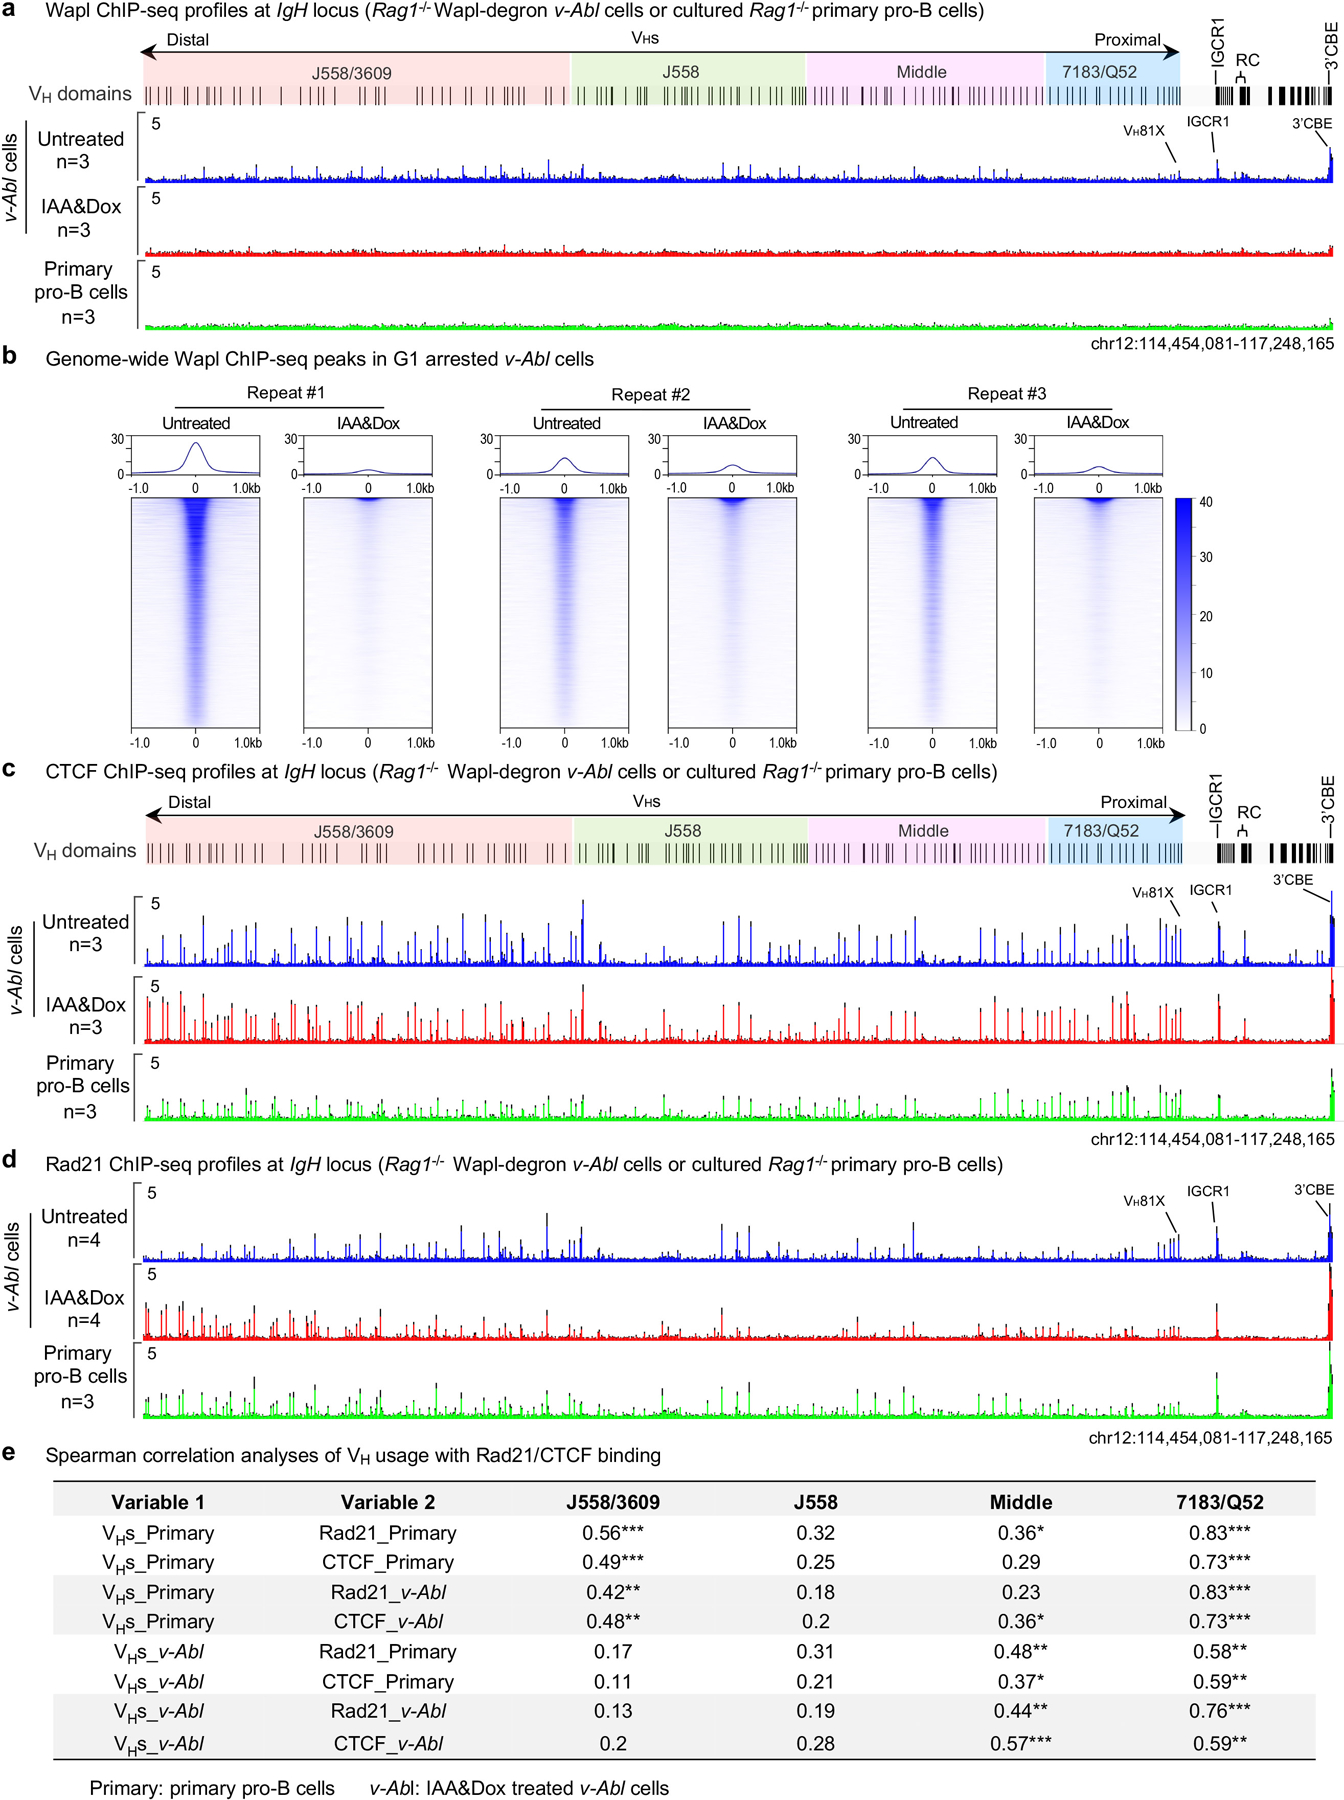
To directly test ability of Wapl to impede IgH locus contraction and VH-to-DJH rearrangement, we generated RAG1-deficient C57BL/6 v-Abl cells in which we could degrade Wapl via a mini auxin-inducible degron (mAID) approach2,29 (see methods). In these “Wapl-degron v-Abl cells”, addition of doxycycline (Dox) and auxin (Indole-3-acetic acid, IAA) triggers proteasome-dependent degradation of endogenous mAID-tagged Wapl. To deplete mAID-tagged Wapl in the G1 stage, we treated Wapl-degron v-Abl cells with IAA and Dox from day1 to day4 during the STI-571-induced four-day G1 arrest period (day0–4) (Extended Data Fig. 6f). Western blotting revealed that mAID-tagged Wapl levels were further reduced about 2~3-fold in G1 arrested versus cycling Wapl-degron v-Abl cells and substantially depleted upon IAA&Dox-treatment of the G1 arrested lines (Extended Data Fig. 6g, i). Depletion of chromatin-bound mAID-tagged Wapl across the IgH locus and the genome in G1-arrested Wapl-depleted v-Abl cells was confirmed by ChIP-seq (Extended Data Fig. 7a, b). While Wapl depletion is lethal to dividing cells30,31, Wapl-depleted v-Abl cells underwent normal STI-571-induced G1 arrest with modest effects on viability (Extended Data Fig. 6k, l).
Binding patterns of CTCF across VH domains, RC transcription, and genome-wide transcription patterns were mostly maintained in IAA&Dox-treated Wapl-degron v-Abl cells (Extended Data Fig. 7c; 8a, b). As expected24–26, Wapl depletion increased Rad21 redistribution to distal VH locus CBEs and 3’ IgH CBEs to yielding a pattern significantly similar to that of cultured primary pro-B cells (Extended Data Fig. 7d). 3C-HTGTS-based interaction experiments of untreated versus IAA&Dox-treated G1-arrested RAG1-deficient Wapl-degron v-Abl cells revealed low-level peaks of RC interactions in all but the proximal 7183/Q52 VH domain in untreated cells that were substantially increased upon Wapl depletion (Fig. 4c, middle and bottom). Indeed, the major interactions peaks across the J558/3609, J558, and Middle VH domains that were substantially increased in IAA&Dox-treated Wapl-degron v-Abl cells closely corresponded to dominant peaks observed in locus-contracted RAG1-deficient primary pro-B cells (Fig. 4c, upper, labeled 1–15). Together, these findings support a role for reduced Wapl expression in enhancing VH-locus contraction in primary pro-B cells, likely by increasing ability of cohesin-mediated loop extrusion to circumvent CTCF-bound CBE impediments.
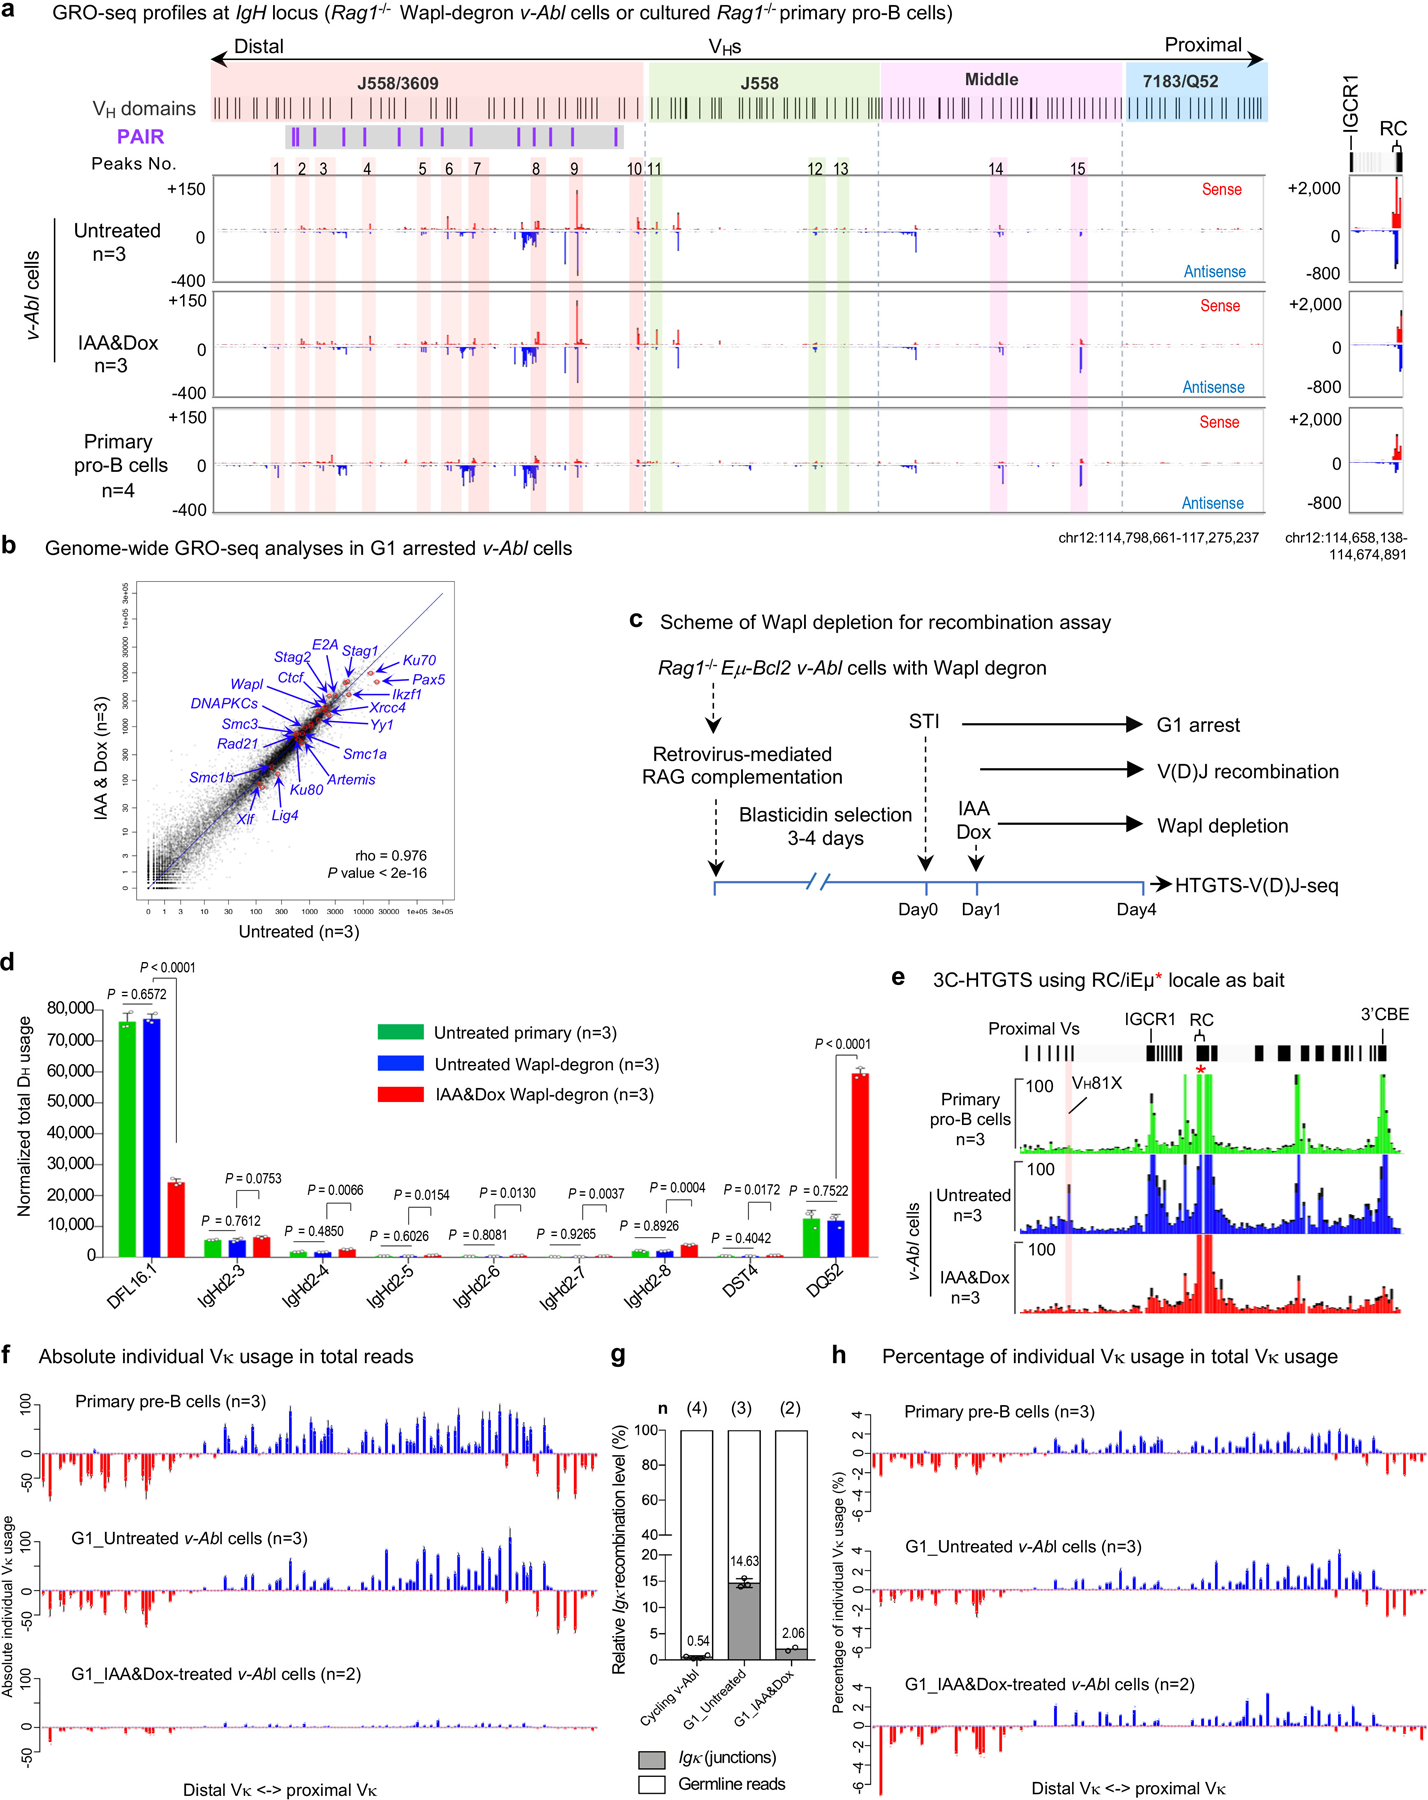
To test effects of Wapl-depletion on IgH V(D)J recombination, we introduced RAG into Wapl-degron v-Abl cells prior to G1 arrest (Extended Data Fig. 8c). Like standard v-Abl cells1,5, untreated RAG1-complemented Wapl degron v-Abl cells had robust D-to-JH rearrangement (Extended Data Fig. 8d; Supplementary Table 2), but little VH-to-DJH rearrangement (Fig. 4d, upper; Extended Data Fig. 9a, b). Wapl depletion markedly reduced distal DFL16.1 rearrangements, but promoted increased proximal DQ52 rearrangements (Extended Data Fig. 8d; Supplementary Table 2), a pattern observed in the context of IGCR1 CBE inactivation5,32 (Extended Data Fig. 8e, bottom). Strikingly, Wapl depletion promoted an approximately 4-fold overall increase VH-to-DJH recombination that, while about 12-fold lower than that of BM pro-B cells (Fig. 1b upper, 4d bottom; Extended Data Fig. 9c), was associated with significantly increased utilization of VHs across all four VH domains of the 2.4 Mb IgH locus. An exception was decreased utilization of the most proximal VHs relative to that of more distal VHs (Fig. 4d, bottom; Extended Data Fig. 9c; Supplementary Table 2, 5), consistent with diminished impediment activity of the proximal VH-CBEs (Extended Data Fig. 7d, middle; Extended Data Fig. 8e, bottom). Like primary pro-B cells, Wapl-depleted v-Abl cells utilized cryptic RSSs across the length of 2.4 Mb VH locus in convergent, but not in the same orientation, as the DJH-RC-RSS (Extended Data Fig. 9e). We also made the same 2.4 Mb inversion of VH locus in Wapl-degron v-Abl cells as in primary pro-B cells (see Methods for details). Strikingly, the v-Abl cell VH locus inversion had the same effects as found in primary pro-B cells on bona fide VH-RSS and cryptic RSS rearrangement, including extension of cryptic RSS rearrangements upstream of the VH locus to the telomere (Extended Data Fig. 9d–f; compare with Fig. 2b–c). Together, these results strongly support a role for reduced Wapl expression in facilitating locus contraction and orientation-specific RAG scanning of the VH locus.
The same G1-arrested v-Abl lines that require Wapl-depletion for robust IgH locus contraction and distal VH utilization, robustly utilize Vκs across the 3Mb Vκ locus (a hallmark of Vκ locus contraction20), with relative levels and patterns significantly similar to those of primary pre-B cells (Extended Data Fig. 8f). IAA&Dox-mediated Wapl depletion in these v-Abl cells reduced Vκ to Jκ rearrangement levels by about 7-fold compared to that of untreated v-Abl cells (Extended Data Fig. 8g), but did not substantially impact rearrangement patterns across the Vκ locus, with the most notable changes reflecting decreased proximal and increased very distal Vκ utilization, consistent with increased loop-extension mediated by further Wapl-depletion (Extended Data Fig. 8h). Together, the reduced Vκ and VH rearrangement levels in IAA&Dox-treated v-Abl cells suggest that complete Wapl depletion may negatively impact V(D)J recombination activity per se, perhaps by impacting RC or RAG activity. The finding of primary pre-B cell patterns of Vκ rearrangement across the 3 Mb Vκ locus in untreated v-Abl cells is striking, suggesting that VH and Vκ utilization across their respective loci, which are very differently organized8, may be regulated in different ways. As one possibility, G1 arrest of v-Abl cells reduces Wapl levels by 2–3 fold (Fig. 4b; Extended Data Fig. 6i), a reduction perhaps sufficient to promote contraction/scanning of the Vκ locus versus the VH locus due to the latter having a much greater CBE density8. Also, potential roles for other cohesin-complex factors are conceivable given that down-regulation or modification of CTCF can neutralize CBE impediment activity and allow robust IgH locus contraction and scanning in experimental v-Abl cell systems2.
We implicate Wapl down-regulation in primary pro-B cells as a major mechanism for partially neutralizing effects of CTCF-bound CBE impediments within the 2.4 Mb VH locus to allow RC-bound RAG scanning of VH locus chromatin propelled past it by cohesin-mediated loop extrusion. Correspondingly, VH utilization in primary pro-B cells is significantly correlated with cohesin-binding in distal J558/3609, Middle and proximal 7183/Q52 domains and approaches significance in the J558 domain (Extended Data Fig. 7e). However, in IAA&Dox-treated v-Abl cells correlations are not significant in distal VH domains, likely due to low overall V(D)J recombination levels and/or ectopic versus physiological RAG expression (Extended Data Fig. 7e and legend discussion). Consistent with findings of contemporaneous CTCF depletion studies in v-Abl lines2, analyses of various parameters for each individual VH in BM pro-B cells and Wapl-depleted v-Abl lines indicated that residual CBE activity and/or transcriptional mechanisms likely enhance utilization of many VHs along the scanning path provided by Wapl depletion; but rearrangement of other VHs, particularly in the middle domain, do not appear to employ either mechanism (Extended Data Fig. 3 and legend discussion; Supplementary Data 2, 3).
Nascent RCs formed in the absence of RAG serve as loop extrusion impediments that provide a “dynamic” downstream anchor for extrusion of upstream chromatin past the RC2,5. However, RAG binding to the nascent RC has been implicated in enhancing activity of extrusion impediments within upstream chromatin being scanned1. Thus, extrusion of upstream chromatin in pro-B cells that harbor nascent RCs, while impeded at major dynamic scanning impediments would likely proceed, on average, further upstream into the VH locus than in pro-B cells in which the RC is RAG-bound1. Further, in pro-B cells with nascent RCs, loop extrusion could generate a population of individual pro-B cells in which upstream chromatin extrusion progresses to various distances past the nascent RC in individual cells, allowing subsequent RAG-binding to be initiated at various points across the VH locus to yield more normalized access to a RAG-bound RC via scanning (see Extended Data Fig.10 for model and legend for other implications). Finally, while we implicate linear RAG scanning as a dominant RC access mechanism for VHs across the locus, given that all VHs RSSs are in convergent orientation to the DJH-RC-RSS, diffusion of those brought into very close proximity at scanning impediments could contribute1,3.
METHODS
Experimental procedures
No statistical methods were used to predetermine sample size. Experiments were not randomized, and investigators were not blinded to allocation during experiments and outcome assessment.
Mice
Wild-type (WT) C57BL/6 and 129SV mice were purchased from Charles River Laboratories International. RAG1-deficient (Rag1−/−) mice (stock No.002216: B6.129S7-Rag1tm1Mom/J) in C57BL/6 background were purchased from the Jackson Laboratory and maintained in the lab. All animal experiments were performed under protocols approved by the Institutional Animal Care and Use Committee of Boston Children’s Hospital. Animals were maintained on a 14-h light,10-h dark schedule in a temperature-controlled environment, with food and water provided ad libitum.
Generation and characterization of IgH VH locus inversion mouse model
The CRISPR/Cas9-mediated entire IgH VH locus inversion upstream VH81X modifications were carried out on the C57BL/6 IgH allele in EF1 ES cell line, which was derived from a F1 hybrid mouse (129/SV:C57BL/6). The ES targeting was performed as previously described33. sgRNAs targeting the upstream of VH1–86P (Cut1) and upstream of VH81-X (downstream of VH2–2) (Cut2) were cloned by annealing pairs of oligos into pX459 with a puromycin selection marker (Addgene, #62988) following the standard protocol. For transfection, Cas9/sgRNAs (Cut1 and Cut2, each 2.5 µg) were nucleofected via Lonza 4D Nucleofector into 2.5×10⁶ EF1 cells. The electroporated ES cells were grown on a monolayer of MEF cells with puromycin resistance (Stemcell, #00325) for 1 day. Then the ES cells were selected with 2 µg/ml puromycin (Gibco, #A1113802) for another day. After selection, the ES cells were cultured with normal medium for 5–6 days, colonies were picked into 24 well plates that had been coated with MEFs. After 3 days, half of the colonies were frozen at −80°C and the other half were expanded for DNA isolation. Genomic DNA was analyzed with screening-PCR to identify clones in which the desired genetic modifications had taken place. After the primary screen, the potential positive clones with 2.4 Mb VH locus inversion were amplified by PCR and sequenced. The IgH VH inversion modifications were confirmed on the C57BL/6 IgH allele by single nucleotide polymorphisms (SNPs), each positive clone was further validated with a normal karyotype by metaphase analysis. All the cell lines were confirmed to be mycoplasma free. The ES clone with the IgH VH inversion was injected into RAG2-deficient blastocysts to generate chimeras34. The chimeric mice were bred with C57BL/6 mice for germline transmission of the targeted mutations. Heterozygous IgH VH inversion mice were bred to homozygosity. For further analysis, the IgH VH inversion mouse model was bred to RAG1-deficient homozygosity in C57BL/6 background. Sequences of all sgRNAs and oligos used are listed in Supplementary Table 6.
Generation of 3’IgH CBEs knockout mouse model
The ten 3’IgH CBEs deletion targeting was carried out in the TC1 ES cell line, which was derived from a 129/SV mouse. The 3’CBE locus was targeted with LoxP sites and deleted by Adeno-Cre (Extended Data Fig. 5b). The positive 3’CBEs-deleted ES cell clones were confirmed by PCR amplification (Extended Data Fig. 5c). All of the detailed methods of this type of ES targeting were performed as previously described33. The ES clones with the homozygous 3’CBEs deletion were injected into RAG2-deficient blastocysts to generate chimeras34. PCR primers are listed in Supplementary Table 6.
Bone marrow pro-B cells purification
For RAG on-target and off-target analysis, single cell suspensions were derived from bone marrows of 4–6-week-old C57BL/6 WT and IgH VH inversion mice and incubated in Red Blood Cell Lysing Buffer (Sigma-Aldrich, #R7757) to deplete the erythrocytes. B220+CD43hi+IgM- pro-B cells were isolated by staining with anti-B220-APC (eBioscience, #17–0452-83), anti-CD43-PE (BD PharMingen, #553271), and anti-IgM-FITC (eBioscience, #11–5790-81) antibodies and purified by fluorescence-activated cell sorting (FACS), the purified primary pro-B cells were subjected to HTGTS-V(D)J-seq as described13,14.
For 3C-HTGTS, ChIP-seq and GRO-seq, B220-positive WT and IgH VH inversion primary pro-B cells were separately purified via anti-B220 MicroBeads (Miltenyi, #130–049-501) from individual 4–6-week-old RAG1-deficient mice (WT and IgH VH locus inversion) and were cultured in opti-MEM medium containing 10% (v/v) FBS plus IL-7 and SCF for 4–5 days as previously described35. Purified primary pro-B cells from different mice were separately cultured in different Petri dishes. Each sample was double-checked and confirmed by PCR prior to various assays as described below. PCR primers are listed in Supplementary Table 6.
Generation of doxycycline inducible Wapl-degron v-Abl cell lines
The targeting plasmid (pTet-On_OsTIR1_V5) for introducing the doxycycline inducible OsTIR1-V5 expression cassette into endogenous Rosa26 locus was constructed by modifying a published pEN113 plasmid (Plasmid #86233, Addgene). The donor plasmid (pW290) used to target the endogenous mouse Wapl locus was constructed by modifying a published pMK290 plasmid (Plasmid #72828, Addgene). Briefly, the doxycycline inducible Tet-On-3G_hPGK promoter sequence was PCR amplified from the plasmid pMK243 (Addgene, #72835) with 5’ SalI and 3’ MluI digestion sites. Then the pTet-On_OsTIR1_V5 targeting vector was generated by cutting out the enhancer and promoter sequence of OsTIR1_V5 expression cassette from the pEN113 plasmid via SalI and MluI digestion, and replacing the amplified Tet-On-3G_hPGK promoter sequence into pEN113 vector via the same restriction sites (Extended Data Fig.6c). To construct donor pW290 vector, 5’ and 3’ homology arms (247 bp each) flanking the BamHI sequence were synthesized via gBlocks by IDT (Integrated DNA Technologies) and cloned into pGEM-T easy vector (Promega, #A1360) to generate the pGEM-Wapl plasmid. The mAID-mClover cassette containing a hygromycin selection marker was excised from pMK290 by BamHI and cloned at the BamHI site of the pGEM-Wapl plasmid, between the homology arms, to generate the pW290 vector (Extended Data Fig. 6d). To modify the mouse Rosa26 and Wapl gene, sgRNAs targeting the endogenous Rosa26 locus or 3’ end sequence of the Wapl gene were cloned by annealing pairs of oligos into pX330 (Addgene, #42230) to construct the pX330_Rosa26 and pX330_Wapl-mAID, respectively.
The RAG1-deficient; Eμ-Bcl2+ v-Abl cells were co-transfected with pTet-On_OsTIR1_V5 and pX330_Rosa26 via Lonza 4D Nucleofector as shown before3,5, selected with 0.4 mg/ml of G418 for 5–6 days, and subcloned by dilution. Candidate clones with desired gene modifications were screened by PCR. The expression of OsTIR1 in primary v-Abl clone #5 was confirmed by western blotting (Extended Data Fig. 6g). Similarly, the resultant clones were further co-transfected with donor pW290 with corresponding Cas9/sgRNA pX330_Wapl-mAID via nucleofection, selected with 800 μg/ml hygromycin B (Millipore Sigma, #10843555001) for 3 days, and subcloned by dilution. Candidate clones with desired gene modifications were screened by PCR and confirmed by southern blot in Extended Data Fig. 6d–e, and the expression of mAID-tagged Wapl protein in Wapl-degron v-Abl clone #5–3 and #5–9 was confirmed by western blotting and FACS as outlined in Extended Data Fig. 6g, j. The resulting lines were referred to as the Wapl-degron v-Abl lines and used in this study. Sequences of all sgRNAs and oligos used are listed in Supplementary Table 6.
Generation of 2.4 Mb IgH VH inversion Wapl-degron v-Abl cell lines
To generate the 2.4 Mb IgH VH inversion Wapl-degron v-Abl cell lines without corresponding WT IgH VH region, two sgRNAs were firstly designed to target the upstream of VH1–86P (Cut1) and downstream of 3’CBE (Cut3) respectively to delete the entire IgH locus and generate the Wapl-degron v-Abl cells harboring only one IgH allele. The resultant single IgH clones were further targeted by another two sgRNA (Cut2 and Cut4) to generated the Wapl-degron v-Abl cells with entire IgH VH locus inversion upstream VH81X. Candidate clones with desired gene modifications were screened by PCR and confirmed by Sanger sequencing. Sequences of all sgRNAs and oligos used are listed in Supplementary Table 6.
Treatment of Wapl-degron v-Abl cells with IAA&Dox
Wapl-degron v-Abl cells were first treated by 3 μM STI-571 (STI) for 1 day to induce G1 arrest, then apart from STI, cells were also treated with 150 μM Indole-3-acetic acid (auxin analog, IAA, Sigma-Aldrich, #I3750–25G-A) and 2 mg/mL doxycycline (Dox, Sigma-Aldrich, #D3447) from day1 to day4 to specifically deplete mAID-tagged Wapl protein in G1 arrested v-Abl cells (Extended Data Fig. 6f). All the chemicals were dissolved in DMSO to prepare the stock. DMSO solvent was applied as the mock to untreated cells. Both untreated and IAA&Dox-treated cells were then collected and examined by FACS for protein depletion confirmation (Extended Data Fig. 6j) prior to various assays as described below.
Western Blotting
Western blotting samples were prepared with short-term cultured RAG1-deficient primary pro-B cells, cycling RAG1-deficient v-Abl cells, and G1-arrested RAG1-deficient v-Abl cells with or without Wapl depletion. Western blotting experiments were performed according to published protocol with a few modifications36. 10 million cells were harvested and lysed. Indicated antibodies (anti-Wapl, Thermo Fisher Scientific, #PA5–38024, 1:500; anti-V5-tag, #R960–25, 1:1000; anti-β-actin, Cell Signaling Technology, #3700, 1:3000) were used for the related western blotting experiments. For quantification and comparison of Wapl protein levels, the integrated density of Wapl and β-actin western blotting bands were calculated by Image J (version 1.42q) (Fig. 4b; Extended Data Fig. 6i). See Supplementary Figure 1 for uncropped scan blots with individual repeats.
Cell viability assays
For time-course cell viability assays, Wapl-degron v-Abl cells were treated with IAA&Dox from day1 to day4 during the STI-571 induced four-day G1 arrest experimental period. The viability of Wapl-degron v-Abl cells with or without Wapl depletion at different time points was determined by the percentage of viable lymphocyte in the population gated by FACS side (SSC) and forward (FSC) scatters out of the total cells.
GFP quantification and cell cycle stage analysis
For GFP (Clover) signaling quantification of Wapl depletion, both the untreated and IAA&Dox-treated Wapl-degron v-Abl cells at different time points were directly collected and examined by FACS. Primary v-Abl line #5 was processed as a GFP negative control.
For cell cycle analysis, Wapl-degron v-Abl cells without or with Wapl depletion at different time points were washed with ice-cold PBS and fixed in ethanol. The fixed cells were incubated with propidium iodide (PI) and RNase, and further analyzed by FACS.
RAG complementation
The Rag1-expressing vector pMSCV-RAG1-IRES-Bsr and Rag2-expressing vector pMSCV-FLAG-RAG2-GFP were kindly provided by Yu Zhang and Xuefei Zhang. RAG was reconstituted in RAG1-deficient v-Abl cells via retroviral infection of cells with the pMSCV-RAG1-IRES-Bsr and pMSCV-FLAG-RAG2-GFP vectors followed by 3–4 days of Blasticidin (ThermoFisher, #R21001) selection to enrich for cells with virus integration.
HTGTS-V(D)J-seq
For IgH V(D)J recombination analyses, primary pro-B cells from WT and IgH VH locus inversion mice and RAG1-complemented, RAG1-deficient Wapl-degron v-Abl cells via the approach described above. For Igκ rearrangement analysis (Extended Data Fig. 8f–h), primary pre-B cells are from 129SV background mice, there is no difference in the Igκ locus between C57BL/6 and 129SV backgrounds. HTGTS-V(D)J-seq libraries were prepared as previously described1,5,13,14. Briefly, 1 μg of gDNA from sorted primary pro-B cells or 8 μg of gDNA from G1-arrested RAG1-complemented Wapl-degron v-Abl cells was sonicated and subjected to LAM-PCR using biotinylated JH1–4 bait primers. Single-stranded LAM-PCR products were purified using Dynabeads MyONE C1 streptavidin beads (ThermoFisher, #65002) and ligated to bridge adaptors. Adaptor-ligated products were amplified by nested PCR with indexed JH1–4 primers and the primer annealed to the adaptor. HTGTS-V(D)J-seq libraries for mature splenic B cells (JH4 primer) or primary pre-B cells (Jκ5 primer) were processed with the same procedure. The PCR products were further tagged with Illumina sequencing adaptor sequences, size-selected via gel extraction and loaded onto an Illumina NextSeq550 using paired-end 150-bp sequencing kit. Primer sequences are listed in Supplementary Table 6.
HTGTS-V(D)J-seq data processing and analyses
HTGTS-V(D)J-seq libraries were processed via the pipeline described previously14. The data were aligned to mm9 genome and analyzed with all duplicate junctions included in the analyses as previously described14. In the IgH repertoire libraries generated from C57BL/6 WT primary pro-B cells with JH1–4 coding end baits13,37, we detected in VHDJH exons 109 functional VHs, as well as 23 pseudo VHs (Supplementary Table 1) (average rearrangement >1). For comparisons, utilization data of VH and D segments in each library of WT or IgH VH inverted primary pro-B cells was normalized to 118,475 total recovered junctions (Fig. 1b; Supplementary Table 1). Utilization data of VH and D segments in each library of G1-arrested Wapl-degron v-Abl lines was normalized to 100,000 total recovered junctions (Fig. 4d; Extended Data Fig. 8d, 9a–d; Supplementary Table 2, 5). To show the absolute Vκ usage and relative Igκ recombination level, each HTGTS library was normalized to 20,000 total reads (Igκ junctions + germline reads) (Extended Data Fig. 8f–g); to show the percentage of individual Vκ usage pattern across the Igκ locus, each HTGTS library was normalized to 20,000 total Junctions (Vκ usage) (Extended Data Fig. 8h). Utilization data of VH segments in each library of WT primary pro-B cells (129SV background) were normalized to 10,000 total recovered junctions; non-productive VH segments in each library of WT and 3’CBE-knockout splenic B cells (129SV background) were normalized to 10,000 non-productive recovered junctions (Extended Data Fig. 5d–f; Supplementary Table 3). For the RAG off-targets in WT or IgH VH inverted primary pro-B cells, each library was isolated from independent JH1–4-baited library and was normalized to 402,241 isolated junctions (Fig. 2b; Extended Data Fig. 2). For comparison of RAG off-targets in primary pro-B cells, each of the biological independent library was normalized to 2,979 off-target junctions in the indicated region (chr12:114,666,712–121,257,530) for statistical analysis (Fig. 2c). For the RAG off-targets in Wapl-degron v-Abl cells and derived IgH VH inverted lines, each library was pooled from 3 independent JH1–4-baited libraries and was normalized to 432,676 isolated junctions without repetitive sequences (Extended Data Fig. 9e). For comparison of RAG off-targets in Wapl-degron v-Abl cells, each library was normalized to 2,332 off-target junctions in the indicated region (chr12:114,666,712–121,257,530) for statistical analysis (Fig. 9f). Junctions are denoted as in ‘‘+’’ orientation if prey sequence reads in centromere-to-telomere direction and in ‘‘-’’ orientation if prey sequence reads in telomere-to-centromere direction (Fig. 2; Extended Data Fig. 2, 9e–f).
ChIP-Seq library preparation and analyses
ChIP-seq libraries were prepared with short-term cultured RAG1-deficient primary pro-B cells or G1-arrested RAG1-deficient v-Abl cells and performed based on previously described procedures with a few modifications2. RAD21 antibody (Abcam, #ab992, 1:300), CTCF antibody (Millipore, #07–729, 1:150) and Wapl antibody (Thermo Fisher Scientific, #PA5–38024, 1:300) were used for the related ChIP-seq experiments. For comparison of all the ChIP-seq results in this study, we used bowtie2 to align ChIP-seq reads to mm9 genome and run MACS2 callpeak with parameters ‘ -t IP.bam -c input.bam –nomodel –keep-dup all -extsize 51 -nolambda -B -SPMR -g mm -broad’ to generate bigwig graphs normalized to 10 million reads.
GRO-seq and data analyses
GRO-seq libraries were prepared as described previously1,17 on short-term cultured RAG1-deficient primary pro-B cells and G1-arrested RAG1-deficient Wapl-degron v-Abl cells. To visualize the genome-wide RNA expression level, we run htseq-count to count read number on each gene and made scatter plot after down-sampling each sample to 10 million reads mappable to any genes. For comparison of GRO-seq results between WT and IgH inversion cultured primary pro-B cells, GRO-seq profiles were inverted in the IgH inversion primary pro-B cells (Extended Data Fig. 4c, bottom).
3C-HTGTS and data analyses
3C-HTGTS was performed as previously described5 on short-term cultured RAG1-deficient primary pro-B cells and G1-arrested Wapl-degron v-Abl cells. For comparison, sequencing reads of all the 3C-HTGTS libraries were aligned to mm9 genome and processed as previously described5. Data were plotted for comparison after normalizing junction from each experimental 3C-HTGTS library by random selection to the total number of genome-wide or entire IgH locus (± 10 kb, chr12:114,444,081–117,258,165) junctions recovered from the smallest library in the set of libraries being compared. Chromosomal interaction patterns were very comparable before and after normalization. For short-term cultured RAG1-deficient primary pro-B cells, both 3C-HTGTS libraries using iEμ (Fig. 3b) and 3’CBE (Fig. 3c) as baits were normalized to 885,651 total junctions of genome-wide, respectively. For comparison of iEμ-baited interactions between WT and IgH inversion primary pro-B cells in the inverted orientation, 3C-HTGTS results were inverted in the IgH inversion primary pro-B cells (Fig. 3b and 3c, bottom). For comparison of 3C-HTGTS libraries between short-term cultured RAG1-deficient primary pro-B cells and G1-arrested Wapl-degron v-Abl cells, we down-sampled each library to 43,658 junctions and removed the reads in the regions closely near to the iEμ bait (chr12:114,664,385–114,668,233), which did not contribute to the locus interaction, and presented them in the plots (Fig. 4c and Extended Data Fig. 8e, Supplementary Data 1g). The sequences of primers used for generating 3C-HTGTS libraries are listed in Supplementary Table 6.
Quantification and statistical analysis
Graphs were generated using GraphPad Prism 7.0 and R 3.6.3. Genomic heatmaps of ChIP-seq signals were generated using deeptools 3.3.2 (Extended Data Fig. 7b). After normalization in each sample, GRO-seq, 3C-HTGTS and ChIP–seq signals of multiple repeats were merged as average ± s.e.m. of the maximum value in each repeat in each bin, after dividing the plotting region into 1000 bins (Fig. 3b–c, 4c; Extended Data Fig. 3, 4, 6b, 7a, 7c–d, 8a and 8e). Unpaired two-tailed t-test was used to determine the statistical significance of difference in signal count (Fig. 2c; Extended Data Fig. 2d, 8d and 9f) or western band intensity (Fig. 4b; Extended Data Fig. 6i) between two experimental groups. Spearman’s rank correlation was calculated to determine the similarity in transcriptome-wide GRO-seq counts (Extended Data Fig. 6a and 8b), or the similarity in signal count across Vs (Extended Data Fig. 7d–e and 8f), after calculating the average among repeats. When comparing VH usage, Rad21 and CTCF ChIP-seq signals, we counted the ChIP-seq reads within 5 kb of the RSS of each VH (Extended Data Fig. 7d–e). Spearman’s correlation coefficient (rho) and P values that were determined by the two-sided Spearman’s correlation test between indicated samples are presented in the relevant figure legends. P values are calculated and shown in the relevant figures and Supplementary Tables as follows: *P ≤ 0.05, **P ≤ 0.01 and ***P ≤ 0.001.
Extended Data
Extended Data Figure. 1 |. Generation and characterization of IgH VH locus inversion mouse model.
a, Schematic diagram showing CRISPR-Cas9-mediated entire IgH VH locus inversion upstream VH81X in embryonic stem cells (ES cells) on the IgH allele in C57BL/6 genetic background. Cut1 and Cut2 showing the location of 2 sgRNAs. Details as shown in Fig. 1a. b, Confirmation of the upstream and downstream inversion junctions by Sanger sequencing. The sgRNA-targeting sequence is underlined, and the PAM sequence is labelled in red. sgRNAs and oligos used are listed in Supplementary Table 6. c, Schematic showing the generation of IgH VH locus inversion mouse model and further assays for phenotype and mechanism analyses. d, e, Representative flow cytometry analysis of IgM- bone marrow (BM) B cell populations in 4~6-week-old WT (d) and IgH VH locus inversion (e) mice. B220+IgM- B cells were gated and shown in the left plot (d, e). The black arrow lines indicate the gating strategies. B220+CD43+ pro-B and B220+CD43- pre-B cell populations are indicated in the right plot (d, e).
Extended Data Figure. 2 |. RAG utilization of cryptic RSSs across normal and inverted IgH loci in primary pro-B cells.
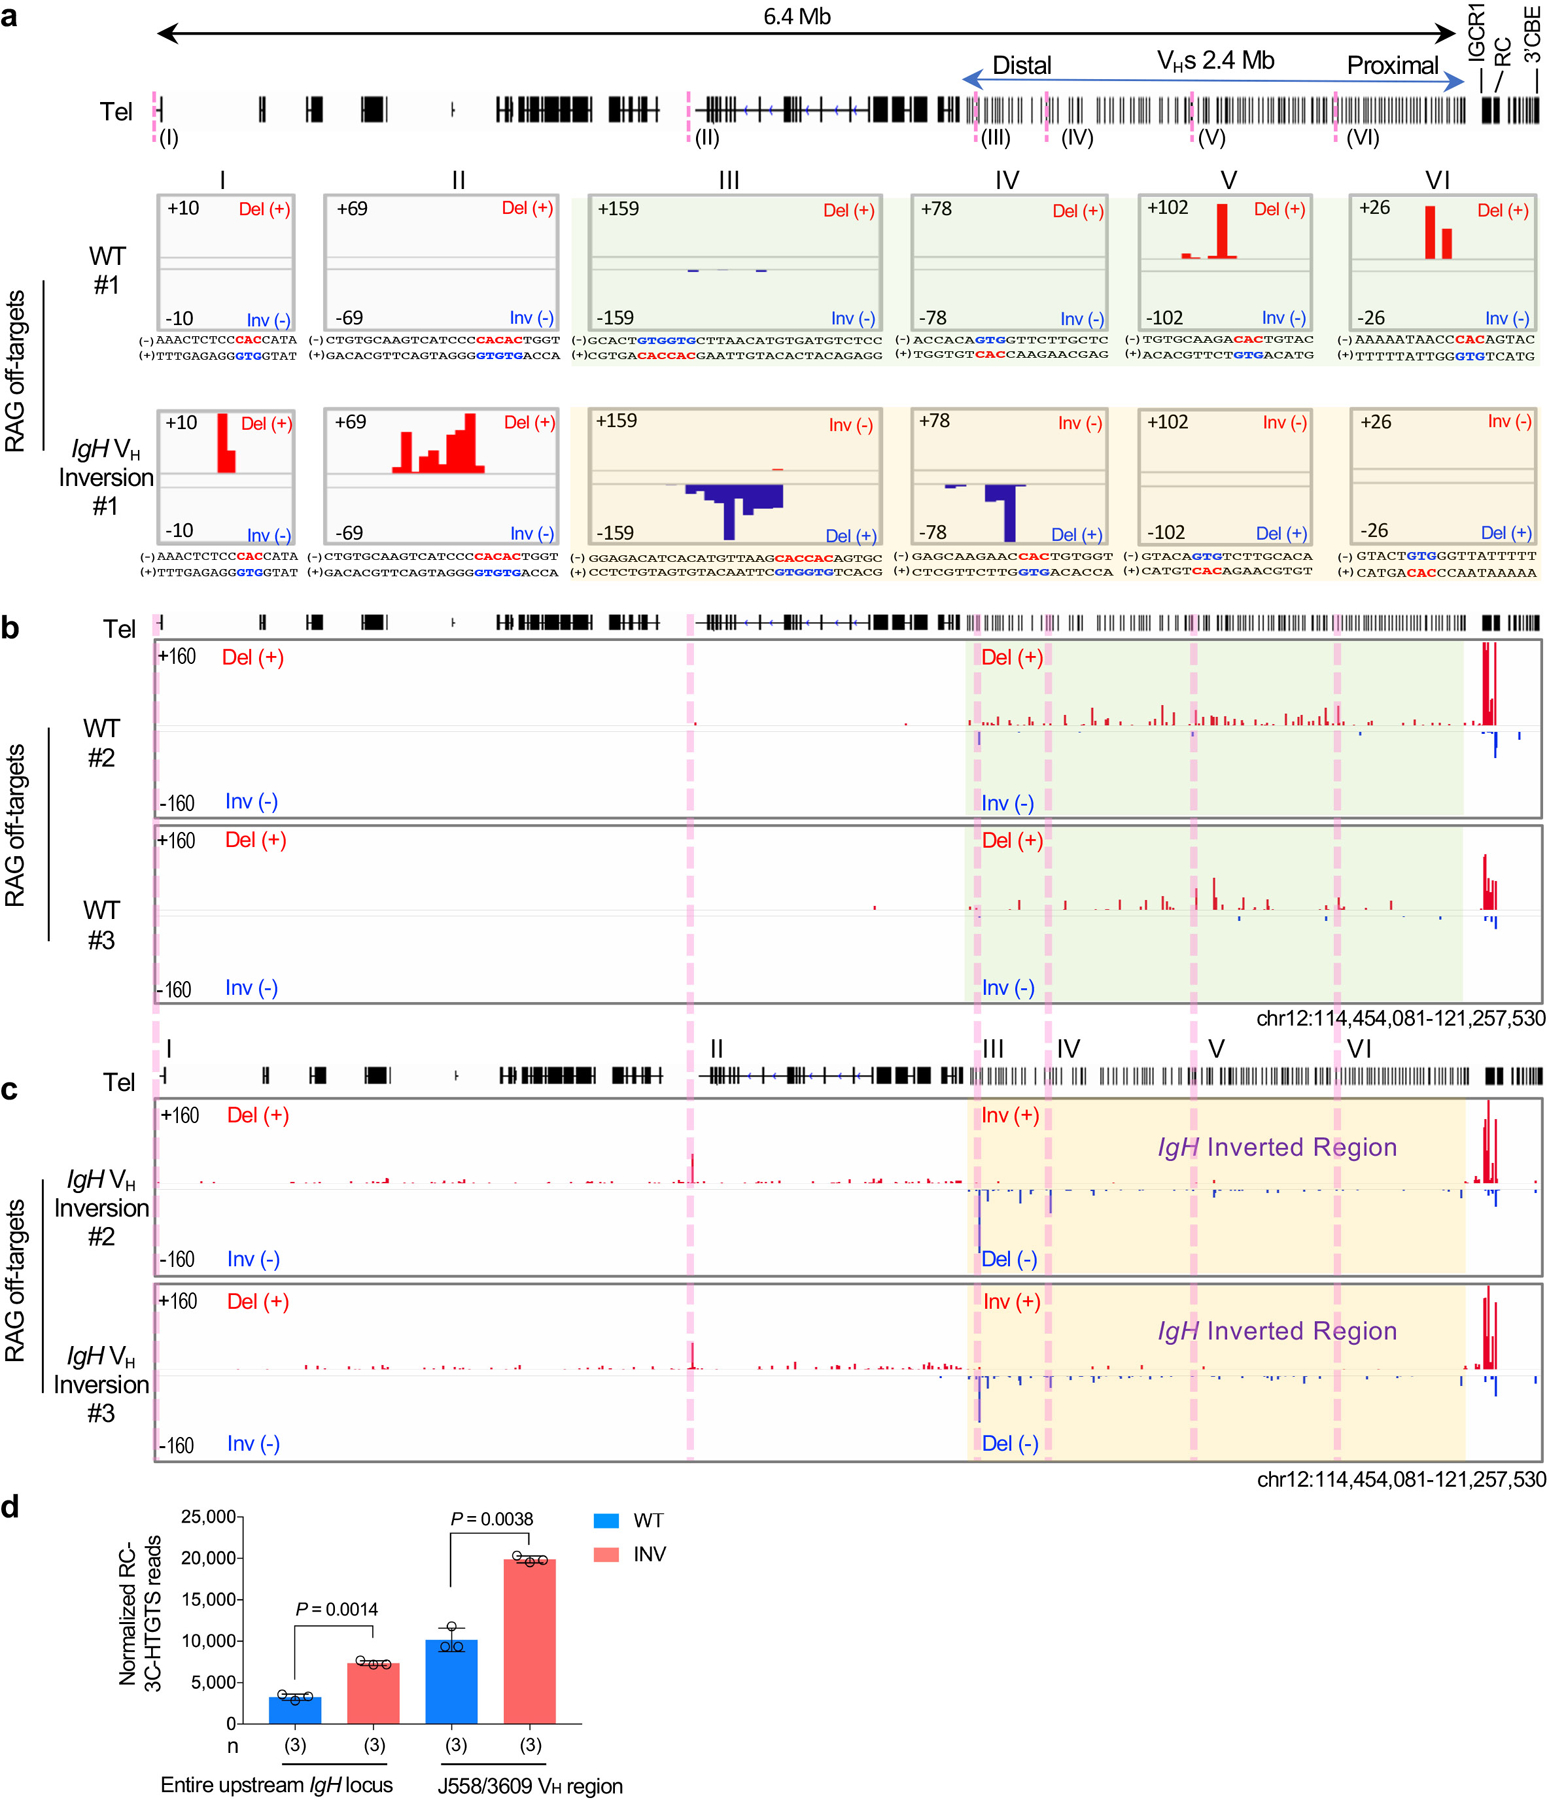
a, 6 examples (labeled in Fig. 2b, I-VI) of RAG off-target peaks in WT (repeat #1, middle) and IgH VH locus inversion (repeat #1, bottom) primary pro-B cells plotted at single-base-pair resolution. Top panels are WT 2.4 Mb IgH locus and upstream 4 Mb region track. For comparison, the sequence of RAG off-target peaks (III-VI) in the inverted region are shown in inverted orientation. b, c, RAG off-target junction profiles at IgH locus and upstream 4 Mb region in WT (repeat #2, #3, middle) and IgH VH inversion (repeat #2, #3, bottom) primary pro-B cells. For comparison, RAG off-target junction profiles in the inverted region are shown in normal orientation (c). The same regions of RAG off-target peaks (shown in a) are highlighted with pink lines (b, c). The IgH VH inverted region is highlighted in transparent green (WT, a, b) and transparent gold (IgH VH inversion, a, c), respectively. Del (+) indicates deletional junction. Inv (−) indicates inversional junction. d, Normalized RC-3C-HTGTS reads ± s.d. of WT (n=3) and INV (n=3) in entire upstream IgH locus and J558/3609 VH region are shown. See Supplementary Data 1 for individual repeats of RC interactions with whole IgH locus and entire upstream IgH locus. Indicated P values were calculated using unpaired two-tailed t-test. n, number of independent experiments.
Extended Data Figure. 3 |. The major RC interactions, transcription patterns, and binding of key looping factors are maintained in the inverted IgH loci in cultured RAG1-deficient primary pro-B cells (Related to Fig. 3b).
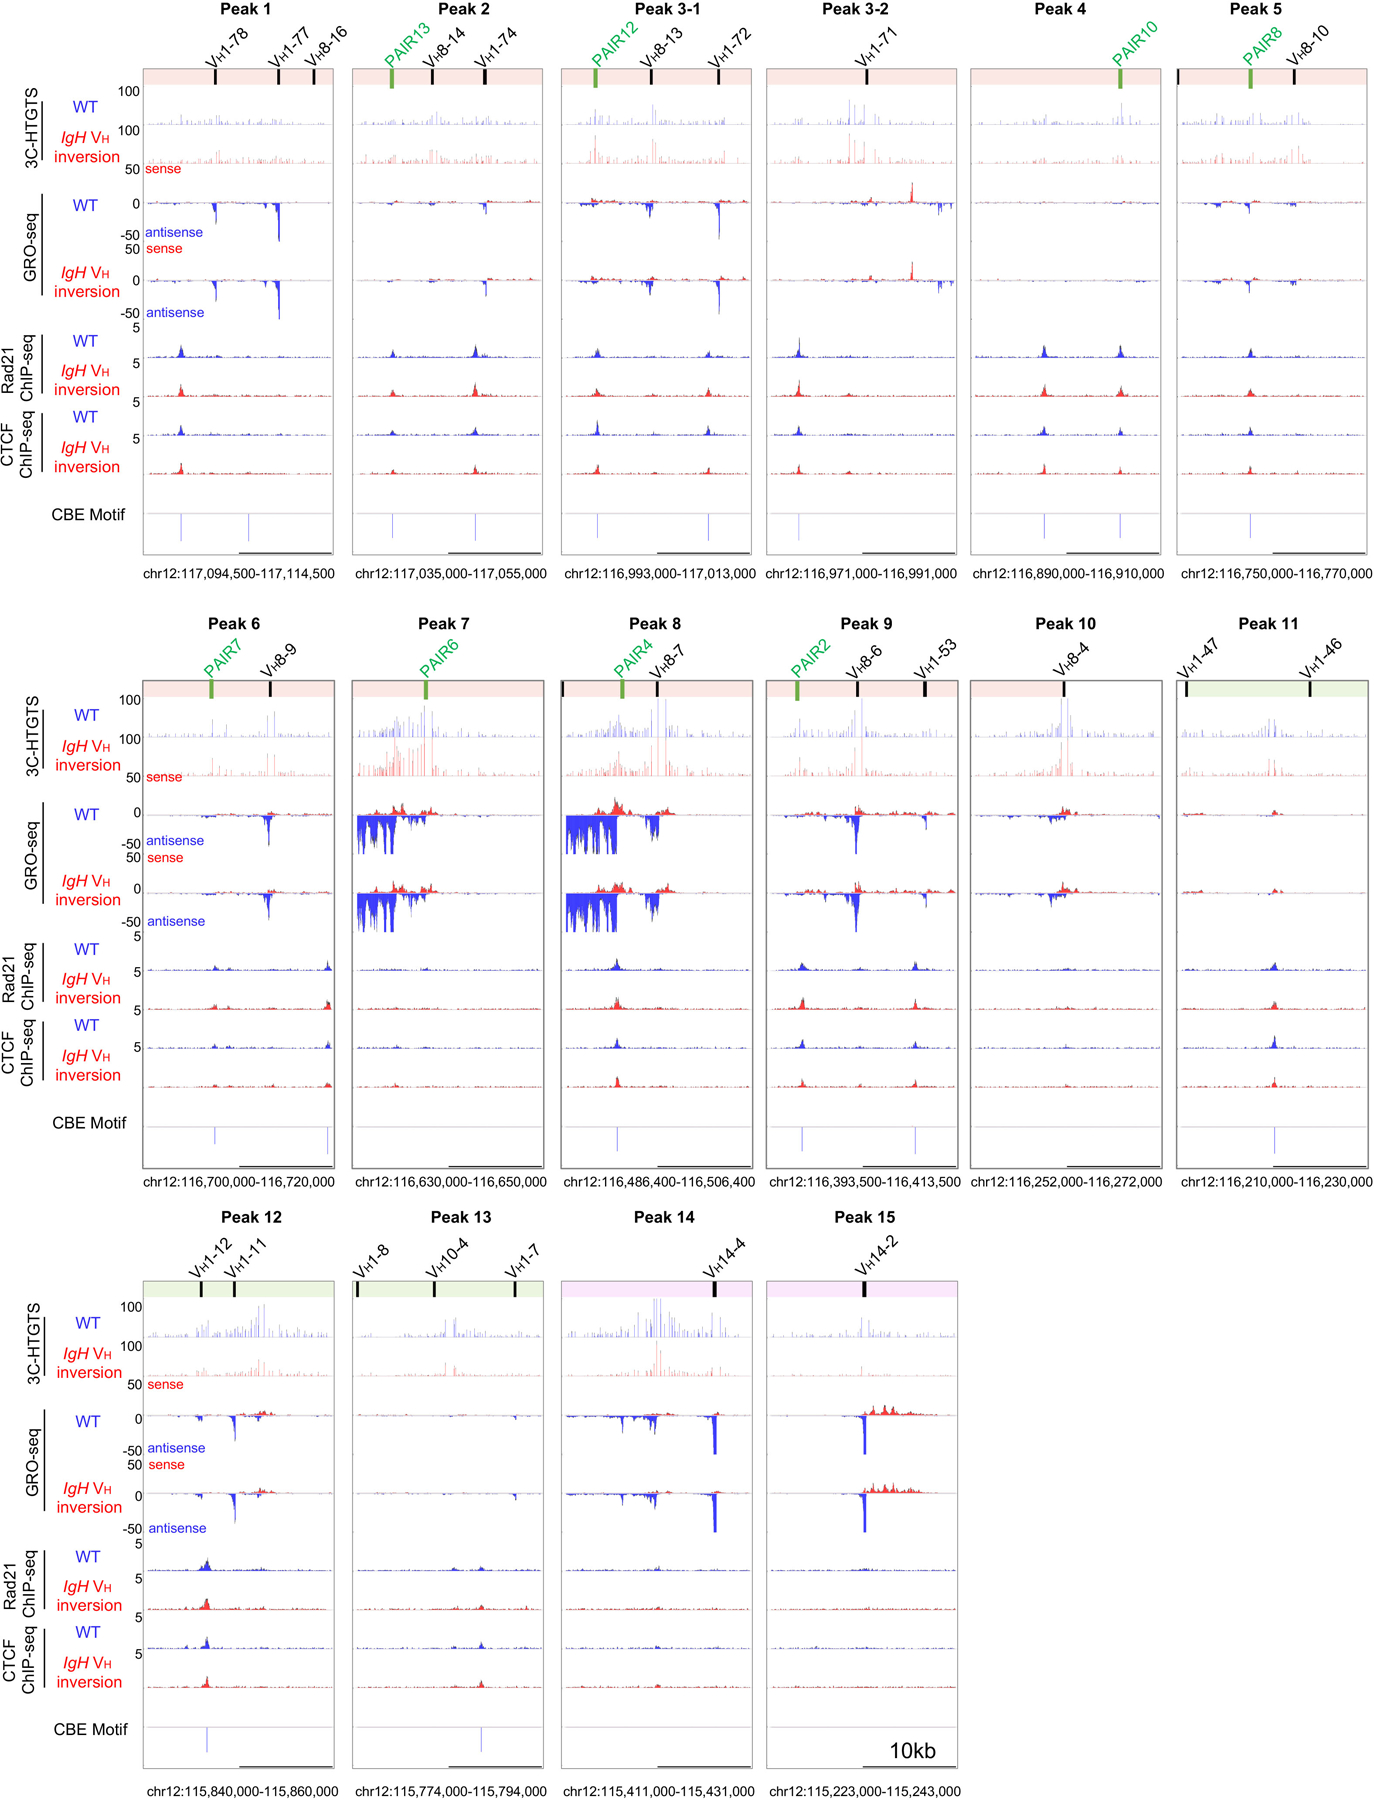
For comparison, all the data in the inverted region are shown in normal orientation. Related to Fig. 3b. Zoom-in profiles of 3C-HTGTS, GRO-seq, Rad21/CTCF ChIP-seq signals for ± 10 kb regions of 15 representative peaks/clusters in Fig. 3b from WT (blue) and IgH inversion (INV, Red) cultured RAG1-deficient primary pro-B cells along with relevant bona fide CBE motif sites are shown, data are presented as average signal counts ± s.e.m., PAIR elements (green bars) that located in each peak were also shown above. 3C-HTGTS: WT, n=3; INV, n=3. GRO-seq: WT, n=4; INV, n=4. Rad21 ChIP-seq: WT, n=3; INV, n=3. CTCF ChIP-seq: WT, n=3; INV, n=3. n, number of independent experiments. A similarly detailed view of these parameters across the entire VH locus is shown in Supplementary Data 2. Discussion: Overall these patterns indicate that proximal 7183/Q52 highly rearranged VHs are not transcribed but frequently have CTCF-bound closely associated CBEs; whereas distal J558/3609 highly rearranged VHs are often transcribed and/or have CBEs within 5kb that are CTCF-bound, which in cases where both occur may cooperate to enhance rearrangement. In the J558 and Middle VH domains, some highly rearranged VHs are transcribed and/or have associated CTCF/cohesin-bound CBEs; but some highly rearranged VHs in these regions appear to have neither, suggesting other unknown mechanisms for their RAG-targeting during scanning. In some latter examples we cannot rule out very low level sense and/or anti-sense transcription as having a contributory role; since the threshold for transcriptional targeting of RAG scanning activity has not been determined. Overall, these patterns are somewhat similar to those discussed in recent report on study involving CTCF-depletion in v-Abl cells2.
Extended Data Figure. 4 |. Cohesin/ CTCF binding patterns and germline VH transcription patterns are shown in normal and inverted IgH loci in cultured RAG1-deficient primary pro-B cells (Related to Fig. 3b and Supplementary Data 2).
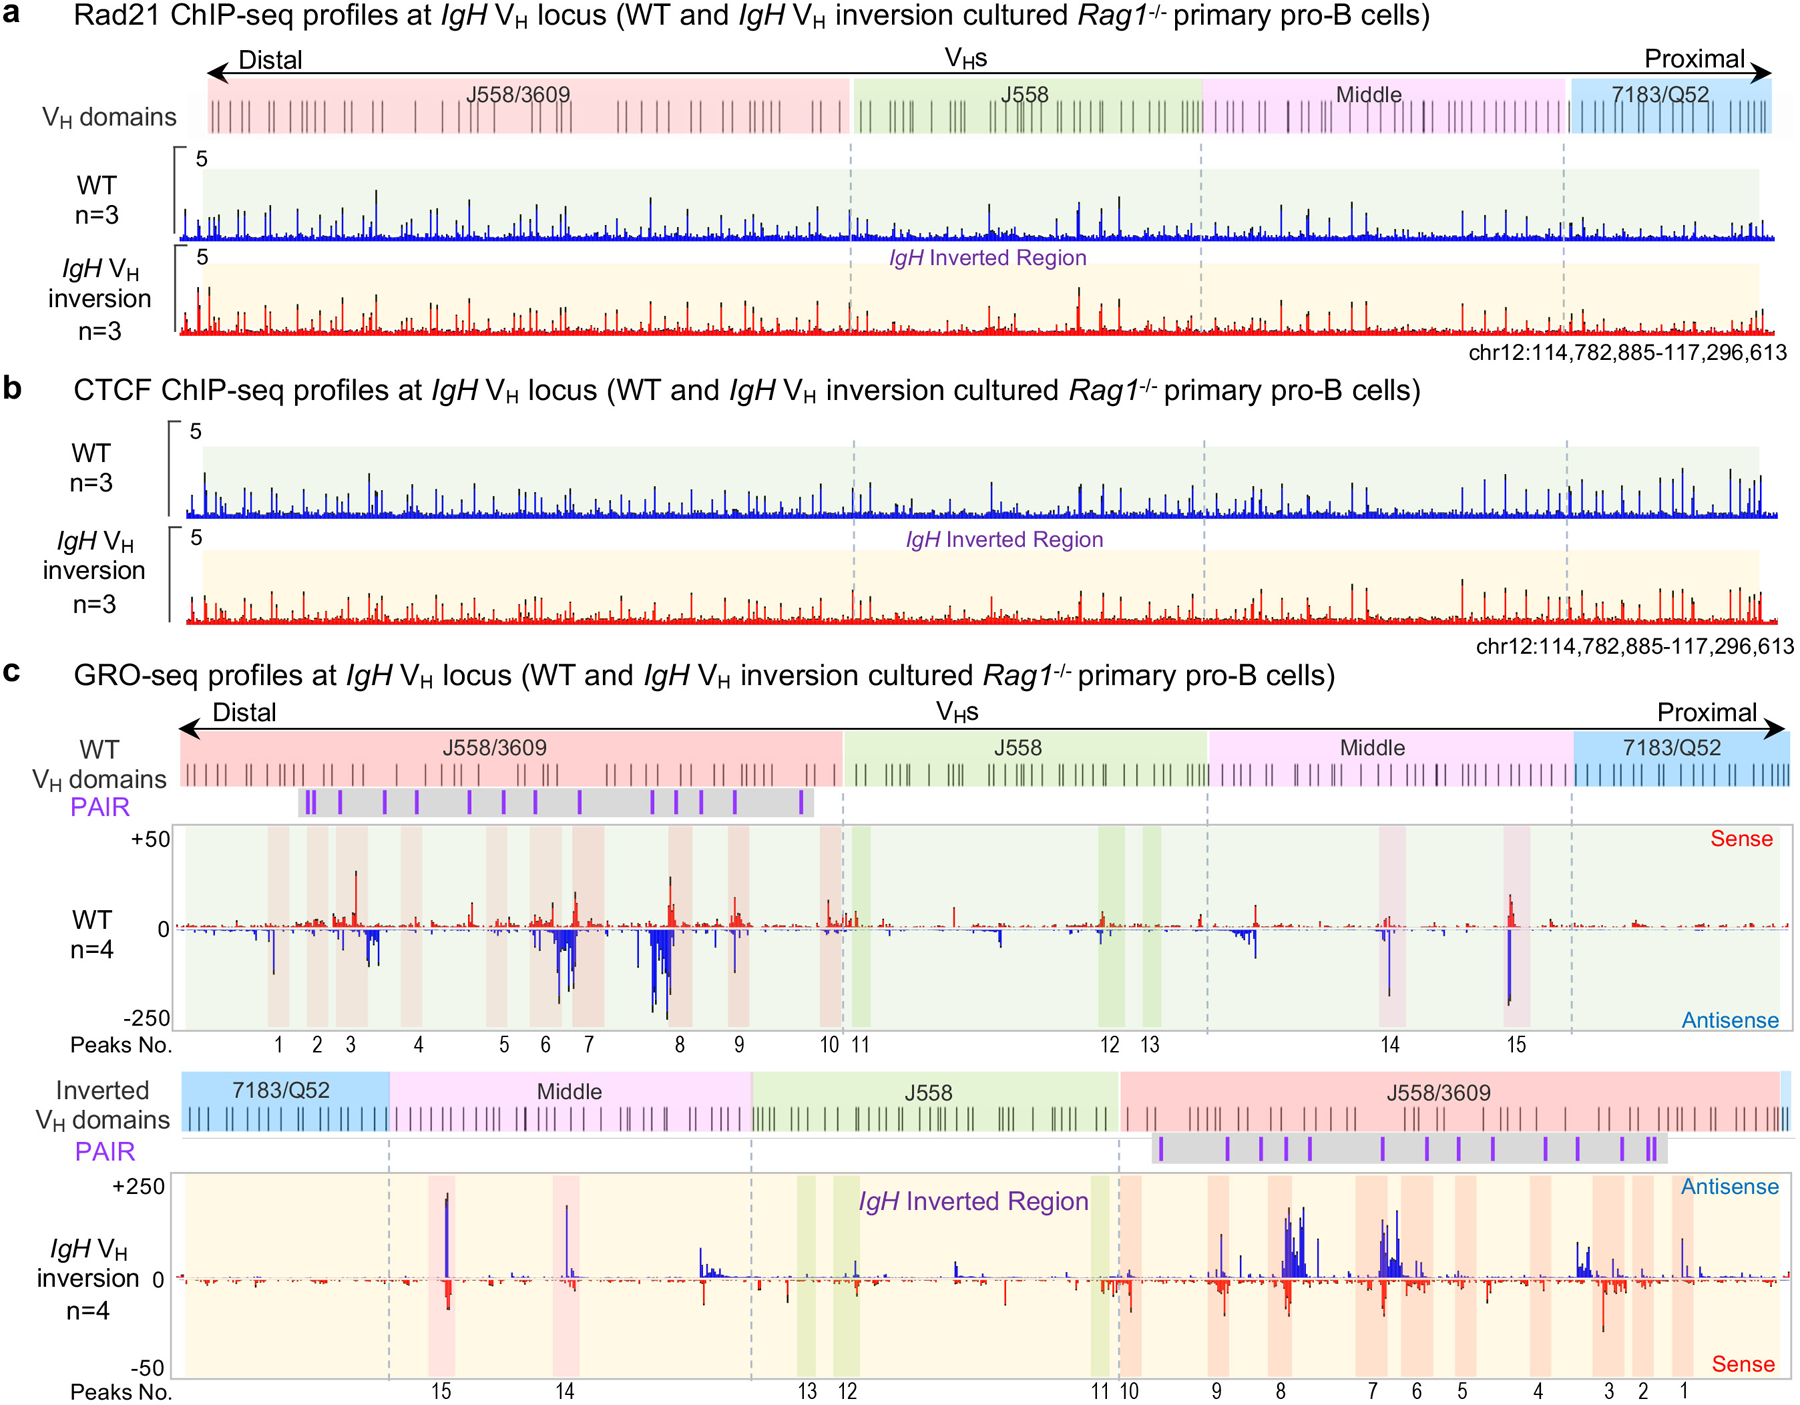
a, b, For comparison, the ChIP-seq data in the inverted locus are shown in normal orientation. Average signal counts ± s.e.m. of Rad21 (a) / CTCF (b) ChIP-seq across the 4 VH domains as indicated in WT (upper, blue, n=3) and IgH VH locus inversion (bottom, red, n=3) cultured RAG1-deficient primary pro-B cells. n, number of independent experiments. c, Average signal counts ± s.e.m. of GRO-seq profiles across the 4 VH domains in WT (upper, n=4) and IgH VH locus inversion (bottom, n=4) cultured RAG1-deficient primary pro-B cells. n, number of independent experiments. For comparison, the GRO-seq results in the inverted locus is shown in inverted orientation (c, bottom). The WT and inverted VH locus/domains with PAIR elements are diagrammed at the top of each panel. Both the sense and antisense transcription are relative to the entire IgH VH locus upstream VH81X with or without inversion and indicated, respectively. For comparison, 15 representative major interaction peaks/clusters as shown in Fig. 3b were indicated with colour shades and numbers. The IgH VH inverted region is highlighted in transparent green (WT) and transparent gold (IgH VH inversion), respectively. See Supplementary Data 2 for more details.
Extended Data Figure. 5 |. The 3’CBEs are not required for VH utilization.
a, Diagram of the entire murine IgH locus with or without ten 3’IgH CBEs, details as shown in Fig. 1a. b, Schematic of the strategy to generate the mouse ES cells with entire 3’CBE locus deletion. Ten 3’IgH CBEs are shown in gray peaks on the top panel. LoxP sites flanking the pGK-Neo selection marker are shown as black triangles. Red filled boxes ‘A’ and ‘B’ indicates the left and right homology arms, respectively, flanking all ten 3’IgH CBEs. c, Gel images show the confirmation results of two independent 3’CBE-deleted ES cell clones, 3’CBEs∆HOMO #1 and #2 (n=2 biologically independent repeats with similar results). P1-P3 are the genotyping primers and listed in Supplementary Table 6. See Methods for more details. d, Average utilization frequencies ± s.d. of all VH segments in WT primary pro-B cells (n=6). VH usage data were extracted from Ba et al.2 (GEO: GSE142781). n, number of independent experiments. e, f, Average utilization frequencies ± s.d. of all non-productive (NP) VH segments in splenic B cells from WT (e, n=3) and 3’CBE deletion (f, n=3) mice, respectively. n, number of independent experiments. All the data are from 129SV background mice (d-f). Prior studies show that non-productive allele rearrangement patterns of splenic B cells are highly correlated with those productive and non-productive patterns in primary pro-B cells5. See Supplementary Table 3 and Methods for all further details of this analysis. Discussion: Termination of loop extrusion-mediated VH locus RAG-scanning within the VH locus in normal primary pro-B cells may be largely impeded by bona fide convergent VHRSS-mediated rearrangements. In this regard, inversion of the VH locus would eliminate any potential contribution of VHRSS-mediated contributions. Beyond this, such termination of RAG-scanning also may be contributed by cooperative activities of highly frequent distal VH locus scanning impediments including active transcription sites and CBEs. Due to the number of such impediments, and the possibility that their activity may be collective, assessing their functions in this context may be difficult via targeted mutational analyses. However, our findings of differential effects of the inversion on proximal versus distal VH locus CBEs interactions with convergent 3’CBEs in the VH inverted locus provides indirect support of such a potential role for distal CBEs (Fig. 3c, bottom).
Extended Data Figure. 6 |. Generation and characterization of RAG1-deficient Wapl-degron v-Abl cell lines.
a, Scatter plots of average transcriptome-wide GRO-seq counts in G1-arrested v-Abl cells (x axis, n=3) and primary pro-B cells (y axis, n=4). n, number of independent experiments. Representative known requisite genes implicated in the cohesin-complex function for V(D)J recombination and chromatin interactions are highlighted by red circles and blue arrows. Representative known genes implicated in the DNA repair and B cell development were also analyzed to determine if there were any potential transcriptional defects in these essential genes for V(D)J recombination and none were found and highlighted. Analyses of scatter plots indicate that Wapl is expressed at significantly higher levels in G1-arrested v-Abl cells than in primary pro-B cells (Spearman’s correlation coefficient (rho) and P values determined by two-sided Spearman’s correlation test are presented). These transcription finding were confirmed by western blotting studies (Fig. 4a). b, Comparison of Wapl transcription levels by GRO-seq in primary pro-B cells and G1-arrested v-Abl cells from 4 and 3 independent repeats, respectively. Data are presented as average signal counts ± s.e.m. of GRO-seq. n, number of independent experiments. Although other genes upstream and downstream of the Wapl gene show altered transcription in primary pro-B cells compared to the v-Abl cells, their products thus far have not been implicated in loop extrusion or chromatin scanning. c, Schematic of the targeting strategy for introducing Tet-On OsTIR1 expression cassette at the mouse Rosa26 locus. d, Strategy to generate Wapl-degron v-Abl cell lines. Positions of homology arms (gray box), Cas9/sgRNAs and southern blot probe are indicated. e, Southern blot confirmation of two correctly targeted clones (#5–3 and #5–9) with Wapl-mAID on both alleles (n=2 biologically independent repeats with similar results). f, Diagram of the experimental strategy to specifically deplete mAID-tagged Wapl protein in G1-arrested v-Abl cells. g, Western blotting to detect Wapl and Wapl-mAID protein. The indicated clones (#5–3 and #5–9) were grown without or with Wapl depletion at indicated time points before immunoblotting (n=2 biologically independent repeats with similar results). The specific western blotting bands of WT Wapl and Wapl-mAID were labeled. OsTIR1 was detected by anti-V5 antibody. Primary #5 clone was used for the WT Wapl control and β-actin was a loading control. h, Western blotting to detect Wapl protein levels in G1-arrested RAG1-deficient primary #5 v-Abl cells and cultured RAG1-deficient primary pro-B cells. Each sample was loaded with 3 indicated titrations. One of the two experiments is shown. i, Western blotting results to determine relative Wapl protein levels in cycling and G1 arrested Wapl-degron v-Abl cell clones (#5–3 and #5–9) with indicated conditions. For comparison, the intensity of the Wapl band in G1-arrested primary #5 v-Abl cells is set as 1.0. Average value is indicated at each bar. n, number of independent repeats. Indicated P values were calculated using unpaired two-tailed t-test. j, Representative flow-cytometry plots showing the percentage of Clover-positive Wapl-degron v-Abl cells that are without (Untreated) or with (IAA&Dox) Wapl depletion at indicated time points (n=2 biologically independent repeats with similar results). Primary #5 was processed as a Clover-negative control. k, Cell viability assay for G1-arrested v-Abl cells with indicated conditions. Data are presented as average percentage ± s.d. of viable cells for each condition. n, number of independent experiments. l, Representative flow-cytometry plots of propidium iodide (PI) stained G1-arrested v-Abl cells with indicated conditions (n=2 biologically independent repeats with similar results). Percentages in the top-right corner represent the percentage of cells at G1, S and G2/M stage. One of the two experiments is shown. Indicated P values were calculated using unpaired two-tailed t-test (i, k). Plasmids, sgRNAs and oligos used are listed in Supplementary Table 6.
Extended Data Figure. 7 |. Characterization of Wapl/ CTCF/ Rad21-binding in G1-arrested RAG1-deficient Wapl-degron v-Abl cells.
a, Average signal counts ± s.e.m. of Wapl ChIP-seq across the entire IgH locus are plotted as indicated for G1-arrested RAG1-deficient v-Abl cells without (Untreated, blue) or with (IAA&Dox, red) Wapl depletion and cultured RAG1-deficient primary pro-B cells (green). n, number of independent experiments. Wapl ChIP-seq showed that IAA&Dox treatment leads to a depletion of chromatin-bound Wapl at IgH locus, which largely resembles that of primary pro-B cells at IgH locus. b, Three independent repeats of Wapl ChIP-seq signal within ±1.0 kb region across all peaks genome-wide called in G1-arrested RAG1-deficient v-Abl cells without (Untreated) or with (IAA&Dox) Wapl depletion. Top: Average enrichment. c, d, Average signal counts ± s.e.m. of CTCF (c) and Rad21 (d) ChIP-seq across the entire IgH locus are plotted as indicated for G1-arrested RAG1-deficient v-Abl cells without (Untreated, blue) or with (IAA&Dox, red) Wapl depletion, and cultured RAG1-deficient primary pro-B cells (green). n, number of independent experiments. Rad21 ChIP-seq showed that Wapl depletion in G1-arrested v-Abl cells influenced Rad21 (cohesin) redistribution across the IgH locus to give a pattern significantly similar to primary pro-B cells (Spearman’s correlation r=0.84, P<2e-16) (d). e, Spearman correlation analyses of VH usage with Rad21 and CTCF binding in WT primary pro-B cells and Wapl depleted v-Abl cells. Data for Spearman correlation analyses are from Fig. 1b, 4d, and Extended Data Fig. 4a–b, and 7c–d. Indicated P values were calculated by a two-sided Spearman’s correlation test and shown as: *: 0.01≤P<0.05, **: 0.001≤P<0.01, and ***: P<0.001. Discussion: As noted in the text, we found significant correlations between VH usage and Rad21 or CTCF binding in 3 of the 4 VH families including the distal VH J558/3609 family in primary pro-B cells. However, in the IAA&Dox-treated v-Abl lines, we did not observe a significant correlation between VH usage and Rad21 or CTCF binding in the distal VH J558/3609 family. To explore the reason for this correlation discrepancy, we did an analysis of the correlation of primary pro-B cell VH usage patterns with cohesin and CTCF binding patterns in IAA&Dox-treated v-Abl cells, which indeed revealed significant correlations of these patterns in distal J558/3609 VH usage for both cohesin and CTCF (Extended Data Fig. 7e). This finding indicates that the lack of correlation of distal J558/3609 VH usage with cohesin and CTCF binding patterns in Wapl-depleted v-Abl cells stems from their VH usage patterns. In this regard, primary pro-B cells generate their VH repertoires from a steady state population in which these cells presumably have RAG scanning across the locus fully engaged and coordinated with VH locus contraction. However, in Wapl-depleted v-Abl cells, RAG scanning and VH locus contraction may not be physiologically matched due to ectopic RAG expression and ectopically-induced Wapl depletion. The further impact of the nearly complete Wapl-depletion in IAA&Dox-treated v-Abl cells versus Wapl expression levels in primary pro-B cells (Fig. 4a) is reflected by greatly reduced levels of proximal versus distal VH rearrangements in v-Abl lines versus those primary pro-B cells (Fig. 4d, bottom; Extended Data Fig. 9c; Supplementary Table 2, 5). Moreover, complete Wapl depletion decreases overall V(D)J recombination activity per se in v-Abl lines as noted in the text, which might also impact these correlations.
Extended Data Figure. 8 |. Characterization IgH gene transcription, D usage, and Igκ rearrangements in G1-arrested Wapl-degron v-Abl cells.
a, Average signal counts ± s.e.m. of GRO-seq across the 4 VH domains (left) and RC region (right) are plotted as indicated in G1-arrested RAG1-deficient v-Abl cells without (Untreated, upper) or with (IAA&Dox, middle) Wapl depletion and cultured RAG1-deficient primary pro-B cells (bottom). n, number of independent experiments. For comparison, 15 representative major interaction peaks/clusters as Fig. 3b are indicated. PAIR elements are indicated as purple lines with gray background. b, Scatter plots of average transcriptome-wide GRO-seq counts in G1-arrested RAG1-deficient v-Abl cells without (Untreated, x axis) and with (IAA&Dox, y axis) Wapl depletion. n, number of independent experiments. Representative known requisite genes for V(D)J recombination and chromatin interaction are highlighted by red circles and blue arrows in each of the three scatter plots. Spearman’s correlation coefficient (rho) and P value determined by two-sided Spearman’s correlation test are presented. c, Diagram of the experimental strategy including retrovirus-mediated RAG complementation in Wapl-degron v-Abl cells for HTGTS-V(D)J-seq assay. d, Average utilization frequencies ± s.d. of all D segments from DJH plus VHDJH joins in RAG1-complemented, G1-arrested Untreated primary, Untreated Wapl-degron and IAA&Dox-treated Wapl-degron v-Abl lines. n, number of independent experiments. Indicated P values were calculated using unpaired two-tailed t-test. e, Average 3C-HTGTS signal counts ± s.e.m. baiting from RC for interactions with the RC domains that includes 3’CBE downstream and the most proximal VHs upstream in RAG1-deficient cultured primary pro-B cells (top), G1-arrested RAG1-deficient v-Abl cells without (middle) or with Wapl depletion (bottom). n, number of independent experiments. See Supplementary Data 1 for whole IgH locus interactions. Related very low-level peaks of RC interactions with IGCR1 in IAA&Dox treated cells suggest IGCR1 impediments were neutralized by Wapl depletion in v-Abl cells. f, Absolute individual Vκ usage in total reads. Each library was normalized to 20,000 total reads including Igκ junctions and germline reads. Data are presented as average absolute Vκ usage ± s.d. across the Igκ locus in WT primary pre-B cells and untreated Wapl-degron v-Abl cells (G1_Untreated). For the IAA&Dox-treated Wapl-degron v-Abl cells (G1_IAA&Dox), data are presented as average absolute Vκ usage. Spearman correlation of Vκ usage patterns between WT primary pre-B cells and untreated Wapl-degron v-Abl cells is statistically significant (r=0.96, P<0.001). P values are calculated by two-sided Spearman’s correlation test. n, number of independent experiments. g, Relative Vκ to Jκ rearrangement levels in RAG1-complemented cycling v-Abl cells and G1-arrested Wapl-degron v-Abl cells without (G1_Untreated) or with (G1_IAA&Dox) Wapl depletion. Relative Vκ to Jκ rearrangement levels = Igκ junctions / (Igκ junctions + germline reads) %.Data are presented as mean percentage values ± s.d. for cycling v-Abl cells and untreated Wapl-degron v-Abl cells (G1_Untreated). For IAA&Dox treated Wapl-degron v-Abl cells (G1_IAA&Dox), data are presented as mean percentage values. Average Igκ recombination levels are indicated at each bar. n, number of independent experiments. Vκ usage data of RAG1-complemented G1-arrested Wapl-degron v-Abl cells without or with Wapl depletion from Panel f (middle and bottom) are used to generate the bar graphs (G1_Untreated and G1_IAA&Dox). n, number of independent experiments. h, Percentage of individual Vκ usage in total Vκ to Jκ rearrangements. The same library as panel f was normalized to 20,000 total Igκ junctions. Data are presented as average percentage ± s.d. in WT primary pre-B cells and untreated Wapl-degron v-Abl cells (G1_Untreated). For the IAA&Dox treated Wapl-degron v-Abl cells (G1_IAA&Dox), data are presented as average percentage. n, number of independent experiments. See Supplementary Table 2, 4 and Methods for all further details of the analyses.
Extended Data Figure. 9 |. The large VH inversion has similar impacts on normal and cryptic RSS utilization within and beyond the VH locus in G1-arrested Wapl-degron v-Abl cells and primary pro-B cells.
a-d, Average utilization frequencies ± s.d. of all VH segments in RAG1-complemented, G1-arrested v-Abl cells with indicated conditions. Average percentage ± s.d. of VHDJH and DJH rearrangements are shown. Untreated primary, n=3 (a); Untreated Wapl-degron (single IgH allele), n=3 (b); IAA&Dox Wapl-degron (single IgH allele), n=3 (c); IAA&Dox Wapl-degron IgH VH inversion (single IgH allele), n=3 (d) were used for independent experiments for statistical analyses with error bars. n, number of independent experiments. All VH segments divided into four domains from most proximal to distal. See Supplementary Table 2, 5 and Methods for more details. e, Pooled HTGTS junction profiles at IgH locus and upstream 4 Mb region for deletional and inversional joining in RAG1-complemented, G1-arrested v-Abl cells without (Untreated, upper, pooled n=3) or with Wapl depletion (IAA&Dox, middle, pooled n=3), or with 2.4 Mb inversion with Wapl depletion (IAA&Dox, IgH VH inversion, bottom, pooled n=3). For comparison, the VH usage (d) and RAG off-target (e, bottom) data in the VH-loci inverted v-Abl cells are shown in normal IgH orientation. A smaller scale is used to present recombination to cryptic recombination signal sequences in Wapl-degron v-Abl lines (e) compared with that in primary pro-B cells (Fig. 2b); the need for this likely reflects lower levels of overall V(D)J recombination following Wapl depletion. f, Average frequencies ± s.d. of plus strand (red, +) and minus strand (blue, -) joining events within indicated regions in RAG1-complemented, G1-arrested v-Abl cells: Untreated Wapl-degron, n=3; IAA&Dox Wapl-degron, n=3; IAA&Dox Wapl-degron IgH VH inversion, n=3. n, number of independent experiments. Indicated P values were calculated using unpaired two-tailed t-test. See Methods for more details.
Extended Data Figure. 10 |. Working model for loop extrusion-mediated IgH locus contraction for RAG chromatin scanning.
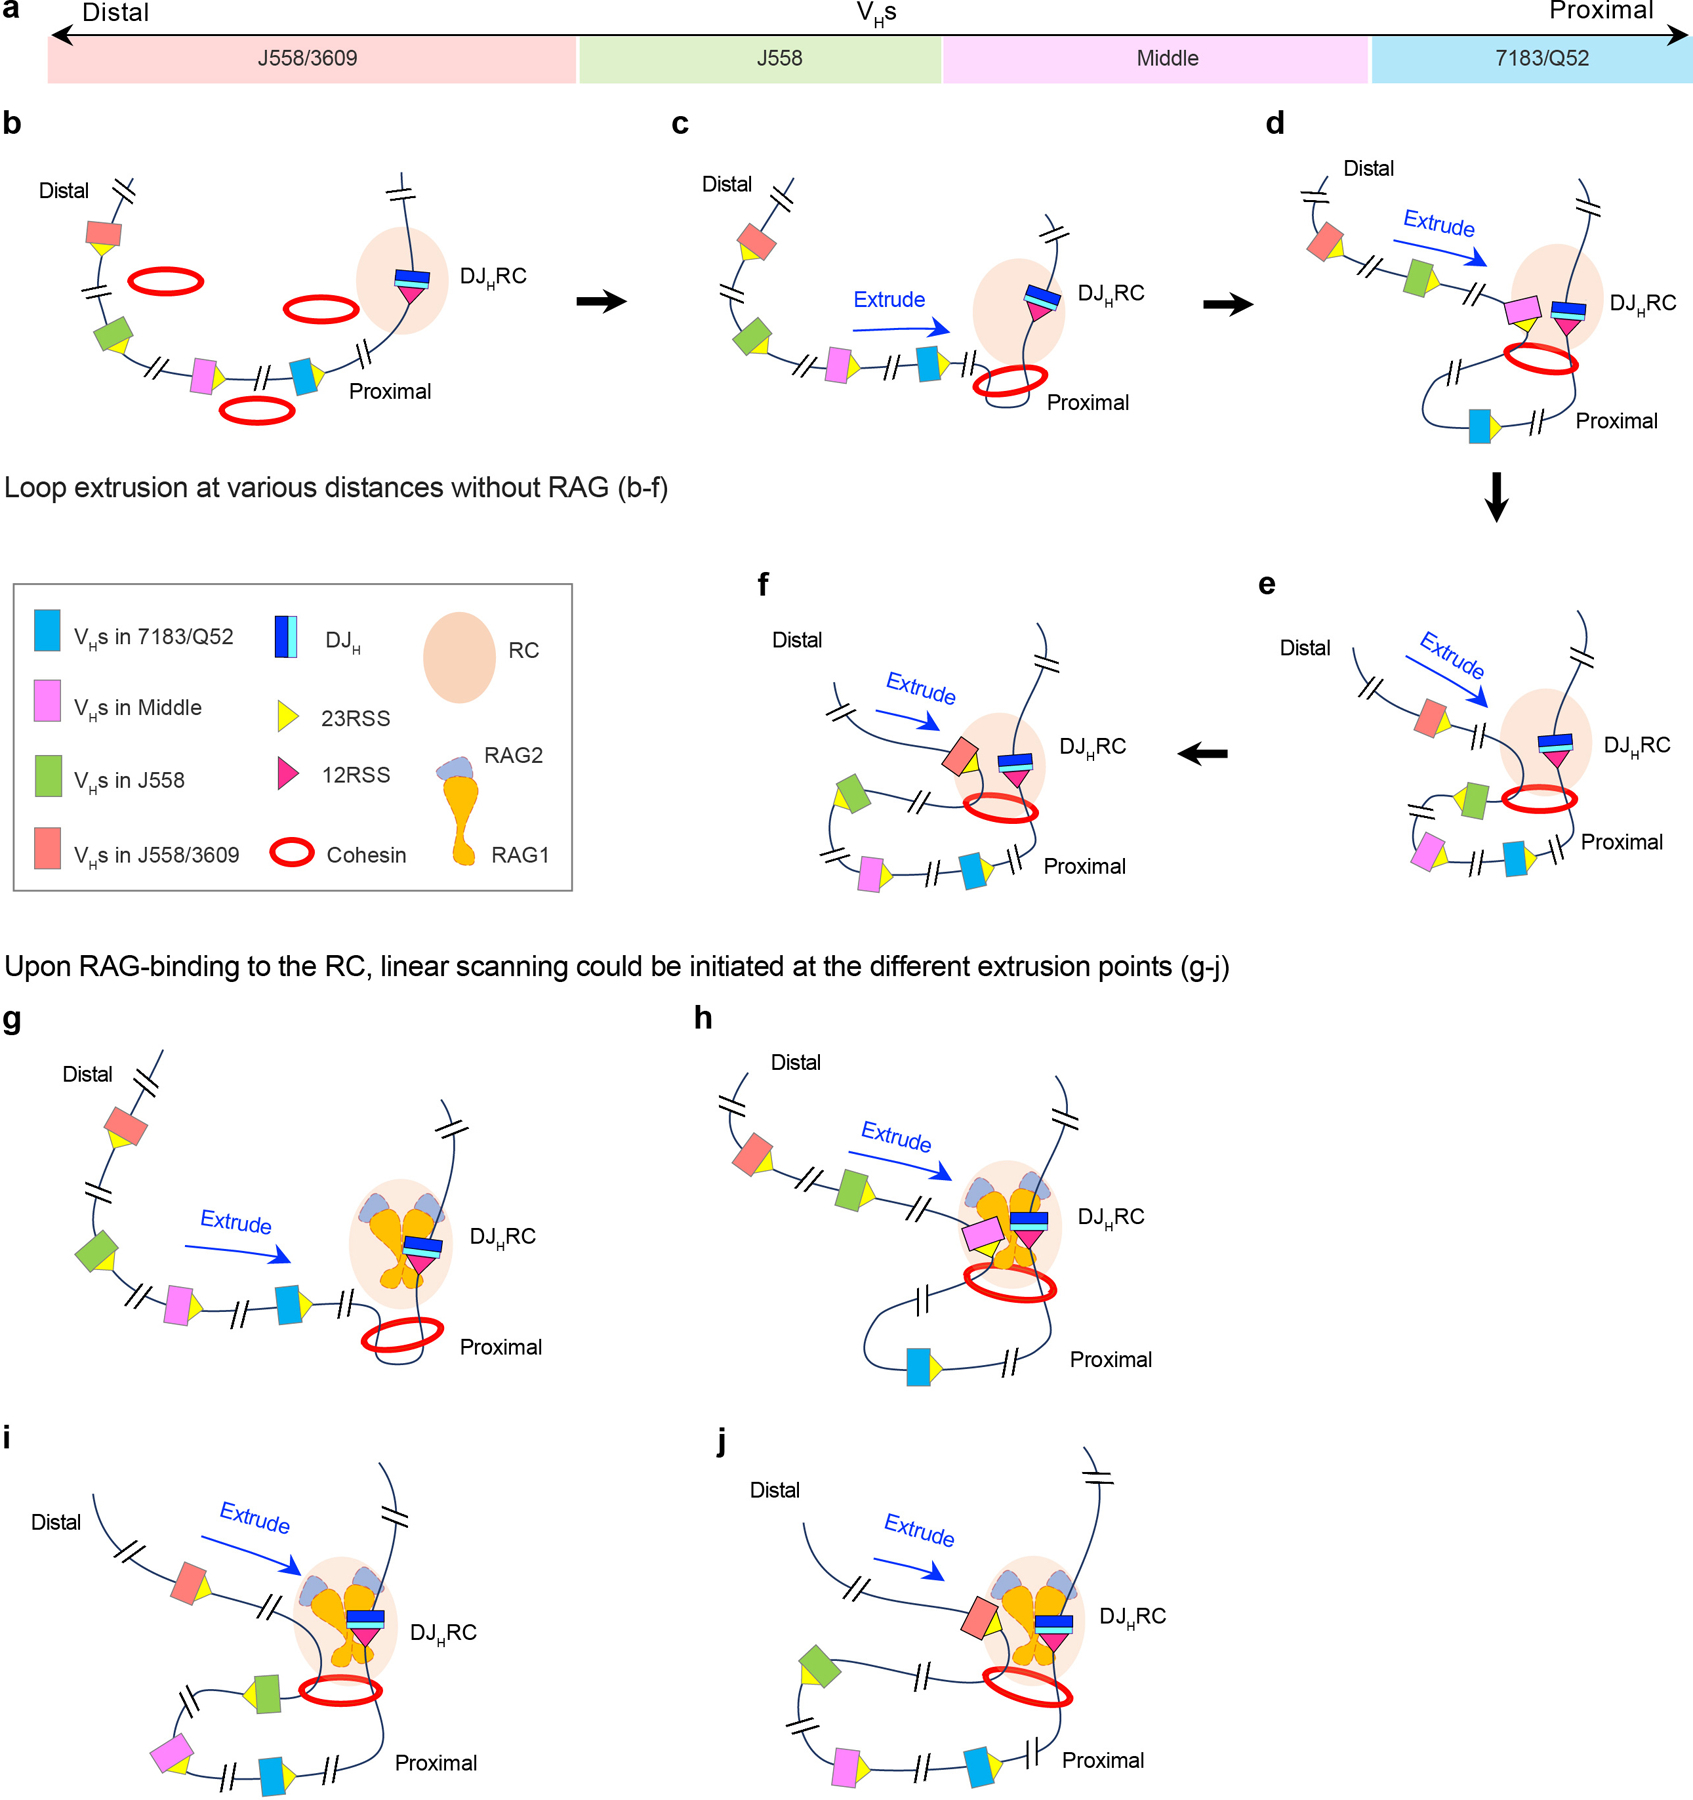
a, In C57BL/6 mice, all 109 VH segments are located within one or another four VHs domains as indicated in figure from proximal to distal: 7183/Q52 (blue), Middle (pink), J558 (green) and J558/3609 (red). Beyond VH domains relevant elements and proteins including the DJHRC, 12 and 23 RSSs, cohesin, and RAG1 and RAG2 subunits and complexes are indicated in the box. b-j, Model for loop-extrusion-mediated physiological locus contraction for distal VH utilization based on RAG1-deficient background analyses and RAG on- and off-target analyses in primary pro-B cells with reduced Wapl expression. See text for overall description. In brief: Loop extrusion past the nascent (non-RAG-bound) DJH-RC may cover much greater distances of upstream chromatin (that would vary from cell) than would occur when RAG is bound to the RC, as directly suggested by results of a recent publication from our lab1 (b-f). If RAG bound to the DJH-RC subsequently in such cells, it could form active DJHRCs that could initiate loop-extrusion-mediated scanning at different extrusion points across the VH locus (g-j), which could avoid downstream rearrangements and potential impediments in those cells to provide more equal scanning access to all VHs across the locus6 for V(D)J recombination and contribution to diverse antibody repertoires. This model and findings that form its basis1 may also be relevant to why VH utilization patterns, which must be done in RAG sufficient cells, in some cases, do not correlate as well as might be anticipated with various peaks found for CTCF/cohesin-binding and 3C-HTGTS interaction studies done in RAG-deficient cells2,this study. In this regard, future experiments with catalytically dead RAG mutants in which RAG still binds to the RC, as opposed to RAG-deficient cells, may be informative. Finally, please see related discussion in Extended Data Fig. 7.
Supplementary Material
ACKNOWLEDGEMENTS
We thank Alt lab members for contributions to the study, particularly Hwei-Ling Cheng for advice and help with ES cell culture, Ming Tian for EF1 ES cell line, Yu Zhang for RAG-expressing retrovirus plasmids, Suvi Jain for help of cell culture and data analysis, Rachael Judson and Nicole Manfredonia for help of blastocyst injection, and Jianqiao Hu for data uploading. We thank Dr. Evguenia Bekman at University of Lisbon for advice on construction of the degron system, particularly on inducible expression of OsTIR. This work was supported by NIH R01 AI020047 (to F.W.A.). H.-Q.D. is a fellow of the Cancer Research Institute (CRI) of New York. H.C. was an NRSA Fellow (T32 AI07386) and was supported by a Leukemia and Lymphoma Society. Z.B. was supported by CRI fellowship. R.C. is partially funded by the NIH Regulome Project. C.-S.L. was previously supported by CRI fellowship and is now funded by the Ministry of Science and Technology in Taiwan [MOST109–2636-B-007–004]. F.W.A. is an investigator of the Howard Hughes Medical Institute.
Footnotes
The authors declare no competing financial interests. F.W.A. is a co-founder of Otoro Biopharmaceuticals.
Data availability
HTGTS-V(D)J-Seq, 3C-HTGTS, ChIP-seq, and GRO-seq sequencing data reported in this study have been deposited in the GEO database under the accession number GSE151910.
Code availability
HTGTS-V(D)J-seq, 3C-HTGTS, ChIP-seq, and GRO-seq data were processed through the published pipelines as previously described14. Specifically, these pipelines are available at http://robinmeyers.github.io/transloc_pipeline/ (HTGTS pipeline), http://bowtie-bio.sourceforge.net/bowtie2/index.shtml (Bowtie2 v.2.2.8), https://sourceforge.net/projects/samtools/files/samtools/1.8/ (SAMtools v.1.8).
REFERENCES
- 1.Zhang Y et al. The fundamental role of chromatin loop extrusion in physiological V(D)J recombination. Nature 573, 600–604, doi: 10.1038/s41586-019-1547-y (2019). [DOI] [PMC free article] [PubMed] [Google Scholar]
- 2.Ba Z et al. CTCF orchestrates long-range cohesin-driven V(D)J recombinational scanning. Nature, doi: 10.1038/s41586-020-2578-0 (2020). [DOI] [PMC free article] [PubMed]
- 3.Hu J et al. Chromosomal Loop Domains Direct the Recombination of Antigen Receptor Genes. Cell 163, 947–959, doi: 10.1016/j.cell.2015.10.016 (2015). [DOI] [PMC free article] [PubMed] [Google Scholar]
- 4.Guo C et al. CTCF-binding elements mediate control of V(D)J recombination. Nature 477, 424–430, doi: 10.1038/nature10495 (2011). [DOI] [PMC free article] [PubMed] [Google Scholar]
- 5.Jain S, Ba Z, Zhang Y, Dai HQ & Alt FW CTCF-Binding Elements Mediate Accessibility of RAG Substrates During Chromatin Scanning. Cell 174, 102–116 e114, doi: 10.1016/j.cell.2018.04.035 (2018). [DOI] [PMC free article] [PubMed] [Google Scholar]
- 6.Lucas JS, Zhang Y, Dudko OK & Murre C 3D trajectories adopted by coding and regulatory DNA elements: first-passage times for genomic interactions. Cell 158, 339–352, doi: 10.1016/j.cell.2014.05.036 (2014). [DOI] [PMC free article] [PubMed] [Google Scholar]
- 7.Medvedovic J et al. Flexible long-range loops in the VH gene region of the Igh locus facilitate the generation of a diverse antibody repertoire. Immunity 39, 229–244, doi: 10.1016/j.immuni.2013.08.011 (2013). [DOI] [PMC free article] [PubMed] [Google Scholar]
- 8.Proudhon C, Hao B, Raviram R, Chaumeil J & Skok JA Long-Range Regulation of V(D)J Recombination. Advances in immunology 128, 123–182, doi: 10.1016/bs.ai.2015.07.003 (2015). [DOI] [PMC free article] [PubMed] [Google Scholar]
- 9.Ebert A, Hill L & Busslinger M Spatial Regulation of V-(D)J Recombination at Antigen Receptor Loci. Advances in immunology 128, 93–121, doi: 10.1016/bs.ai.2015.07.006 (2015). [DOI] [PubMed] [Google Scholar]
- 10.Kueng S et al. Wapl controls the dynamic association of cohesin with chromatin. Cell 127, 955–967, doi: 10.1016/j.cell.2006.09.040 (2006). [DOI] [PubMed] [Google Scholar]
- 11.Bolland DJ et al. Two Mutually Exclusive Local Chromatin States Drive Efficient V(D)J Recombination. Cell reports 15, 2475–2487, doi: 10.1016/j.celrep.2016.05.020 (2016). [DOI] [PMC free article] [PubMed] [Google Scholar]
- 12.Choi NM et al. Deep sequencing of the murine IgH repertoire reveals complex regulation of nonrandom V gene rearrangement frequencies. Journal of immunology 191, 2393–2402, doi: 10.4049/jimmunol.1301279 (2013). [DOI] [PMC free article] [PubMed] [Google Scholar]
- 13.Lin SG et al. Highly sensitive and unbiased approach for elucidating antibody repertoires. Proceedings of the National Academy of Sciences of the United States of America 113, 7846–7851, doi: 10.1073/pnas.1608649113 (2016). [DOI] [PMC free article] [PubMed] [Google Scholar]
- 14.Hu J et al. Detecting DNA double-stranded breaks in mammalian genomes by linear amplification-mediated high-throughput genome-wide translocation sequencing. Nature protocols 11, 853–871, doi: 10.1038/nprot.2016.043 (2016). [DOI] [PMC free article] [PubMed] [Google Scholar]
- 15.Ebert A et al. The distal V(H) gene cluster of the Igh locus contains distinct regulatory elements with Pax5 transcription factor-dependent activity in pro-B cells. Immunity 34, 175–187, doi: 10.1016/j.immuni.2011.02.005 (2011). [DOI] [PubMed] [Google Scholar]
- 16.Hill L et al. Wapl repression by Pax5 promotes V gene recombination by Igh loop extrusion. Nature 584, 142–147, doi: 10.1038/s41586-020-2454-y (2020). [DOI] [PMC free article] [PubMed] [Google Scholar]
- 17.Zhang X et al. Fundamental roles of chromatin loop extrusion in antibody class switching. Nature 575, 385–389, doi: 10.1038/s41586-019-1723-0 (2019). [DOI] [PMC free article] [PubMed] [Google Scholar]
- 18.Muljo SA & Schlissel MS A small molecule Abl kinase inhibitor induces differentiation of Abelson virus-transformed pre-B cell lines. Nature immunology 4, 31–37, doi: 10.1038/ni870 (2003). [DOI] [PubMed] [Google Scholar]
- 19.Bredemeyer AL et al. ATM stabilizes DNA double-strand-break complexes during V(D)J recombination. Nature 442, 466–470, doi: 10.1038/nature04866 (2006). [DOI] [PubMed] [Google Scholar]
- 20.Barajas-Mora EM et al. A B-Cell-Specific Enhancer Orchestrates Nuclear Architecture to Generate a Diverse Antigen Receptor Repertoire. Molecular cell 73, 48–60 e45, doi: 10.1016/j.molcel.2018.10.013 (2019). [DOI] [PMC free article] [PubMed] [Google Scholar]
- 21.Buheitel J & Stemmann O Prophase pathway-dependent removal of cohesin from human chromosomes requires opening of the Smc3-Scc1 gate. The EMBO journal 32, 666–676, doi: 10.1038/emboj.2013.7 (2013). [DOI] [PMC free article] [PubMed] [Google Scholar]
- 22.Eichinger CS, Kurze A, Oliveira RA & Nasmyth K Disengaging the Smc3/kleisin interface releases cohesin from Drosophila chromosomes during interphase and mitosis. The EMBO journal 32, 656–665, doi: 10.1038/emboj.2012.346 (2013). [DOI] [PMC free article] [PubMed] [Google Scholar]
- 23.Chan KL et al. Cohesin’s DNA exit gate is distinct from its entrance gate and is regulated by acetylation. Cell 150, 961–974, doi: 10.1016/j.cell.2012.07.028 (2012). [DOI] [PMC free article] [PubMed] [Google Scholar]
- 24.Busslinger GA et al. Cohesin is positioned in mammalian genomes by transcription, CTCF and Wapl. Nature 544, 503–507, doi: 10.1038/nature22063 (2017). [DOI] [PMC free article] [PubMed] [Google Scholar]
- 25.Wutz G et al. Topologically associating domains and chromatin loops depend on cohesin and are regulated by CTCF, WAPL, and PDS5 proteins. The EMBO journal 36, 3573–3599, doi: 10.15252/embj.201798004 (2017). [DOI] [PMC free article] [PubMed] [Google Scholar]
- 26.Haarhuis JHI et al. The Cohesin Release Factor WAPL Restricts Chromatin Loop Extension. Cell 169, 693–707 e614, doi: 10.1016/j.cell.2017.04.013 (2017). [DOI] [PMC free article] [PubMed] [Google Scholar]
- 27.Wutz G et al. ESCO1 and CTCF enable formation of long chromatin loops by protecting cohesin(STAG1) from WAPL. eLife 9, doi: 10.7554/eLife.52091 (2020). [DOI] [PMC free article] [PubMed] [Google Scholar]
- 28.Li Y et al. The structural basis for cohesin-CTCF-anchored loops. Nature 578, 472–476, doi: 10.1038/s41586-019-1910-z (2020). [DOI] [PMC free article] [PubMed] [Google Scholar]
- 29.Natsume T, Kiyomitsu T, Saga Y & Kanemaki MT Rapid Protein Depletion in Human Cells by Auxin-Inducible Degron Tagging with Short Homology Donors. Cell reports 15, 210–218, doi: 10.1016/j.celrep.2016.03.001 (2016). [DOI] [PubMed] [Google Scholar]
- 30.Tedeschi A et al. Wapl is an essential regulator of chromatin structure and chromosome segregation. Nature 501, 564–568, doi: 10.1038/nature12471 (2013). [DOI] [PMC free article] [PubMed] [Google Scholar]
- 31.Haarhuis JH et al. WAPL-mediated removal of cohesin protects against segregation errors and aneuploidy. Current biology : CB 23, 2071–2077, doi: 10.1016/j.cub.2013.09.003 (2013). [DOI] [PubMed] [Google Scholar]
- 32.Qiu X et al. Sequential Enhancer Sequestration Dysregulates Recombination Center Formation at the IgH Locus. Molecular cell 70, 21–33 e26, doi: 10.1016/j.molcel.2018.02.020 (2018). [DOI] [PMC free article] [PubMed] [Google Scholar]
- 33.Dai HQ et al. Direct analysis of brain phenotypes via neural blastocyst complementation. Nature protocols 15, 3154–3181, doi: 10.1038/s41596-020-0364-y (2020). [DOI] [PMC free article] [PubMed] [Google Scholar]
- 34.Chen J, Lansford R, Stewart V, Young F & Alt FW RAG-2-deficient blastocyst complementation: an assay of gene function in lymphocyte development. Proceedings of the National Academy of Sciences of the United States of America 90, 4528–4532, doi: 10.1073/pnas.90.10.4528 (1993). [DOI] [PMC free article] [PubMed] [Google Scholar]
- 35.Sayegh CE, Jhunjhunwala S, Riblet R & Murre C Visualization of looping involving the immunoglobulin heavy-chain locus in developing B cells. Genes & development 19, 322–327, doi: 10.1101/gad.1254305 (2005). [DOI] [PMC free article] [PubMed] [Google Scholar]
- 36.Tseng A, Inuzuka H, Gao D, Singh A & Wei W Experimental approaches to investigate the proteasomal degradation pathways involved in regulation of apoptosis. Methods in enzymology 446, 205–223, doi: 10.1016/S0076-6879(08)01612-1 (2008). [DOI] [PubMed] [Google Scholar]
- 37.Chen H et al. BCR selection and affinity maturation in Peyer’s patch germinal centres. Nature 582, 421–425, doi: 10.1038/s41586-020-2262-4 (2020). [DOI] [PMC free article] [PubMed] [Google Scholar]
Associated Data
This section collects any data citations, data availability statements, or supplementary materials included in this article.