
Figure 4. The effect of choice on sampling behaviour is mediated by confidence in experiment 2.
Participants were less likely to change their mind if they showed a strong sampling bias for their initially chosen option in the sampling phase, but this was only the case in the free sampling condition. (A) Sampling bias in favour of the chosen option increases as a function of confidence in the initial choice. Confidence and sampling bias towards the chosen option are both normalized at the participant level in this plot. (B) There is a significant main effect of choice on sampling time difference, such that an option is sampled for longer if it was chosen, and a significant interaction effect of Choice x Confidence, such that options chosen with high confidence are sampled for even longer. (C) There is a main negative effect of sampling bias on change of mind, such that participants were less likely to change their mind in the second decision phase (phase 3) the more they sampled their initially chosen option in the free sampling phase (phase 2). The main effect of sampling bias on change of mind disappears in the fixed sampling condition, which can be seen by the positive interaction term Sampling bias x Fixed sampling which entirely offsets the main effect. The analysis includes a dummy variable ‘Fixed Sampling’ coding whether the trial was in the fixed-viewing condition. (B–C) Plotted are fixed-effect coefficients from hierarchical regression models predicting the sampling time (how long each patch was viewed in the sampling phase) difference between the left and right stimuli. Data points represent regression coefficients for each individual participant. (D) The probability that participants change their mind on the second choice phase is more likely if they looked more at the unchosen option during the sampling phase. The plot shows the probability that participants changed their mind as a function of the time spent sampling the initially chosen option during phase 2. The lines are polynomial fits to the data, while the data points indicate the frequency of changes of mind binned by sampling bias. Note that actual gaze time of the participants is plotted here for both task conditions. The same pattern can be seen when instead plotting the fixed presentation times of the stimuli for the fixed task condition (see Figure 4—figure supplement 2).

Figure 4—figure supplement 1. Confidence in the first choice reduces the total amount of time spent sampling (gazing at the two stimuli) in the free sampling trials in experiment 2.

Figure 4—figure supplement 2. In Figure 4D, we plotted the probability of changes of mind as a function of actual gaze time by participants in the fixed viewing condition.

Figure 4—figure supplement 3. Numerosity has no significant effect on sampling bias in a regression analysis predicting sampling bias with total numerosity (total number of dots present on a trial) included as a predictor.

Figure 4—figure supplement 4. Numerosity has no significant effect on sampling bias in a regression analysis predicting sampling bias with numerosity of the chosen stimulus (dots in the chosen stimulus) included as a predictor.
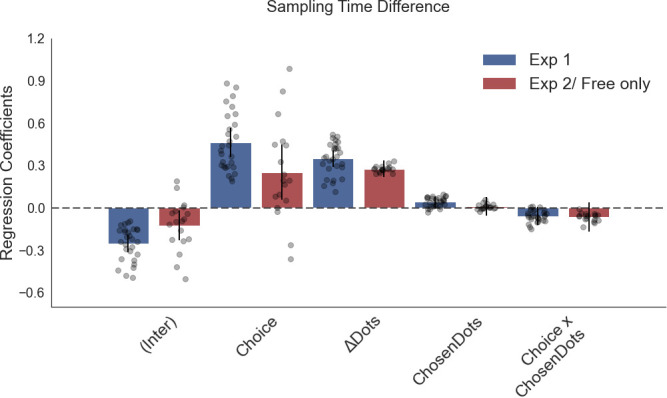
Figure 4—figure supplement 5. Numerosity had a small significant effect on accuracy in the first choice phase in experiment 1, such that participants made more mistakes on trials with high total numerosity (total number of dots).

Figure 4—figure supplement 6. Confidence was not affected by numerosity in a linear regression model.

Figure 4—figure supplement 7. Confidence change in experiment 1 was negatively affected by total numerosity (total number of dots), although it is a small effect.

Figure 4—figure supplement 8. A sampling bias towards the stimulus that participants would end up choosing was found in an independent dataset from a perceptual experiment presented in Sepulveda et al., 2020, and this was not affected by total numerosity ()on a trial.

Figure 4—figure supplement 9. Order of presentation has no significant effect on sampling bias in experiment 2.

Figure 4—figure supplement 10. Choice behaviour in Experiment 2.

Figure 4—figure supplement 11. There was no significant difference in the number of changes of mind from the incorrect to the correct option (A) or in the total number of changes of mind (B) between the free and fixed sampling conditions.

Figure 4—figure supplement 12. Confidence ratings experiment 2.
