Abstract
Electricity can be provided to small-scale communities like commercial areas and villages through microgrid, one of the small-scale, advanced, and independent electricity systems out of the grid. Microgrid is an appropriate choice for specific purposes reducing emission and generation cost and increasing efficiency, reliability, and the utilization of renewable energy sources. The main objective of this paper is to elucidate the combined economic emission dispatch CEED problem in the microgrid to attain optimal generation cost. A combined cost optimization approach is examined to minimize operational cost and emission levels while satisfying the load demand of the microgrid. With this background, the authors proposed a novel improved mayfly algorithm incorporating Levy flight to resolve the combined economic emission dispatch problem encountered in microgrids. The islanded mode microgrid test system considered in this study comprises thermal power, solar-powered, and wind power generating units. The simulation results were considered for 24 hours with varying power demands. The minimization of total cost and emission is attained for four different scenarios. Optimization results obtained for all scenarios using IMA give a comparatively better reduction in system cost than MA and other optimization algorithms considered revealing the efficacy of IMA taken for comparison with the same data. The proposed IMA algorithm can solve the CEED problem in a grid-connected microgrid.
1. Introduction
Microgrid is one of the advanced small-scale centralized electricity systems and it usually contains energy storage resources, Distributed Generation (DG) units, and loads. Microgrids are generally designed and installed nearby energy consumers in a confined community [1]. But there has been a drastic increase in recent years regarding installing renewable energy sources in microgrids, owing to environmental advantages and low cost compared to its counterparts [2]. Microgrid meets different load requirements in residential, commercial, agriculture, and industrial sectors [3]. Microgrids can function under two different modes: grid-connected and islanded modes. In the former mode, the microgrid and main grid are connected, while in the latter the microgrid is isolated from the main grid during an emergency outbreak. It continues its power delivery functions to local loads as usual [4]. There are loads of advantages present in using microgrid reduction of carbon emission and generation cost, thanks to renewable energy sources, and increased reliability and power quality, etc. [5].
Optimal operations and effective planning of electric power generation systems are the two most crucial elements in electric industries. Controlling and operating power systems, cost-efficient load dispatch (Economic Load Dispatch, i.e., ELD) related problems are too much concerning to address [6]. Power system optimization problems that employ ELD are useful in identifying the most suitable, cheap, and seamless operations with the regulation of outputs produced by different power generation units that meet the load demands. ELD has a primary aim to mitigate the overall cost incurred upon power generation without compromising or producing any constraints [7]. ELD determines active power output generated by different power generation systems to attain the objective functions and simultaneously overcome many problems [8]. It is important to develop novel power management algorithms to translate the microgrid as a viable and happening choice compared to traditional power systems [9]. The mitigation of both power generation costs and the emission of environmental pollutants is the sole aim of utility operators. For these goals, two contradictory objectives must be considered. Combined economic emission dispatch (CEED) is utilized to mitigate emission levels from all generating units and costs incurred by the operating units [9].
CEED problem has been discussed earlier by different authors who proposed several optimization techniques to overcome the issue [10]. In [10], the researchers proposed a balanced trade-off method to resolve the ECED (Environment Constrained Economic Dispatch) problem. The study conducted a first-of-its-kind comparative analysis of three methods: Fractional Programming (FP), ECED, and price penalty factor (PPF) to overcome the CEED problem. Chimp Optimization Algorithm (ChOA) was proposed to address the optimal design of microgrid which comprises PV panels, wind turbines, and battery storage systems [11]. Optimization results had been compared with Improved Grey Wolf Optimizer (IGWO) and Grey Wolf Optimizer (GWO). Optimal sizing of photovoltaic cell and solar water heater by considering environmental parameters and fuel-saving was carried out in [12]. Energy and economic analysis of solar energy-based cogeneration system for a building in Saveh City were studied. The researchers simulated the model in a 3-Unit dynamic test system incorporating renewable energy sources. In the study conducted by Alamoush [13], Bernstein-search differential evolution (BSDE) algorithm was proposed to resolve the Dynamic Combined Heat and Power Economic emission Dispatch (DCHPED) generation problem in microgrid comprised of renewable energy sources, fixed nondeferrable and deferrable loads, fossil-fuel combined heat and power units, and thermal energy storage devices. In [14], whale optimization algorithm (WOA) has been applied to carry out the combined economic emission dispatch problem. The simulation was performed by considering four different load sharing scenarios among the distributed energy resources. The researchers also conducted ANOVA and Wilcoxon signed-rank tests to validate the supreme characteristic of WOA. In [15], Stochastic Fractal Search (SFS) algorithm was applied to resolve multiobjective economic emission dispatch problems that arise in combined heat and power (CHP) generation. This study was conducted in large microgrids in which solar-powered generating units, wind power units, and fossil-fuel-powered generating units were installed.
Collective Neuro Dynamic Optimization (CNO) method was proposed in the earlier study. In this study, the authors combined a heuristic approach and projection neural network (PNN) to optimize the scheduling of an electrical microgrid containing ten thermal generators and mitigate the costs incurred upon emission and generation [16]. A mixed-integer nonlinear programming formulation was proposed in [17] to dispatch the distributed generators cohesively. Further, the model was also aimed at fulfilling the water demands and the building's thermal energy requirements in a standalone water energy microgrid.
In [18], Giza Pyramids Construction (GPC) was proposed to implement the optimal design of an isolated microgrid. Net present cost (NPC), Levelized Cost of Energy (LCOE), loss of power supply probability, and availability index were considered objective functions. Modified adaptive accelerated particle swarm optimization (MAACPSO) algorithm was proposed to investigate the grid-tied PV systems reliability [19]. This study focused on the probability analysis and reliability assessment of the components of grid-tied PV systems through IEEE 24 bus integrated with PV system with four different case studies. A first-of-its-kind Sequential Optimization Strategy (SOS) was formulated in the study conducted earlier to allocate active and reactive power to Dispatchable Distributed Generator (DDG) units in an optimal manner. These DDG units are installed in a droop-controlled islanded AC microgrid [20]. The research proposed improved Quantum Particle Swarm Optimization (QPSO) earlier [21] to address the Short-Term Economic Environmental Dispatch (EED) problem in a microgrid. Recently, a multiobjective seeker optimization algorithm has been proposed to analyze the influence of charging and discharging behaviour of electric vehicles and demand side response resources on the economic functioning of PV-connected microgrid systems. The model considered three objectives: power fluctuation between microgrid and main grid, comprehensive operating cost of the microgrid, and utilization rate of photovoltaic energy [22].
In [23], the researchers proposed a mathematical optimization approach to achieve an optimal operation upon economic dispatch in DC microgrid. To allot the schedules for unit commitment and achieve economic dispatch in microgrid, the study conducted earlier [24] proposed an enhanced real-coded genetic algorithm in the enhanced mixed-integer linear programming (MILP) based method. The authors proposed a stochastic model in [25] to manage CHP-based microgrids optimally. The study took economic, reliability, and environmental aspects into consideration. Nonconvex and nonlinear stochastic problems are used to resolve complexity. The Exchange Market Algorithm (EMA) was proposed in a study. This study considered three contradictory objectives through a weighted sum approach to resolving the multiobjective problem as a single-objective problem.
A multiobjective optimal dispatch model was proposed in [26] for a grid-connected microgrid. In this study, the authors considered reducing environmental protection costs and the generation cost of the microgrid with the incorporation of an enhanced PSO algorithm. In [27], a genetic algorithm is applied to optimize the focal area of the parabolic trough concentration photovoltaic/thermal system. The objective function was considered a combination of electrical efficiency and thermal efficiency. A parabolic trough concentrating photovoltaic thermal (CPVT) was utilized to afford the energy required for a residential building [28]. CPVT was used as a source of heat and cooling and electrical energy for the building and simulation was carried out using TRNSYS software. Samy et al. addressed the problem of power outages in distant districts by taking advantage of the available renewable energy resources in the contiguous environment [29]. Hybrid Firefly and Harmony Search optimization technique (HFA/HS) was implemented to improve the net present cost of the proposed hybrid system which comprises photovoltaic (PV), wind turbine (WT), and fuel cell (FC). MINLP, a novel optimization model, was proposed in [30] to resolve the economic dispatch problem of a microgrid which contains numerous units of wind turbines (WTs), heat-only units, traditional power generators, photovoltaic (PV) systems, CHP units, and battery storage systems under certain uncertainties. In the study conducted earlier [31], MBGSA (Memory-Based Gravitational Search Algorithm) was proposed to overcome the ELD problem. In one of the research investigations [32], a novel Multiobjective Virus Colony Search (MOVCS) was proposed to elucidate the multiobjective dynamic economic emission dispatch (DEED) problem. This model aims to mitigate the emissions produced by fossil-fuel power generators and simultaneously reduce the cost incurred upon wind-thermal electrical energy costs. In [33], HOMER software is used to model and simulate a wind-solar hybrid system independent of the national grid in the northwest of Iran. A multiobjective particle swarm optimization technique is proposed to optimize the sizing of a green energy system connected to a randomly disrupted grid [34]. The energy cost for evaluating hybrid system economies, the loss of probability of power supply (LPSP) for reliability assessments, and the System Surplus Energy Rates (SSER) were considered objective functions for evaluating hybrid system compatibility and efficiency. A sustainable energy distribution configuration for microgrids integrated into the national grid using back-to-back converters in a renewable power system was examined in [35]. Different scenarios of several sustainability schemes of power management in microgrids were analyzed.
SGEO (Social Group Entropy Optimization) technique was proposed in [36] to resolve Fuel Constrained Dynamic Economic Dispatch (FCDED) with Demand Side Management (DSM). The technique combined the pumped hydrostorage plant with renewable energy sources. This research used a stochastic fractal search algorithm to overcome the biobjective combined heat and power economic dispatch (CHPED) problem [37].
In [38], mayfly algorithm (MA) was proposed by Dr. Konstantinos Zervoudakis in 2021. In this paper, an improved mayfly optimization algorithm was investigated with the help of a microgrid model under varying scenarios. The results were contrasted against recent state-of-the-art algorithms that also employed the same microgrid model.
The contributions of the current research paper are summarized herewith.
An improved version of the mayfly optimization algorithm incorporating Levy flight is proposed to elucidate the microgrid test system's CEED problem.
An improved mayfly optimization algorithm is proposed in addition to Levy flight to overcome the CEED problem encountered in microgrid test system.
Levy flight has been leveraged in this study since it possesses huge advantages in not engaging local optimal. An optimal trade-off is provided by the proposed algorithm between exploration and exploitation phases.
The authors validated the supremacy of the proposed algorithm in terms of resolving the CEED problem under two different objective functions that involve advanced energy sources.
Compared with existing population-based optimization tools such as PSO and GA, only a few control parameters exist in IMA. This feature helps in making it the best optimization procedure. IMA-based CEED was authenticated as a unique and robust technique since it incurred less total generation cost than the solution even after conducting multiple random trials.
2. Mathematical Formulation of CEED for Microgrid
2.1. Combined Economic Emission Dispatch (CEED)
The simultaneous mitigation of economic and environmental dispatch objective functions remains the primary objective for the CEED problem in the microgrid. In other terms, the total fuel cost must be reduced, while at the same time the emission levels should also be mitigated without compromising the constraints. So, it is suggested to formulate CEED as a single optimization problem as given herewith [9].
| (1) |
Here, TC denotes the total operating cost that should be minimized. The fuel cost of the ith generator is represented as Fi(PGi), the emission level of the ith generator is represented as Ei(PGi), PGi denotes the ith generating unit's output power, and finally, NG corresponds to the whole generating unit count.
2.1.1. Minimization of Fuel Cost
In general, the fuel cost function is denoted through the quadratic equation given below [9]:
| (2) |
Here, Ft corresponds to overall fuel cost incurred in terms of $ and xi($/h), yi($/MWh), and zi($/MW2h) correspond to the cost coefficients of ith generating unit.
2.1.2. Minimization of Emission
When fossil fuels are used, the generators emit different sorts of pollutants. So, pollution mitigation forms the primary goal of most power system operations. Equation (3) denotes the expression for total emission from [5, 9]:
| (3) |
Here, Et denotes the overall emission and αi (kg/h), βi(kg/(MWh)), γi(kg/(MW2h)) correspond to the ith generating unit's emission coefficients.
2.1.3. Total Generation Cost of CEED Problem
It is possible to convert the dual-objective optimization problem, focusing emission, and fuel cost, into a single-objective optimization problem with the induction of PPF (price penalty factor) as given earlier [9]:
| (4) |
Here, Λ denotes the price penalty factor (PPF), which is calculated as a ratio between fuel cost and the emission of the corresponding generating unit ($/kg). PPFs are of different types, while in the current study, the authors use min-max types sourced from [5, 9] for comparison. Following is the equation for min-max type [9]:
| (5) |
where PGimax and PGimin Here, Λ denotes the ratio between maximum fuel cost and maximum emission of the corresponding generator in $/kg [9]. The maximum and minimum output power of the generator combines emission with fuel cost. Afterwards, TC corresponds to the total operating cost of $.
The following is the list of steps to be followed to determine the price penalty factor for a specific load demand [39].
The ratio between minimum fuel cost and the maximum emission of every generating unit should be determined.
Price Penalty Factor values are sorted out in ascending order.
The maximum capacity of every unit (PGimax) one is added at a time that starts from the lowest Λi, until ∑PGimax ≥ PD.
Then, Λi, which has an association with the lowest unit in this process, remains the tentative PPF value (Λ) for the load under consideration.
So, a modified PPF (Λ) is utilized to arrive at the exact value for specific load demand based on the interpolation of Λ values corresponding to their load demand values.
2.2. Cost Functions of Renewable Energy Sources
Across the globe, renewable energy sources are the foremost choice of transmission when energy is produced, compared to traditional generators. In such a scenario, solar and wind power can be denoted as negative loads and can be used to mitigate the total load demand in the system [9]. However, the economic dispatch solution is considered a base to distribute the rest of the load demands on traditional generators. In the current study, the CEED solution for the microgrid takes cost functions of wind and solar-powered generating units into account. From [9], the input data for cost and emission coefficients are considered.
2.2.1. Cost Function of Wind Power Generating Unit
Current economic analysis is conducted for wind-based power generation and the specific cost can be determined with inputs, operation, maintenance, and equipment costs. This cost function is expressed as per [5, 9]:
| (6) |
Here, Pw denotes the wind power produced in terms of kW, r corresponds to the interest rate, a denotes the Annuitization coefficient, N corresponds to lifetime investment in terms of years, and lp and OE correspond to the costs incurred upon investment per unit installed power ($/kW) and operating and maintenance costs per unit installed power ($/kW), respectively.
The 24-hour data for the wind power generating unit is considered from [5]. The parameters required for wind power cost function are chosen from [5, 9].
2.2.2. Cost Function of Solar Power Generating Unit
Similar to wind power, solar-powered generating unit's cost function is expressed as in [5, 9]:
| (7) |
where Ps is the output power from the solar-powered generating unit, r corresponds to interest rate, N denotes lifetime investment in terms of years, and lp and OE correspond to investment costs made upon per unit installed power ($/kW) and operating and maintenance costs per unit installed power ($/kW), respectively.
The 24-hour data of the solar power generating unit is considered [5]. The parameters required for solar power cost function are chosen from [5, 9].
2.3. Total Cost of CEED for Microgrid
The equation for the total CEED cost for the microgrid is shown below. This value gets minimized based on the cost functions regarding wind and solar power [9].
| (8) |
2.4. Constraints
The researcher considered both generator capacity and power balance constraints to contrast with existing optimization algorithms.
2.4.1. Islanded Mode of Microgrid
The current study considered islanded mode microgrid to compare with the optimization results achieved in [5, 9]. There is no trade-off for the power between the main grid and the microgrid in this mode. So, the microgrid needs to fulfil the local or confined community load demands.
2.4.2. Power Balance Constraint
The load demand must be equal to that of the total power generation [9].
| (9) |
Here, PD corresponds to the total load demand.
2.4.3. Generation Capacity Constraints
Every generating unit's output power gets flanked by both lower and upper bounds [9].
| (10) |
Here, PGimin and PGimax correspond to the minimum and maximum output powers of the ith generating unit correspondingly.
3. Improved Mayfly Algorithm
Mayfly algorithm takes its inspiration from the social behaviour of mayflies, especially how they mate with each other [38]. It is assumed that mayflies are instantly considered adults as soon as the eggs are hatched. Leaving beside the period of their life, only the fittest mayflies tend to survive. Each mayfly has a position in search space that corresponds to a solution that overcomes the problem. RAND functions are utilized in conventional mayfly algorithm to produce novel variables that lead to local optimal. To increase MA's searching ability and create an optimal solution, the researchers integrated MA with Levy flight. If a Levy flight-based approach is utilized for system identification, it achieves rapid convergence and does not entail derivative information [40], attributed to stochastic random search, in line with the Levy flight concept [41]. Levy flight contributes heavily to increasing the optimal solution's local search avoidance and local trapping [42]. The flowchart of the proposed IMA algorithm is shown in Figure 1.
Figure 1.
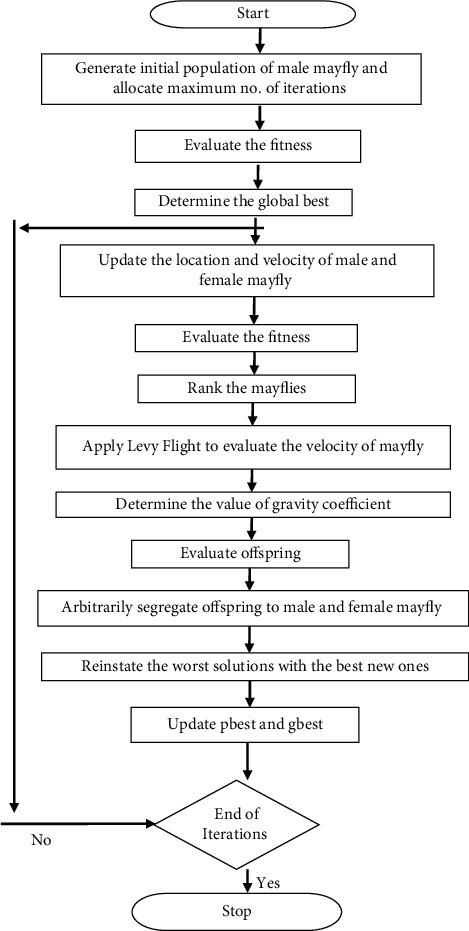
Flowchart of the proposed improved mayfly optimization algorithm.
The steps required for the proposed mayfly optimization algorithm works are described as follows:
Step 1 . —
Two mayfly sets, each representing a male and a female population, should be generated randomly. Then, every mayfly is arbitrarily placed in problem space as a candidate solution which is denoted by a d-dimensional vector PGi=(PG1,…, PGd). Then the performance is assessed based on the predefined objective function f(CT(PGi)).
Step 2 . —
A mayfly's velocity v=(v1,…, vd) is initialized through its positional change. Its direction is decided as a hybrid interaction between individuals and the social flying experiences. To be specific, every mayfly tends to alter its trajectory in alignment with its personal best position (pbest) so far. It also alters based on the best position achieved by any other mayfly present in the swarm so far (gbest).
Step 3 . —
The population of the male mayflies is initialized as PGmi(i=1,2,…, NG) with velocities vmi. The male mayflies, gathered in swarms, denote that the position of every mayfly gets altered in alignment with its individual's experience and that of the neighbor's. PGit is assumed to be the current position of mayfly i in search space at time step t and the position gets altered with the addition of velocity vit+1, to the current position. This notation is formulated as given herewith.
(11) Male mayflies are considered as present a few meters above the water, with PGim0 U(PGmmin, PGmmax), performing nuptial dance. It can be assumed that these mayflies lack great speeds due to constant movements. This results in the calculation of a male mayfly's velocity i as follows [38]:
(12) Here, vijt corresponds to mayfly i's velocity in dimension j=1, ..., n at time step t, PGmijt denotes the mayfly's ith position in dimension j at time step t, a1 and a1 correspond to positive attraction constants utilized in scaling up the contribution of cognitive and social components, respectively. Furthermore, pbesti denotes the mayfly ith best position which it had ever visited. Based on the minimization problems under consideration, the personal best position pbestij at the next time step t+1 is determined as given herewith.
(13) Following is the equation for the global best position gbest at time step t.
(14) Here β represents the fixed visibility coefficient used in (7). It is utilized to confine the visibility of the mayfly to others. Further, rp denotes the Cartesian distance between PGi and pbesti and rg corresponds to the Cartesian distance between PGi and gbest. Following is the equation used to determine these distances.
(15) where PGmij corresponds to the jth element of mayfly i and Xi denotes the pbesti or gbest. If the algorithm needs to function appropriately, then the best mayflies present in the swarm must continuously perform the up-and-down nuptial dance. So, the velocity of these best mayflies must be kept on changing which is calculated as follows [38]:
(16) Here, d denotes the coefficient of nuptial dance whereas the random value in the range of [−1, 1] is denoted by r.
Step 4 . —
In this step, the female mayfly population is initialized PGfi(i=1,2,…, NG) with velocities vfi. Female mayflies tend not to gather as a swarm alike males. Instead, it tends to fly towards its male counterparts for mating. PGfit is assumed as the current position of female mayfly i in search space at time step t, while its position gets altered with the addition of velocity vit+1 to the current position, i.e.,
(17) Here, due to PGfi0 U(PGfmin, PGfmax) one cannot randomize the attraction process. So, the model is decided to be a deterministic process. As a result, their velocities are determined as given herewith in the presence of minimization problems [38].
(18) Here, vijt corresponds to the female mayfly's velocity i in dimension j=1, ..., n at time step t, PGfijt denotes the female mayfly i's position in dimension j at time step t, and a2 denotes the positive attraction constant whereas it remains a fixed visibility coefficient. Further, the gravity coefficient is denoted by g, and rmf corresponds to the Cartesian distance between male and female mayflies. Here fl corresponds to a random walk coefficient and r denotes the random value in the range of [−1, 1]. This value is determined based on (15).
Step 5 . —
In this step, the Levy flight approach is involved in calculating the velocity of a mayfly candidate solution. Equation (19) is used to determine the velocity of the mayfly candidate solution [38].
(19) This stage uses the Levy flight approach to alter the position of the global finest component. Though the Levy flight method has been used for exploration purposes so far, it is associated with a specific search.
Here, Vmax is calculated as follows:
(20) Here, δ corresponds to a scale factor designed in alignment with the search space element. The author fixed δ as 1.
(21) Further, σ is calculated as follows [42]:
(22) Here, Γ(x)=(x − 1)!, r5 corresponds to r6 indiscriminate numbers that lie in the range of [0, 1], and 1 < β ≤ 2, where there is a constant value, i.e., 1.5 incorporated for β in the current study [40–42].
Levy(λ) denotes the step length, incorporated by Levy distribution with infinite variance and mean values with 1 < λ < 3. λ corresponds to the distribution factor, whereas the gamma distribution function is denoted by Γ(.).
Step 6 . —
Gravity coefficient value calculation [38]:
Gravity coefficient g value can be considered a fixed number that lies in (0, 1].
(23) where gmax, gmin correspond to maximum and minimum values which can be taken for the gravity coefficient, and iter denotes the algorithm's current iteration, whereas the maximum count of iterations is denoted by itermax.
Step 7 . —
Mayflies are mated and the offspring are evaluated.
The mating process between the mayflies is discussed by the crossover operator as given herewith. From the male and female population, each one parent is selected through the same selection process, i.e., the attraction of females towards the males. Specifically, fitness function-based or random selection of the parents can be made. In terms of the fitness function, the best female mates with the best male, the second-best female with the second-best male, etc. This crossover results in two offsprings for which the formulation is given herewith [38]:
(24) Here, male denotes the male parent, and female corresponds to the female parent, while L is a random value within a specific range. The initial velocity of the offspring is fixed as zero.
3.1. The Pseudocode of the Improved Mayfly Algorithm
The pseudocode of the improved mayfly algorithm is devised as follows:
Formulate the objective function f(CT(PGi)), PGi=(PGi1,…,PGid)T
Set the male mayfly population PGmi(i=1,2,…, NG) and velocities vmi
Set the female mayfly population PGfi(i=1,2,…,NG) and velocities vfi
Evaluate solutions
Determine global best gbest
Do While stopping criteria are not meet
Update velocities and solutions of males and females
Evaluate solutions
Rank the mayflies
Apply Levy flight approach to evaluate the velocity of a mayfly candidate solution
Determine the value of the gravity coefficient
Mate the mayflies
Evaluate offspring
Separate offspring to male and female randomly
Reinstate worst solutions with the best new ones
Update pbest and gbest
End While
Post-process results and visualization
4. Results and Discussion
The current study used a microgrid model with three conventional generators, solar, and wind units. One of the generators is a combined heat and power generator, whereas the other two conventional generators are synchronous. As per [9], three conventional generators and their daily load profile details were used in the current study. During the improved mayfly optimization algorithm implementation, various parameters were chosen for the optimal search process.
In order to assess the proposed IMA, various scenarios were considered as given herewith.
All sources included
Thermal power generating units without renewable sources
Thermal power generating units with wind source only
Thermal power generating units with solar source only
4.1. Case 1: All Sources Included
In the first case, the proposed IMO was utilized in the elucidation of the CEED problem in the microgrid and the case considered both wind and solar energy-powered generators. The optimization results were obtained using the proposed IMA and contrasted with the results obtained from other optimization algorithms. The generation cost calculated by the proposed IMA and other published methods is shown in Table 1 for comparative purposes. Figure 2 shows the convergence characteristics required to mitigate the total generation cost incurred from MA and IMA algorithms. As shown in Figure 2, when cross-verifying the proposed algorithm's cost convergence characteristic, a quicker and more smooth transition was obtained than other optimization techniques considered. Further, Figure 3 shows the comparison results of total generation cost saving from CEED problem when using the mayfly algorithm and other such optimization algorithms. The results achieved from the simulation reveal that the proposed IMA is superior to MA and other optimization algorithms. Moreover, the total generation cost obtained using the proposed IMA algorithm was less than other optimization algorithms. In Figure 4, the total generation cost was obtained using IMA with MA and other published algorithms. It is observed from Figure 4 that improved mayfly optimization algorithm enhanced the total generation cost by 19.68%, 14.37%, 3.08%, 3.05%, 2.17%, 1.88%, 0.94%, and 0.23% over RGM, ACO, CSA, ISA, HIS, IAHS, MHS, and MA, respectively.
Table 1.
Optimal generation schedule of microgrid for case 1.
| Time | RGM cost | ACO cost | CSA cost | ISA cost | IHS cost | IAHS cost | MHS cost | MA | IMA ($/h) |
|---|---|---|---|---|---|---|---|---|---|
| (h) | ($/h) [5] | ($/h) [5] | ($/h) [5] | ($/h) [5] | ($/h) [9] | ($/h) [9] | ($/h) [9] | ($/h) | |
| 1 | 8529 | 7250 | 7153 | 7153 | 7090.5 | 7058.0 | 6942.8 | 6857.4 | 6824.6 |
| 2 | 8648 | 7511 | 7203 | 7203 | 7151.1 | 7130.2 | 7010.3 | 6904.7 | 6891.4 |
| 3 | 8675 | 7704 | 7278 | 7278 | 7170.8 | 7151.5 | 7100.7 | 7015.6 | 6994.8 |
| 4 | 8795 | 7742 | 7280 | 7285 | 7159.6 | 7130.8 | 7049.6 | 7020.3 | 7004.8 |
| 5 | 8758 | 8211 | 7545 | 7545 | 7528.2 | 7450.1 | 7377.2 | 7334.1 | 7309.7 |
| 6 | 8848 | 8459 | 7723 | 7679 | 7600.1 | 7572.2 | 7553.3 | 7544.2 | 7537.6 |
| 7 | 8964 | 8406 | 7457 | 7457 | 7444.2 | 7423.8 | 7294.1 | 7207.3 | 7189.5 |
| 8 | 9308 | 7923 | 7138 | 7138 | 7051.0 | 7050.3 | 6935.6 | 6879.7 | 6851.3 |
| 9 | 9609 | 9040 | 7731 | 7731 | 7660.3 | 7640.9 | 7576.4 | 7528.1 | 7505.8 |
| 10 | 10049 | 9599 | 7920 | 7937 | 7851.5 | 7845.4 | 7770.8 | 7752.6 | 7731.2 |
| 11 | 11520 | 11184 | 9231 | 9231 | 9152.0 | 9150.0 | 9073.4 | 9025.3 | 9006.8 |
| 12 | 12098 | 11616 | 9470 | 9470 | 9394.3 | 9381.3 | 9314.3 | 9271.4 | 9253.7 |
| 13 | 10676 | 10320 | 8482 | 8482 | 8400.3 | 8374.4 | 8326.2 | 8297.6 | 8273.9 |
| 14 | 9982 | 9707 | 8186 | 8186 | 8135.4 | 8119.9 | 8025.4 | 7758.9 | 7729.4 |
| 15 | 9569 | 9351 | 8154 | 8159 | 8100.6 | 8090.5 | 7984.4 | 7903.2 | 7892.7 |
| 16 | 9030 | 8469 | 7622 | 7626 | 7550.5 | 7539.6 | 7457.9 | 7419.7 | 7401.4 |
| 17 | 8872 | 8189 | 7526 | 7525 | 7470.6 | 7440.2 | 7362.6 | 7305.8 | 7291.3 |
| 18 | 9273 | 9061 | 8132 | 8131 | 8050.8 | 8040.4 | 7956.6 | 7904.3 | 7889.5 |
| 19 | 9990 | 9852 | 8652 | 8636 | 8549.6 | 8511.0 | 8462.3 | 8445.7 | 8436.1 |
| 20 | 12646 | 11897 | 9846 | 9811 | 9760.6 | 9710.0 | 9690.9 | 9681.4 | 9675.8 |
| 21 | 11496 | 11101 | 9383 | 9383 | 9249.9 | 9219.7 | 9221.6 | 9217.8 | 9216.1 |
| 22 | 9534 | 9488 | 8371 | 8370 | 8300.8 | 8281.4 | 8194.5 | 8146.7 | 8122.3 |
| 23 | 8667 | 8077 | 7572 | 7572 | 7463.7 | 7440.1 | 7403.1 | 7389.6 | 7378.4 |
| 24 | 8517 | 7498 | 7254 | 7262 | 7225.8 | 7195.7 | 7070.8 | 6991.3 | 6973.5 |
| Total | 232053 | 217655 | 192309 | 192250 | 190512.3 | 189947.5 | 188154.4 | 186802.7 | 186381.6 |
Figure 2.
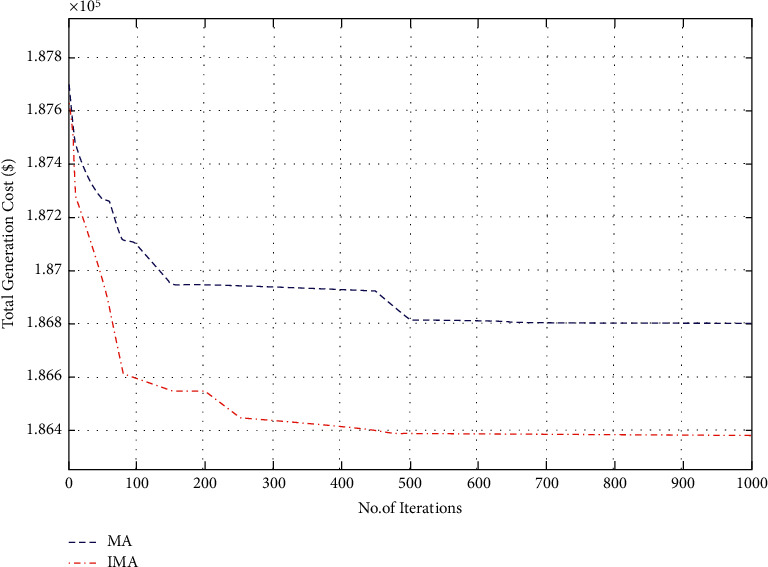
Convergence characteristics for total generation cost (case I).
Figure 3.
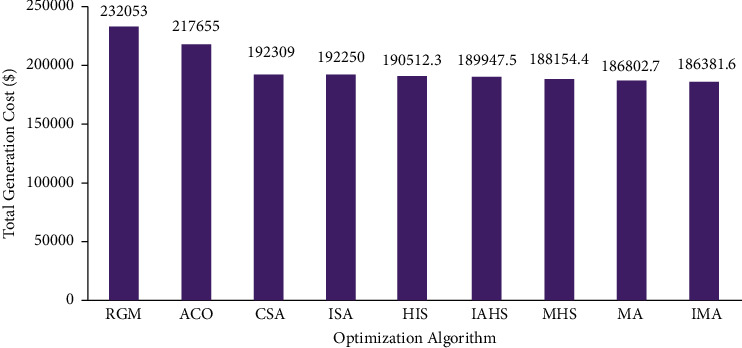
Comparison of total generation cost for case 1.
Figure 4.
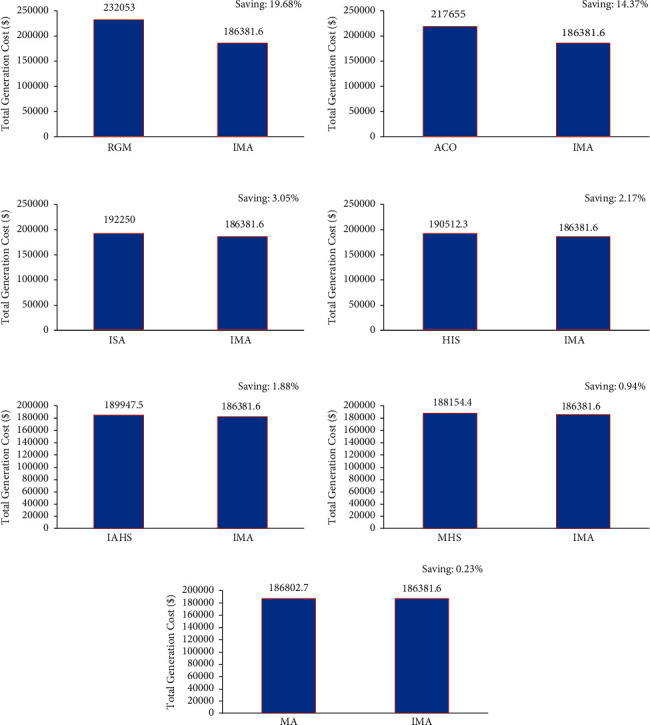
Total generation cost saving of CEED problem for case 1.
4.2. Case 2: Thermal Power Generating Units without Renewable Sources
In this case, the mayfly optimization algorithm was utilized to resolve the CEED problem in the microgrid. The case took a total of 3 fossil-fuel-powered thermal generation units under consideration. The optimization results achieved by IMA were contrasted with other such algorithm results. Table 2 shows the total generation cost achieved by the proposed IMA and other such optimization algorithms. The cost convergence profile results are shown in Figure 5 for the proposed IMA and other optimization algorithms. From the results, it can be understood that IMA has promptly converged to the optimal outcome. The comparison results of total generation cost savings are shown in Figure 6 for the CEED problem when using IMA. It shows that IMA achieved better results than MA and other optimization algorithms. The comparison of total generation cost savings obtained using MA and other published algorithms is presented in Figure 7. Figure 7 infers that the total generation cost improved when using the IMA algorithm by 18.52%, 14.67%, 2.93%, 3.3%, 3.27%, 1.32%, and 0.94% over RGM ACO, CSA, ISA, MHS, and MA, respectively. Furthermore, the total generation cost obtained in case 1 can be less than in case 2 due to incorporating renewable energy sources in a microgrid.
Table 2.
Optimal generation schedule of microgrid for case 2.
| Time | RGM cost | ACO cost | CSA cost | ISA cost | MHS | MA | IMA ($/h) |
|---|---|---|---|---|---|---|---|
| (h) | ($/h) [5] | ($/h) [5] | ($/h) [5] | ($/h) [5] | ($/h) [9] | ($/h) | |
| 1 | 8490 | 7317 | 7179 | 7179 | 6977.4 | 6849.7 | 6810.2 |
| 2 | 8528 | 7694 | 7365 | 7367 | 7194.4 | 7089.6 | 7061.3 |
| 3 | 8592 | 7922 | 7479 | 7499 | 7310.3 | 7223.8 | 7198.5 |
| 4 | 8675 | 8117 | 7598 | 7608 | 7429.5 | 7351.7 | 7319.3 |
| 5 | 8756 | 8318 | 7721 | 7722 | 7550.8 | 7448.2 | 7416.7 |
| 6 | 8878 | 8600 | 7849 | 7851 | 7675.4 | 7567.1 | 7534.3 |
| 7 | 9005 | 8768 | 7978 | 7978 | 7802.5 | 7731.8 | 7707.4 |
| 8 | 9167 | 8998 | 8110 | 8110 | 7933.7 | 7861.8 | 7829.1 |
| 9 | 10527 | 10406 | 8943 | 8943 | 8774.3 | 8697.4 | 8669.1 |
| 10 | 11867 | 11347 | 9540 | 9540 | 9380.9 | 9304.8 | 9275.4 |
| 11 | 12664 | 12032 | 9851 | 9850 | 9696.6 | 9612.5 | 9590.1 |
| 12 | 13511 | 12476 | 10170 | 10170 | 10020.0 | 9973.4 | 9942.8 |
| 13 | 12664 | 12032 | 9850 | 9746 | 9696.6 | 9668.2 | 9651.6 |
| 14 | 11160 | 10889 | 9238 | 9230 | 9074.4 | 8994.6 | 8971.3 |
| 15 | 10009 | 9936 | 8657 | 8675 | 8483.5 | 8401.7 | 8375.4 |
| 16 | 9167 | 8998 | 8110 | 8109 | 7933.7 | 7894.6 | 7869.2 |
| 17 | 8875 | 8599 | 7849 | 7849 | 7675.6 | 7632.8 | 7605.2 |
| 18 | 9347 | 9186 | 8244 | 8244 | 8067.5 | 7992.7 | 7969.1 |
| 19 | 10009 | 9936 | 8657 | 8657 | 8483.5 | 8401.8 | 8372.4 |
| 20 | 12664 | 12032 | 9851 | 9847 | 9696.6 | 9613.8 | 9589.5 |
| 21 | 11495 | 11197 | 9388 | 9388 | 9226.1 | 9148.7 | 9129.2 |
| 22 | 9540 | 9479 | 8377 | 8379 | 8203.0 | 8115.3 | 7991.5 |
| 23 | 8675 | 8117 | 7598 | 7598 | 7429.5 | 7349.3 | 7317.6 |
| 24 | 8515 | 7491 | 7265 | 7260 | 7082.8 | 7005.4 | 6974.1 |
| Total | 240780 | 229887 | 202867 | 202799 | 198798.4 | 196930.7 | 196170.3 |
Figure 5.
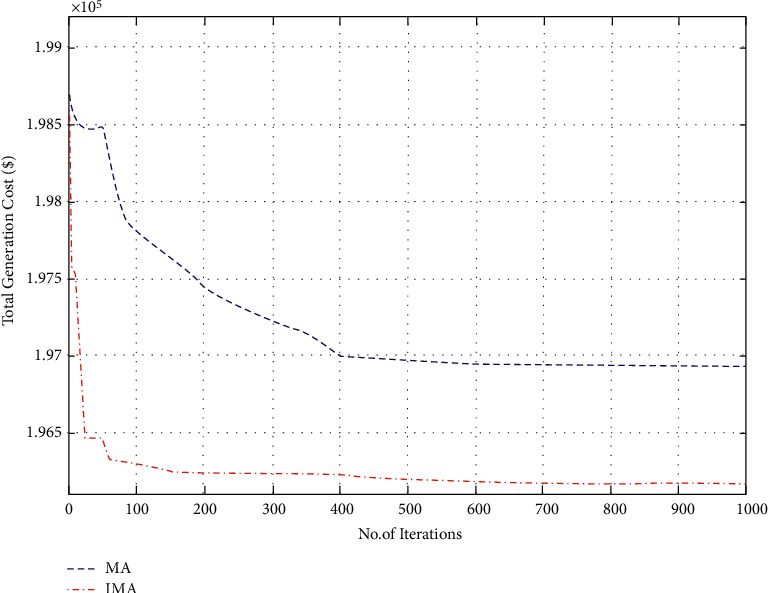
Convergence characteristics for total generation cost (case II).
Figure 6.
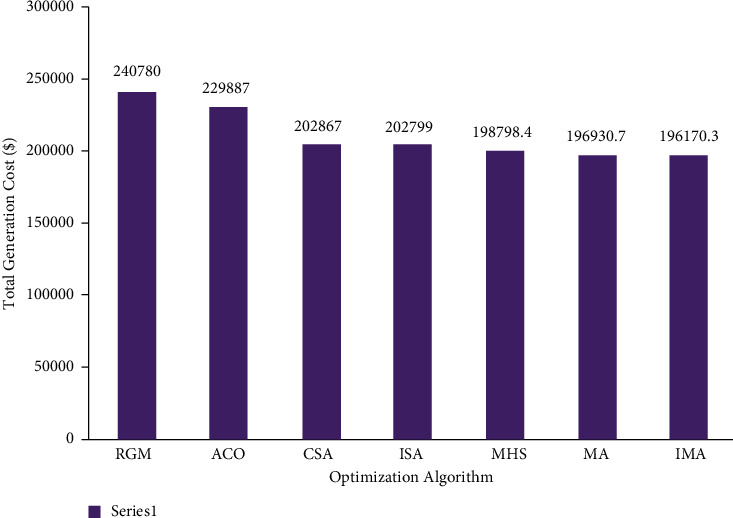
Comparison of total generation cost for case 2.
Figure 7.
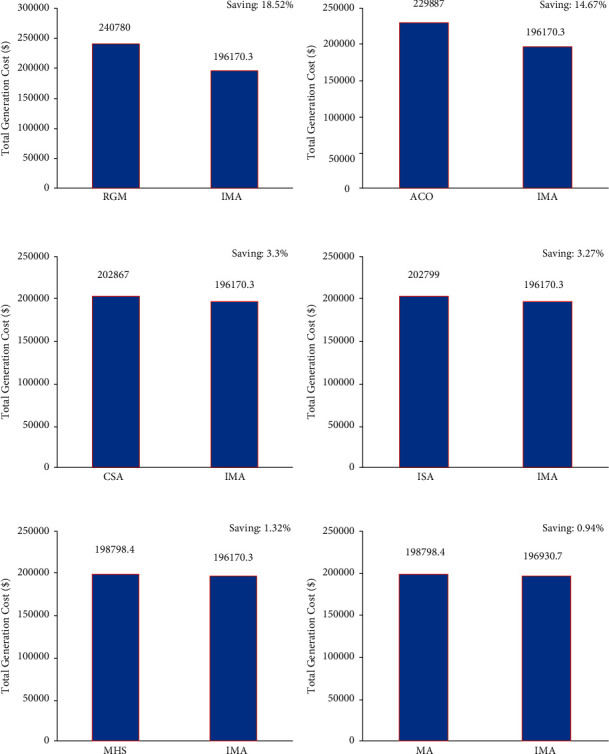
Total generation cost saving of CEED problem for case 2.
4.3. Case 3: Thermal Power Generating Units with Wind Sources Only
Improved mayfly optimization algorithm was deployed in this case to resolve the CEED problem found in microgrids. This case considered fossil-fuel-powered thermal generators in addition to wind sources. IMA and other models (MA, IHS, CSA, and ISA algorithms) were simulated, and the results were compared. Table 3 shows the generation cost calculated for IMA and other such optimization algorithms. In Figure 8, the author shows the cost convergence characteristic for the optimization algorithms under comparison and the proposed IMA.
Table 3.
Optimal generation schedule of microgrid for case 3.
| Time | CSA cost | ISA cost | MHS | MA | IMA ($/h) |
|---|---|---|---|---|---|
| (h) | ($/h) [5] | ($/h) [5] | ($/h) [9] | ($/h) | |
| 1 | 7153 | 7152 | 6943.4 | 6851.3 | 6819.6 |
| 2 | 7203 | 7199 | 7010.5 | 6917.4 | 6882.7 |
| 3 | 7279 | 7279 | 7099.6 | 7012.6 | 6990.8 |
| 4 | 7235 | 7235 | 7050.2 | 6972.8 | 6943.5 |
| 5 | 7544 | 7545 | 7377.2 | 7293.5 | 7269.3 |
| 6 | 7724 | 7724 | 7553.4 | 7476.8 | 7435.4 |
| 7 | 7606 | 7606 | 7439.4 | 7355.1 | 7321.9 |
| 8 | 7443 | 7443 | 7278.5 | 7194.3 | 7162.8 |
| 9 | 8364 | 8364 | 8190.1 | 8101.6 | 7784.2 |
| 10 | 9006 | 9006 | 8840.7 | 8753.4 | 8729.1 |
| 11 | 9454 | 9461 | 9295.8 | 9211.8 | 9178.6 |
| 12 | 9581 | 9581 | 9425.9 | 9346.9 | 9313.4 |
| 13 | 9408 | 9407 | 9248.7 | 9168.4 | 9132.8 |
| 14 | 8933 | 8933 | 8766.3 | 8679.5 | 8643.7 |
| 15 | 8427 | 8427 | 8252.3 | 8162.9 | 8123.1 |
| 16 | 7756 | 7758 | 7584.2 | 7495.4 | 7461.8 |
| 17 | 7761 | 7761 | 7590.1 | 7503.9 | 7481.6 |
| 18 | 8194 | 8193 | 8017.2 | 7927.1 | 7893.9 |
| 19 | 8636 | 8644 | 8461.9 | 8361.8 | 8329.2 |
| 20 | 9845 | 9842 | 9690.7 | 9613.9 | 9581.3 |
| 21 | 9383 | 9383 | 9221.8 | 9139.6 | 9107.9 |
| 22 | 8371 | 8325 | 8194.7 | 8127.4 | 8094.9 |
| 23 | 7572 | 7571 | 7403.7 | 7317.8 | 7293.5 |
| 24 | 7254 | 7254 | 7070.8 | 6976.7 | 6943.1 |
| Total | 197132 | 197093 | 193006.9 | 190962 | 189918 |
Figure 8.
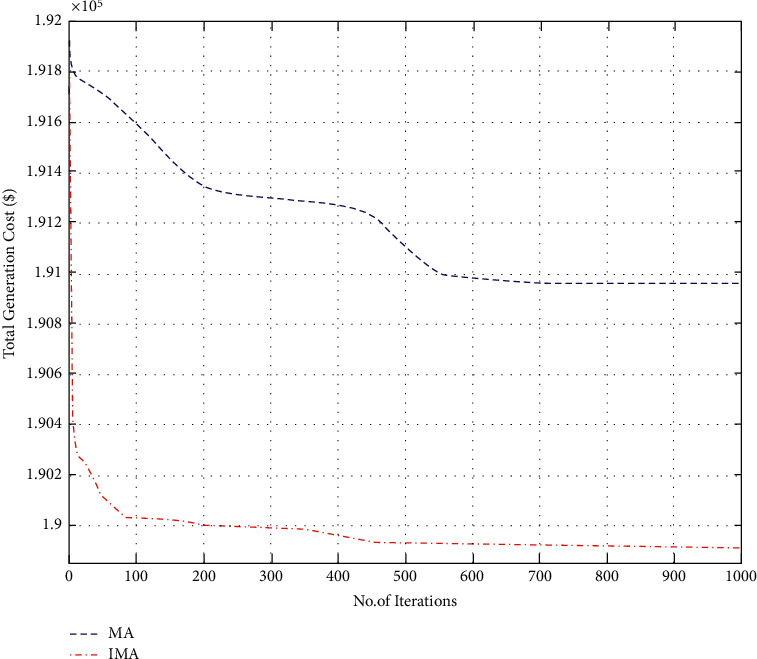
Convergence characteristics for total generation cost (case III).
Further, Figure 8 also provides an inference; i.e., the convergence characteristic of the proposed LISA strategy II was smooth and quick compared to other strategies. In Figure 9, the researcher compared the total cost saving of IMA and other optimization algorithms from the CEED problem. It is observed from the application results that IMA yielded less total generation cost compared to MA, IHS, CSA, and ISA algorithms. Figure 10 shows the comparison results of operation cost savings obtained using IMA and other published algorithms. It is observed from Figure 10 that IMA improved the operation cost by 3.66%, 3.64%, 1.6%, and 0.55% over CSA, ISA, MHS, and MA, respectively. Further, the total generation cost obtained in this case remains lower than in case 2 because of integrating a wind-powered energy source with the microgrid.
Figure 9.
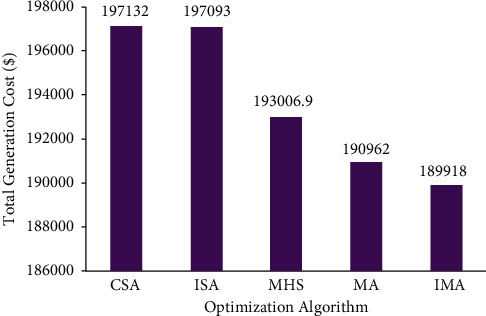
Comparison of total generation cost for case 3.
Figure 10.
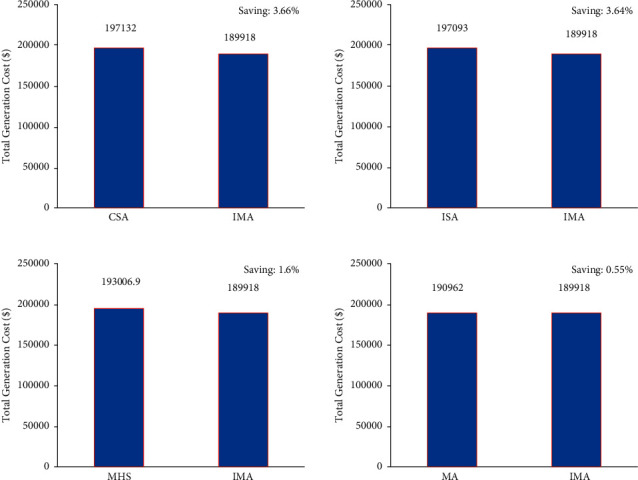
Total generation cost saving of CEED problem for case 3.
4.4. Case 4: Thermal Power Generating Units with Solar Source Only
The case scenario considered fossil-fuel-powered thermal generating units with solar sources. In this scenario, improved mayfly optimization algorithm was selected to resolve the CEED problem found in microgrids. Simulation results obtained using an improved mayfly optimization algorithm are compared with the outcomes attained by MA and other such algorithms. The total generation cost of the improved mayfly optimization algorithm and other optimization algorithms is presented in Table 4. Figure 11 represents the convergence characteristics obtained to minimize total generation cost using MA and IMA. From Figure 11, it is concluded that the proposed IMA provides steady and quick convergence characteristics. Figure 12 show the comparison results of total generation cost saving achieved by IMA and other optimization algorithms for CEED problem found in microgrids. It is observed from the optimization results that an improved mayfly algorithm provides less total generation cost than other optimization techniques. Figure 13 shows the optimization results of total generation cost saving obtained using IMA and other published metaheuristic optimization algorithms. Figure 13 infers that the proposed IMA algorithm enhanced the total generation cost by 18.5%, 14.7%, 3.44%, 3.41%, 1.43%, and 0.41% over RGM, ACO, CSA, ISA, MHS, and MA, respectively. The authors also conclude that the total generation cost is less in this scenario than in case 2 because of the incorporation of solar-powered energy sources with the microgrid.
Table 4.
Optimal generation schedule of microgrid for case 4.
| Time | RGM cost | ACO cost | CSA cost | ISA cost | MHS | MA | IMA ($/h) |
|---|---|---|---|---|---|---|---|
| (h) | ($/h) [5] | ($/h) [5] | ($/h) [5] | ($/h) [5] | ($/h) [9] | ($/h) | |
| 1 | 8490 | 7317 | 7179 | 7156 | 6977.4 | 6885.7 | 6827.4 |
| 2 | 8528 | 7694 | 7365 | 7364 | 7194.4 | 7106.1 | 7073.2 |
| 3 | 8592 | 7922 | 7479 | 7508 | 7310.3 | 7208.9 | 7174.3 |
| 4 | 8675 | 8117 | 7598 | 7599 | 7429.5 | 7335.2 | 7302.8 |
| 5 | 8756 | 8318 | 7721 | 7721 | 7550.8 | 7461.5 | 7423.9 |
| 6 | 8878 | 8600 | 7848 | 7841 | 7675.3 | 7589.8 | 7554.2 |
| 7 | 8849 | 8589 | 7816 | 7816 | 7647.2 | 7559.7 | 7523.4 |
| 8 | 8969 | 8559 | 7692 | 7692 | 7530.9 | 7447.5 | 7419.2 |
| 9 | 9788 | 9630 | 8269 | 8244 | 8105.9 | 8034.4 | 7994.2 |
| 10 | 10235 | 10139 | 8397 | 8337 | 8242.2 | 8187.3 | 8149.7 |
| 11 | 12153 | 11648 | 9620 | 9634 | 9465.9 | 9377.2 | 9341.8 |
| 12 | 13327 | 12336 | 10052 | 10053 | 9903.0 | 9847.2 | 9829.6 |
| 13 | 10957 | 10788 | 8887 | 8887 | 8734.9 | 8660.7 | 8639.1 |
| 14 | 10153 | 10012 | 8467 | 8467 | 8305.8 | 8227.1 | 8194.7 |
| 15 | 9707 | 9617 | 8377 | 8378 | 8206.8 | 8119.4 | 8094.9 |
| 16 | 9093 | 8829 | 7974 | 7970 | 7797.9 | 7707.6 | 7679.2 |
| 17 | 8810 | 8279 | 7608 | 7608 | 7444.4 | 7359.8 | 7336.2 |
| 18 | 9340 | 9137 | 8182 | 8182 | 8006.6 | 7912.4 | 7884.1 |
| 19 | 10009 | 9937 | 8657 | 8657 | 8483.5 | 8391.2 | 8357.4 |
| 20 | 12664 | 12032 | 9851 | 9849 | 9696.6 | 9617.2 | 9589.7 |
| 21 | 11495 | 11197 | 9388 | 9400 | 9226.1 | 9171.2 | 9143.8 |
| 22 | 9540 | 9479 | 8379 | 8379 | 8203.0 | 8112.3 | 8084.7 |
| 23 | 8675 | 8117 | 7598 | 7596 | 7429.5 | 7344.8 | 7312.2 |
| 24 | 8515 | 7491 | 7264 | 7263 | 7082.8 | 6990.4 | 6943.1 |
| Total | 234198 | 223784 | 197668 | 197601 | 193650.8 | 191654.6 | 190872.8 |
Figure 11.
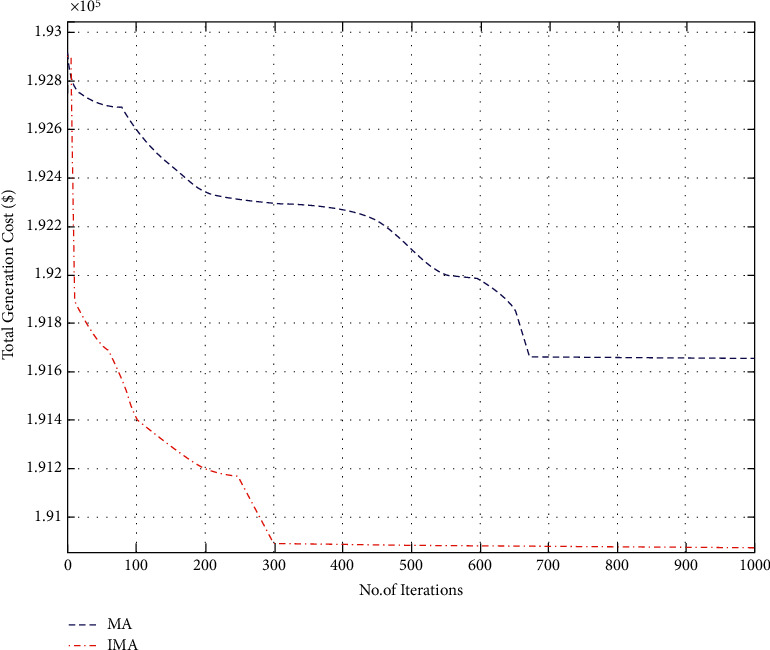
Convergence characteristics for total generation cost (case IV).
Figure 12.
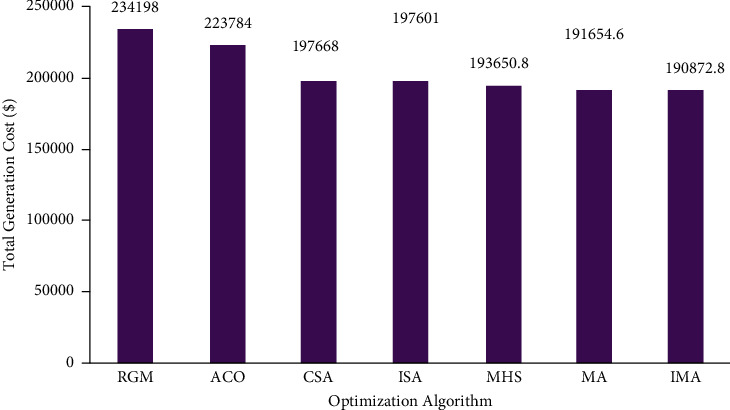
Comparison of total generation cost for case 4.
Figure 13.
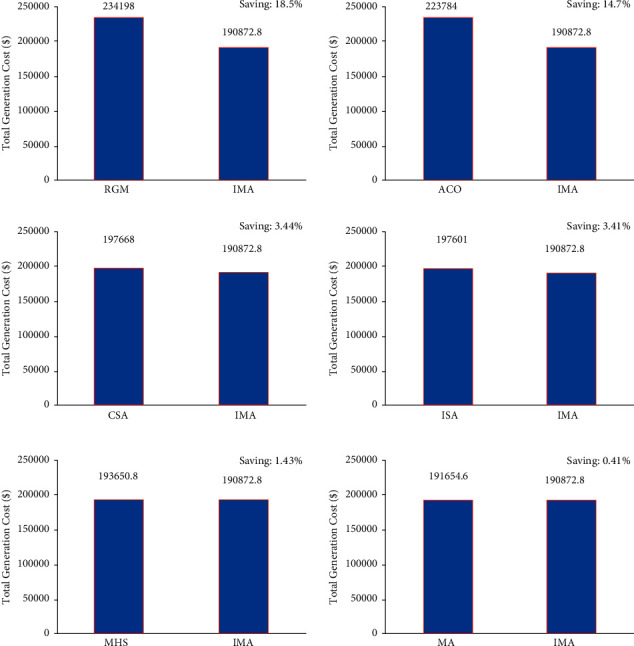
Total generation cost saving of CEED problem for case.
4.5. Comparison between the Cost Curves of All Scenarios
Figures 14 and 15 show the comparison results of total generation cost curves under all the scenarios compared to IMA and MA algorithms 24 hours a day. Furthermore, Figure 16 shows the quantitative comparative results of total cost under all the scenarios using IMA. One can notice from Figures 14–16 that case 1 provides a minimum generation cost compared to other scenarios. Also, it can be observed from case 2 that the highest generation cost is obtained in this case. This might be attributed to the reason that renewable energy sources function as negative loads, while the rest are provided by the fossil-fuel-powered thermal generating units only. It reduces the total generation cost. Furthermore, the total generation cost obtained was less in case 3 than in case 4. It could have occurred due to heavy investment costs incurred upon solar power compared to wind power.
Figure 14.
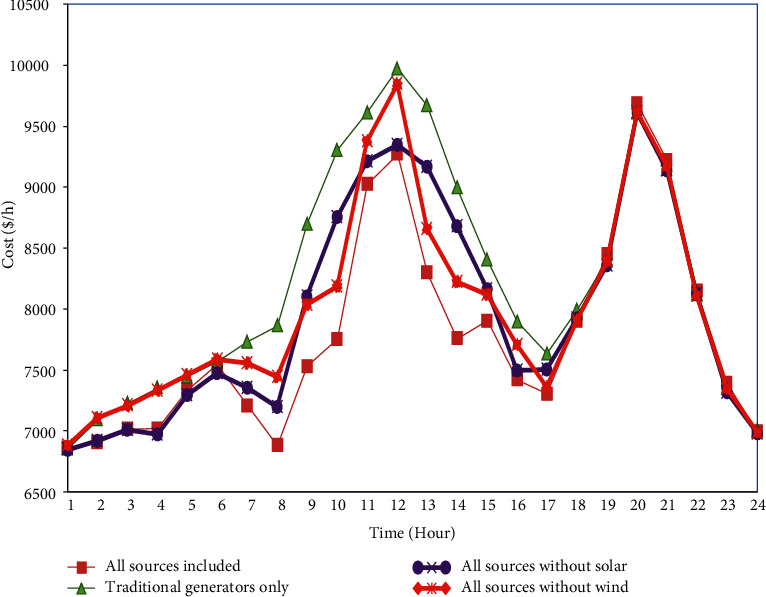
Comparison of the cost curve for all cases for 24 hours of a day using mayfly algorithm.
Figure 15.
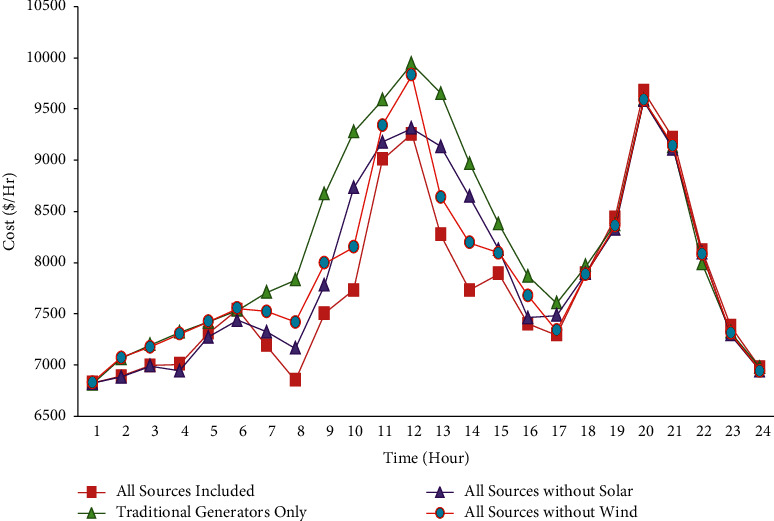
Comparison of the cost curve for all cases for 24 hours of a day using improved mayfly algorithm.
Figure 16.
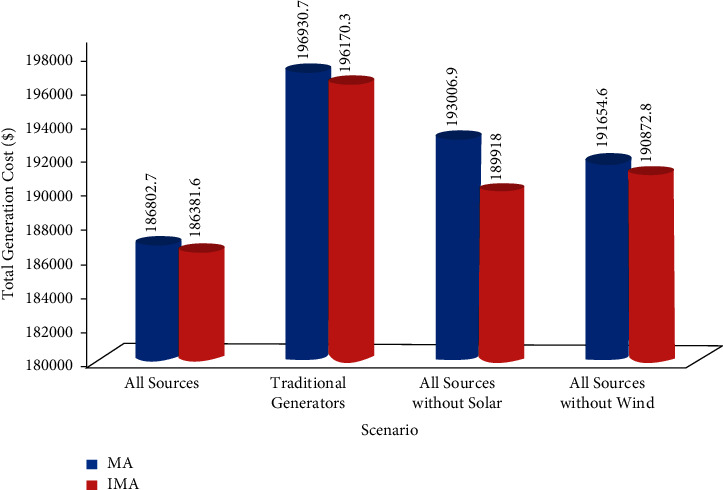
Comparison of total generation cost for all cases using MA and IMA algorithm.
5. Conclusion
In the current study, the improved mayfly optimization algorithm (IMA) has been implemented to resolve the combined economic emission dispatch (CEED) with renewable energy sources. The study incorporated the proposed IMA as a solution for the CEED problem encountered in the microgrid. Solar and wind power are considered as the cost functions in this study. The proposed IMA algorithm was validated for its supremacy and efficiency in a microgrid model under varying scenarios. The outcomes of IMA and other algorithms were compared and contrasted. The comparison results show that the proposed IMA algorithm is better in cost reduction under all the scenarios. This infers that the proposed IMA is superior, robust, and efficient over other metaheuristic optimization algorithms published earlier. In future, the improved mayfly optimization algorithm can be applied to tackle the CEED problem in grid-connected microgrids comprising battery storage and electric vehicles to accomplish single and multiobjective optimization.
Acknowledgments
The authors wish to thank the Hindustan Institute of Technology & Science, Chennai, and Vellore Institute of Technology, Chennai Campus, for their support and encouragement to carry out this work.
Nomenclature
List of Symbols
- a:
Annuitization coefficient
- C w :
Cost of wind power generating unit
- C s :
Cost of solar-powered generating unit
- d:
Coefficient of nuptial dance
- E i (PGi):
Emission level of the ith generator
- E t :
Overall emission
- fl:
Random walk coefficient
- F i (PGi):
Fuel cost of the ith generator
- F t :
Overall fuel cost incurred
- g:
Gravity coefficient
- gbest:
Global best
- iter:
Current iteration
- itermax:
Maximum no. of iterations
- L:
Random number
- l p :
Costs incurred upon investment per unit installed power
- N:
Lifetime investment
- NG:
No. of generating units
- O E :
Operating and maintenance costs per unit installed power
- pbest:
Personal best
- P Gi max:
Maximum output power of generator i
- P Gi min:
Minimum output power of generator i
- P D :
Total load demand
- P Gi, PGmi, PGfi:
Power output of ith generating unit
- P s :
Output power from solar-powered generating unit
- P w :
Output power from wind power generating unit
- r:
Interest rate
- r p :
Cartesian distance between xi and pbesti
- r g :
Cartesian distance between xi and gbest
- r mf:
Cartesian distance between male and female mayflies
- TC:
Total operating cost
- β:
Fixed visibility coefficient
- Λ:
Price penalty factor
- Λi:
Price penalty factor of ith generator
- Λ:
Distribution factor
- δ:
Scaling factor
- Γ(.):
Gamma distribution function
- σ:
Standard deviation.
Abbreviations
- BSDE:
Bernstein-search differential evolution
- CEED:
Combined economic emission dispatch
- ChOA:
Chimp optimization algorithm
- CHP:
Combined heat and power
- CHPED:
Combined heat and power economic dispatch
- CNO:
Collective neurodynamic optimization
- DCHPED:
Dynamic combined heat and power economic emission dispatch
- DDG:
Dispatchable distributed generator
- DE:
Differential evolution
- DEED:
Dynamic economic emission dispatch
- DSM:
Demand side management
- ECED:
Environment constrained economic dispatch
- EED:
Economic environmental dispatch
- ELD:
Economic load dispatch
- EMA:
Exchange market algorithm
- FC:
Fuel cell
- FCDED:
Fuel constrained dynamic economic dispatch
- FP:
Fractional programming
- GA:
Genetic algorithm
- GWO:
Grey wolf optimizer
- HFA/HS:
Hybrid Firefly and Harmony Search
- IGWO:
Improved grey wolf optimizer
- IMA:
Improved mayfly algorithm
- ISA:
Interior search algorithm
- LPSP:
Loss of probability of power supply
- MA:
Mayfly algorithm
- MAACPSO:
Modified adaptive accelerated particle swarm optimization
- MBGSA:
Memory-based gravitational search algorithm
- MG:
Microgrid
- MILP:
Mixed-integer linear programming
- MOVCS:
Multiobjective virus colony search
- MT:
Microturbine
- PPF:
Price penalty factor
- PSO:
Particle swarm optimization
- PV:
Photovoltaic
- QPSO:
Quantum particle swarm optimization
- SFS:
Stochastic fractal search algorithm
- SGEO:
Social group entropy optimization
- SOS:
Sequential optimization strategy
- SSER:
System surplus energy rates
- WOA:
Whale optimization algorithm
- WT:
Wind turbine.
Contributor Information
Arul Rajagopalan, Email: arulphd@yahoo.co.in.
Wubishet Degife Mammo, Email: wubishetdegife7@gmail.com.
Data Availability
The data used to support the findings of this study are included in the article. Should further data or information be required, these are available from the corresponding author upon request.
Disclosure
This study was performed as a part of the Employment of Kombolcha Institute of Technology, Wollo University, Kombolcha, Amhara, Ethiopia.
Conflicts of Interest
The authors declare that there are no conflicts of interest regarding the publication of this paper.
References
- 1.Nwulu N. I., Xia X. Optimal dispatch for a microgrid incorporating renewables and demand response. Renewable Energy . 2017;101:16–28. doi: 10.1016/j.renene.2016.08.026. [DOI] [Google Scholar]
- 2.Karthik N., Parvathy A. K., Arul R., Padmanathan K. Economic load dispatch in a microgrid using interior search algorithm, international conference on power and advanced computing. Proceedings of the 2019 Innovations in Power and Advanced Computing Technologies (i-PACT).; March 2019; Vellore, India. [Google Scholar]
- 3.Karthik N., Parvathy A. K., Arul R. A review of optimal operation of microgrids. International Journal of Electrical and Computer Engineering . 2020;10(3):2842–2849. doi: 10.11591/ijece.v10i3.pp2842-2849. [DOI] [Google Scholar]
- 4.Karthik N., Parvathy A. K., Arul R., Baskar S. A review of optimization techniques applied to solve unit commitment problem in microgrid. Indonesian Journal of Electrical Engineering and Computer Science . 2019;15(3):1161–1169. [Google Scholar]
- 5.Trivedi I. N., Jangir P., Bhoye M., Jangir N. An economic load dispatch and multiple environmental dispatch problem solution with microgrids using interior search algorithm. Neural Computing & Applications . 2018;30(7):2173–2189. doi: 10.1007/s00521-016-2795-5. [DOI] [Google Scholar]
- 6.Karthik N, Parvathy A. K, Arul R. Multi-objective economic emission dispatch using interior search algorithm. International Transactions on Electrical Energy Systems . 2019;29 doi: 10.1002/etep.2683. [DOI] [Google Scholar]
- 7.Rajagopalan A., Kasinathan P., Nagarajan K., Ramachandaramurthy V. K., Sengoden V., Alavandar S. Chaotic self‐adaptive interior search algorithm to solve combined economic emission dispatch problems with security constraints. Int Trans Electr Energ Syst . 2019;29(2) doi: 10.1002/2050-7038.12026.e12026 [DOI] [Google Scholar]
- 8.Karthik N., Parvathy A. K., Arul R. Non-convex economic load dispatch using cuckoo search algorithm. Indonesian Journal of Electrical Engineering and Computer Science . 2017;5(No. 1):48–57. doi: 10.11591/ijeecs.v5.i1.pp48-57. [DOI] [Google Scholar]
- 9.Ehab E. Elattar, Modified harmony search algorithm for combined economic emission dispatch of microgrid incorporating renewable sources. Energy . 2018;159:496–507. [Google Scholar]
- 10.Dey B., Bhattacharyya B., Pedro García Márquez F. A hybrid optimization-based approach to solve environment constrained economic dispatch problem on microgrid system. Journal of Cleaner Production . 2021;307127196 [Google Scholar]
- 11.Kharrich M., Mohammed O. H., Kamel S., Aljohani M., Akherraz M., Mosaad M. I. Optimal Design of Microgrid Using Chimp Optimization Algorithm. Proceedings of the 2021 IEEE International Conference on Automation/XXIV Congress of the Chilean Association of Automatic Control (ICA-ACCA); Santiago, Chile. pp. 1–5. [DOI] [Google Scholar]
- 12.Alayi R., Ahmadi M. H., Visei A. R., Sharma S., Najafi A. Technical and environmental analysis of photovoltaic and solar water heater cogeneration system: a case study of Saveh City. International Journal of Low Carbon Technologies . 2021;16(2):447–453. doi: 10.1093/ijlct/ctaa077. [DOI] [Google Scholar]
- 13.Alomoush M. I. Microgrid dynamic combined power–heat economic-emission dispatch with deferrable loads and price-based energy storage elements and power exchange. Sustainable Energy, Grids and Networks . 2021;26100479 [Google Scholar]
- 14.Dey B., Roy S. K., Bhattacharyya B. Solving multi-objective economic emission dispatch of a renewable integrated microgrid using latest bio-inspired algorithms. Engineering Science and Technology, an International Journal . 2019;22(1):55–66. doi: 10.1016/j.jestch.2018.10.001. [DOI] [Google Scholar]
- 15.Alomoush M. I. Microgrid combined power-heat economic-emission dispatch considering stochastic renewable energy resources, power purchase and emission tax. Energy Conversion and Management . 2019;200112090 [Google Scholar]
- 16.Wang T., He X., Huang T., Li C., Zhang W. Collective neurodynamic optimization for economic emission dispatch problem considering valve point effect in microgrid. Neural Networks . 2017;93:126–136. doi: 10.1016/j.neunet.2017.05.004. [DOI] [PubMed] [Google Scholar]
- 17.Moazeni F., Khazaei J. Dynamic economic dispatch of islanded water-energy microgrids with smart building thermal energy management system. Applied Energy . 2020;276115422 [Google Scholar]
- 18.Kharrich M., Kamel S., Alghamdi A. S., et al. Optimal design of an isolated hybrid microgrid for enhanced deployment of renewable energy sources in Saudi arabia. Sustainability . 2021;13(9):p. 4708. doi: 10.3390/su13094708. [DOI] [Google Scholar]
- 19.Tawfiq A. A. E., El-Raouf M. O. A., Mosaad M. I., Gawad A. F. A., Farahat M. A. E. Optimal reliability study of grid-connected PV systems using evolutionary computing techniques. IEEE Access . 2021;9(1):42125–42139. doi: 10.1109/ACCESS.2021.3064906. [DOI] [Google Scholar]
- 20.Roy N. B., Das D. Optimal allocation of active and reactive power of dispatchable distributed generators in a droop controlled islanded microgrid considering renewable generation and load demand uncertainties. Sustainable Energy, Grids and Networks . 2021;27 doi: 10.1016/j.segan.2021.100482.100482 [DOI] [Google Scholar]
- 21.Zhao X.-G., Zhang Z.-Q., Xie Y.-M, Jin M. Economic-environmental dispatch of microgrid based on improved quantum particle swarm optimization. Energy . 2020;195117014 [Google Scholar]
- 22.Hou H., Xue M., Xu Y., et al. Multi-objective economic dispatch of a microgrid considering electric vehicle and transferable load. Applied Energy . 2020;262 doi: 10.1016/j.apenergy.2020.114489.114489 [DOI] [Google Scholar]
- 23.Gil-González W., Montoya D., Holguín E., Garces A., Grisales-Noreña L. F. Economic dispatch of energy storage systems in dc microgrids employing a semi-definite programming model. Journal of Energy Storage . 2019;21:1–8. [Google Scholar]
- 24.Nemati M., Braun M., Tenbohlen S. Optimization of unit commitment and economic dispatch in microgrids based on genetic algorithm and mixed integer linear programming. Applied Energy . 2018;210:944–963. doi: 10.1016/j.apenergy.2017.07.007. [DOI] [Google Scholar]
- 25.Pourghasem P., Sohrabi F., Abapour M., Mohammadi-Ivatloo B. Stochastic multi-objective dynamic dispatch of renewable and CHP-based islanded microgrids. Electric Power Systems Research . 2019;173:193–201. doi: 10.1016/j.epsr.2019.04.021. [DOI] [Google Scholar]
- 26.Lu X., Zhou K., Yang S. Multi-objective optimal dispatch of microgrid containing electric vehicles. Journal of Cleaner Production . 2017;165:1572–1581. doi: 10.1016/j.jclepro.2017.07.221. [DOI] [Google Scholar]
- 27.Alayi R., Kasaeian A., Atabi F. Thermal analysis of parabolic trough concentration photovoltaic/thermal system for using in buildings. Environmental Progress & Sustainable Energy . 2019;38(6) doi: 10.1002/ep.13220.13220 [DOI] [Google Scholar]
- 28.Alayi R., Kasaeian A., Atabi F. Optical modeling and optimization of parabolic trough concentration photovoltaic/thermal system. Environmental Progress & Sustainable Energy . 2020;39(2) doi: 10.1002/ep.13303.e13303 [DOI] [Google Scholar]
- 29.Samy M. M., Mosaad M. I., Barakat S. Optimal economic study of hybrid PV-wind-fuel cell system integrated to unreliable electric utility using hybrid search optimization technique. International Journal of Hydrogen Energy . 2021;46(20):11217–11231. doi: 10.1016/j.ijhydene.2020.07.258. [DOI] [Google Scholar]
- 30.Nazari-Heris F., Mohammadi-ivatloo B., Nazarpour D. Network constrained economic dispatch of renewable energy and CHP based microgrids. International Journal of Electrical Power & Energy Systems . 2019;110:144–160. doi: 10.1016/j.ijepes.2019.02.037. [DOI] [Google Scholar]
- 31.Younes Z., Alhamrouni I., Mekhilef S., Reyasudin M. A memory-based gravitational search algorithm for solving economic dispatch problem in micro-grid. Ain Shams Engineering Journal . 2021;12(Issue 2):1985–1994. doi: 10.1016/j.asej.2020.10.021. [DOI] [Google Scholar]
- 32.Zou Y., Zhao J., Ding D., Miao F., Sobhani B. Solving dynamic economic and emission dispatch in power system integrated electric vehicle and wind turbine using multi-objective virus colony search algorithm. Sustainable Cities and Society . 2021;67102722 [Google Scholar]
- 33.Alayi R., Kasaeian A., Njafi A. Optimization and evaluation of a wind, solar and fuel cell hybrid system in supplying electricity to a remote district in national grid. International Journal of Energy Sector Management . 2020;14(2):408–418. doi: 10.1108/ijesm-04-2019-0019. [DOI] [Google Scholar]
- 34.Samy M. M., Mosaad M. I., El-Naggar M. F., Barakat S. Reliability support of undependable grid using green energy systems: economic study. IEEE Access . 2021;9(1):14528–14539. doi: 10.1109/ACCESS.2020.3048487. [DOI] [Google Scholar]
- 35.Alayi R., Zishan F., Mohkam M., Hoseinzadeh S., Memon S., Garcia D. A. A sustainable energy distribution configuration for microgrids integrated to the national grid using back-to-back converters in a renewable power system. Electronics . 2021;10(15):p. 1826. doi: 10.3390/electronics10151826. [DOI] [Google Scholar]
- 36.Basu M. Fuel constrained dynamic economic dispatch with demand side management. Energy . 2021;223120068 [Google Scholar]
- 37.Alomoush M. I. Application of the stochastic fractal search algorithm and compromise programming to combined heat and power economic-emission dispatch. Engineering Optimization . 2019;52(11):1992–2010. doi: 10.1080/0305215X.2019.1690650. [DOI] [Google Scholar]
- 38.Zervoudakis K., Tsafarakis S. A mayfly optimization algorithm. Computers & Industrial Engineering . 2020;145 doi: 10.1016/j.cie.2020.106559.106559 [DOI] [Google Scholar]
- 39.Abdelaziz A. Y., Ali E. S., Abd Elazim S. M. Implementation of flower pollination algorithm for solving economic load dispatch and combined economic emission dispatch problems in power systems. Energy . 2016;101:506–518. doi: 10.1016/j.energy.2016.02.041. [DOI] [Google Scholar]
- 40.Yang X.-S., Deb S. Multiobjective cuckoo search for design optimization. Computers & Operations Research . 2013;40(6):1616–1624. doi: 10.1016/j.cor.2011.09.026. [DOI] [Google Scholar]
- 41.Hakli H., Uguz H. A novel particle swarm optimization algorithm with Levy flight. Applied Soft Computing . 2014;23(1):333–345. [Google Scholar]
- 42.Karthik N., Parvathy A. K., Arul R., Padmanathan K. Multi-objective optimal power flow using a new heuristic optimization algorithm with the incorporation of renewable energy sources. International Journal of Energy and Environmental Engineering . 2021;12(4):641–678. doi: 10.1007/s40095-021-00397-x. [DOI] [Google Scholar]
Associated Data
This section collects any data citations, data availability statements, or supplementary materials included in this article.
Data Availability Statement
The data used to support the findings of this study are included in the article. Should further data or information be required, these are available from the corresponding author upon request.


