Abstract
Background
The size-specific dose estimate (SSDE) is a patient-focused CT dose metric. However, published size-dependent conversion factors (fsize) used to calculate SSDE were determined primarily by using phantoms; only eight to 15 patient data sets were used, all at 120 kV.
Purpose
To determine the effect of different tube potentials on the water-equivalent diameter (WED) and SSDE for patient CT scans of the head, chest, and abdomen.
Materials and Methods
This retrospective study used 250 noncontrast CT scans acquired between March 2013 and June 2017. Bony structures were segmented, and their CT numbers were modified to reflect bone attenuation at 70, 90, 110, 130, and 150 kV. Soft-tissue CT numbers were unchanged because of negligible energy dependence. fsize was measured in anthropomorphic phantoms for each tube potential and fit to an exponential function. WED and SSDE were determined for each patient at all tube potentials, regression analysis was performed relative to the WED and SSDE at 120 kV, and mean differences relative to 120 kV were calculated.
Results
In 250 patients (median age, 21.5 years; interquartile range, 44 years; 130 women), WED for all tube potentials was linearly related to the WED at 120 kV in all body regions (R2 = 0.995–1.000). The effect of tube potential on WED was negligible for torso examinations (Cohen d < 0.05). In the head, a medium effect size was observed at 70 kV; however, the mean absolute difference in WED was small (–0.49 cm ± 0.08 [standard deviation]; P < .001). For commonly used combinations of tube potential and patient size, the mean differences in SSDE at alternative tube potentials relative to SSDE at 120 kV were less than 5%.
Conclusion
At noncontrast CT, published size-dependent conversion factors accurately determined size-specific dose estimates on 250 patient scans at five tube potentials other than 120 kV.
© RSNA, 2022
Online supplemental material is available for this article.
See also the editorial by Boone in this issue.
Summary
In both children and adults, published size-specific conversion factors derived for approximately 120-kV x-ray spectra yielded accurate size-specific dose estimates for patient CT scans acquired at alternative tube potentials.
Key Results
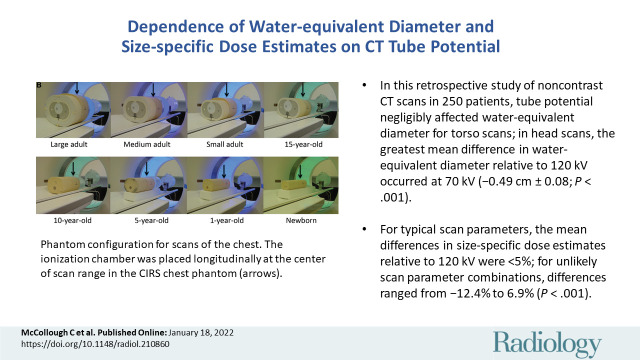
■ In this retrospective study of noncontrast CT scans in 250 patients, tube potential negligibly affected water-equivalent diameter for torso scans; in head scans, the greatest mean difference in water-equivalent diameter relative to 120 kV occurred at 70 kV (–0.49 cm ± 0.08 [standard deviation]; P < .001).
■ For typical scan parameters, the mean differences in size-specific dose estimates relative to 120 kV were less than 5%; for unlikely scan parameter combinations, differences ranged from –12.4% to 6.9% (P < .001).
Introduction
The CT dose index and its derivatives, such as the volume CT dose index (CTDIvol), are commonly used dose metrics (1,2) that represent CT scanner output. They do not represent patient dose (3). The size-specific dose estimate (SSDE) estimates the average absorbed dose to a patient of a specific size at the center of a scan range (4). SSDE is calculated as the product of CTDIvol and a size-dependent conversion factor (fsize) (4,5).
The water-equivalent diameter (WED) is the diameter of a water cylinder with the same x-ray absorption as a specific patient and is used to determine absorbed dose (6,7) and to quantify patient size for the purpose of calculating SSDE (8). Delivering the same radiation output (ie, CTDIvol) to objects of equivalent absorption (ie, WED) will result in equivalent absorbed doses (ie, SSDE). However, x-ray absorption depends on photon energy. Consequently, the WED of a patient depends on the tube potential, even though the physical dimensions and mass of the patient are independent of examination parameters.
In clinical practice, a range of tube potential settings are used (eg, 70–150 kV). However, the effect on WED and SSDE of the use of tube potentials other than 120 kV has not been well established using patient data, leaving open the question of whether these metrics apply to current clinical practice. The purpose of our study was to determine the effect of different tube potentials on WED and SSDE for patient CT scans of the head, chest, and abdomen.
Materials and Methods
This minimal-risk retrospective study was approved by the Mayo Clinic (Rochester, Minn) institutional review board and complied with the Health Insurance Portability and Accountability Act. The requirement for informed consent was waived.
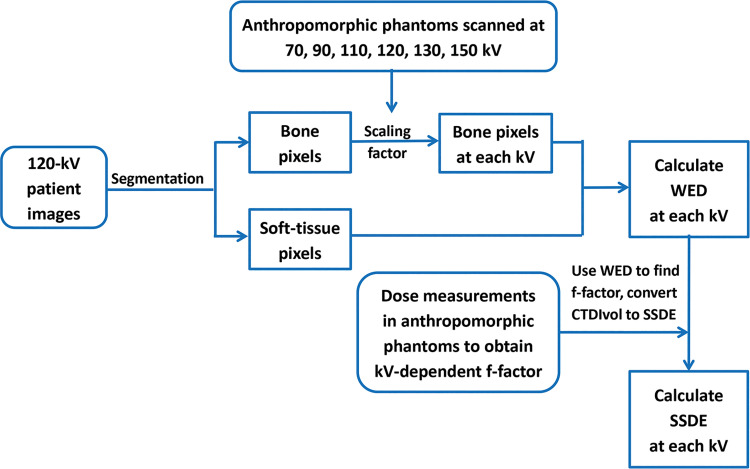
Figure 1 shows the study design. CT examinations performed at Mayo Clinic between March 2013 and June 2017 were retrieved from our clinical data registry, images at non–120-kV tube potentials were simulated by scaling the CT numbers of bone at 120 kV by factors determined from phantom studies, and WED was calculated (S.L., S.L.M., J.J.S., T.R.M., and J.M.W., with 13, 1, 1, 2, and 2 years of experience, respectively). SSDE at non-120-kV tube potentials was calculated for each patient by using the tube-potential–specific fsize values measured in phantoms and compared with SSDE at 120 kV (J.J.S. and T.J.V., with 28 years of experience).
Figure 1:
Flowchart of each step used in this study to calculate water-equivalent diameter (WED) and size-specific dose estimate (SSDE) at each kilovolt. CTDIvol = volume CT dose index.
Head (50 adult and pediatric patients), chest (50 adult and 50 pediatric patients), and abdominal (50 adult and 50 pediatric patients) noncontrast CT examinations were randomly selected to represent a range of body habitus. Scans with anatomy outside of the field of view (torso, 50 cm; head, 25 cm) were excluded.
Clinical head and chest CT protocols used 120 kV (Table E1 [online]). Noncontrast abdominal scans are infrequent in our practice, except for assessment of urinary stone by using dual-energy CT. Because a linearly weighted mixture of low- and high-energy images mimics 120-kV images (9,10), mixed images were used as surrogates for 120-kV scans in the abdomen. Patients had been scanned on similar scanners from the same manufacturer (Somatom Definition AS+, Definition Flash, and Force; Siemens Healthcare).
Patient images were simulated at non–120-kV tube potentials by scaling the CT numbers on the 120-kV or 120-kV-equivalent (mixed) images by using a tube-potential-dependent factor. The attenuation of bone changes with energy, whereas the attenuation of soft tissue does not (Appendix E1 [online]). Therefore, our study scaled only the CT numbers of bony structures.
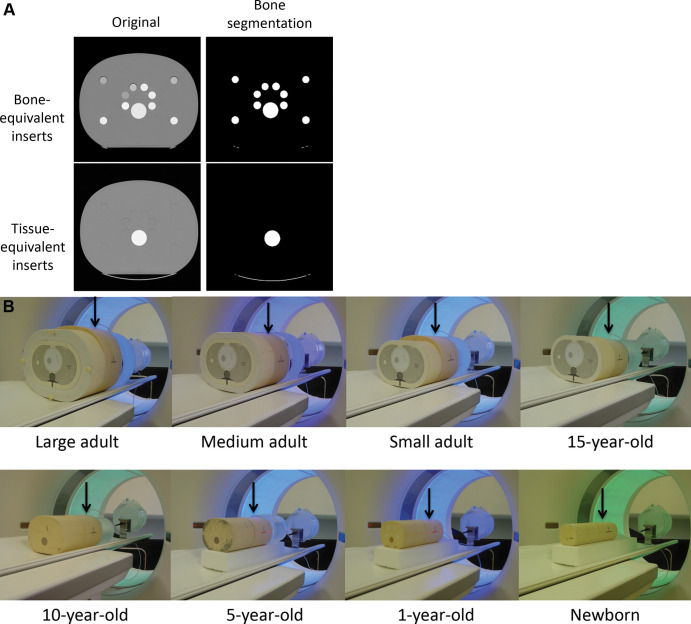
To determine bone scaling factors, bone-equivalent inserts (Fig 2A; 230–870 HU at 120 kV) were inserted into anthropomorphic head, chest, and abdomen phantoms ranging in size from newborn to large adult (Models 007TE-01–007TE-18 and 007TE-21–007TE-27; Computerized Imaging Reference Systems). Head phantom sizes mimicked those of a newborn, 1-year-old, 5-year-old, and medium-sized adult. Chest and abdomen phantom sizes mimicked those of a newborn, 1-year-old, 5-year-old, 10-year-old, and a 15-year-old; and a small, medium, and large adult. The anatomic region of interest was positioned in the middle of or adjacent to similarly sized phantoms to produce a realistic scatter environment (Fig 2B).
Figure 2:
(A) Cross-sectional CT images of the large adult anthropomorphic abdomen phantom show cylindrical cavities filled with bone-equivalent inserts (top row) and cylindrical cavities filled with tissue-equivalent inserts (bottom row). The large white circle is the bone-equivalent spine of the phantom. The left-side images are the original images; the right-side images are those after bone segmentation. (B) Phantom configuration for scans of the chest. The ionization chamber was placed longitudinally at the center of scan range in the chest phantom (arrows). Similarly sized phantoms were placed next to each chest phantom to provide sufficient scattering media to accommodate a scan length appropriate for a typical patient in each size and age category.
Phantoms were scanned (J.J.S. and T.J.V.) by using a 192-detector-row CT scanner (Somatom Force; Siemens Healthcare) and routine clinical protocols (Table E2 [online]) at 120 kV and at 70, 90, 110, 130, and 150 kV. The tube current was adjusted at each tube potential to match the CTDIvol of the 120-kV scan. Regions of interest were drawn on each bone insert, and the mean CT numbers were recorded for each phantom and tube potential combination. The ratio of the mean CT number between the alternative tube potential and 120 kV was calculated for all bone plugs and phantom sizes.
By using Matlab scripts (version 9.2; MathWorks), bony structures were segmented (S.L., S.L.M., and J.M.W.; Fig 2A) by using empirically determined thresholds (200, 100, and 150 HU for head, chest, and abdominal scans, respectively). The calculated ratio of mean CT numbers in bone was multiplied by bone CT numbers on the 120-kV patient images to determine bone CT numbers at other tube potentials, and WED was calculated and plotted against WED at 120 kV.
The percentage bone volume was calculated (S.L., S.L.M., and T.R.M.) from the segmented patient images as the ratio of the number of pixels occupied by bone to the total number of pixels in the scan range. The percentage bone attenuation was calculated as the ratio of total attenuation by bone to the total attenuation in the scan range.
To determine fsize at alternative tube potentials, the anthropomorphic phantoms mimicking patient sizes from newborns to large adults were arranged to simulate a head and torso configuration (Fig 2B) and scanned (J.J.S. and T.J.V.) by using a 192-detector-row CT scanner (Somatom Force; Siemens Healthcare) at 120 kV and 70, 90, 110, 130, and 150 kV (Table E2 [online]). The scan range was adjusted according to the body region and patient size (Table E3 [online]). Helical pitch was determined on the basis of the phantom size, nominal beam width, and measured radiation beam width to achieve a uniform dose profile at the phantom periphery (11). The absorbed dose at the longitudinal center of each region was measured by using a small ionization chamber (model 9015, 10 × 6–0.6 probe; Radcal) at the center and peripheral locations, as described in the American Association of Physicists in Medicine Report 111 (12). The weighted absorbed dose was calculated as follows:
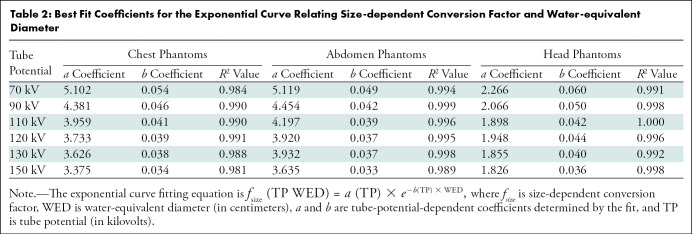
Weighted absorbed dose = 1/3 dosecenter + 2/3 dosemean periphery, where the mean dose at the periphery was the average of the measurements at the 3 o’clock and 12 o’clock positions. Weighted absorbed dose was divided by CTDIvol to obtain fsize, which was fitted to exponential curves for each tube potential and body region using the equation fsize (TP WED) = a (TP) × e–b(TP) × WED, where a and b are tube-potential–dependent coefficients determined by the fit, WED is given in centimeters, and TP is tube potential given in kilovolts.
To determine SSDE for each patient at each alternative tube potential (J.J.S.; S.L.; L.Y., with 15 years of experience; and C.H.M., with 30 years of experience), WED values at alternative tube potentials were used to select fsize for each patient and tube potential. fsize was multiplied by the CTDIvol of each patient to calculate SSDE by following the methods used in American Association of Physicists in Medicine Report 204 (4), as follows: SSDE (TP) = fsize(TP WED) × CTDIvol, where TP is tube potential.
Differences were calculated between the resulting values and those at 120 kV.
Statistical Analysis
The patient sample size (n = 250) was chosen (C.H.M. and S.L.) to be at least an order of magnitude larger than the patient sample sizes (eight or 15 patients) for previous determinations of fsize (4,5), yet achievable by using the patient examinations that were in our clinical data registry at the time the study was performed.
For each tube potential and body region, fsize values were fit to exponential curves (J.J.S.) as a function of WED, and WED and SSDE values at alternative tube potentials were linearly regressed against the values at 120 kV by using Excel (version 15.35.0, Microsoft) to determine fit parameters and correlation coefficients (C.H.M.). Mean differences were calculated (C.H.M.) and significance determined by using a one-sided, paired t test and a significance criterion of α equal to .05. Cohen d was calculated (C.H.M.) to measure effect size by dividing the absolute value of the mean difference by the pooled standard deviation. For mean differences less than 0.2 standard deviations, the difference had little to no effect, though statistically significant. A Cohen d value of 0.2 was considered to have a small effect whereas a value of 0.5 was considered to have a medium effect.
Results
Phantoms
Regulatory and accreditation criteria typically require that the mean CT number in water, measured at any tube potential or in any image type, be within the range of –5 to 5 HU. In Appendix E1 (online), Tables E4 and E5 (online) show that these criteria were met for all tube potentials and the mixed images for both head and body phantoms.
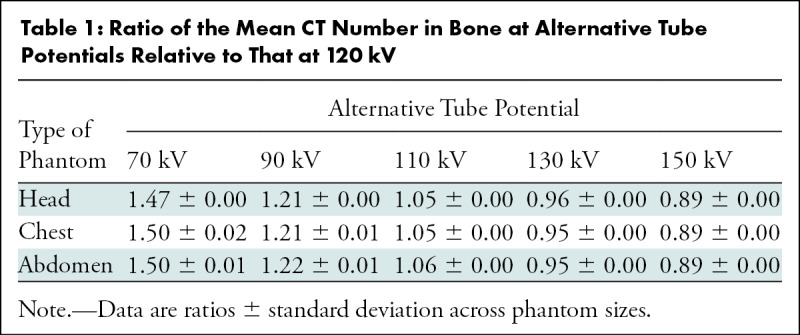
The ratio of the mean bone CT numbers measured in phantoms between alternative tube potentials and 120 kV (Table 1) was larger than 1 for tube potentials less than 120 kV and smaller than 1 for tube potentials greater than 120 kV. For a given tube potential, the ratios were not significantly different between the head and torso except for at 70 kV (P < .05).
Table 1:
Ratio of the Mean CT Number in Bone at Alternative Tube Potentials Relative to That at 120 kV
Patients
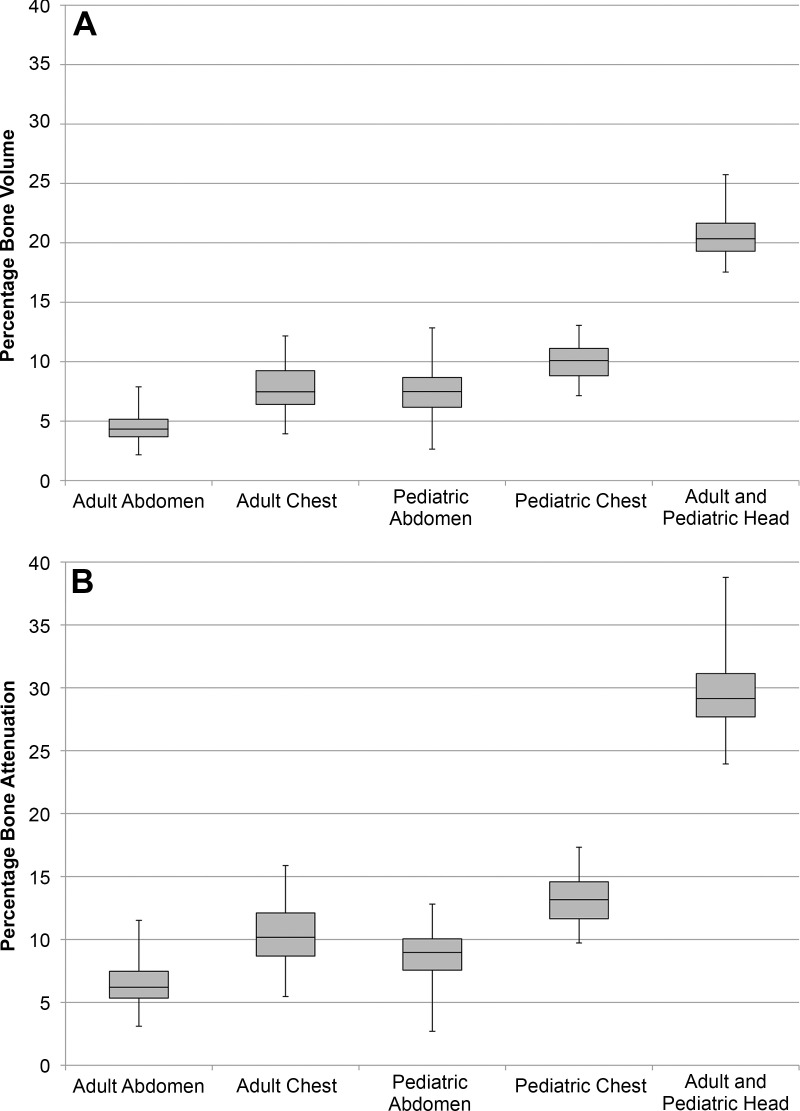
For the 250 patients (median age, 21.5 years; interquartile range, 44 years; 130 women) included in our study, the mean percentage bone volumes for head, chest, and abdominal scans were 20.7%, 7.8%, and 4.5%, and the mean percentage bone attenuations for head, chest, and abdominal scans were 29.6%, 10.4%, and 6.6%, respectively (Fig 3). With 10% or less of the total attenuation in the torso because of bone, tube potential is expected to have a minimal effect on WED and SSDE (Appendix E2 [online]). For head examinations, with 30% of the total attenuation because of bone, changes in tube potential are expected to have a stronger effect on WED and SSDE.
Figure 3:
(A) Box-and-whisker plots of the distributions of the percentage bone volume for the five patient samples that were evaluated. (B) Box-and-whisker plots of the distributions of the percentage bone attenuation for the five patient samples that were evaluated.
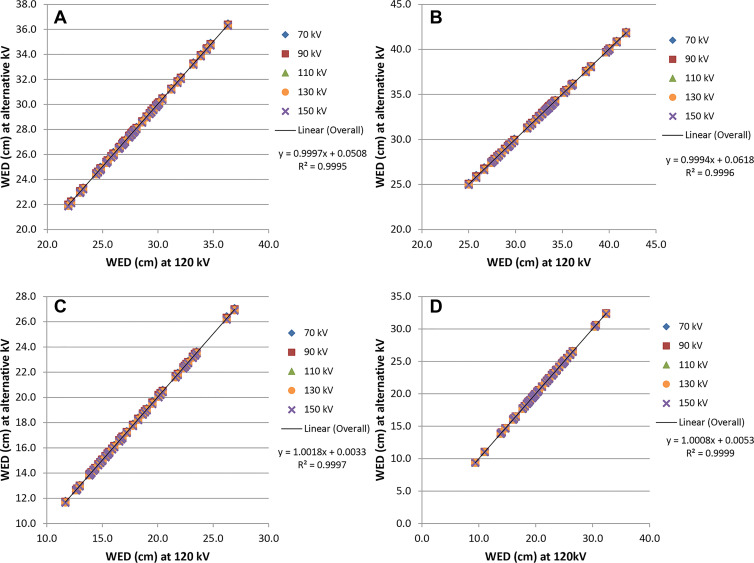
On scans of the chest and abdomen, WED values at alternative tube potentials were linearly related to WED at 120 kV (R2 = 1.000) for both pediatric and adult patients. The fitted slopes were all 1.00, and the y-intercepts ranged from –0.03 to 0.01 cm in children and from –0.23 to 0.06 cm in adults (Fig 4). The effect size (ie, the practical significance) of tube potential on WED relative to WED at 120 kV was negligible (Cohen d, 0–0.05) in both pediatric and adult patients.
Figure 4:
Water-equivalent diameter (WED) values at alternative tube potentials (kilovolt settings) plotted against the WED values at 120 kV. Graphs show (A) adult chest, (B) adult abdomen, (C) pediatric chest, and (D) pediatric abdomen.
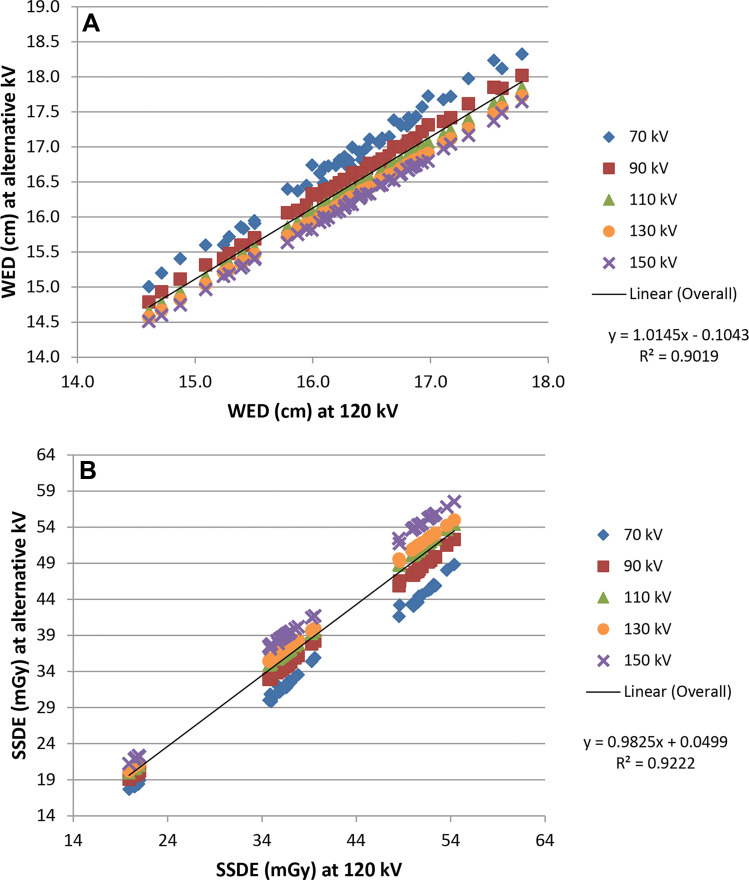
In scans of the head, WED values at alternative tube potentials were linearly related to WED at 120 kV (R2 = 0.995 for 70 kV; R2 = 0.999 for 90 kV; and R2 = 1.000 at 110, 130, and 150 kV) in pediatric and adult patients. The slopes of the fitted lines ranged from 1.06 (70 kV) to 0.987 (150 kV), and the y-intercepts ranged from –0.42 cm (70 kV) to 0.10 cm (150 kV) (Fig 5A). In children and adults, the effect size of tube potential on WED relative to WED at 120 kV was medium at 70 kV (Cohen d, 0.65); small at 90 kV (Cohen d, 0.29); and negligible for 110, 130, and 150 kV (Cohen d, 0.07, 0.06, and 0.16, respectively). However, even with a medium effect size at 70 kV, the absolute difference in WED was small (mean difference, 0.49 cm ± 0.08 [standard deviation]; range, 0.32–0.68 cm; P < .001).
Figure 5:
Adult and pediatric head (A) water-equivalent diameter (WED) values and (B) size-specific dose estimate (SSDE) values at alternative tube potentials plotted against the respective values at 120 kV.
Table 2 summarizes the fitting results for fsize (R2 ≥ 0.984). Substantial differences were observed in the values of fsize among different tube potentials. For example, a greater than 20% difference was observed in fsize between 70 kV and 150 kV for the smallest phantoms at chest and abdomen examinations and the largest phantom in head examinations.
Table 2:
Best Fit Coefficients for the Exponential Curve Relating Size-dependent Conversion Factor and Water-equivalent Diameter
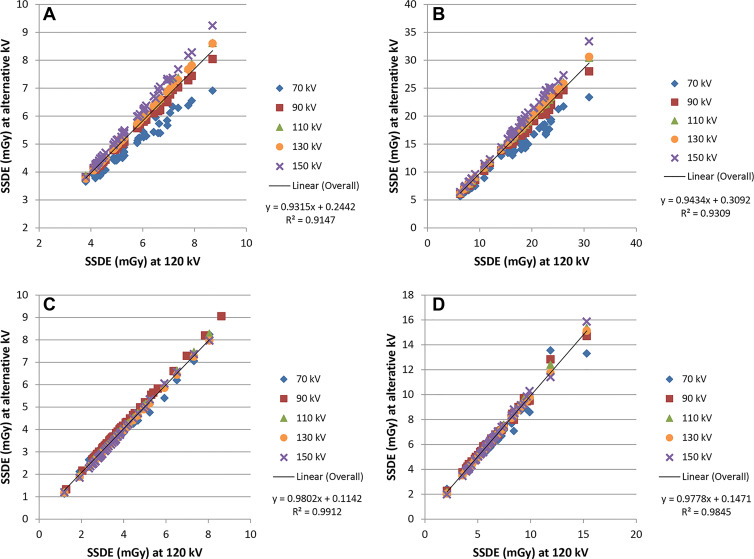
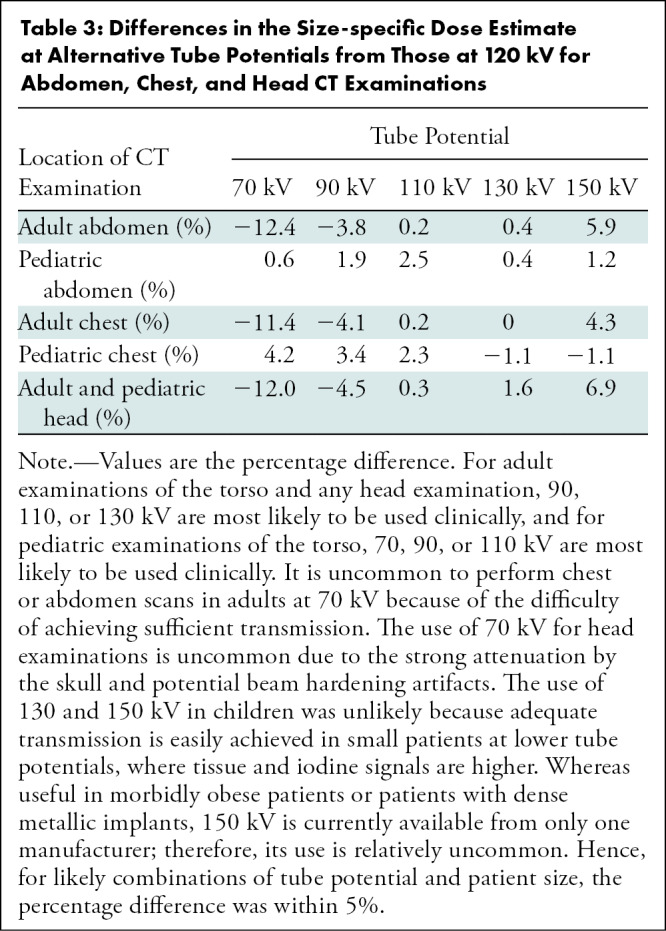
Some tube potential dependence was observed for SSDE (Figs 5B, 6), mainly because of the differences in the values of fsize because the tube potential varied. At alternative tube potentials, the differences in SSDE values from those at 120 kV ranged from –1.9 to 0.7 mGy for chest, –6.9 to 3.1 mGy for abdomen, and –6.9 to 3.9 mGy for head. Relative to 120 kV, the greatest underestimation of SSDE (negative difference values) occurred at 70 kV and the greatest overestimation of SSDE (positive difference values) occurred at 150 kV. Compared with SSDE at 120 kV, the mean SSDE percentage difference ranged from –11.4% (70 kV) to 4.3% (150 kV) and from –12.4% (70 kV) to 5.9% (150 kV) for adult chest and abdomen examinations, respectively (Table 3). Less tube potential dependence was observed for pediatric patients. For head examinations, the difference was from –12.0% (70 kV) to 6.9% (150 kV) in adult and pediatric patients. The data in Table 3 include all tube potentials and patient sizes. However, for the most common combinations of tube potential and patient size, the difference in SSDE at each tube potential relative to that at 120 kV was within 5%.
Figure 6:
Adult and pediatric site-specific dose estimate (SSDE) values at alternative tube potentials plotted against the respective values at 120 kV for (A) adult chest, (B) adult abdomen, (C) pediatric chest, and (D) pediatric abdomen.
Table 3:
Differences in the Size-specific Dose Estimate at Alternative Tube Potentials from Those at 120 kV for Abdomen, Chest, and Head CT Examinations
Discussion
Published size-dependent conversion factors (fsize) used to calculate size-specific dose estimate (SSDE) were primarily derived from phantom measurements, with only eight (torso) and 15 (head) human CT data sets (4,5). In our study, we measured the dependence of the water-equivalent diameter (WED) and SSDE on tube potential for 250 noncontrast head, chest, and abdomen CT scans in adult and pediatric patients. We found that tube potential negligibly affected WED for torso scans (Cohen d, 0–0.05). In head scans, the greatest mean difference in WED relative to WED at 120 kV occurred at 70 kV (–0.49 cm ± 0.08; P < .001). The mean differences in SSDE relative to SSDE at 120 kV were less than 5% for common scan parameter combinations. For uncommon combinations, differences ranged from –12.4% to 6.9% (P < .001), which are less than the uncertainty range (±20%) specified by American Association of Physicists in Medicine Report 204 (4).
Our results demonstrate in patient data the robustness of WED and SSDE across patient sizes, body regions, and tube potentials. This is important for the clinical adoption of SSDE, which was recently codified in an international standard (13). Intuitively, patient size, as expressed by WED, is not expected to change simply because scan parameters are varied. Also, SSDE is expected to be an accurate estimate of the absorbed dose in the center of the scan volume at any tube potential. Therefore, from a practical point of view, the influence of tube potential on SSDE is negligible, and the use of published fsize values (4,5) to calculate SSDE in patients undergoing CT at alternative tube potentials is a reasonable approach.
At our institution, the size of the reconstruction field of view is limited to the anatomy of interest. Whereas this maximizes the pixel resolution on the image, many archived clinical images clip some peripheral anatomy, yielding an underestimation of WED. As recommended by American Association of Physicists in Medicine Report 220, we used 50-cm reconstruction field-of-view images for our WED calculations and excluded patients with any anatomy outside the 50-cm field of view from our study to avoid underestimating WED (8). To do this, we had to select scans from our clinical CT data registry, which contains the unreconstructed projection data. The only noncontrast CT scan of the abdomen with enough patients in the registry was for the evaluation of urinary stone disease, which at our institution is always performed by using dual-energy protocols. However, previous evaluations (9,10) of the properties of mixed images from the scanner types used in our study and the independence of soft-tissue CT numbers on tube potential (Appendix E1 [online]) support the premise that mixed images accurately simulate a 120-kV image. Therefore, the use of mixed images is not a limitation of our study.
Our study had limitations. First, only noncontrast scans were investigated. The attenuation of iodinated contrast materials has a considerable dependence on tube potential, more than that of bony structures. However, the volume of iodinated contrast media injected in contrast-enhanced CT examinations is small (~50 to 150 mL) as a percentage of most scan volumes. It is reasonable, therefore, to expect tube potential to have little to no effect on WED and SSDE for contrast-enhanced scans. There may be exceptions to this in certain examinations where iodine accumulation may contribute substantially to the total attenuation. In those situations, if the percentage iodine volume and attenuation are of similar or smaller magnitude than that of bone, then the results shown here would be equally true in examinations with large iodine concentrations in the scan volume. Second, all examinations included in our study were performed with scanners from a single manufacturer, although multiple scanner models were included. However, the differences in effective energy for the range of tube potential values examined (70–150 kV) likely exceed differences in effective energy related to variations in x-ray spectra between manufacturers. Therefore, we do not expect the conclusions of our study to be dependent on the manufacturer.
In 250 adult and pediatric patients, tube potential had a negligible effect on the water-equivalent diameter (WED) at chest and abdomen CT and a small effect (<0.7 cm) at 70-kV head CT. Additionally, the tube potential had a small effect on the size-specific dose estimate (SSDE), with a less than 5% difference between SSDE at 120 kV and SSDE at alternative tube potentials for common CT protocols. We concluded, therefore, that the values of the size-dependent conversion factor published in American Association of Physicists in Medicine Reports 204 and 293 are appropriate for use by scanner manufacturers to calculate WED and SSDE for the range of spectra used in clinical practice (4,5). Future investigations of the percentage iodine volume and percentage iodine attenuation in contrast-enhanced examinations are needed to confirm that these findings apply to contrast-enhanced CT examinations.
Acknowledgments
Acknowledgment
The authors thank the Mayo Clinic Radiology Research Publication Support Team for assistance in editing the manuscript.
Study supported by the National Institutes of Health (R01 EB017095). C.H.M. is the recipient of a grant from Siemens Healthcare unrelated to this study.
Disclosures of Conflicts of Interest: C.H.M. Travel support from American Association of Physicists in Medicine (AAPM); president and chair of the Board of the AAPM; vice-president and board member of International Society of CT. S.L.M. No relevant relationships. J.J.S. No relevant relationships. T.R.M. No relevant relationships. J.M.W. No relevant relationships. T.J.V. No relevant relationships. L.Y. No relevant relationships. S.L. No relevant relationships.
Abbreviations:
- CTDIvol
- volume CT dose index
- f size
- size-dependent conversion factor
- SSDE
- size-specific dose estimate
- WED
- water-equivalent diameter
References
- 1. American Association of Physicists in Medicine . The measurement, reporting and management of radiation dose in CT (Report# 96) . https://www.aapm.org/pubs/reports/RPT_96.pdf. Published 2008. Accessed February 5, 2020 .
- 2. Shope TB , Gagne RM , Johnson GC . A method for describing the doses delivered by transmission x-ray computed tomography . Med Phys 1981. ; 8 ( 4 ): 488 – 495 . [DOI] [PubMed] [Google Scholar]
- 3. McCollough CH , Leng S , Yu L , Cody DD , Boone JM , McNitt-Gray MF . CT dose index and patient dose: they are not the same thing . Radiology 2011. ; 259 ( 2 ): 311 – 316 . [DOI] [PMC free article] [PubMed] [Google Scholar]
- 4. American Association of Physicists in Medicine . Report of AAPM Task Group 204. Size-Specific Dose Estimates (SSDE) in Pediatric and Adult Body CT Examinations . Alexandria, VA: : American Association of Physicists in Medicine; . https://www.aapm.org/pubs/reports/RPT_204.pdf. Published 2012. Accessed February 5, 2020 . [Google Scholar]
- 5. American Association of Physicists in Medicine . Report No. 293 - Size Specific Dose Estimate (SSDE) for Head CT . Alexandria, VA: : American Association of Physicists in Medicine; . https://www.aapm.org/pubs/reports/RPT_293.pdf. Published 2019. Accessed February 5, 2020 . [Google Scholar]
- 6. Wang J , Christner JA , Duan X , Leng S , Yu L , McCollough CH . Attenuation-based estimation of patient size for the purpose of size specific dose estimation in CT. Part II. Implementation on abdomen and thorax phantoms using cross sectional CT images and scanned projection radiograph images . Med Phys 2012. ; 39 ( 11 ): 6772 – 6778 . [DOI] [PubMed] [Google Scholar]
- 7. Wang J , Duan X , Christner JA , Leng S , Yu L , McCollough CH . Attenuation-based estimation of patient size for the purpose of size specific dose estimation in CT. Part I. Development and validation of methods using the CT image . Med Phys 2012. ; 39 ( 11 ): 6764 – 6771 . [DOI] [PubMed] [Google Scholar]
- 8. American Association of Physicists in Medicine . Report of AAPM Task Group 220. Use of Water Equivalent Diameter for calculating patient size and Size-Specific Dose Estimates (SSDE) in CT . Alexandria, VA: : American Association of Physicists in Medicine; . https://www.aapm.org/pubs/reports/RPT_220.pdf. Published 2014. Accessed February 5, 2020 . [Google Scholar]
- 9. Yu L , Primak AN , Liu X , McCollough CH . Image quality optimization and evaluation of linearly mixed images in dual-source, dual-energy CT . Med Phys 2009. ; 36 ( 3 ): 1019 – 1024 . [DOI] [PMC free article] [PubMed] [Google Scholar]
- 10. Behrendt FF , Schmidt B , Plumhans C , et al . Image fusion in dual energy computed tomography: effect on contrast enhancement, signal-to-noise ratio and image quality in computed tomography angiography . Invest Radiol 2009. ; 44 ( 1 ): 1 – 6 . [DOI] [PubMed] [Google Scholar]
- 11. Vrieze TJ , Bauhs JA , McCollough CH . Use of spiral scan acquisitions for CT dose measurements: Selection of optimal pitch values to ensure reproducible results [abstr] . In: Radiological Society of North America scientific assembly and annual meeting program [book online] . Oak Brook, Ill: : Radiological Society of North America; , 2007. . https://archive.rsna.org/2007/5009803.html. Accessed February 5, 2020 . [Google Scholar]
- 12. American Association of Physicists in Medicine . Report of AAPM Task Group 111. Comprehensive Methodology for the Evaluation of Radiation Dose in X-Ray Computed Tomography . Alexandria, VA: : American Association of Physicists in Medicine; . https://www.aapm.org/pubs/reports/RPT_111.pdf. Published 2010. Accessed February 5, 2020 . [Google Scholar]
- 13. International Electrotechnical Commission . Methods for calculating size specific dose estimates (SSDE) for computed tomography (IEC 62985) . Geneva, Switzerland: : International Electrotechnical Commission; , 2019. ; 42 . [Google Scholar]


