Abstract
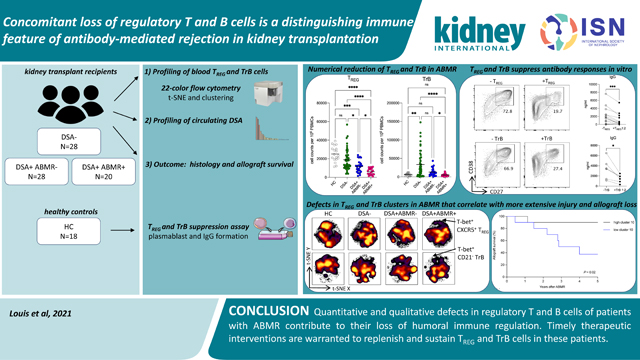
Although considerable advances have been made in understanding the cellular effector mechanisms responsible for donor-specific antibody generation leading to antibody-mediated rejection (ABMR), the identification of cellular regulators of such immune responses is lacking. To clarify this, we used high dimensional flow cytometry to concomitantly profile and track the two major subsets of regulatory lymphocytes in blood: T regulatory (TREG) and transitional B cells in a cohort of 96 kidney transplant recipients. Additionally, we established co-culture assays to address their respective capacity to suppress antibody responses in vitro. TREG and transitional B cells were found to be potent suppressors of T follicular helper-mediated B cell differentiation into plasmablast and antibody generation. TREG and transitional B cells were both durably expanded in patients who did not develop donor-specific antibody post-transplant. However, patients who manifested donor-specific antibody and progressed to ABMR displayed a marked and persistent numerical reduction in TREG and transitional B cells. Strikingly, specific cell clusters expressing the transcription factor T-bet were selectively depleted in both TREG and transitional B cell compartments in patients with ABMR. Importantly, the coordinated loss of these T-bet+CXCR5+TREG and T-bet+CD21− transitional B cell clusters was correlated with increased and inflammatory donor specific antibody responses, more extensive microvascular inflammation and a higher rate of kidney allograft loss. Thus, our study identified coordinated and persistent defects in regulatory T and B cell responses in patients undergoing ABMR, which may contribute to their loss of humoral immune regulation, and warrant timely therapeutic interventions to replenish and sustain TREG and transitional B cells in these patients.
Keywords: Regulatory lymphocytes, T cells, B cells, kidney transplantation, antibody-mediated rejection
Graphical Abstract
Introduction
A major goal in the field of transplantation medicine is to prolong the survival of the transplanted organs. One main obstacle for achieving this goal is the development of donor-specific antibodies (DSA) against nonself HLA molecules leading to antibody-mediated rejection (ABMR), the first cause of allograft loss in organ transplantation including kidney transplantation1–4. ABMR results from complex cellular and molecular mechanisms involving augmented cognate interactions between alloreactive T follicular helper cells (TFH) and B cells, and exaggerated germinal center responses resulting in the generation of pathogenic plasma cells and DSA that are injurious to kidney allografts 5–7. Therefore, optimal means to control TFH and B cell responses should be intensively investigated to prevent this deleterious humoral alloimmunity and ABMR.
T regulatory cells (TREG) defined as CD4+CD25hiFoxP3+ T cells are the most recognized and potent subset of immunosuppressive lymphocytes, that are involved in regulation of alloimmune response and facilitation of transplant tolerance 8,9. Transplant animal models have established the pivotal role of TREG in the strong inhibition of alloimmune processes and dampening inflammation in kidneys, resulting in restraining T-cell mediated rejection (TCMR) 10–12. These findings were corroborated in humans as infiltrating TREG were found diminished during TCMR and were associated with reversal of TCMR and improved kidney allograft function in patients 13–15. Human TREG comprise of heterogeneous subsets delineating distinct states of differentiation and polarization: immature/naïve (CD45RO−) versus activated/memory (CD45RO+) and Th1 (T-bet+) versus Th2 (GATA3+) or Th17 (RORgt+) TREG. Importantly, specific polarized TREG can effectively suppress their effector CD4 T helper cell counterparts via the expression of shared chemokine receptor/ligand pairs that allows migration to common inflammatory sites 16,17. In addition, T follicular regulatory cells (TFR), defined as CD4+CD25hiFoxP3+CXCR5+, are a specialized subset of TREG that can access GCs and regulate TFH-mediated B cell responses through CTLA-4-mediated inhibition and suppression of pro-inflammatory cytokine production18. These were recently shown to be capable of suppressing GC responses resulting in controlled DSA responses and ABMR in mice 19. However, the role of TREG and TFR in modulating humoral alloimmune responses in humans remains to be determined.
Another major and well-defined subset of immunosuppressive lymphocytes exists within the B cell compartment and is represented by CD19+CD24hiCD38hi transitional B cells (TrB) 20,21. TrB have gain substantial interest in the past decade and were shown to be potent suppressor of Th1- and Th17-mediated immune responses including cytokine production and cell proliferation, via their large secretion of IL-10 22,23. More recently, TrB were also demonstrated to be potent suppressors of B-cell mediated responses via direct inhibition of TFH cell differentiation and function. TrB include the immature and high IL-10-producing CD24+++CD38+++ T1 subset, and the more mature and less functional CD24++CD38++ T2 subset 24–26.
Although TREG and TrB were intensively investigated in organ transplantation during T-cell mediated alloimmune processes, comprehensive investigations of these cells during antibody-mediated alloimmune responses are lacking. In this study, we aim to provide a detailed and concomitant characterization of the immune phenotypes of both blood TREG and TrB cell compartments in kidney transplant recipients undergoing active DSA responses and ABMR, to investigate their respective capacity to suppress TFH-B cell responses in vitro and finally to address the clinical impact of the coordinated changes in TREG and TrB cell compartments on kidney allograft injury and outcomes.
Methods
Study design
This study was performed on specimens from patients who received kidney transplantation between January 2013 and December 2017 at University of Pittsburgh Medical Center and who were enrolled in a biorepository initiative at Thomas E. Starzl Transplantation Institute (STI). All patients signed a written informed consent (IRB no. PRO12030552; PRO17020318). The study protocol was approved by the University of Pittsburgh institutional review board, and this manuscript adheres to the Declaration of Istanbul. A total of 530 consenting patients were screened for the following immunological events: presence of post-transplant DSA and biopsy-proven ABMR. We identified 48 patients who developed DSA in the first 24 months post-transplant and had available banked peripheral blood mononuclear cells (PBMC), defining two patient groups: patients with ABMR (DSA+ABMR+, N=20) or without ABMR (DSA+ABMR−, N=28). Forty-eight age- and gender-matched patients with no DSA or ABMR (DSA−) in the first 24 months post-transplant were selected to form the third patient group. In addition, 18 age- and gender-matched healthy controls (HC) from the STI Human Immunology Program were also enrolled. Clinical data of the patients enrolled were extracted from the prospective STI biorepository database. In addition, patients were followed up until April 1, 2021 and kidney allograft loss was assessed.
Blood specimens
PBMC and sera were prospectively collected and banked at pre-transplant, 1-, 3-, 6-, 12- and 24-month post-transplant and at the time of clinically indicated kidney allograft biopsies. The presence of DSA in sera was systematically assessed at these time points. Surveillance protocol allograft biopsies were performed at 3- and 12-month post-transplant. We analyzed cross-sectional PBMC and sera banked from the blood specimens collected at the time of specific immunological events of interest and time points were matched between the three group of patients (Table S1). Patients for whom cryopreserved PBMC samples were available at timepoints considered (pre-transplant, 1-, 3-, 6- and 12-month post-transplant) were included in the longitudinal analyses.
High dimensional flow cytometry data analysis
Flow cytometry data were curated with FlowJo software (Tree Star) to exclude dead cells and doublets, and TREG and TrB cells were identified by gating for further downstream analyses. Data were normalized and analyzed simultaneously using Cytobank software 27. T-distributed stochastic neighbor embedding (t-SNE) analysis makes a pairwise comparison of cellular phenotypes to optimally plot similar cells close to each other and reduces multiple parameters into two dimensions (t-SNE X, t-SNE Y) 28. Data from Flow Cytometry Standard (FCS) files were normalized, downsampled then concatenated to create t-SNE maps. To run t-SNE algorithm, the following settings were applied: 3,000 iterations, perplexity of 30 and theta of 0.5. Cell clusters were determined by the spanning-tree progression analysis of density-normalized events (SPADE) algorithm using 12 nodes as the optimal number without downsampling events 29. The cell clusters identified by SPADE were overlaid on the consensus t-SNE maps for visualization and a heatmap was generated to delineate specific phenotypic patterns.
Statistics
Mean ± SD or SEM values and frequencies are provided for the description of the continuous and categorical variables, respectively. The means and proportions were compared using t-test and chi-squared test (or the Mann–Whitney U test and Fisher’s exact test if appropriate, respectively). Multiple groups were analyzed by Kruskal-Wallis test or one-way ANOVA with Tukey post-hoc test for adjustment for multiple comparisons. Death-censored kidney allograft survival was assessed using the Kaplan-Meier estimator and compared with the log-rank test. Values of P < 0.05 were considered statistically significant, and all tests were two-sided. Analyses were performed using GraphPad Prism version 8 and Cytobank (http://www.cytobank.org).
Results
Patient cohort and demographics
Clinical characteristics of the patients (N=96) and HC (N=18) are displayed in Table S1. All patients received induction therapy by Thymoglobulin and were transplanted across a negative flow cytometry crossmatch. Patients’ clinical characteristics were comparable across the groups, with the exception of higher rates of retransplantation and of DSA present before transplantation in both DSA+ABMR− and DSA+ABMR+ patients as compared to DSA− group, suggesting more prior exposure to HLA alloantigens in the former patients (Table S1). Among the DSA+ABMR+ group, 12 patients had DSA pre-transplant and these experienced early ABMR (1±0.9 month post-transplant), and the remaining 8 DSA+ABMR+ patients who did not have pre-transplant DSA, developed late ABMR (11±6.1 months post-transplant). Of the 20 DSA+ABMR+ patients, 17 displayed concomitant TCMR lesions (mixed ABMR), while 3 had pure ABMR lesions.
We profiled concomitantly circulating TREG and TrB cell compartments, as well as DSA from cross-sectional blood specimens collected at the time of the following events of interest: (i) first detection of post-transplant DSA for DSA+ABMR− patients and (ii) day of detection of ABMR in the presence of DSA for DSA+ABMR+ patients. For DSA− patients, blood specimens were profiled at matched time points with those from DSA+ABMR− and DSA+ABMR+ patients. Time from transplantation of the blood specimens did not significantly differ between patient groups (Table S1). Using high dimensional approaches, we comprehensively analyzed the immune phenotypic profiles of TREG and TrB cells in the three groups of kidney transplant recipients, assessed their dynamics post-transplant, correlates with the DSA responses and their clinical impact on kidney allograft outcomes. We also used several co-culture models to test the respective functional potential of TREG and TrB cells to suppress antibody responses in vitro.
Decreased Treg cell frequencies and numbers in patients developing post-transplant DSA who progressed to ABMR
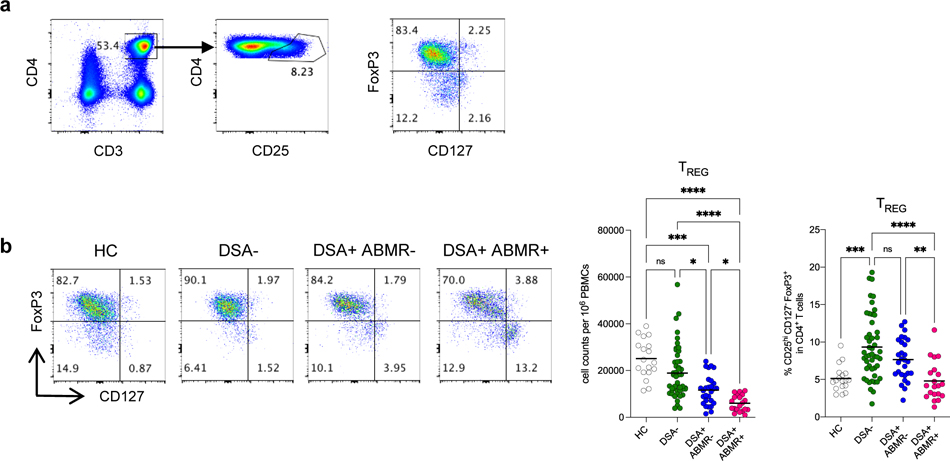
We used high dimensional flow cytometry analyses of PBMC to identify circulating TREG as CD3+CD4+CD25hiCD127−FoxP3+ T cells (Figure 1a). The absolute numbers of TREG were diminished in all three groups of patients when compared to HC (Figure 1b). This depletion in TREG in patients was likely related to immunosuppressive treatments and Thymoglobulin, consistent with previous findings 30. Interestingly however, the frequency of TREG were the highest in DSA− patients while both absolute numbers and frequencies of TREG were diminished in DSA+ABMR− and DSA+ABMR+ patients (Figure 1b). Strikingly, this decrease in TREG was more pronounced in the latter patients. Additionally, TREG depletion was persistent post-transplant throughout follow up in DSA+ABMR+ patients, while TREG were significantly maintained in time in DSA+ABMR− and DSA− groups (Figure S1a–S1b). Thus, quantitative decrease in TREG is an immune feature of patients with DSA who progress to ABMR.
Figure 1. Analysis of absolute numbers and frequencies of TREG in kidney transplant recipients.
(a) Representative example of the gating strategy used for the identification of TREG (CD3+CD4+CD25hiCD127−FoxP3+ cells) in blood by flow cytometry. (b) Representative examples of flow cytometry analysis, and dot plots of percentages and cell counts per million PBMC of TREG cells are displayed; HC (N=18), DSA− (N=48), DSA+ABMR− (N=28) and DSA+ABMR+ (N=20) patients. Kruskal-Wallis with Dunn’s post-test. *P < 0.05; **P < 0.01; ***P < 0.001; ****P < 0.0001. Each dot represents one subject and horizontal lines are mean values.
Defects in specific T-bet+CXCR5+ TREG cell clusters in patients with ABMR
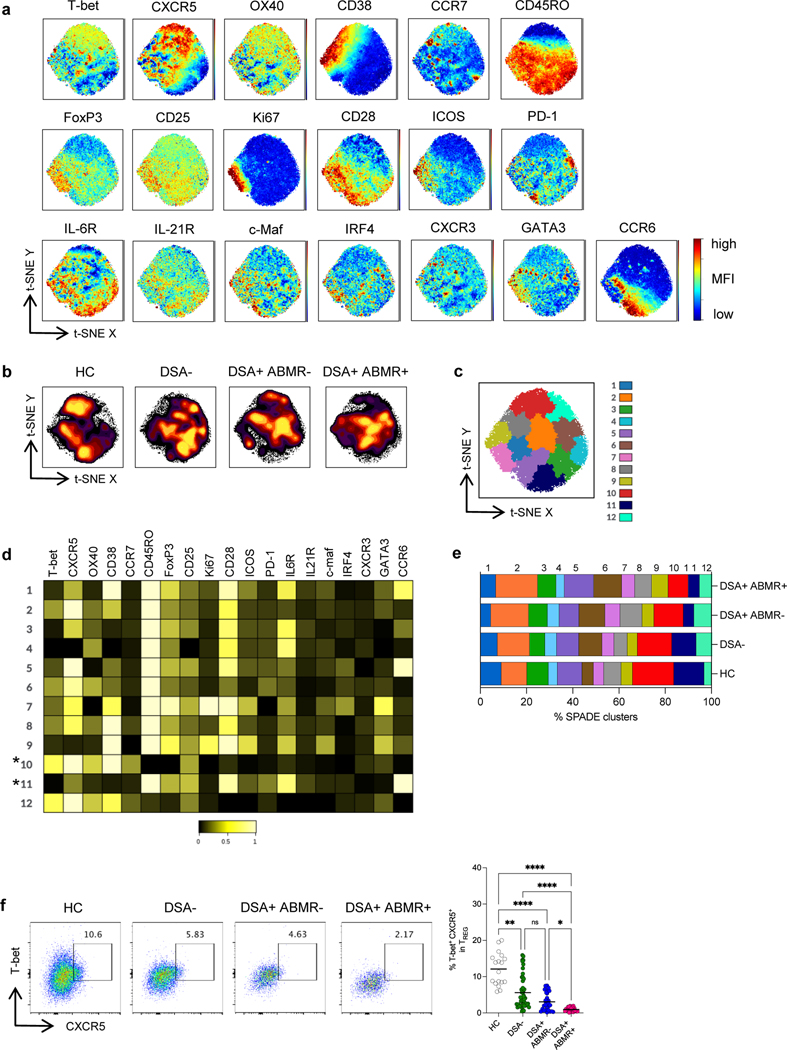
To investigate qualitative differences in phenotypes of the depleted TREG from DSA+ABMR+ patients compared to other groups, we performed unbiased high dimensional t-SNE analyses. The same number of TREG cells was extracted from each study group to create global consensus t-SNE maps according to the expression of 19 T cell markers (Figure 2a). Substantial differences in the TREG high dimensional profiles were observed among the study groups, with several high density cell clusters missing in DSA+ABMR+ patients, which markedly distinguished them from the other patients and HC (Figure 2b). SPADE clustering further allowed to resolve the phenotypic features of the differing TREG subpopulations (Figure 2c) (Table S2).
Figure 2. High dimensional flow cytometry analyses of TREG in kidney transplant recipients.
(a) t-SNE projections were generated using a concatenated file of N= 73,600 TREG cells from HC (N=5), DSA− (N=20), DSA+ABMR− (N=20) and DSA+ABMR+ (N=20) patients; panels display expression levels of indicated markers (MFI). (b) t-SNE projections of TREG densities in the four groups using N=18,400 cells from each group, shown in panel a. (c) t-SNE map overlaid with 12 TREG clusters delineated by SPADE clustering of the concatenated file, as in panel a. (d) Heatmap showing the expression of markers for each TREG cluster according to transformed MFI ratio. * indicates the TREG clusters significantly diminished in frequencies in the DSA+ABMR+ group. (e) Stacked bar plot showing TREG cluster distribution based on SPADE clustering as in panel c. Clusters 1, 3, 6, 10 and 11 are significantly different in their proportions across the indicated groups. Kruskal-Wallis with Dunn’s post-test. (f) Representative examples of flow cytometry analysis and dot plot of percentages of T-bet+ CXCR5+ cells in TREG are displayed; HC (N=18), DSA− (N=48), DSA+ABMR− (N=28) and DSA+ABMR+ (N=20) patients. Kruskal-Wallis with Dunn’s post-test. *P < 0.05; **P < 0.01; ****P < 0.0001. Each dot represents one subject and horizontal lines are mean values.
Among the 12 SPADE clusters, cluster 10 and 11 were significantly diminished in frequencies in DSA+ABMR+ patients. TREG from cluster 10 were uniquely characterized by high CXCR5 and T-bet expression and also expressed CCR7 and OX40, while displaying low CD45RO, CD25 and Ki67, consistent with a resting TFR-like phenotype with Th1 polarization (Figure 2d) (Table S2). On the other hand, TREG from cluster 11 expressed high CD45RO, CCR6, CD28 and PD-1, while were negative for CXCR5 and T-bet, reflective of a non-TFR memory TREG phenotype with Th17 polarization. However, while cluster 11 was equally diminished in both DSA+ABMR− and DSA+ABMR+ patients, compared to DSA− and HC groups, cluster 10 was specifically depleted in DSA+ABMR+ patients (Figure 2e). When analyzing TREG profiles in individual patients, no significant differences were found in the distribution of cluster 10 and 11 in early versus late DSA+ABMR+ or in pure versus mixed DSA+ABMR+ cases (Figure S2).
Thus, these unbiased t-SNE and SPADE analyses allowed to identify a defect in a specific TFR-like subset of TREG, that were T-bet+CXCR5+, which robustly demarcated DSA+ABMR+ patients from the other patients and the HC. Significant differences in the frequency of these cells were also identified and validated using conventional biaxial gating in flow cytometry (Figure 2f). Longitudinally, there was also a profound decrease in absolute number and frequencies of these T-bet+CXCR5+ TREG that persisted post-transplant throughout follow up in DSA+ABMR+ patients in both preformed and de novo DSA cases (Figure S3a–S3c).
TREG efficiently suppress TFH activation, TFH-B cell interaction and antibody generation in vitro
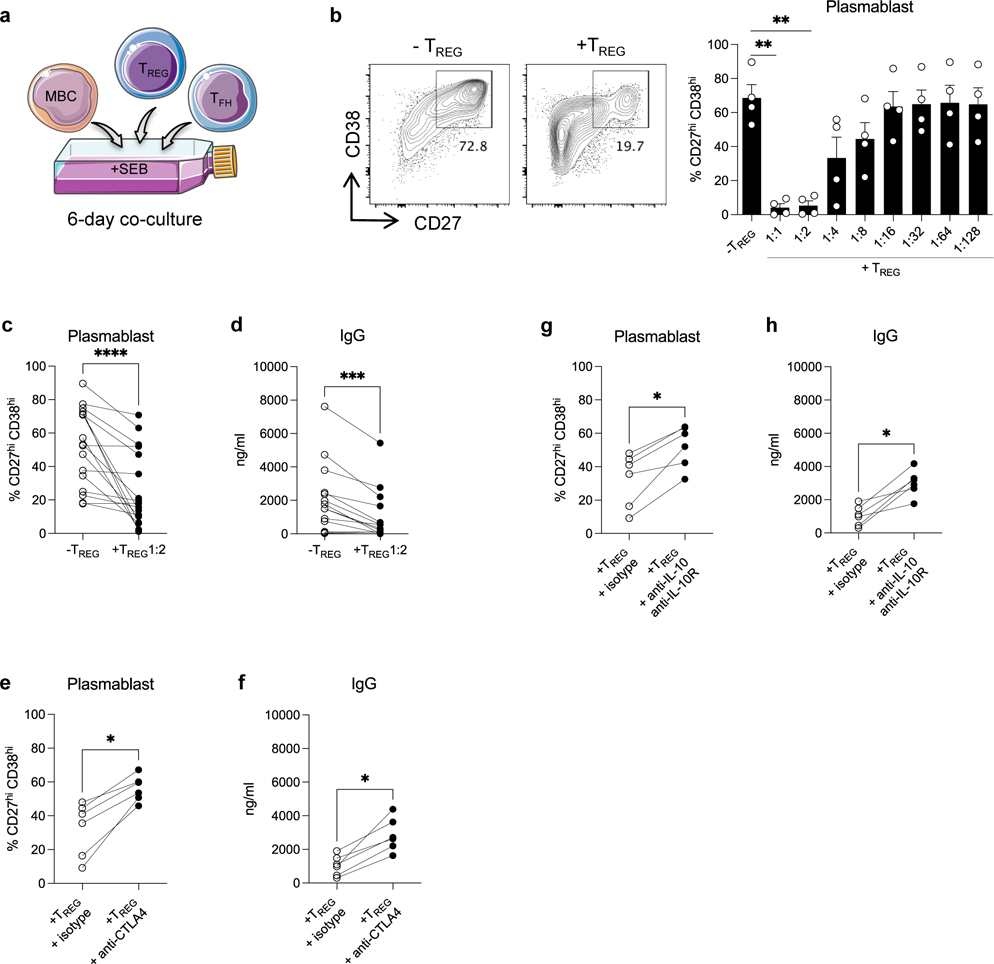
DSA generation relies on efficient and cognate TFH-B cell interactions. We used an in vitro human model of TFH-B cell interaction with purified autologous TFH and memory B cells (MBCs) from PBMC of HC (Figure S4a) pulsed with staphylococcal enterotoxin B (SEB) and co-cultured for 6 days with or without the adjunction of purified TREG (Figure 3a). By doing so, we aimed to test the TREG functional capacity to suppress TFH-B cell interactions and antibody responses. Plasmablasts and IgG were generated after 6 days in the presence of SEB in the TFH-B co-cultures, but not in the absence of SEB (Figure S4b–S4c) nor in the absence of TFH (not shown) in the co-cultures. When TREG were added to the co-cultures, plasmablast generation was significantly suppressed in a dose-dependent manner, with a maximal suppression at 1:1 and 1:2 ratio of TREG (Figure 3b–3c). The resulting IgG generation at 6-days was also suppressed accordingly (Figure 3d). Interestingly, TREG also significantly diminished the expression of the activation marker CD28 on TFH cells (Figure S5a) and that of the costimulatory molecules CD80 and CD86 on MBCs (Figure S5b). We next pre-incubated TREG with anti-CTLA4 or anti-IL-10 plus anti-IL-10R blocking antibodies before TREG were added to TFH-B co-cultures, to gain insights into the mechanisms of the TREG-mediated suppression function. Plasmablasts and IgG generation were significantly restored when CTLA4 on TREG was blocked as compared to the isotype condition (Figure 3e–3f). Interestingly, CD28 expression on TFH cells and that of CD80 and CD86 on MBCs were also significantly restored in the CTLA4 blocking condition (Figure S5c–S5d). Similar effects on plasmablasts and IgG generation were observed when IL-10/IL-10R signaling was blocked on TREG (Figure 3g–3h). IL-10/IL-10R blocking also significantly restored CD28 expression on TFH cells and that of CD80 and CD86 on MBCs (Figure S5e–S5f).
Figure 3. Analyses of TREG capacity to suppress TFH-B cell interactions in vitro.
(a) Schematic representation of sorted memory B cells (MBCs) (CD19+CD4−CD38loCD27+) and TFH (CD19−CD4+CD25loCD127+CD45RO+CXCR5+) co-cultured with autologous TREG (CD19−CD4+CD25hiCD127−) from HC, in the presence of SEB (6 days). (b) Representative examples of flow cytometry analysis of CD27hiCD38hi plasmablasts obtained after 6 days of TFH-B co-cultures with or without TREG at 1:2 ratio. Bar plot of overall data with or without supplementation of TREG from 1:1 to 1:128 ratio; N=4 per condition. (c) Percentages of CD27hiCD38hi plasmablasts (N=17), and (d) amount of IgG in supernatants (N=14) after 6 days of TFH-B co-cultures with or without supplementation of TREG at 1:2 ratio. TREG were pre-incubated with anti-CTLA4 antibody or isotype-matched control, then added to TFH-B co-cultures at 1:2 ratio. (e) Percentages of CD27hiCD38hi plasmablasts (N=6), and (f) amount of IgG in supernatants (N=6) after 6 days of co-cultures. TREG were pre-incubated with anti-IL-10 plus anti-IL-10R antibodies or isotype-matched control, then added to TFH-B co-cultures at 1:2 ratio. (g) Percentages of CD27hiCD38hi plasmablasts (N=6), and (h) amount of IgG in supernatants (N=6) after 6 days of co-cultures. Friedman test with Dunn’s post-test for panel b. Wilcoxon matched-pairs signed rank test for panel c, d, e, f, g and h. *P < 0.05; **P < 0.01; ***P < 0.001; ****P < 0.0001. Each dot represents one subject and horizontal lines of bars are mean values ± SEM.
We next further assessed the capacity of TREG to directly suppress TFH proliferation using a 5-days TREG-TFH co-culture (Figure S6a). TREG suppressed TFH cell proliferation in a dose-dependent manner (Figure S6b–S6c) and this suppression could be partially reversed by CTLA4 or IL-10/IL-10R blocking of TREG (Figure S6d–S6e).
Thus, TREG efficiently suppressed TFH cell proliferation and their capacity to promote B cell differentiation into plasmablast and antibody generation in vitro.
Concomitant loss in TrB cell frequencies and numbers in patients developing post-transplant DSA who progressed to ABMR
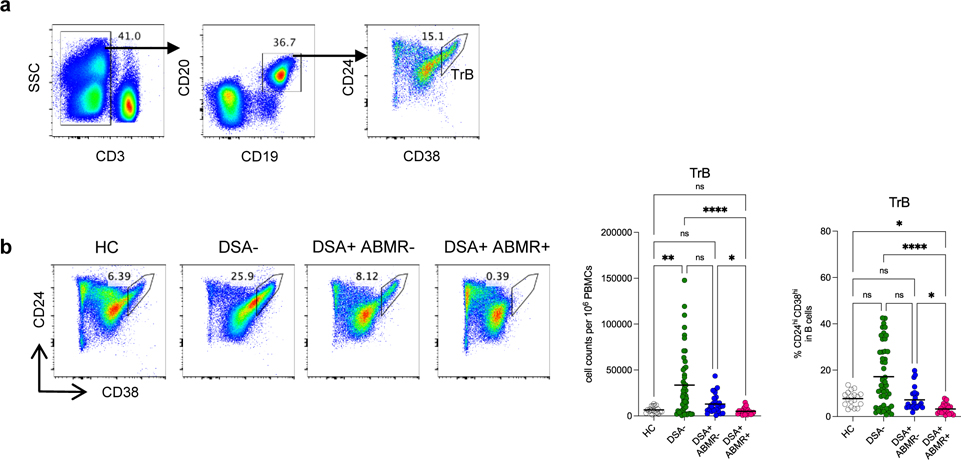
We next evaluated whether changes in circulating TREG in patients was associated with a concomitant shift in their TrB counterparts from the same blood specimens as in Figure 1. TrB were identified as CD3−CD19+CD24hiCD38hi cells (Figure 4a). In contrast to TREG, the absolute numbers of TrB were not significantly diminished in all groups of patients when compared to HC. Indeed, DSA− patients displayed significant increase in both absolute numbers and frequencies of TrB as compared to DSA+ABMR+ group (Figure 4b). Conversely, DSA+ABMR+ patients displayed the most markedly diminished absolute numbers and frequencies of TrB, which demarcated them from the DSA+ABMR− group. Longitudinally, TrB depletion was persistent post-transplant throughout follow up in DSA+ABMR+ patients, while TrB were significantly maintained in time in DSA+ABMR− and DSA− groups (Figure S7a–S7c). Thus, quantitative decrease in TrB is observed selectively in patients with ABMR, unlike in other clinical states.
Figure 4. Analysis of absolute numbers and frequencies of TrB in kidney transplant recipients.
(a) Representative example of the gating strategy used for the identification of TrB (CD3−CD19+CD24hiCD38hi cells) in blood by flow cytometry. (b) Representative examples of flow cytometry analysis, and dot plots of percentages and cell counts per million PBMC of TrB cells are displayed; HC (N=18), DSA− (N=48), DSA+ABMR− (N=28) and DSA+ABMR+ (N=20) patients. Kruskal-Wallis with Dunn’s post-test. *P < 0.05; **P < 0.01; ****P < 0.0001. Each dot represents one subject and horizontal lines are mean values.
Defects in T-bet+CD21− TrB cell clusters in patients with ABMR
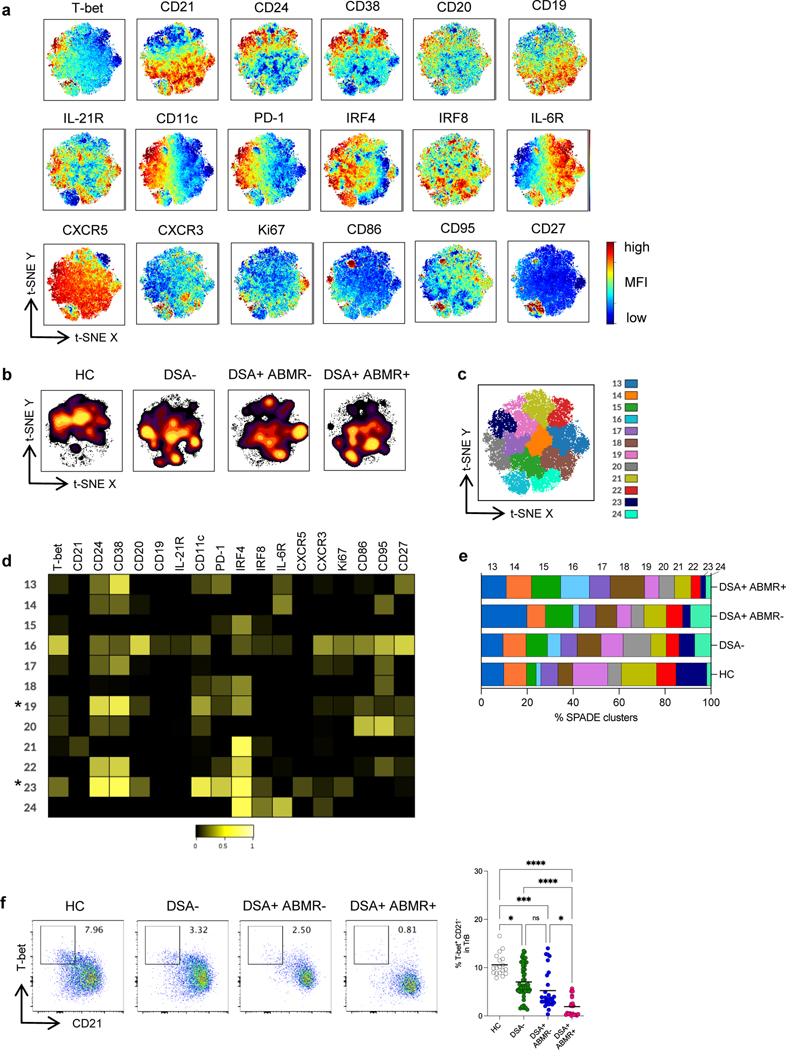
As for TREG, we undertook unsupervised high dimensional analyses of the qualitative differences in phenotypes of TrB across the study groups. Global consensus t-SNE maps of TrB cells were created according to the expression of 18 relevant B cell markers (Figure 5a). Striking differences in the TrB high dimensional profiles were observed among the study groups, with large portion of cell clusters missing in DSA+ABMR+ patients, which distinguished them from the rest of the patients and HC (Figure 5b).
Figure 5. High dimensional flow cytometry analyses of TrB in kidney transplant recipients.
(a) t-SNE projections were generated using a concatenated file of N= 33,600 TrB cells from HC (N=5), DSA− (N=20), DSA+ABMR− (N=20) and DSA+ABMR+ (N=20) patients; panels display expression levels of indicated markers (MFI). (b) t-SNE projections of TrB densities in the four groups using N=8,400 cells from each group, shown in panel a. (c) t-SNE map overlaid with 12 TrB clusters delineated by SPADE clustering of the concatenated file, as in panel a. (d) Heatmap showing the expression of markers for each TrB cluster according to transformed MFI ratio. * indicates the TrB clusters significantly diminished in frequencies in the DSA+ABMR+ group. (e) Stacked bar plot showing TrB cluster distribution based on SPADE clustering as in panel c. Clusters 19, 20, 23 and 24 are significantly different in their proportions across the indicated groups. Kruskal-Wallis with Dunn’s post-test. (f) Representative examples of flow cytometry analysis and dot plot of percentages of T-bet+ CD21− cells in TrB are displayed; HC (N=18), DSA− (N=48), DSA+ABMR− (N=28) and DSA+ABMR+ (N=20) patients. Kruskal-Wallis with Dunn’s post-test. *P < 0.05; ***P < 0.001; ****P < 0.0001. Each dot represents one subject and horizontal lines are mean values.
SPADE clustering further revealed that 2 of the 12 clusters (cluster 19 and 23) expressing high CD24 and CD38 (identifying them as T1 subsets) were significantly decreased in frequencies in DSA+ABMR+ patients (Figure 5c). TrB from cluster 23 uniquely expressed high T-bet and low CD21, and also expressed high CD11c and PD-1 as well as CD86 and CD95, reflective of an activated T1 TrB phenotype with Th1 polarization (Figure 5d) (Table S3). On the other hand, TrB from cluster 19, while expressing low CD21, expressed intermediate T-bet, CD11c and PD-1, and were negative for CD86 and CD95, consistent with a resting T1 TrB phenotype. However, while cluster 19 was diminished in both DSA+ABMR− and DSA+ABMR+ patients, cluster 23 was specifically depleted in the latter patients (Figure 5e). In individual patients, no significant differences were found in the distribution of cluster 19 and 23 in early versus late DSA+ABMR+ or in pure versus mixed DSA+ABMR+ patients (Figure S8).
Thus, these unbiased t-SNE and SPADE analyses allowed to identify a specific loss in T1 subset of TrB, that were T-bet+CD21−, which robustly distinguished DSA+ABMR+ patients from the other clinical states. Significant differences in the frequency of these cells were also found in conventional flow cytometry analyses (Figure 5f). Longitudinally, there was also a profound decrease in these T-bet+CD21− TrB that persisted post-transplant throughout follow up in DSA+ABMR+ patients, unlike in other groups (Figure S9a–S9b).
TrB are potent suppressors of TFH activation, TFH-B cell interaction and antibody generation in vitro
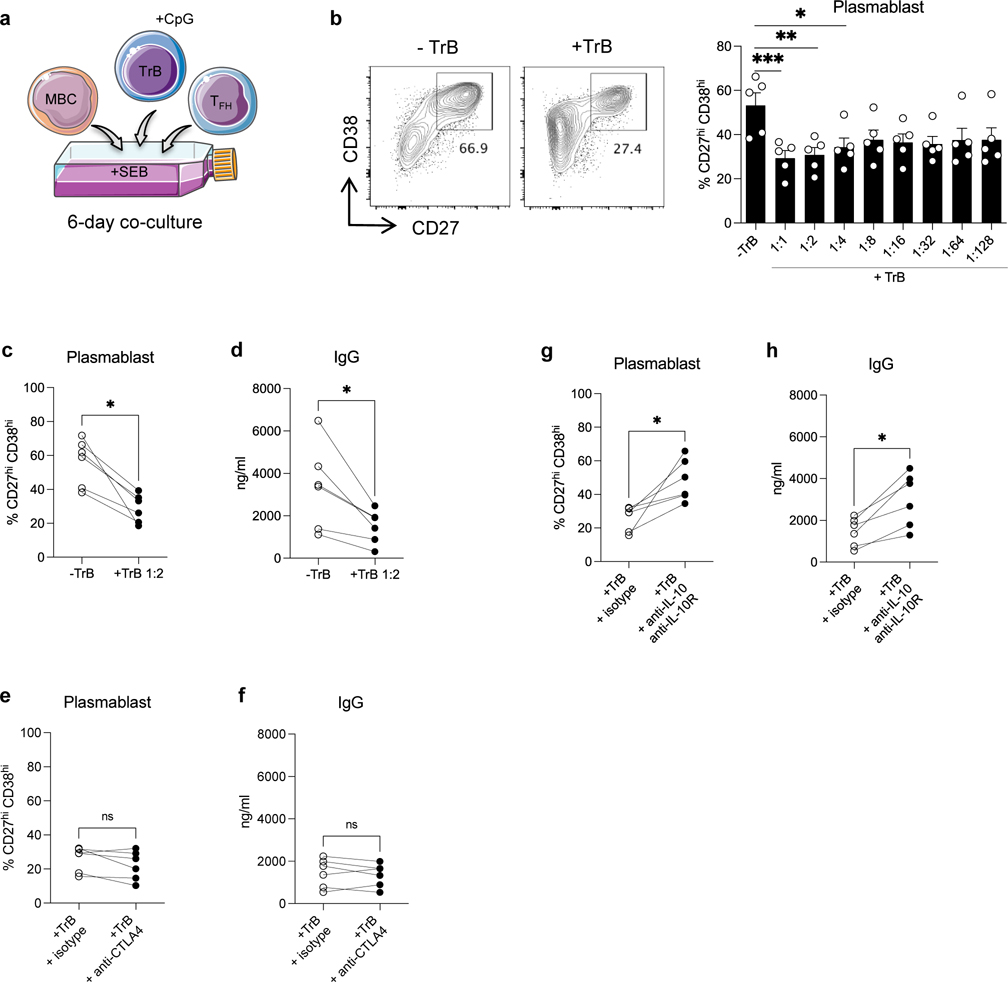
As for TREG, we evaluated TrB capacity to suppress TFH-B cell interaction and antibody responses in vitro using PBMC of HC (Figure 6a). When TrB were added to co-cultures, plasmablast generation at 6-days was significantly suppressed in a dose-independent manner with similar suppression potential from 1:1 to 1:128 ratio of TrB (Figure 6b–6c). Accordingly, the resulting IgG generation at 6-days was also significantly suppressed (Figure 6d). TrB also significantly diminished CD28 expression on TFH (Figure S10a) but not that of CD80 and CD86 on MBCs (not shown). TrB regulatory capacities are known to rely on their IL-10 secretion, but unlike TREG not on CTLA4. Therefore, we pre-incubated TrB with anti-IL-10 plus anti-IL-10R (or anti-CTLA4) blocking antibodies before supplementing them to TFH-B co-cultures. IL-10/IL-10R blocking resulted in significant recoveries of plasmablasts and IgG, while blocking CLTA4 did not (Figure 6e–6h). IL-10/IL-10R blocking also significantly restored CD28 expression on TFH (Figure S10b–S10c), but not that of CD80 and CD86 on MBCs (not shown).
Figure 6. Analyses of TrB capacity to suppress TFH-B cell interactions in vitro.
(a) Schematic representation of sorted MBCs (CD19+CD4−CD38loCD27+) and TFH (CD19−CD4+CD25loCD127+CD45RO+CXCR5+) co-cultured with autologous CpG-pre-activated TrB (CD19+CD4−CD24hiCD38hi) from HC, in the presence of SEB (6 days). (b) Representative examples of flow cytometry analysis of CD27hiCD38hi plasmablasts obtained after 6 days of TFH-B co-cultures with or without TrB at 1:2 ratio. Bar plot of percentages of CD27hiCD38hi plasmablasts after 6 days of TFH-B co-cultures with or without supplementation of TrB from 1:1 to 1:128 ratio; N=5 per condition. (c) Percentages of CD27hiCD38hi plasmablasts (N=6), and (d) amount of IgG in supernatants (N=6) after 6 days of TFH-B co-cultures with or without supplementation of TrB at 1:2 ratio. TrB were pre-incubated with anti-CTLA4 antibody or isotype-matched control, then added to TFH-B co-cultures at 1:2 ratio. (e) Percentages of CD27hiCD38hi plasmablasts (N=6), and (f) amount of IgG in supernatants (N=6) after 6 days of co-cultures. TrB were pre-incubated with anti-IL-10 plus anti-IL-10R antibodies or isotype-matched control, then added to TFH-B co-cultures at 1:2 ratio. (g) Percentages of CD27hiCD38hi plasmablasts (N=6), and (h) amount of IgG in supernatants (N=6) after 6 days of co-cultures. Friedman test with Dunn’s post-test for panel b. Wilcoxon matched-pairs signed rank test for panel c, d, e, f, g and h. *P < 0.05; **P < 0.01; ***P < 0.001; ****P < 0.0001. Each dot represents one subject and horizontal lines of bars are mean values ± SEM.
We next assessed the capacity of TrB to directly suppress TFH activation using a TrB-TFH co-culture model (Figure S11a). TrB suppressed TFH cell proliferation in a dose-independent manner (Figure S11b–S11c) and this suppression was partially reversed by IL-10/IL-10R blocking but not CTLA4 blocking of TrB (Figure S11d–S11e).
Thus, TrB efficiently suppressed TFH cell proliferation and their capacity to promote B cell differentiation into plasmablast and antibody generation in vitro.
Loss in TREG and TrB cells correlates with expanded TFH and MBCs, and more pathogenic DSA responses during ABMR
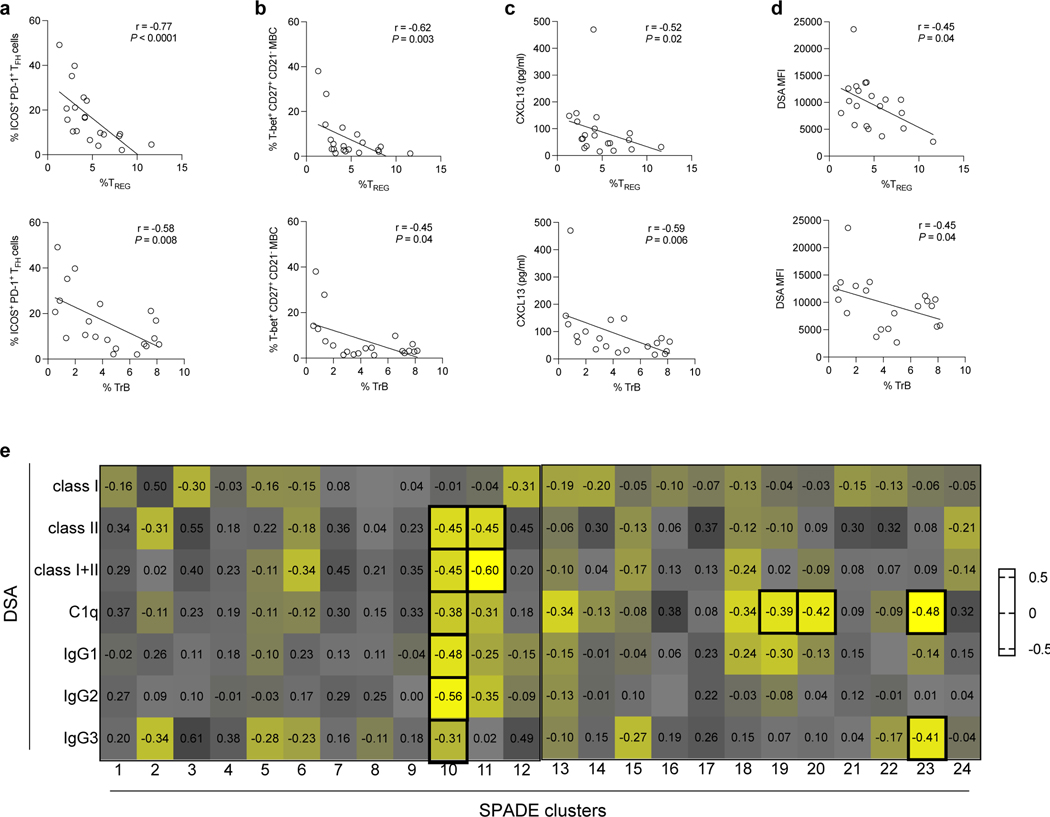
Activated GC responses are observed during ABMR, which are reflected by the expansion of circulating ICOS+PD-1+ TFH and T-bet+CD27+CD21− MBCs, the release of CXCL13 in plasma and the generation of isotype-switched DSA of IgG3-dominant subclass that can bind C1q5 31 19. We therefore evaluated whether the frequencies of TREG and TrB correlated with such activated TFH, B cell and DSA responses in DSA+ABMR+ patients. Both TREG and TrB frequencies negatively correlated with those of ICOS+PD-1+ TFH, T-bet+CD27+CD21− MBCs and CXCL13 (Figure 7a–7c). We note that correlation was stronger for TREG than TrB for ICOS+PD-1+ TFH and T-bet+CD27+CD21− MBC analyses. Also, lower frequencies of both TREG and TrB paralleled with increased DSA MFI levels in serum (Figure 7d). Specifically, cluster 10 of TREG, unlike the other TREG clusters, was negatively correlated with DSA class I and class II levels, as well as those of IgG subclasses including IgG3, and of the C1q-binding (Figure 7e). While cluster 19 and 20 of TrB negatively correlated with C1q-binding, cluster 23 of TrB correlated with both C1q-binding and IgG3 subclass of DSA (Figure 7e).
Figure 7. Correlation of TREG and TrB frequencies with DSA responses during ABMR.
Spearman correlation analysis of percentages of blood TREG and TrB with percentages of blood (a) ICOS+PD-1+ TFH, (b) T-bet+CD27+CD21− MBCs, (c) CXCL13 levels measured in plasma by ELISA, and (d) DSA MFI levels measured in serum by Luminex are displayed in DSA+ABMR+ patients (N=20). (e) Heatmap showing Spearman correlation coefficients of percentages of TREG and TrB SPADE clusters with MFI levels of: class I, class II, sum of class I plus II, C1q-binding and IgG subclasses of DSA measured in serum from DSA+ABMR+ patients, by Luminex. Bold squares indicate correlations with P < 0.05. DSA class I and II analyses were performed for N=20, DSA IgG subclass analysis was performed for N=18 and DSA C1q-binding analysis was performed for N=19 patients.
Thus, gradual depletion in TREG and TrB is associated with increased DSA generation and specific defects in cluster 10 and 23 are associated with more pathogenic DSA responses during ABMR.
ABMR patients with low T-bet+CXCR5+ TREG display equally depleted T-bet+CD21− TrB, increased allograft injury and impaired allograft survival
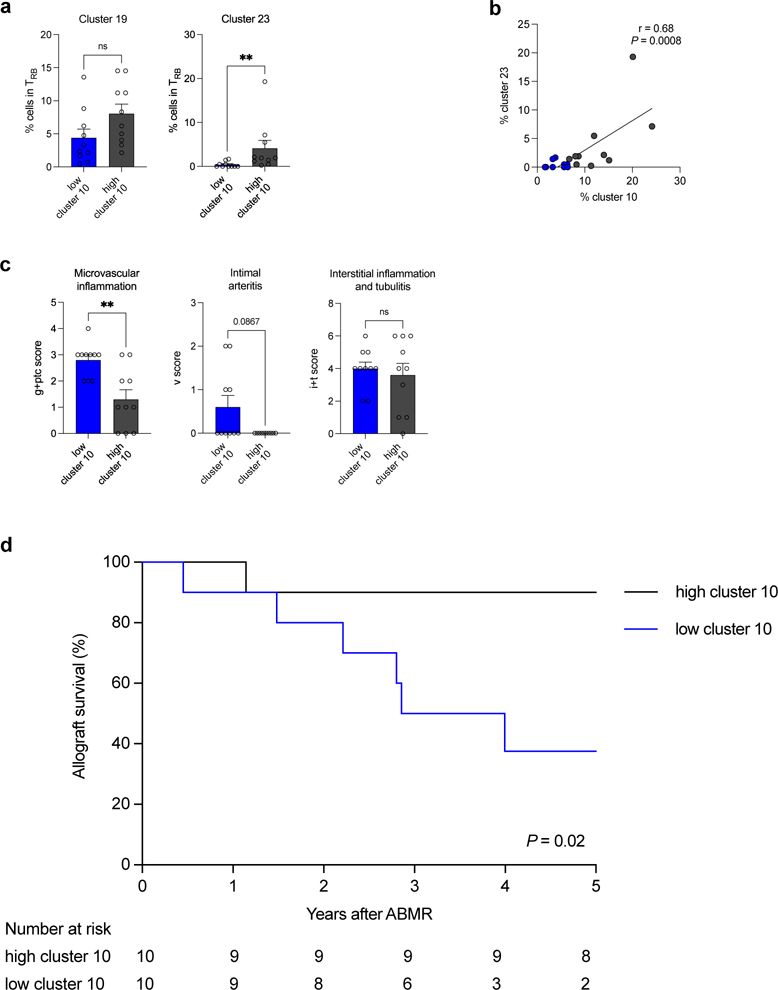
We next evaluated whether depletion in cluster 10 (T-bet+CXCR5+ TREG) was coordinated with that of TrB clusters, and its impact on allograft injury and outcome. Using the median frequency of cluster 10 in the DSA+ABMR+ group (in Figure 2e), we stratified DSA+ABMR+ patients into low (<6.6%) and high cluster 10 (>6.6%) subgroups. Patients with low cluster 10 had significantly lower overall TREG and TrB cell numbers as compared to those with high cluster 10 (not shown). The former patients also displayed significantly lower frequencies of cluster 23 (T-bet+CD21− TrB) but not of cluster 19 (Figure 8a). Remarkably, there was a strong correlation between the frequencies of cluster 10 and that of cluster 23, indicating paralleled reduction of these 2 clusters in DSA+ABMR+ patients (Figure 8b). Importantly, patients with low cluster 10 manifested significantly higher microvascular inflammation and tended to display more intimal arteritis in allografts, indicating a more severe histological form of rejection (Figure 8c). Finally, these DSA+ABMR+ patients displayed significantly lower allograft survival rate after 5 years of follow-up (Figure 8d).
Figure 8. Correlation of frequencies of cluster 10 of TREG with severity of ABMR manifestations.
DSA+ABMR+ patients (N=20) were stratified into two subgroups based on the median percentage of cluster 10 of TREG <6.6% (low, N=10) and >6.6% (high, N=10) in the DSA+ABMR+ group. (a) Bar plots of percentages of cluster 19 and 23 of TrB by flow cytometry are displayed according to low or high cluster 10 status. (b) Spearman correlation analysis of percentages of cluster 10 of TREG with percentages of cluster 23 of TrB in patients with low (blue) or high (grey) cluster 10. (c) Bar plots of histologic Banff scores of kidney allograft lesions evaluated at the time of ABMR, according to low or high cluster 10 status; microvascular inflammation = g+ptc Banff score, intimal arteritis = v Banff score and interstitial inflammation and tubulitis = i+t Banff score. (d) Kaplan-Meier analysis of kidney allograft survival rate according to low or high cluster 10 status. Mann-Whitney U test for panel a and c, Spearman test for panel b and log-rank test for panel d. **P < 0.01. Each dot represents one subject and horizontal lines of bars are mean values ± SEM.
Thus, the magnitude of T-bet+CXCR5+ TREG depletion, along with that of T-bet+CD21− TrB, are associated with the severity of ABMR manifestations and clinical outcome.
Discussion
The immune cellular effectors and cytokine environment at the basis of humoral alloimmunity and ABMR have been increasingly described in animal models and more recently in human 19,32,33. These involve a dominant and sustained IFN-γ and IL-21 driven inflammatory environment which is potent at: (i) promoting the emergence of activated ICOS+PD-1+ TFH cells, (ii) polarizing CD27+CD21− B cells towards a T-bet+ plasma-cell precursor state, and (iii) skewing isotype-switching of DSA towards more pathogenic IgG1 and IgG3 isotypes that can bind C1q 5,6,31. However, the immune cellular regulators of such deleterious humoral alloimmunity have been less studied. Here, we provide for the first time a comprehensive and concomitant characterization of the two major subsets of regulatory lymphocytes of the T and B cell compartments, that are present in the circulation of HC and of DSA− patients but are gradually and significantly depleted in the settings of active DSA responses and ABMR.
Although TREG and TrB have been found to be associated with protection against T-cell mediated rejection processes in numerous studies, only few studies have investigated their significance and potential role in limiting B cell- and antibody-mediated alloimmune processes 34–37. Here, we identified a striking numerical reduction in TREG and TrB cells in patients mounting DSA who progressed to ABMR (DSA+ABMR+), which strikingly persisted longitudinally and markedly distinguished them as compared to the DSA+ABMR− group. In addition to the quantitative loss, we demonstrated important qualitative alterations in cell distribution with marked decrease in cell clusters expressing the transcription factor T-bet on both T and B cell sides: T-bet+CXCR5+ TREG (cluster 10) and T-bet+CD21− TrB (cluster 23), respectively. In addition of being both Th1-polarized, both clusters shared another common attribute of being in an early differentiation state with features of immaturity: pre-TFR-like and T1-TrB, respectively. T-bet+CXCR5+ TREG display TFR-like features with high CXCR5 expression, although lacking the hallmarks of germinal center TFR ICOS and PD-1, and expressing CCR7 while lacking CD45RO expression. These indicate an early state of differentiation with likely not fully suppressive function but with potential to migrate towards CXCL13+ TFH/B cell areas and replenish the reservoir of functional TFR 38. T-bet+CD21− TrB are a subtype of T1 cells (with reinforced CD24 and CD38 expression), which represents an early development stage of TrB that produce more IL-10 but are considered much less mature than T2 TrB cells 39,40. The fact that both T-bet+CXCR5+ TREG and T-bet+CD21− TrB, the respective precursor subsets of TREG and TrB, are lost likely explain the global reduction in cell numbers of both TREG and TrB compartments observed during the development of humoral alloimmunity and ABMR.
Thymoglobulin induction therapy is known to provoke cell depletion of both TREG and TrB cells 30,41,42. In this cohort, as all patients received Thymoglobulin, the differences in TREG and TrB cell numbers and composition across the patient groups cannot be explained by Thymoglobulin effects. Instead, distinct inflammatory instructions and chronic alloantigenic triggers may explain the durable impairment of TREG and TrB cell repopulation and maintenance in patients undergoing ABMR. Also, the inflammatory signals driving this impaired regulatory cell repopulation may likely reprogram regulatory T-bet+CXCR5+ TREG and T-bet+CD21− TrB towards effector T-bet+ TFH and T-bet+ MBCs during ABMR, although this remains to be investigated.
As TREG that express T-bet were previously described to play a role in the control of Th1-driven immune responses, due to similar migratory features,17 it is tempting to speculate that the persistent lack of both regulatory T-bet+CXCR5+ TREG and T-bet+CD21− TrB could favor the emergence of effector T-bet+ MBCs driven by TFH cell help, that are known to be responsible for deleterious plasma cell and DSA generation 31. This hypothesis is supported by our in vitro data showing efficient suppression of TFH and B cell activation and IgG generation by both TREG and TrB, as well as our ex vivo correlates showing a gradual association between decreased T-bet+CXCR5+ TREG (cluster 10) and T-bet+CD21− TrB (cluster 23) with augmented DSA responses and more severe histological lesions of rejection. However, since most patients in the study had mixed ABMR lesions, these more severe rejection lesions may also be due to an ongoing TCMR associated event. Also, a TCMR component of mixed ABMR, differing immunosuppression load due to a previous transplant, and prior treatment of TCMR before ABMR occurrence may have impacted the TREG and TrB changes observed during ABMR in this study. One important finding is that patients with low cluster 10 were also the ones with the lowest frequency of cluster 23, supporting that both subsets were concomitantly compromised, which had detrimental consequences on allograft survival in these patients. However, before circulating TREG and TrB subsets can be considered as potential prognostic markers in ABMR, these need to be tested in larger and independent cohorts for clinical validation. Additionally, whether changes in TREG and TrB subsets can be detectable at time of DSA development but before ABMR occurrence remains to be investigated in future studies.
One limitation of this study is that the functional capacity of T-bet+CXCR5+ TREG and T-bet+CD21− TrB to suppress TFH-B cell interactions and DSA formation was not evaluated, thus future studies are warranted to evaluate this potential. Additionally, since protocol biopsies were performed only during the first year, we cannot rule out the occurrence of undetected cases of subclinical ABMR in the second year that could possibly impact on results.
Recent advances have been achieved in the understanding of TREG-TrB cell interactions and their common dependency on specific cytokine environments. It is likely that promoting a tolerogenic environment that will contribute to restoring and maintenance of both TREG and TrB cell populations, rather than a single cell population, would be more beneficial for optimal control of humoral alloimmunity and ABMR. The anti-inflammatory IL-10 produced by TrB not only favors the differentiation of CD4 T cells towards regulatory TFR and TREG phenotypes rather than an effector TFH fate, but also strongly inhibits TFH capacity to help B cells via the modulation of their IL-21 production 24,26. Here, our data further support that IL-10 is important for both TREG- and TrB-mediated suppression of TFH cell activation and proliferation, as well as B cell expression of CD80 and CD86, resulting in greatly diminished plasmablast and IgG production. Therefore, promoting an IL-10 production of both TREG and TrB, in addition to interfering with the costimulatory axis CTLA4/CD80/CD86, will likely help for efficient control of the TFH-dependent B cell immune response during ABMR. Conversely, interfering with pro-inflammatory cytokines such as TNFa and IL-6 may promote the regulatory functions of TREG and TrB during ABMR. Using anti-TNFa appears to be an interesting manner of increasing IL-10/TNFa ratio in TrB, while favoring TREG expansion via promoting membrane TNFa–TNFa-RII binding on TREG, both of which would result in global enhancement of regulatory activity during antibody responses 36,43. IL-6 blockade represents another opportunity to promote regulatory versus effector function during ABMR, as tocilizumab has been shown to efficiently favor TREG and TrB expansion while compromising TFH and MBC number and function 44,45.
In the past decades, innovative therapies based on TREG cell infusion have successfully emerged in the preclinical and clinical settings 46. Very recent studies have shown optimal cell survival of infused TREG and acceptable safety profiles including similar rates of allograft rejection in kidney transplant patients treated with TREG cell infusion therapy 47,48. In addition, engineered donor-specific chimeric antigen receptor (CAR)-TREG have shown promising results in limiting DSA generation and rejection in experimental animal models 49,50. However, future therapies should address whether these TREG cell-based therapies, and potentially future TrB cell-based therapies, can be utilized in transplant patients to specifically prevent DSA generation and ultimately progression to ABMR.
In conclusion, our study demonstrated that both TREG and TrB may play a role in liming humoral responses and identified concomitant quantitative and qualitative defects in both TREG and TrB compartments, suggesting that the main regulatory T and B cell responses are equally compromised in patients undergoing ABMR. Thus, these findings warrant immune monitoring of patients at risk for ABMR and urgent therapeutic interventions to replenish and sustain TREG and TrB cells in these patients.
Supplementary Material
Figure S1. Longitudinal analyses of TREG in kidney transplant recipients
Figure S2. High dimensional flow cytometry analyses of TREG in individual patients
Figure S3. Longitudinal analyses of T-bet+ CXCR5+ TREG in kidney transplant recipients
Figure S4. Gating strategy for sorting MBCs, TFH, TREG and TrB cells for co-culture
Figure S5. Analyses of TREG capacity to suppress cognate TFH and B cell activation in vitro
Figure S6. Analyses of TREG capacity to suppress TFH cell proliferation in vitro
Figure S7. Longitudinal analyses of TrB in kidney transplant recipients
Figure S8. High dimensional flow cytometry analyses of TrB in individual patients
Figure S9. Longitudinal analyses of T-bet+ CD21− TrB in kidney transplant recipients
Figure S10. Analyses of TrB capacity to suppress cognate TFH and B cell activation in vitro
Figure S11. Analyses of TrB capacity to suppress TFH cell proliferation in vitro
Table S1. Patients demographics
Table S2. TREG cell clusters and phenotypic patterns
Table S3. TrB cell clusters and phenotypic patterns
Table S4. Antibodies for flow cytometry
Acknowledgments
This work was supported by the following grants: R21-AI116746 (DM), R01 AI130010 (DM), 5T32AI074490–12 (KL) and the Human Immunology Program at the STI. We thank Marilyn Marrari for the help with data analysis, and Dr. Sundaram Hariharan, Beth Elinoff and David McMichael for the help with clinical data collection.
Footnotes
Disclosure
All the authors declared no competing interests.
Publisher's Disclaimer: This is a PDF file of an unedited manuscript that has been accepted for publication. As a service to our customers we are providing this early version of the manuscript. The manuscript will undergo copyediting, typesetting, and review of the resulting proof before it is published in its final form. Please note that during the production process errors may be discovered which could affect the content, and all legal disclaimers that apply to the journal pertain.
References
- 1.Gaston RS, Cecka JM, Kasiske BL, et al. Evidence for antibody-mediated injury as a major determinant of late kidney allograft failure. Transplantation. 2010;90:68–74. [DOI] [PubMed] [Google Scholar]
- 2.Sellarés J, de Freitas DG, Mengel M, et al. Understanding the causes of kidney transplant failure: the dominant role of antibody-mediated rejection and nonadherence. Am J Transplant. 2012;12:388–399. [DOI] [PubMed] [Google Scholar]
- 3.Loupy A, Lefaucheur C. Antibody-Mediated Rejection of Solid-Organ Allografts. N Engl J Med. 2018;379:1150–1160. [DOI] [PubMed] [Google Scholar]
- 4.Louis K, Hertig A, Taupin J-L, et al. Markers of graft microvascular endothelial injury may identify harmful donor-specific anti-HLA antibodies and predict kidney allograft loss. Am J Transplant. 2019;19:2434–2445. [DOI] [PubMed] [Google Scholar]
- 5.Louis K, Macedo C, Bailly E, et al. Coordinated Circulating T Follicular Helper and Activated B Cell Responses Underlie the Onset of Antibody-Mediated Rejection in Kidney Transplantation. J Am Soc Nephrol. 2020;31:2457–2474. [DOI] [PMC free article] [PubMed] [Google Scholar]
- 6.Louis K, Macedo C, Metes D. Targeting T Follicular Helper Cells To Control Humoral Allogeneic Immunity. Transplantation. 2021. Apr 1; 10.1097/TP.0000000000003776. [DOI] [PMC free article] [PubMed] [Google Scholar]
- 7.Chhabra M, Alsughayyir J, Qureshi MS, et al. Germinal Center Alloantibody Responses Mediate Progression of Chronic Allograft Injury. Front Immunol. 2018;9:3038. [DOI] [PMC free article] [PubMed] [Google Scholar]
- 8.Hu M, Wang YM, Wang Y, et al. Regulatory T cells in kidney disease and transplantation. Kidney Int. 2016;90:502–514. [DOI] [PubMed] [Google Scholar]
- 9.Gauthier JM, Harrison MS, Krupnick AS, et al. The emerging role of regulatory T cells following lung transplantation. Immunol Rev. 2019;292:194–208. [DOI] [PubMed] [Google Scholar]
- 10.Miyajima M, Chase CM, Alessandrini A, et al. Early acceptance of renal allografts in mice is dependent on foxp3(+) cells. Am J Pathol. 2011;178:1635–1645. [DOI] [PMC free article] [PubMed] [Google Scholar]
- 11.Taylor PA, Noelle RJ, Blazar BR. CD4(+)CD25(+) immune regulatory cells are required for induction of tolerance to alloantigen via costimulatory blockade. J Exp Med. 2001;193:1311–1318. [DOI] [PMC free article] [PubMed] [Google Scholar]
- 12.Joffre O, Santolaria T, Calise D, et al. Prevention of acute and chronic allograft rejection with CD4+CD25+Foxp3+ regulatory T lymphocytes. Nat Med. 2008;14:88–92. [DOI] [PMC free article] [PubMed] [Google Scholar]
- 13.Taflin C, Nochy D, Hill G, et al. Regulatory T cells in kidney allograft infiltrates correlate with initial inflammation and graft function. Transplantation. 2010;89:194–199. [DOI] [PubMed] [Google Scholar]
- 14.Matignon M, Aissat A, Canoui-Poitrine F, et al. Th-17 Alloimmune Responses in Renal Allograft Biopsies From Recipients of Kidney Transplants Using Extended Criteria Donors During Acute T Cell-Mediated Rejection. Am J Transplant. 2015;15:2718–2725. [DOI] [PubMed] [Google Scholar]
- 15.Bestard O, Cruzado JM, Rama I, et al. Presence of FoxP3+ regulatory T Cells predicts outcome of subclinical rejection of renal allografts. J Am Soc Nephrol. 2008;19:2020–2026. [DOI] [PMC free article] [PubMed] [Google Scholar]
- 16.Miyara M, Yoshioka Y, Kitoh A, et al. Functional delineation and differentiation dynamics of human CD4+ T cells expressing the FoxP3 transcription factor. Immunity. 2009;30:899–911. [DOI] [PubMed] [Google Scholar]
- 17.Wing JB, Tanaka A, Sakaguchi S. Human FOXP3+ Regulatory T Cell Heterogeneity and Function in Autoimmunity and Cancer. Immunity. 2019;50:302–316. [DOI] [PubMed] [Google Scholar]
- 18.Sage PT, Sharpe AH. T follicular regulatory cells. Immunol Rev. 2016;271:246–259. [DOI] [PubMed] [Google Scholar]
- 19.Mohammed MT, Cai S, Hanson BL, et al. Follicular T cells mediate donor-specific antibody and rejection after solid organ transplantation. Am J Transplant. 2021;21:1893–1901. [DOI] [PMC free article] [PubMed] [Google Scholar]
- 20.Alhabbab RY, Nova-Lamperti E, Aravena O, et al. Regulatory B cells: Development, phenotypes, functions, and role in transplantation. Immunol Rev. 2019;292:164–179. [DOI] [PubMed] [Google Scholar]
- 21.Cherukuri A, Mohib K, Rothstein DM. Regulatory B cells: TIM-1, transplant tolerance, and rejection. Immunol Rev. 2021;299:31–44. [DOI] [PMC free article] [PubMed] [Google Scholar]
- 22.Flores-Borja F, Bosma A, Ng D, et al. CD19+CD24hiCD38hi B cells maintain regulatory T cells while limiting TH1 and TH17 differentiation. Sci Transl Med. 2013;5:173ra23. [DOI] [PubMed] [Google Scholar]
- 23.Cherukuri A, Rothstein DM, Clark B, et al. Immunologic human renal allograft injury associates with an altered IL-10/TNF-α expression ratio in regulatory B cells. J Am Soc Nephrol. 2014;25:1575–1585. [DOI] [PMC free article] [PubMed] [Google Scholar]
- 24.Achour A, Simon Q, Mohr A, et al. Human regulatory B cells control the TFH cell response. J Allergy Clin Immunol. 2017;140:215–222. [DOI] [PubMed] [Google Scholar]
- 25.Lin X, Wang X, Xiao F, et al. IL-10-producing regulatory B cells restrain the T follicular helper cell response in primary Sjögren’s syndrome. Cell Mol Immunol. 2019;16:921–931. [DOI] [PMC free article] [PubMed] [Google Scholar]
- 26.Ding T, Su R, Wu R, et al. Frontiers of Autoantibodies in Autoimmune Disorders: Crosstalk Between Tfh/Tfr and Regulatory B Cells. Front Immunol. 2021;12:641013. [DOI] [PMC free article] [PubMed] [Google Scholar]
- 27.Kotecha N, Krutzik PO, Irish JM. Web-based analysis and publication of flow cytometry experiments. Curr Protoc Cytom. 2010;Chapter 10:Unit10.17. [DOI] [PMC free article] [PubMed] [Google Scholar]
- 28.van der Maaten L, Hinton G. Visualizing Data using t-SNE. J Mach Learn Res. 2008;9:2579–2605. [Google Scholar]
- 29.Qiu P, Simonds EF, Bendall SC, et al. Extracting a cellular hierarchy from high-dimensional cytometry data with SPADE. Nat Biotechnol. 2011;29:886–891. [DOI] [PMC free article] [PubMed] [Google Scholar]
- 30.Macedo C, Hadi K, Walters J, et al. Impact of Induction Therapy on Circulating T Follicular Helper Cells and Subsequent Donor-Specific Antibody Formation After Kidney Transplant. Kidney Int Rep. 2019;4:455–469. [DOI] [PMC free article] [PubMed] [Google Scholar]
- 31.Louis K, Bailly E, Macedo C, et al. T-bet+CD27+CD21− B cells poised for plasma cell differentiation during antibody-mediated rejection of kidney transplants. JCI Insight. 2021;6:148881. [DOI] [PMC free article] [PubMed] [Google Scholar]
- 32.Kim EJ, Kwun J, Gibby AC, et al. Costimulation blockade alters germinal center responses and prevents antibody-mediated rejection. Am J Transplant. 2014;14:59–69. [DOI] [PMC free article] [PubMed] [Google Scholar]
- 33.Kwun J, Knechtle S. Experimental modeling of desensitization: What have we learned about preventing AMR? Am J Transplant. 2020;20 Suppl 4:2–11. [DOI] [PMC free article] [PubMed] [Google Scholar]
- 34.Macedo C, Walters JT, Orkis EA, et al. Long-term effects of alemtuzumab on regulatory and memory T-cell subsets in kidney transplantation. Transplantation. 2012;93:813–821. [DOI] [PMC free article] [PubMed] [Google Scholar]
- 35.Shabir S, Girdlestone J, Briggs D, et al. Transitional B lymphocytes are associated with protection from kidney allograft rejection: a prospective study. Am J Transplant. 2015;15:1384–1391. [DOI] [PubMed] [Google Scholar]
- 36.Cherukuri A, Salama AD, Mehta R, et al. Transitional B cell cytokines predict renal allograft outcomes. Sci Transl Med. 2021;13:eabe4929. [DOI] [PubMed] [Google Scholar]
- 37.Laguna-Goya R, Utrero-Rico A, Cano-Romero FL, et al. Imbalance favoring follicular helper T cells over IL10+ regulatory B cells is detrimental for the kidney allograft. Kidney Int. 2020;98:732–743. [DOI] [PubMed] [Google Scholar]
- 38.Fonseca VR, Agua-Doce A, Maceiras AR, et al. Human blood Tfr cells are indicators of ongoing humoral activity not fully licensed with suppressive function. Sci Immunol. 2017;2:eaan1487. [DOI] [PMC free article] [PubMed] [Google Scholar]
- 39.Suryani S, Fulcher DA, Santner-Nanan B, et al. Differential expression of CD21 identifies developmentally and functionally distinct subsets of human transitional B cells. Blood. 2010;115:519–529. [DOI] [PubMed] [Google Scholar]
- 40.Palanichamy A, Barnard J, Zheng B, et al. Novel human transitional B cell populations revealed by B cell depletion therapy. J Immunol. 2009;182:5982–5993. [DOI] [PMC free article] [PubMed] [Google Scholar]
- 41.Sewgobind VDKD, Kho MML, van der Laan LJW, et al. The effect of rabbit anti-thymocyte globulin induction therapy on regulatory T cells in kidney transplant patients. Nephrol Dial Transplant. 2009;24:1635–1644. [DOI] [PubMed] [Google Scholar]
- 42.Svachova V, Sekerkova A, Hruba P, et al. Dynamic changes of B-cell compartments in kidney transplantation: lack of transitional B cells is associated with allograft rejection. Transpl Int. 2016;29:540–548. [DOI] [PubMed] [Google Scholar]
- 43.Nguyen DX, Ehrenstein MR. Anti-TNF drives regulatory T cell expansion by paradoxically promoting membrane TNF-TNF-RII binding in rheumatoid arthritis. J Exp Med. 2016;213:1241–1253. [DOI] [PMC free article] [PubMed] [Google Scholar]
- 44.Roll P, Muhammad K, Schumann M, et al. In vivo effects of the anti-interleukin-6 receptor inhibitor tocilizumab on the B cell compartment. Arthritis Rheum. 2011;63:1255–1264. [DOI] [PubMed] [Google Scholar]
- 45.Chandran S, Leung J, Hu C, et al. Interleukin-6 blockade with tocilizumab increases Tregs and reduces T effector cytokines in renal graft inflammation: A randomized controlled trial. Am J Transplant. 2021;21:2543–2554. [DOI] [PubMed] [Google Scholar]
- 46.Raffin C, Vo LT, Bluestone JA. Treg cell-based therapies: challenges and perspectives. Nat Rev Immunol. 2020;20(3):158–172. doi: 10.1038/s41577-019-0232-6 [DOI] [PMC free article] [PubMed] [Google Scholar]
- 47.Harde PN, Gam DS, Sawitzk B, et al. Feasibility, long-term safety, and immune monitoring of regulatory T cell therapy in living donor kidney transplant recipients. Am J Transplant. 2021;21:1603–1611. [DOI] [PMC free article] [PubMed] [Google Scholar]
- 48.Sawitzki B, Harden PN, Reinke P, et al. Regulatory cell therapy in kidney transplantation (The ONE Study): a harmonised design and analysis of seven non-randomised, single-arm, phase 1/2A trials. Lancet. 2020;395:1627–1639. [DOI] [PMC free article] [PubMed] [Google Scholar]
- 49.Sicard A, Lamarche C, Speck M, et al. Donor-specific chimeric antigen receptor Tregs limit rejection in naive but not sensitized allograft recipients. Am J Transplant. 2020;20:1562–1573. [DOI] [PubMed] [Google Scholar]
- 50.Noyan F, Zimmermann K, Hardtke-Wolenski M, et al. Prevention of Allograft Rejection by Use of Regulatory T Cells With an MHC-Specific Chimeric Antigen Receptor. Am J Transplant. 2017;17:917–930. [DOI] [PubMed] [Google Scholar]
Associated Data
This section collects any data citations, data availability statements, or supplementary materials included in this article.
Supplementary Materials
Figure S1. Longitudinal analyses of TREG in kidney transplant recipients
Figure S2. High dimensional flow cytometry analyses of TREG in individual patients
Figure S3. Longitudinal analyses of T-bet+ CXCR5+ TREG in kidney transplant recipients
Figure S4. Gating strategy for sorting MBCs, TFH, TREG and TrB cells for co-culture
Figure S5. Analyses of TREG capacity to suppress cognate TFH and B cell activation in vitro
Figure S6. Analyses of TREG capacity to suppress TFH cell proliferation in vitro
Figure S7. Longitudinal analyses of TrB in kidney transplant recipients
Figure S8. High dimensional flow cytometry analyses of TrB in individual patients
Figure S9. Longitudinal analyses of T-bet+ CD21− TrB in kidney transplant recipients
Figure S10. Analyses of TrB capacity to suppress cognate TFH and B cell activation in vitro
Figure S11. Analyses of TrB capacity to suppress TFH cell proliferation in vitro
Table S1. Patients demographics
Table S2. TREG cell clusters and phenotypic patterns
Table S3. TrB cell clusters and phenotypic patterns
Table S4. Antibodies for flow cytometry


