Abstract
Photoacoustic (PA) imaging uses light excitation to generate the acoustic signal for detection and improves tissue penetration depth and spatial resolution in the clinically relevant depth of living subjects. However, strong background signals from blood and pigments have significantly compromised the sensitivity of PA imaging with exogenous contrast agents. Here we report a nanoparticle-based probe design that uses light to reversibly modulate the PA emission to enable photoacoustic photoswitching imaging (PAPSI) in living mice. Such a nanoprobe is built with upconverting nanocrystals and photoswitchable small molecules and can be switched on by NIR light through upconversion to UV energy. Reversibly photoswitching of the nanoprobe reliably removed strong tissue background, increased the contrast-to-noise ratio, and thus improved imaging sensitivity. We have shown that PAPSI can image 0.05 nM of the nanoprobe in hemoglobin solutions and 104 labeled cancer cells after implantation in living mice using a commercial PA imager.
Keywords: imaging agents, reversible photoswitching, photoacoustic imaging, upconversion nanoparticle, near infrared
Graphical Abstract
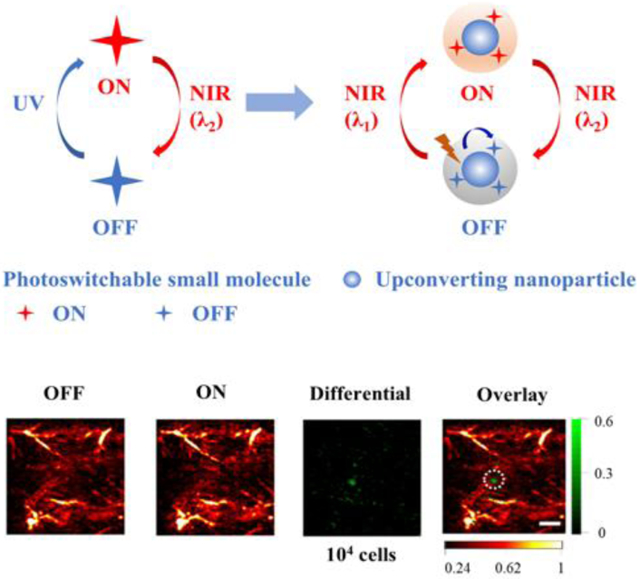
An upconverting nanoparticle probe can be switched on and off by near infrared (NIR) light for multiple cycles of photoacoustic imaging (PA). Through reversible modulation of the probe PA activation state, background-free PA signal can be recovered in imaging 0.05 nM of the probe in hemoglobin (Hb) solution and 104 labeled cancer cells subcutaneously implanted in mice.
Introduction
Photoacoustic (PA) imaging, an emerging new non-ionizing biomedical imaging modality, overcomes the depth and resolution limits of conventional optical imaging by combining optical excitation and acoustic detection.[1,2] This exciting feature has stimulated strong interest and prompted the use of PA to visualize biological structures at various scales ranging from organelles, cells to organs at the clinically relevant depth of penetration, expanding its application in pre-clinical investigations and clinical practice.[3-5] PA contrast can be generated from highly light-absorbing endogenous molecules like hemoglobin (Hb), as well as exogenous contrast agents, which include organic dyes, proteins, and nanoparticles (NPs) such as gold nanorods, carbon nanotubes, graphenes, conjugating polymer NPs, and porphyrin-based lipidic nanostructures.[6-12] However, the high intrinsic background signals from blood and pigments in the body have significantly compromised the sensitivity of PA imaging with exogenous contrast agents.
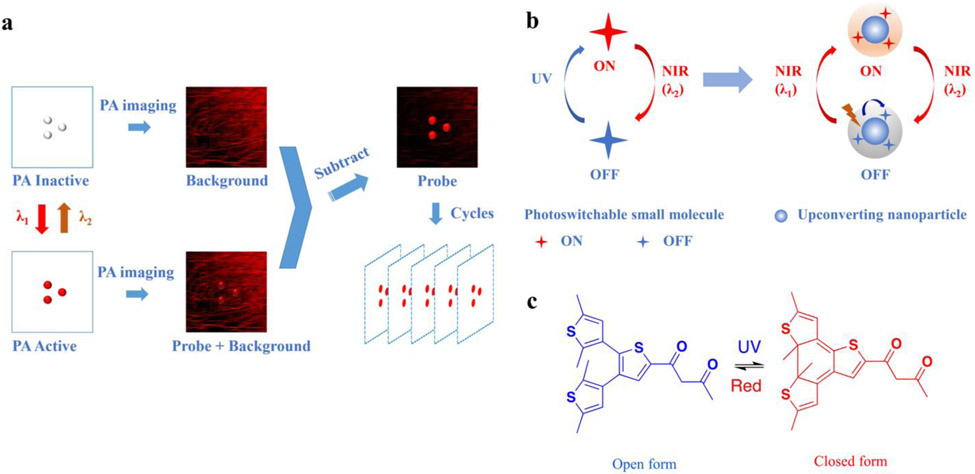
Several strategies have been explored to improve PA imaging sensitivity, including the optimization of the optical excitation or acoustic detection in the PA imaging system,[13] enhancing the brightness of exogenous contrast agents,[14] employing more efficient signal unmixing strategies,[15] and using nonlinear PA imaging technique.[16-18] A new attractive direction is to develop PA probes that can be temporally modulated by light to induce changes in the PA signal, a strategy similarly used for modulating the fluorescence signals of the probe by light to remove background signals in the “optical lock-in detection” method.[19] Assuming the PA background signal remains little change between pre- and post-modulation, the background suppression can be performed for every pair of PA images from each modulation cycle (Scheme 1a). For instance, the photothermal effect has been applied to modulate the thermo-responsive NPs (PNIPAM-Gold Nanorods) for PA imaging, and one cycle was demonstrated in vivo.[20] More recently, rose bengal-doped silica NPs have been developed as a novel optically modulable multimodal contrast agent for improved contrast in PA signal recovery. Real-time background-free PA signal recovery was demonstrated within tissue-mimicking phantoms and ex vivo tissues.[21] Another exciting example uses a bacterial phytochrome (BphP1) that can be reversibly switched by near-infrared (NIR) light to generate PA inactive and active states.[22] The reporter gene was genetically introduced into target cells and tissues for expression, and subsequent reaction with the co-factor biliverdin generated the photoswitchable PA imaging probe. Here we describe a new nanoprobe that can be reversibly switched by far-red and NIR light (680 and 980 nm) with multiple cycles in vivo and demonstrate its utility for PA photoswitching imaging (PAPSI) in living mice. We have shown that PAPSI effectively suppresses background in PA imaging and significantly enhances sensitivity in vivo — it can image 0.05 nM of the nanoprobe in Hb solutions and 104 labeled cancer cells subcutaneously implanted in living mice.
Scheme 1.
Principle of PAPSI and design of the photoswitchable nanoprobe. a) The working principle of PAPSI. PA imaging is first taken at the PA inactive state of the nanoprobe to collect the background signal. Then the switching laser (λ1) is applied to turn ON the probe to PA active state, followed by another PA imaging. The differential image produced by subtraction should only represent the probe signal. Then the probe is switched back to PA inactive state by another laser (λ2) to start the next cycle of PA imaging. Many differential images can be stacked to increase the probe signal and improve PA imaging sensitivity. b) Design of the NIR photoswitchable nanoprobe. A photoswitchable small molecule whose NIR absorption can be switched ON by UV light and switched OFF by NIR light (λ2) is combined with UCNP to form the nanoprobe. The UCNP can convert NIR light (λ1) to UV light and switch ON the photoswitchable small molecule. c) Chemical structure of the photoswitchable small molecule (3ThacacH) that can be switched between the open form to the closed form by UV and red light.
Results and Discussion
NIR light is generally preferred for whole-body imaging due to its deep tissue penetration but has low photon energy to reversibly switch small molecule chromophores. It can use a two-photon process but needs extremely high laser power (>106 W/cm2) and has a low efficiency.[23] Typically, higher energy photon like UV or visible light is required to enable the switching. To circumvent the use of UV light, upconverting NPs (UCNPs) have been developed to convert low-energy NIR light to shorter wavelength high-energy light for uncaging small molecules.[24,25] Due to their unique photophysical properties in upconversion luminescence, UCNPs have been widely explored for various imaging applications.[26-28] Therefore, we hypothesized using UCNPs for the photoswitching of small molecules by low-energy NIR light. Scheme 1 sketches our design concept of NIR photoswitchable PA nanoprobe, which contains three components: 1) photoswitchable small molecules whose NIR absorption can be reversibly switched by light, 2) UCNPs, and 3) an amphiphilic polymer coating.
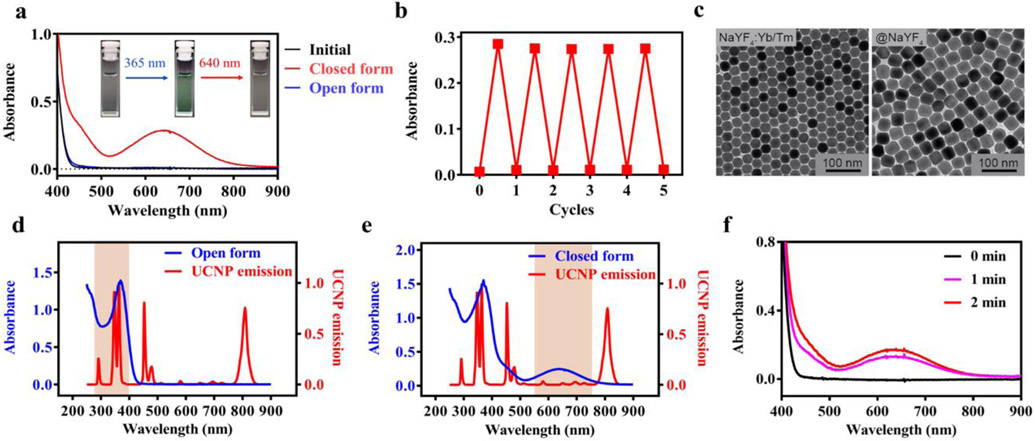
Photochromic diarylethenes are a class of commonly explored photoswitching molecules,[29] one of which dithienylethene-containing ß–diketone (3ThacacH) is shown in Scheme 1c and contains two isomers: the open and closed forms. UV light (365 nm) irradiation leads to cyclization from the open to closed form, and red light (640 nm) reverses it back. The open form has no absorption in the red to NIR range, while the closed form absorbs in the red-NIR range with a molar extinction coefficient of 3 × 10³ M−1 cm−1 (Figure 1a). The red-NIR absorption of 3ThacacH can be reversibly switched ON by UV light (365 nm, 4 W UV hand-held UV lamp, 10 s) and OFF by red light (10 mW/cm2, 10 s) (Figure 1b). The open form has blue fluorescence emission at 465 nm when excited with UV light, while the closed form is nonfluorescent in the NIR range when excited with red light (Figure S1). These optical properties make 3ThacacH ideal for building our PAPSI nanoprobe—There are two PA states at the red-NIR region: PA OFF with no absorption and PA ON with high absorption.
Figure 1.
Characterization of the photoswitchable small molecules (3ThacacH) and UCNPs. a) Absorption spectra of 3ThacacH in CHCl3 (0.1 mM) when it was switched ‘ON’ from the initial open form (black) to the closed form (red) by 365 nm light (4 W UV lamp, 10 s) and then switched OFF to the open form (blue) by 640 nm laser (10 mW/cm2, 10 s). Insert: The color of the sample solution changed from colorless to green then back to colorless when switched ON and OFF. b) Evolution of the absorption intensity of 3ThacacH at 640 nm when it was repeatedly switched ON/OFF by 365 nm and 640 nm light. c) TEM images of the UCNP. Left: The NaYF4 UCNP core doped with Yb3+ and Tm3+; Right: The UCNP core coated with an inert NaYF4 shell. d-e) Overlay of the emission spectrum of the UCNP and the absorption spectrum of 3ThacacH in d) open or e) closed form. f) 3ThacacH (0.1 mM in CHCl3) was switched ON when mixed with the UCNP (0.5 mg mL−1) and excited with CW 980 nm laser (average power density at 3 W/cm2).
We next synthesized a core/shell UCNP that can convert NIR light to UV emission to photoswitch 3ThacacH. The core is a NaYF4 nanocrystal doped with ytterbium (Yb) as the sensitizer and thulium (Tm) as the emitter (Figure 1c, left). The size of the nanocrystal core is 25 nm in diameter. To enhance UV emission, a high concentration of the sensitizer (59% Yb) was designed to enhance the efficiency of NIR light harvesting and energy transfer to the emitter (1% Tm). Furthermore, an optimized non-doped inert NaYF4 shell (5 nm) was added to suppress surface quenching effects (Figure 1c, right).[30] The corresponding X-ray diffraction (XRD) patterns of NaYF4:Yb/Tm and NaYF4:Yb/Tm@NaYF4 NPs in Figure S2 showed peak positions that can be well indexed as hexagonal NaYF4 (JCPDS file number 16-0334). The synthesized core/shell UCNPs exhibited strong UV emission at 345 and 362 nm when excited at 980 nm (Figure 1d, Figure S3). The quantum yield of the UV emission (250 – 400 nm) was determined to be 0.132% in CHCl3. The significant overlap between the UV emission peaks of the UCNPs and the absorption peak of the open form of 3ThacacH (Figure 1d) promised efficient energy transfer and photoswitching. Importantly, there is only subtle spectral overlap in the region of 500-750 nm between the absorption spectrum of the closed form of 3ThacacH and the emission spectrum of the UNCPs under 980 nm excitation (Figure 1e); thus, the emission of the UCNPs should not trigger the switching back of the closed form. To our delight, when the UCNPs (0.5 mg mL−1) and the open form of 3ThacacH (0.1 mM) were mixed in CHCl3 and excited with CW 980 nm light, we observed the characteristic broad absorption peak of the closed form at 640 nm within 1 minute (Figure 1f), confirming that the emission of the UCNPs was sufficient to switch 3ThacacH ON for PA imaging.
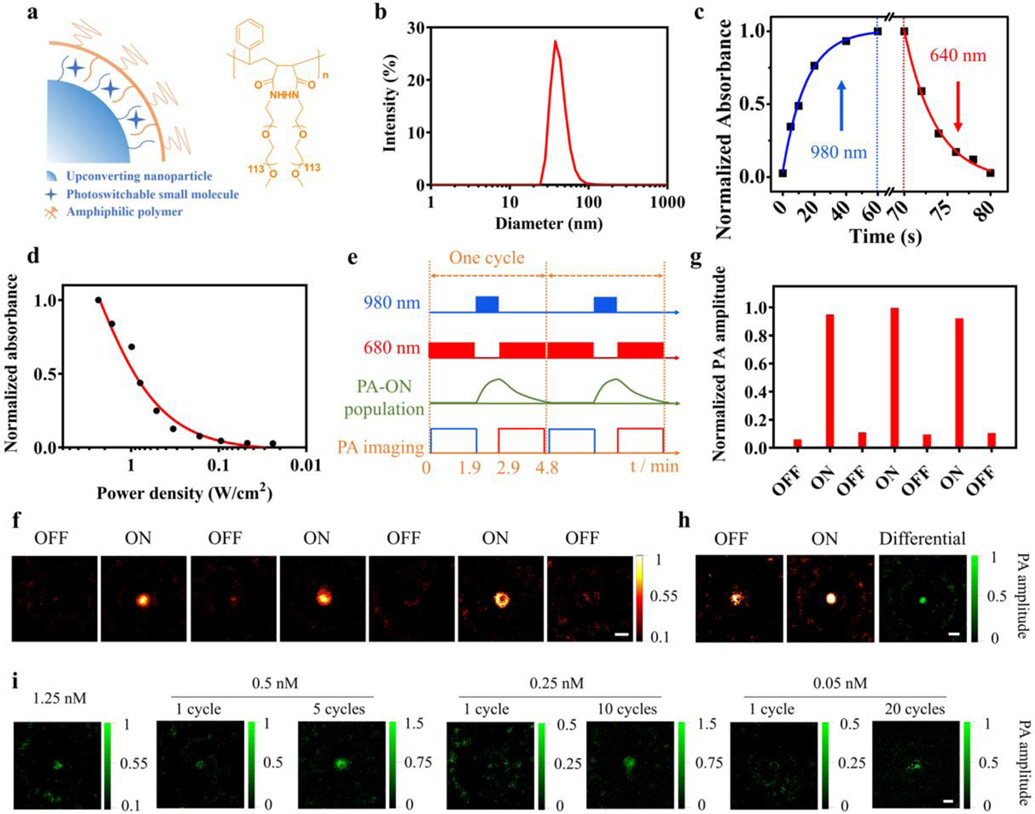
To build the UNCPs and 3ThacacH into a single NP, we introduced an amphiphilic polymer as the matrix (Figure 2a) to form a hydrophobic coating layer through the Van der Waals interactions between the styrene rings of the polymer and the oleic acid ligands on the surface of the UCNPs. The amphiphilic polymer itself has almost no absorption at the two major UV emission peaks of UCNPs (345 and 362 nm) and 100-folder lower absorbance at 290 nm compared to that of the open form 3ThacacH at the same mass concentration (Figure S4). Approximately 1.4 x 10⁴ 3ThacacH molecules were encapsulated in the coating layer of each nanoprobe with proximity to the UNCP core to enable efficient photoswitching.[31] The prepared nanoprobe exhibited an average size of 35 nm in TEM images (Figure S5), a hydrodynamic diameter of 40 nm (Figure 2b), and a mean zeta potential of −13.6 mV (Figure S6). The nanoprobe was stable within 30 days when stored at 4 °C (Figure S7). As expected, CW 980 nm light (60 s) switched the nanoprobe from the OFF state (no red/NIR absorption) to the ON state, and red light (640 nm, 10 s) reversed it back (Figure 2c and Figure S8). The threshold power density of 980 nm light for switching ON the nanoprobe in 1 min was determined to be about 0.079 W/cm2 (a 2-fold increase in absorbance than the OFF state; Figure 2d). The distance between Tm3+ and 3ThacacH in the nanoprobe is estimated between 5 to 17.5 nm, longer than the calculated Förster distance of 3.6 nm (SI). To probe the mechanism of energy transfer from the UCNPs to 3ThacacH within the nanoprobe, the emission intensity and lifetime of the nanoprobes with or without 3ThacacH encapsulated were measured and compared (Figure S9 and S10). When 3ThacacH was encapsulated in the nanoprobe, the UV emission intensity from the UCNP decreased by 82.8% at 345 nm and 80.2% at 362 nm, and the lifetime of the UV emission of the UCNP decreased from 336 to 308 μs at 345 nm and from 408 to 378 μs at 362 nm. These results show that the overall energy transfer efficiency from the UCNP to 3ThacacH is high (>80%), in which 7.3% to 8.3% is attributed to the nonradiative resonance energy transfer and the rest from the radiative photon reabsorption, as in the cases where UCNPs serve as ‘Nanolamps’.[32] It is worth noting that although even a thin inert shell can increase the distance between UCNP and 3ThacacH, thus significantly reduce the resonance energy transfer efficiency,[33] the 5 nm inert shell in our nanoprobe is essential for achieving strong UV emission from the UCNP and preventing the strong water quenching effect in the aqueous phase.
Figure 2.
Synthesis and characterization of the photoswitchable nanoprobe. a) Schematic of the photoswitchable nanoprobe and chemical structure of the amphiphilic polymer. b) Hydrodynamic diameter of the photoswitchable nanoprobe. c) Kinetic of the nanoprobe (2.5 nM in water) photoswitching by 980 nm laser (average power density 3 W/cm2) and 640 nm laser (10 mW/cm2). d) Absorbance of the nanoprobe (2.5 nM in water) at 640 nm upon irradiation by 980 nm laser for 1 min at various average power densities (3 to 0.024 W/cm2). e) A PAPSI cycle: A 980 nm laser switches ON the probe (1 min), and a 680 nm pulsed laser (7 ns pulses, 3 mJ, 20 Hz) collects PA image and also gradually switches OFF the probe (1.9 min). f) Representative OFF/ON PAPSI images of the nanoprobe (5 nM, 100 μL) in a transparent plastic tube. g) Normalized PA signal amplitude of PAPSI images in f). h-i) PAPSI of the nanoprobe mixed with Hb solution in a transparent plastic tube at various nanoprobe concentrations (h): 2.5 nM and (i): 1.25 to 0.05 nM. Scale bars: 2 mm.
The PA properties of the photoswitchable nanoprobe were first characterized in tube phantoms with a typical PAPSI cycle summarized in Figure 2e. In the initial OFF state, no PA signal was detected from the nanoprobe upon excitation at 680 nm (Figure 2f). Irradiation by 980 nm light for 1 min switched it to the PA-ON state, and a strong PA signal was collected with the 680 nm excitation. The 680 nm laser also gradually switched OFF the probe during the PA imaging. The average ON/OFF ratio of the PA signal amplitude of the nanoprobe was about 10 using this PAPSI cycle (Figure 2g). The PA signals of the nanoprobe at different excitation wavelengths (680, 700, and 750 nm) show that the nanoprobe generates the strongest PA signal at 680 nm (Figure S11), which is consistent with the absorption spectrum of 3ThacacH in the ON state (Figure 1a). The PA signal intensities of the nanoprobe from 0.25 to 5 nM obtained in one PAPSI cycle showed a linear relationship with the probe concentrations (Figure S12).
A solution of Hb (20 mg mL−1) was added to the tube phantom to examine the effect of high background signals on PAPSI. As shown in Figure 2h, in the OFF state, strong background PA signals from Hb were detected with the excitation at 680 nm. The ON state images were collected after the mixture was switched ON by 980 nm laser and the differential images recorded the PA signals from the nanoprobe. At high probe concentrations, e.g., 2.5 and 1.25 nM, one PAPSI cycle could produce the differential PA images with good contrast (Figure 2h&i and Figure S13). As the nanoprobe concentration decreased, the PAPSI signal could be enhanced by increasing the cycle number. For 0.5 nM, 5 cycles of PAPSI significantly enhanced the contrast-to-noise ratio (CNR = (IROI – IB) / σB, where IROI is the mean pixel intensity of the ROI, IB is the mean intensity of the positive pixels in the background, and σB is the standard deviation of the pixel intensities in the background) by about 2.6-fold (Figure 2i, Figure S14 and Table S1). For 0.25 nM, 10 PAPSI cycles increased the CNR from 0.85 to 8.53 (Figure 2i, Figure S15 and Table S1). Twenty cycles of PAPSI detected 0.05 nM of the nanoprobe with good imaging contrast (CNR>3) in the Hb solution (Figure 2i, Figure S16 and Table S1).
We compared PAPSI to other background correction methods for imaging sensitivity;[8,34] for example, the signal unmixing method collects an image at the valley wavelengths of the absorption spectrum of the probe, assuming it as the background for subtraction. The PA signal of the nanoprobe was obtained by subtracting the PA image at the valley wavelength (850 nm) from the PA image at the peak wavelength (680 nm). Note that this method assumes the PA signal of the background at 680 nm and 850 nm is the same, which is not necessarily true. As shown in Figure S17 and Table S2, the probe signal was barely detectable at 1.25 nM (CNR 1.56) and not detectable at 0.5 nM. In comparison, one PAPSI cycle detected 0.5 nM of the probe with a CNR of 6.46 (Table S1), demonstrating the advantage of PAPSI for addressing the background issue and improving the sensitivity of PA imaging.
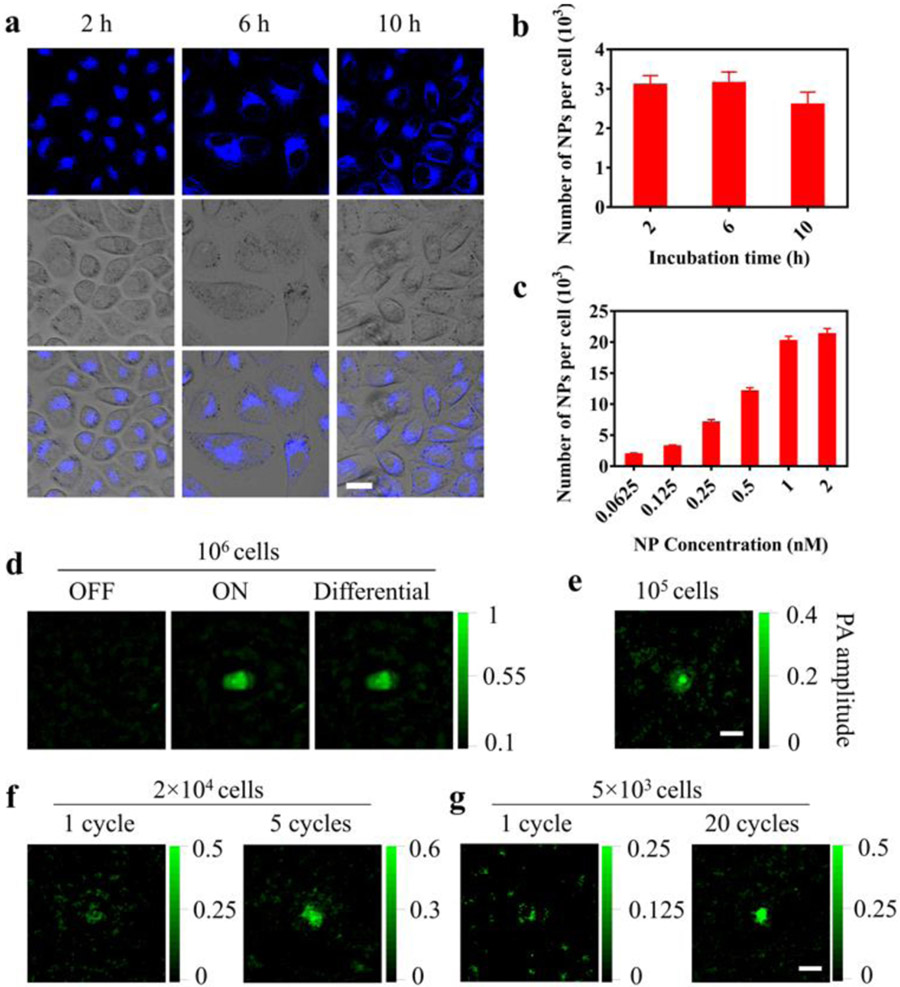
PAPSI was then applied to image live cells labeled with the nanoprobe. HeLa cells were labeled with the nanoprobe by co-incubation at 37 °C for 2 to 10 h. The cell uptake was confirmed by the blue fluorescence signals from the nanoprobe in the cell plasma (Figure 3a) and quantified by measuring the yttrium (Y) concentration with inductively coupled plasma mass spectrometry (ICP-MS). The maximum cell uptake was reached within 6 hours to about 2 × 10⁴ nanoparticles (NPs) per cell with the nanoprobe concentration of 1 nM (Figure 3b&c). The cell viability was found to be >85% at this concentration after 24 h of incubation (Figure S18).
Figure 3.
Cell labeling with the nanoprobe and PAPSI in the cells. a) Fluorescence images of the HeLa cells incubated with the nanoprobe (0.125 nM) for 2, 6, or 10 h at 37 °C. Scale bar: 20 μm. b, c) Number of nanoprobes taken up by the cells determined by ICP-MS at b) different incubation time (2–10 h) with the same probe concentration (0.125 nM) or c) different probe concentrations (0.0625–2 nM) with the same incubation time (6 h). Results are presented as Mean ± SD (three wells per group in 6-well cell culture plates). d-g) PAPSI images of labeled HeLa cells (2 × 10⁴ NPs per cell) in 10 μL PBS (pH 7.4) in a transparent plastic tube at indicated cell number. d): 106; e): 105, f): 2 × 10⁴; g): 5 × 10³ with indicated PAPSI cycle number. Scale bars: 2 mm.
HeLa cells labeled with the nanoprobe (2 × 10⁴ NPs per cell) were suspended in the transparent plastic tube for PAPSI. In the OFF state, the cell suspensions did not generate any PA signal at 680 nm (Figure 3d and Figure S19). After 980 nm light switching ON, PA imaging at 680 nm gave strong PA signals, indicating that the nanoprobe was successfully photoswitched ON after being taken up by the cells. The PAPSI signals of the cell suspension were correlated with the cell number: the CNR of one cycle PAPSI images dropped from 20.86 for 106 cells to 1.52 for 2 × 10⁴ cells (Figure 3d-f and Table S3), and improved as the cycle number of PAPSI increased: 5 and 20 cycles led to a CNR of 7.64 and 8.94 for 2 × 10⁴ and 5 × 10³ HeLa cells, respectively (Figure 3f&g, Figure S20 & S21, and Table S3). These results demonstrate that PAPSI is compatible with live cell imaging and provides excellent sensitivity.
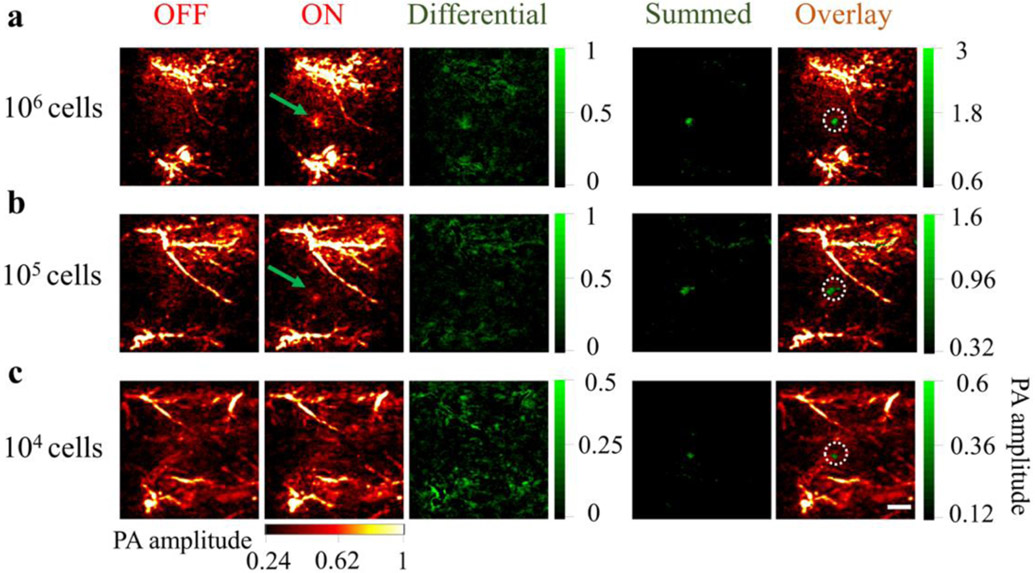
Before applying PAPSI to live animal imaging, we tested 20 PAPSI cycles on the mouse skin to evaluate the safety and heating effect of the photoswitching light. As shown in Figure S22 and S23, the 980 nm laser scanning didn’t cause skin damage but 2 degrees increase in temperature that returned to pre-scan value in 15 sec. Then we subcutaneously implanted labeled HeLa cells (2 × 10⁴ NPs per cell) on the back of nude mice for PAPSI. There were strong endogenous PA signals from the blood vessels in the OFF state (excitation at 680 nm). One PAPSI cycle could not fully remove background signals, but 5 cycles led to a high contrast PA image of 106 implanted HeLa cells (a CNR of 7.50) (Figure 4a, Figure S24, and Table S4). Increasing the PAPSI cycle number enabled imaging of a lower number of implanted cells--105 implanted HeLa cells were imaged with 10 cycles (Figure 4b and Figure S25) and 22 cycles for 104 HeLa cells (CNR > 2, Figure 4c, Figure S26 and Table S4).
Figure 4.
Tracking of HeLa cells labeled with the PAPSI nanoprobe in the living mice. a) 106, b) 105, c) 104 labeled cells were subcutaneously injected into the back of the NU/NU nude mice (three mice per group) and imaged by PAPSI with the cycle number of 5, 10, and 22, respectively. For each group, the stacked image of the differential images in all PAPSI cycles (“Summed”) is demonstrated and overlaid with the endogenous PA signals (the OFF image of the first PAPSI cycle). The white dashed circles indicate the predetermined position of the injected cells. Scale bar: 2 mm.
Many PA contrast agents such as ICG and other NIR absorbing dyes have been reported for cell labeling. The reported detection limit has been around 5 × 10⁵ cells in vitro using the same PA imaging instrument as ours.[34-36] In contrast, PAPSI has allowed the detection of 5 × 10³ cells in vitro and 104 cells in vivo, an improvement by two orders of magnitude.
Several methods have been explored to extract the probe signal from background signals in PA imaging, such as background subtraction, spectrum unmixing. PA images can be collected before and after probe injection at the same wavelength to subtract the background, but this process can only be performed at the initial time point of imaging when the pre-injection background may be reasonably similar to the post-injection background. In comparison, our nanoprobe can be switched ON/OFF on demand and repetitively. Multiple PA images are collected at a series of wavelengths to extract the probe signal from the background in spectrum unmixing, while PAPSI is performed by ON/OFF subtraction at a single wavelength, thus not influenced by wavelengths-dependent optical attenuation. It should be noted that PAPSI assumes that local background signals changes little during the period of each PAPSI cycle.
A key enabling element of our PAPSI nanoprobe is the UCNP that converts 980 nm light for photoswitching. The use of low energy 980 nm light minimizes potential phototoxicity and provides better imaging depth to about 1.8 cm (Figure S27). A continuous wave (CW) 980 nm laser was used for photoactivation in this work. A long-pulsed laser should help lower the laser power density, shorten photoactivation time, and optimize the upconversion efficiency of the nanocrystal.[37-39] All our PAPSI experiments were performed on a commercial PA imager with a second laser line introduced for photo activation. The imaging time for 20 cycles was over 1.5 hours. We estimated the respiration motion of the mice that resulted in blurring the boundary of an artificial blood vessel on the right rear thigh by about 4% (Figure S28). The motion effect can be significant in the regions closer to the diaphragm. If the emerging high-speed imaging platform can be used for controlling the photoswitching and PA imaging process, the imaging time can be shortened, and the motion effect can be minimized. To overcome the limitations in imaging speed, imaging depth, and quality of the existing PA systems, Wang et al. have recently developed a high-speed three-dimensional PA computed tomography (3D-PACT) platform for pre-clinical research and clinical translations.[40] These advances together will further empower PA for the visualization of the dynamic functional and molecular activities in deep tissue in vivo.[41]
Conclusion
In summary, we report the development of a photoswitchable PA nanoprobe based on UCNPs and photochromic small molecules for PAPSI. To the best of our knowledge, it is the first example of nanoprobes that can be reversibly switched ON/OFF by far-red to NIR light in living mice with multiple cycles for PA imaging. We have demonstrated the excellent capability of PAPSI in suppressing background signals and extracting probe signals with successful imaging of 0.05 nM of the nanoprobes in Hb solutions and 104 labeled cancer cells implanted in living mice. With further advances on UCNPs and high-speed PA imaging instrument engineering, PAPSI may lead to PA molecular imaging of tens of or even single cells in deep tissue locations in vivo.
Supplementary Material
Acknowledgements
This work was supported by the National Institutes of Health grant (R01GM128089-01A1) and the National Cancer Institute CCNE-TD at Stanford University (U54CA199075). PA imaging was performed in Stanford Center for Innovation in In vivo Imaging at Porter (Sci3@Porter). The authors thank Drs. Frezghi Habte (Sci3@Porter) and Michael Walters (ENDRA Life Sciences) for the help with the PA imaging system. TEM images and confocal fluorescence images were collected in the Cell Sciences Imaging Facility (CSIF) at Stanford. The authors thank Dr. John Perrino and Dr. Kitty Lee for the help with the TEM and confocal microscope, respectively. TEM was supported by NIH grant No. 1S10RR02678001.
References
- [1].Wang LV, Hu S, Science 2012, 335, 1458–1462. [DOI] [PMC free article] [PubMed] [Google Scholar]
- [2].Yao J, Wang LV, J. Biomed. Opt 2021, 26, 060602. [DOI] [PMC free article] [PubMed] [Google Scholar]
- [3].Chen R, Huang S, Lin T, Ma H, Shan W, Duan F, Lv J, Zhang J, Ren L, Nie L, Nat. Nanotechnol 2021, 16, 455–465. [DOI] [PubMed] [Google Scholar]
- [4].Moore C, V Jokerst J, Theranostics 2019, 9, 1550–1571. [DOI] [PMC free article] [PubMed] [Google Scholar]
- [5].Yang J-M, Favazza C, Chen R, Yao J, Cai X, Maslov K, Zhou Q, Shung KK, Wang LV, Nat. Med 2012, 18, 1297–1302. [DOI] [PMC free article] [PubMed] [Google Scholar]
- [6].Weber J, Beard PC, Bohndiek SE, Nat. Methods 2016, 13, 639–650. [DOI] [PubMed] [Google Scholar]
- [7].Brunker J, Yao J, Laufer J, Bohndiek SE, J. Biomed. Opt 2017, 22, 070901. [DOI] [PubMed] [Google Scholar]
- [8].Huynh E, Leung BYC, Helfield BL, Shakiba M, Gandier J-A, Jin CS, Master ER, Wilson BC, Goertz DE, Zheng G, Nat. Nanotechnol 2015, 10, 325–332. [DOI] [PubMed] [Google Scholar]
- [9].Pu K, Shuhendler AJ, Jokerst JV, Mei J, Gambhir SS, Bao Z, Rao J, Nat. Nanotechnol 2014, 9, 233–239. [DOI] [PMC free article] [PubMed] [Google Scholar]
- [10].Lovell JF, Jin CS, Huynh E, Jin H, Kim C, Rubinstein JL, Chan WCW, Cao W, Wang LV, Zheng G, Nat. Mater 2011, 10, 324–332. [DOI] [PubMed] [Google Scholar]
- [11].Pu K, Mei J, Jokerst JV, Hong G, Antaris AL, Chattopadhyay N, Shuhendler AJ, Kurosawa T, Zhou Y, Gambhir SS, Bao Z, Rao J, Adv. Mater 2015, 27, 5184–5190. [DOI] [PMC free article] [PubMed] [Google Scholar]
- [12].Chen Q, Liang C, Sun X, Chen J, Yang Z, Zhao H, Feng L, Liu Z, Proc. Natl. Acad. Sci 2017, 114, 5343–5348. [DOI] [PMC free article] [PubMed] [Google Scholar]
- [13].Chen R, He Y, Shi J, Yung C, Hwang J, Wang LV, Zhou Q, IEEE Trans. Ultrason. Ferroelectr. Freq. Control 2020, 67, 1848–1853. [DOI] [PMC free article] [PubMed] [Google Scholar]
- [14].Jiang Y, Upputuri PK, Xie C, Zeng Z, Sharma A, Zhen X, Li J, Huang J, Pramanik M, Pu K. Adv. Mater 2019, 31, 1808166. [DOI] [PubMed] [Google Scholar]
- [15].Wang LV, Yao J, Nat. Methods 2016, 13, 627–638. [DOI] [PMC free article] [PubMed] [Google Scholar]
- [16].Gao F, Bai L, Feng X, Tham HP, Zhang R, Zhang Y, Liu S, Zhao L, Zheng Y, Zhao Y, Small 2016, 12, 5239–5244. [DOI] [PubMed] [Google Scholar]
- [17].Zharov VP, Nat. Photonics 2011, 5, 110–116. [DOI] [PMC free article] [PubMed] [Google Scholar]
- [18].Lai P, Wang L, Tay J, Wang LV, Nat. Photonics 2015, 9, 126–132 [DOI] [PMC free article] [PubMed] [Google Scholar]
- [19].Marriott G, Mao S, Sakata T, Ran J, Jackson DK, Petchprayoon C, Gomez TJ, Warp E, Tulyathan O, Aaron HL, Isacoff EY, Yan Y, Proc. Natl. Acad. Sci 2008, 105, 17789–17794. [DOI] [PMC free article] [PubMed] [Google Scholar]
- [20].Chen Y-S, Yoon SJ, Frey W, Dockery M, Emelianov S, Nat. Commun 2017, 8, 15782. [DOI] [PMC free article] [PubMed] [Google Scholar]
- [21].Demissie AA, VanderLaan D, Islam MS, Emelianov S, Dickson RM Photoacoustics 2020, 20, 100198. [DOI] [PMC free article] [PubMed] [Google Scholar]
- [22].Yao J, Kaberniuk AA, Li L, Shcherbakova DM, Zhang R, Wang L, Li G, Verkhusha VV, Wang LV, Nat. Methods 2015, 13, 67–73. [DOI] [PMC free article] [PubMed] [Google Scholar]
- [23].Carroll EC, Berlin S, Levitz J, Kienzler MA, Yuan Z, Madsen D, Larsen DS, Isacoff EY, Proc. Natl. Acad. Sci 2015, 112, E776–E785. [DOI] [PMC free article] [PubMed] [Google Scholar]
- [24].Shen J, Chen G, Ohulchanskyy TY, Kesseli SJ, Buchholz S, Li Z, Prasad PN, Han G, Small 2013, 9, 3213–3217. [DOI] [PubMed] [Google Scholar]
- [25].Lederhose P, Chen Z, Müller R, Blinco JP, Wu S, Barner-Kowollik C, Angew. Chem. Int. Ed 2016, 55, 12195–12199. [DOI] [PubMed] [Google Scholar]
- [26].Gu Z, Yan L, Tian G, Li S, Chai Z, Zhao Y, Adv. Mater 2013, 25, 3758–3779. [DOI] [PubMed] [Google Scholar]
- [27].Zhou B, Shi B, Jin D, Liu X. Nat. Nanotechnol 2015, 10, 924–936. [DOI] [PubMed] [Google Scholar]
- [28].Maji SK, Sreejith S, Joseph J, Lin M, He T, Tong Y, Sun H, Yu SW, Zhao Y, Adv. Mater 2014, 26, 5633–5638. [DOI] [PubMed] [Google Scholar]
- [29].Poon C-T, Lam WH, Wong H-L, Yam VW-W, J. Am. Chem. Soc 2010, 132, 13992–13993. [DOI] [PubMed] [Google Scholar]
- [30].a) Chen X, Jin L, Kong W, Sun T, Zhang W, Liu X, Fan J, Yu SF, Wang F, Nat. Commun 2016, 7, 10304: [DOI] [PMC free article] [PubMed] [Google Scholar]; b) Chen B, Wang Y, Guo Y, Shi P, Wang F, ACS Appl. Mater. Interfaces 2021, 13, 2327–2335. [DOI] [PubMed] [Google Scholar]
- [31].Liu Q, Zhang Y, Peng CS, Yang T, Joubert L-M, Chu S, Nat. Photonics 2018, 12, 548–553. [DOI] [PMC free article] [PubMed] [Google Scholar]
- [32].Casar JR, McLellan CA, Siefe C, Dionne JA, ACS Photonics 2021, 8, 3–17. [DOI] [PMC free article] [PubMed] [Google Scholar]
- [33].Garfield DJ, Borys NJ, Hamed SM, Torquato NA, Tajon CA, Tian B, Shevitski B, Barnard ES, Suh YD, Aloni S, Neaton JB, Chan EM, Cohen BE, Schuck PJ, Nat. Photonics 2018, 7, 402–407. [Google Scholar]
- [34].Zhang C, Zhang Y, Hong K, Zhu S, Wan J, Sci. Rep 2017, 7, 42442. [DOI] [PMC free article] [PubMed] [Google Scholar]
- [35].Zhang C, Kimura R, Abou-Elkacem L, Levi J, Xu L, Gambhir SS, J. Nucl. Med 2016, 57, 1629–1634. [DOI] [PMC free article] [PubMed] [Google Scholar]
- [36].Levi J, Sathirachinda A, Gambhir SS, Clin. Cancer Res 2014, 20, 3721–3729. [DOI] [PMC free article] [PubMed] [Google Scholar]
- [37].Jayakumar MKG, Idris NM, Zhang Y, Proc. Natl. Acad. Sci 2012, 109, 8483–8488. [DOI] [PMC free article] [PubMed] [Google Scholar]
- [38].Liu Q, Yang T, Feng W, Li F, J. Am. Chem. Soc 2012, 134, 5390–5397. [DOI] [PubMed] [Google Scholar]
- [39].Qin X, Shen L, Liang L, Han S, Yi Z, Liu X, J. Phys. Chem. C 2019, 123, 11151–11161. [Google Scholar]
- [40].Li L, Hu P, Tong X, Na S, Cao R, Yuan X, Garrett DC, Shi J, Maslov K, Wang LV, Nat. Commun 2021, 12, 882. [DOI] [PMC free article] [PubMed] [Google Scholar]
- [41].Deán-Ben XL, Gottschalk S, Mc Larney B, Shoham S, Razansky D, Chem. Soc. Rev 2017, 46, 2158–2198. [DOI] [PMC free article] [PubMed] [Google Scholar]
Associated Data
This section collects any data citations, data availability statements, or supplementary materials included in this article.


