Abstract
The classical intent of PET imaging is to obtain the most accurate estimate of the amount of positron-emitting radiotracer in the smallest possible volume element located anywhere in the imaging subject at any time using the least amount of radioactivity. Reaching this goal, however, is confounded by an enormous array of interlinked technical issues that limit imaging system performance. As a result, advances in PET, human or animal, are the result of cumulative innovations across each of the component elements of PET, from data acquisition to image analysis. In the report that follows, we trace several of these advances across the imaging process with a focus on small animal PET.
Keywords: animal imaging, PET imaging, microPET, artificial intelligence
Introduction
Although human and small animal PET imaging systems share a common basis in physics1, the relative importance of each component of the imaging process (Fig. 1) can differ between these groups because of large differences in body size and mass2,3. In this work, we take “small animals” to mean rodents, e.g., mice or rats, that differ in weight from adult humans by factors of several thousand (mice) and several hundred (rats). The linear dimensions of whole organs of interest, e.g., liver, brain, etc., in these animals are of the order of centimeters across and other important structures are smaller still, e.g., long axis of the left ventricle of the mouse heart (a few millimeters) and sub-millimeter structures in the rat brain. It is not surprising, therefore, that spatial resolution must be substantially higher in small animal studies than in human studies if radioactivity content in these structures is to be accurately estimated.
Figure 1.
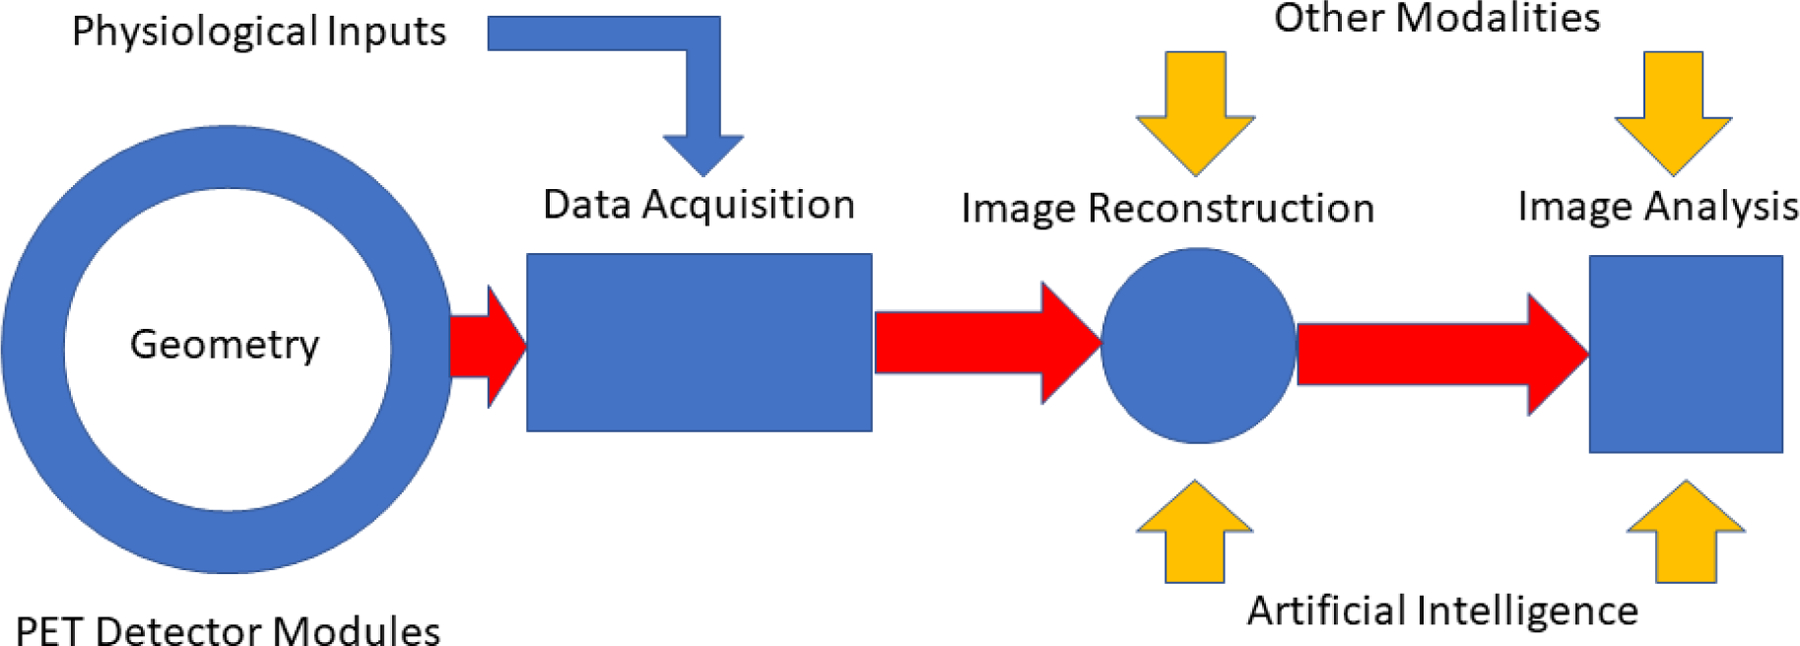
Schematic illustration of an idealized small animal PET imaging system. Relatively low temporal resolution physiological inputs include chest cuff pressure signals, ECG-R wave markers and stimulus gating signals. Compact, high density digital PET detector modules surrounding the full length of the imaging subject provide high temporal resolution LIST mode input of spatial, timing and energy signals from time coincident gamma ray events in the detector array. During image reconstruction these signals are transformed into PET images corrected for a host of confounding effects, e.g., attenuation, scatter, positron range, using physical models of these processes and, more recently, by artificial intelligence methods that achieve some of these same ends. Combination of these images with those from other modalities acquired serially or simultaneously provide complementary information about target structure and function.
The nature of this problem can be visualized by directly comparing human and animal imaging studies shown in Figure 2. If an adult human has a body mass of MH grams and is imaged with a clinical PET scanner with spatial resolution RH in mm, the sampling density in those PET images will be MH/RH3(g/mm3). If a small animal of mass MA is now imaged with a small animal PET scanner with spatial resolution RA in mm, the sampling density in the corresponding PET images will be MA/RA3 If the sampling density in the human scanner is taken as the “standard” and we require the sampling density of the animal scanner to be at least as great as the human, then:
| (1) |
Eqn. 1 is plotted for the equality in Figure 3 for a range of animal body weights assuming a human adult mass of 70 kg and a nominal 3 mm spatial resolution for the human PET scanner.
Figure 2.
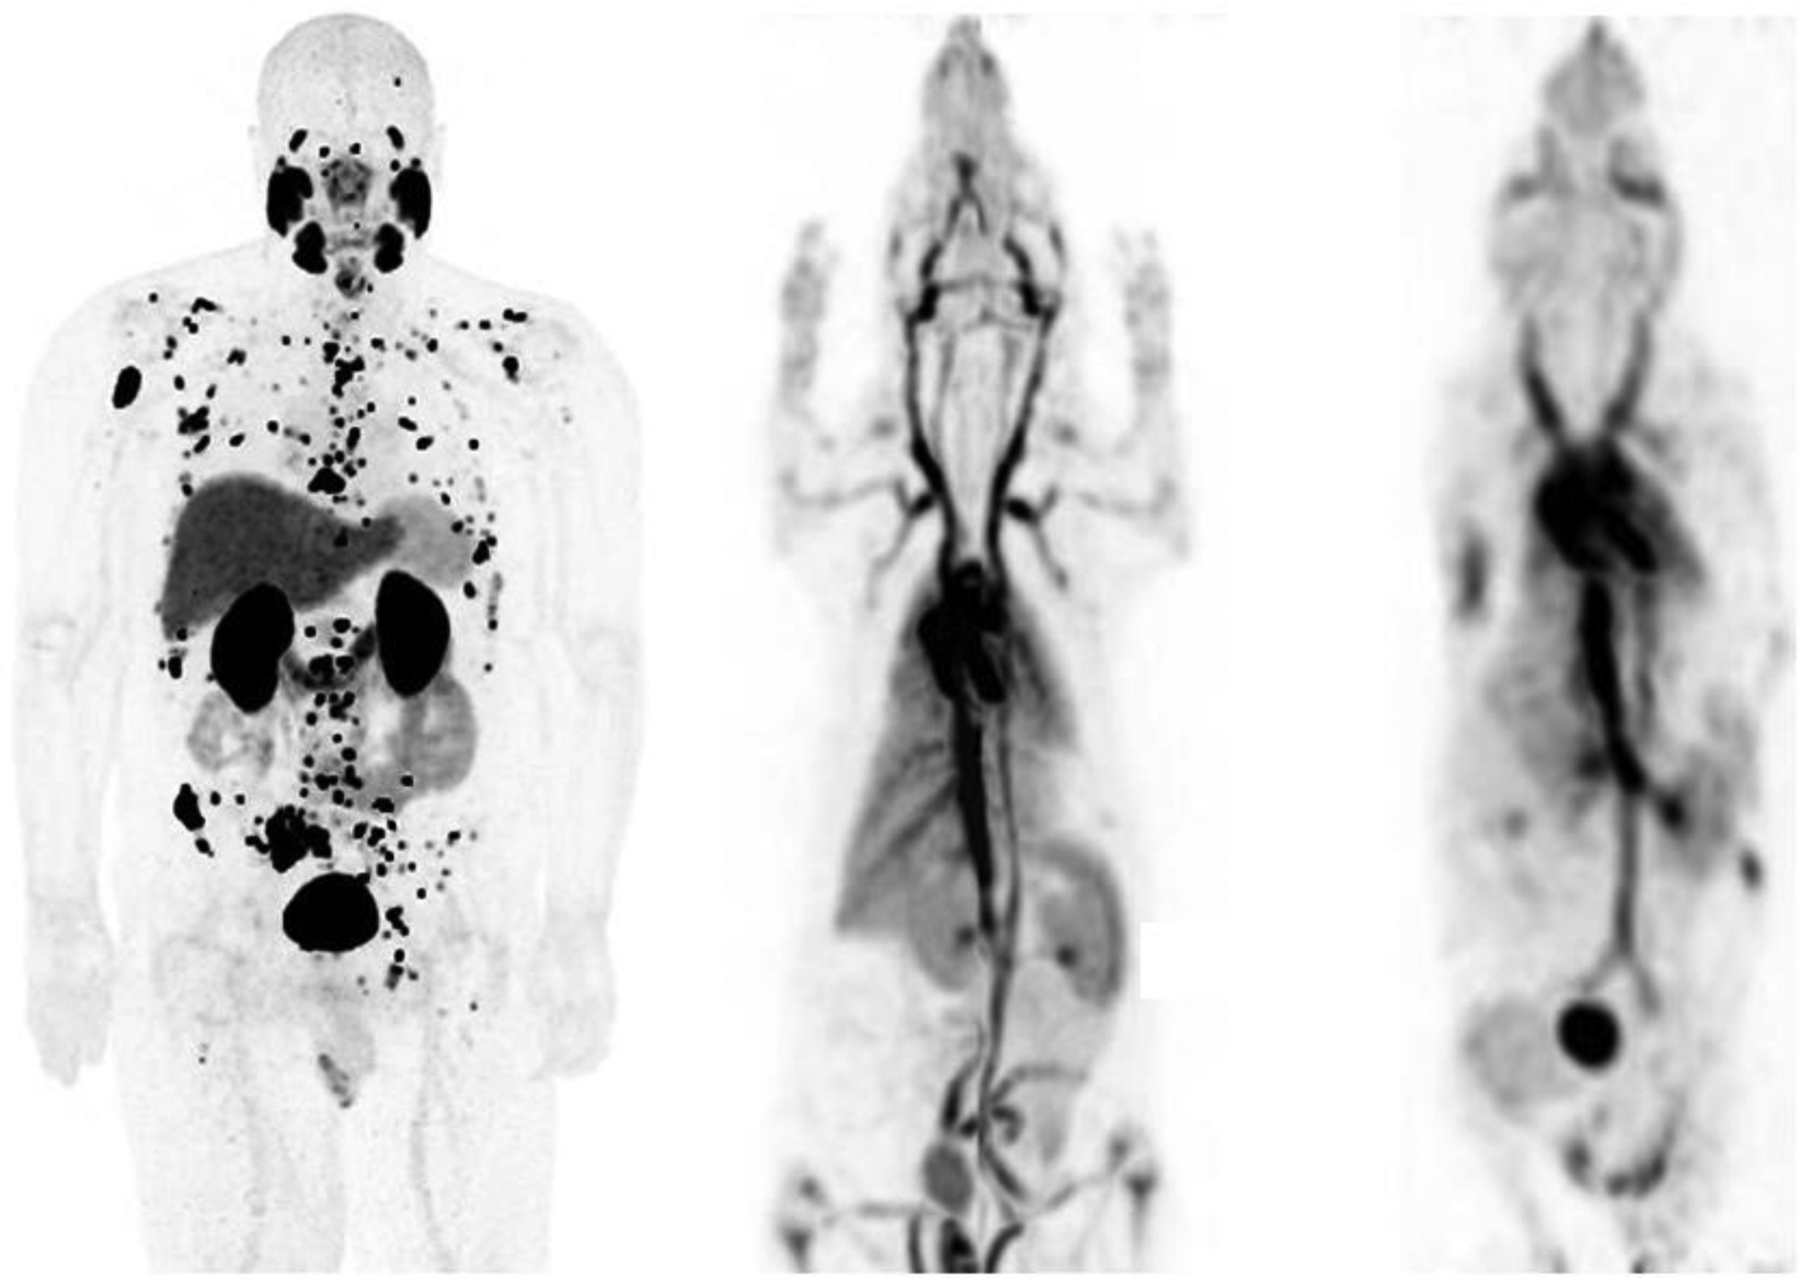
Maximum intensity whole body human 18F-DCFPyL (left), rat (middle) and mouse (right) 18F albumin PET images displayed at the same physical size. Rat body weights are typically several hundred times smaller and mice several thousand times smaller than the body weight of an adult human. The human scanner has a spatial resolution of approximately 3 mm, the animal scanner approximately 1 mm. The rat and mouse images appear progressively “blurrier” than the human image in part because of poorer spatial sampling density. This effect is somewhat exaggerated here because of the differing body distributions of the two agents.
Figure 3.
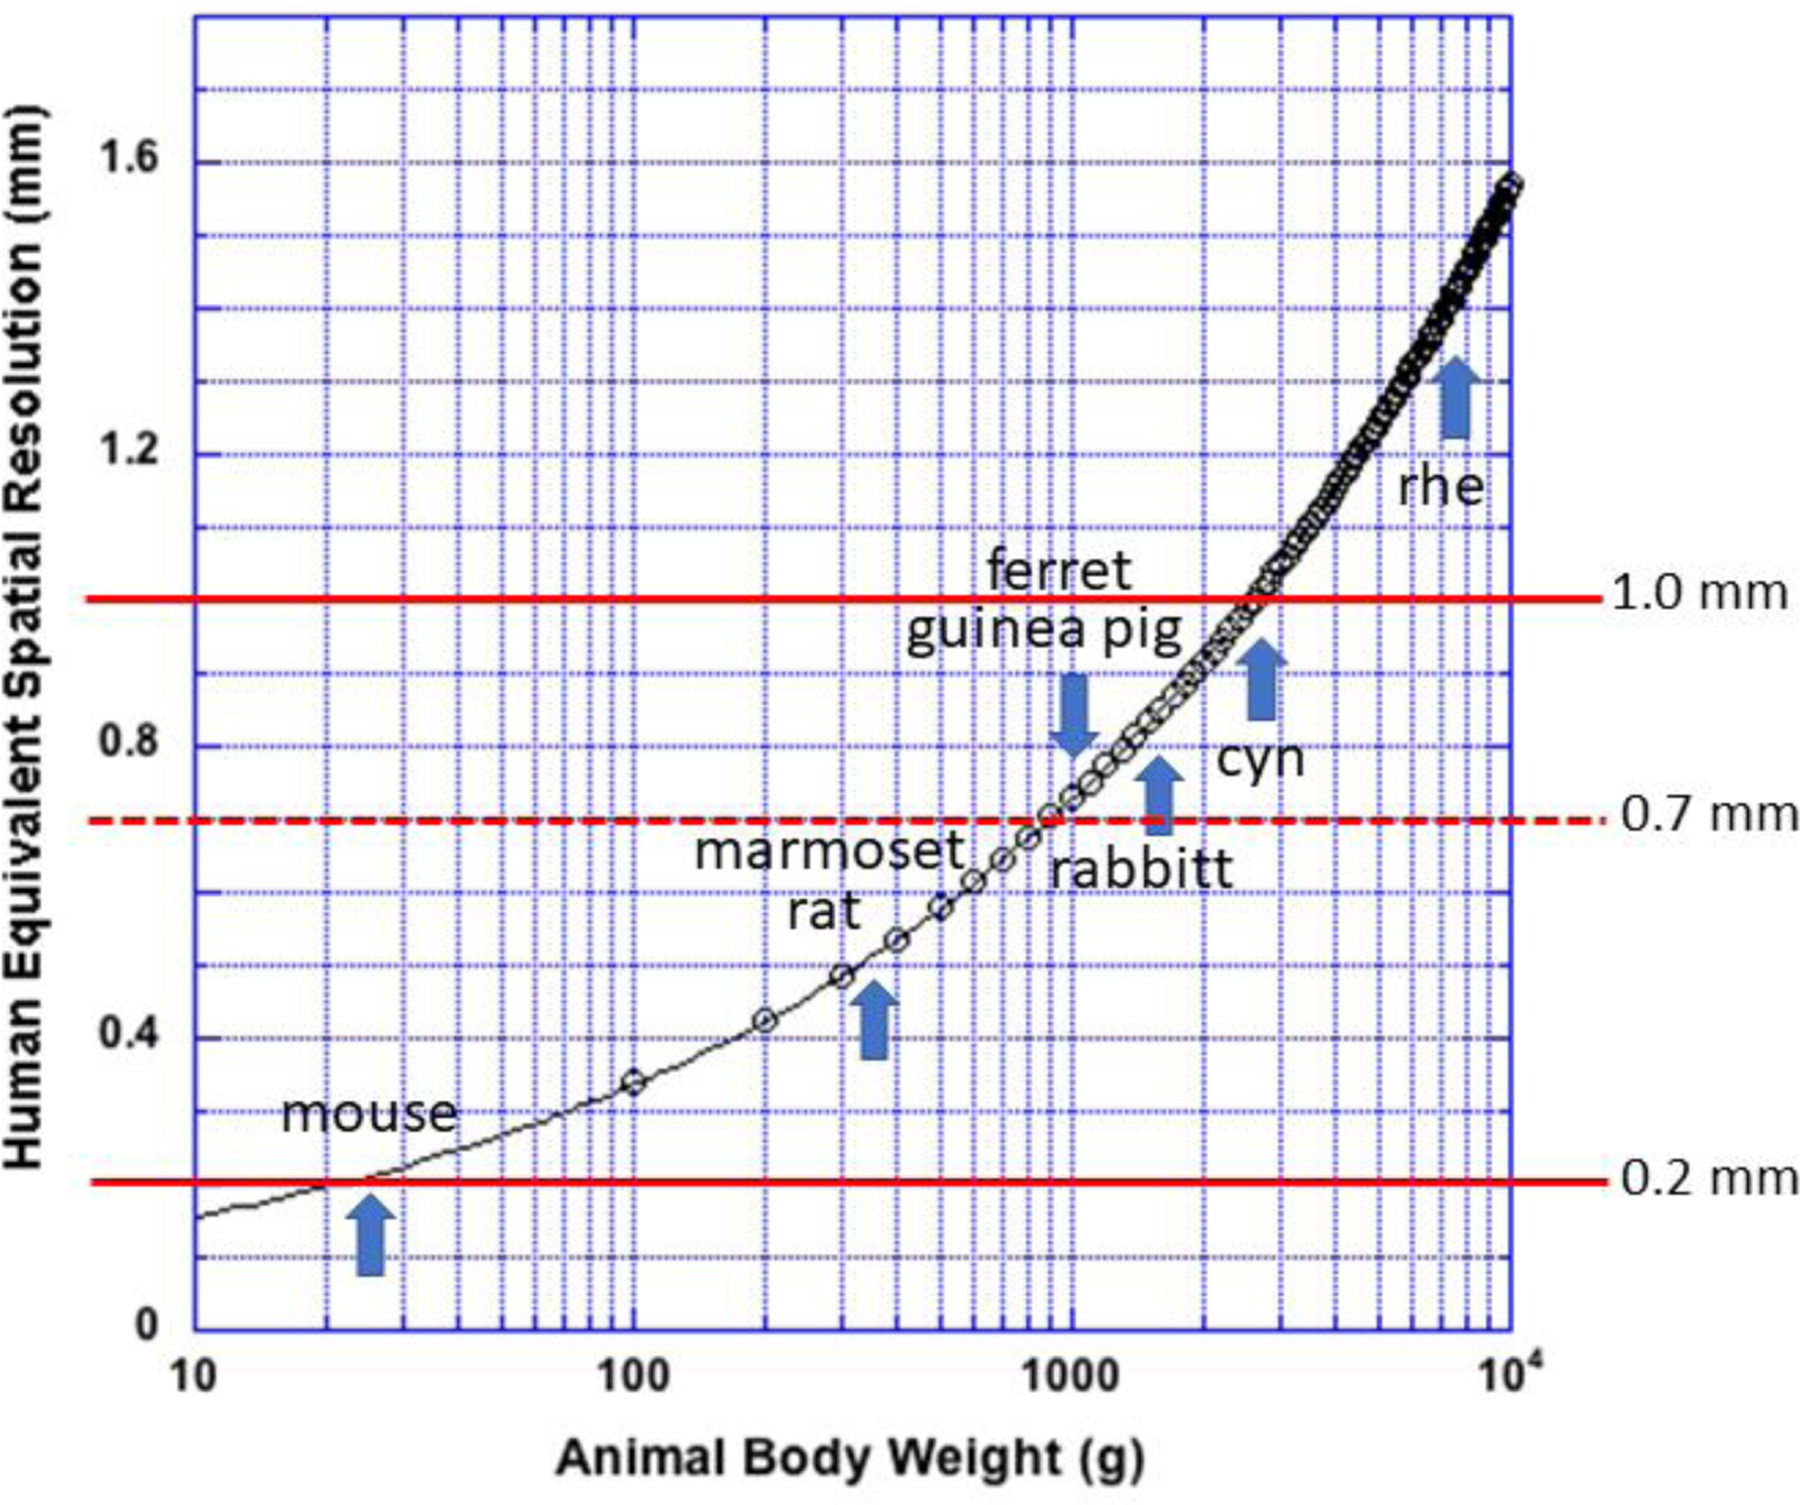
Spatial resolution of a small animal PET scanner needed to produce an image with the same sampling density as a human PET scanner with 3 mm spatial resolution imaging an adult human subject. Red line at 1 mm locates a typical resolution value for contemporary small animal scanners, 0.7 mm, a line that locates an estimate of the best possible physical spatial resolution, and a line at 0.2 mm that locates the resolution needed to image a mouse with human sampling density. Adult animal weights vary widely by age, sex and subtype for each specie and are included here only as a guide. rhe: rhesus macaque monkey; cyn: cynomolgus monkey.
To the extent that this human/animal comparison is valid, several features in Figure 3 deserve comment. First, typically reported spatial resolutions for contemporary small animal PET scanners are of the order of 1 mm though some manufacturers claim values down to 0.5 mm4 (or better). Figure 3 suggests, however, that small animal PET scanners cannot match human sampling densities until the body weight of small animals exceeds about 350 g for scanners with the highest reported resolutions and about 2.5 kg body weight for scanners with reported resolutions of the order of 1 mm. Figure 3 also suggests that no contemporary small animal PET scanner can image mice with the same sampling density afforded adult human subjects. Although we are focusing on rodent-sized animals, it is of interest that several manufacturers now offer small animal PET scanners that meet the human sampling condition for animals the size of rabbits or larger by using some of the advanced scanner designs and computational methods described here.
“Spatial resolution” is not entirely determined by the PET scanner but can be degraded by effects occurring in the imaging target. The annihilation of a positron/electron pair some distance from the original decaying nucleus, the positron range, is also an important determinant of spatial resolution5. Positron range depends on the properties of the surrounding medium and the isotope-dependent energy of the emitted positron. The average positron range for 18F in water, for example, is about 0.5 mm, while for Rb-82, the average range is about 4 mm. In air, the positron range of 18F is over a meter. The difference in range between oil with a density slightly lower than water and air for 18F positrons can be easily visualized by experiment (Figure 4).
Figure 4.
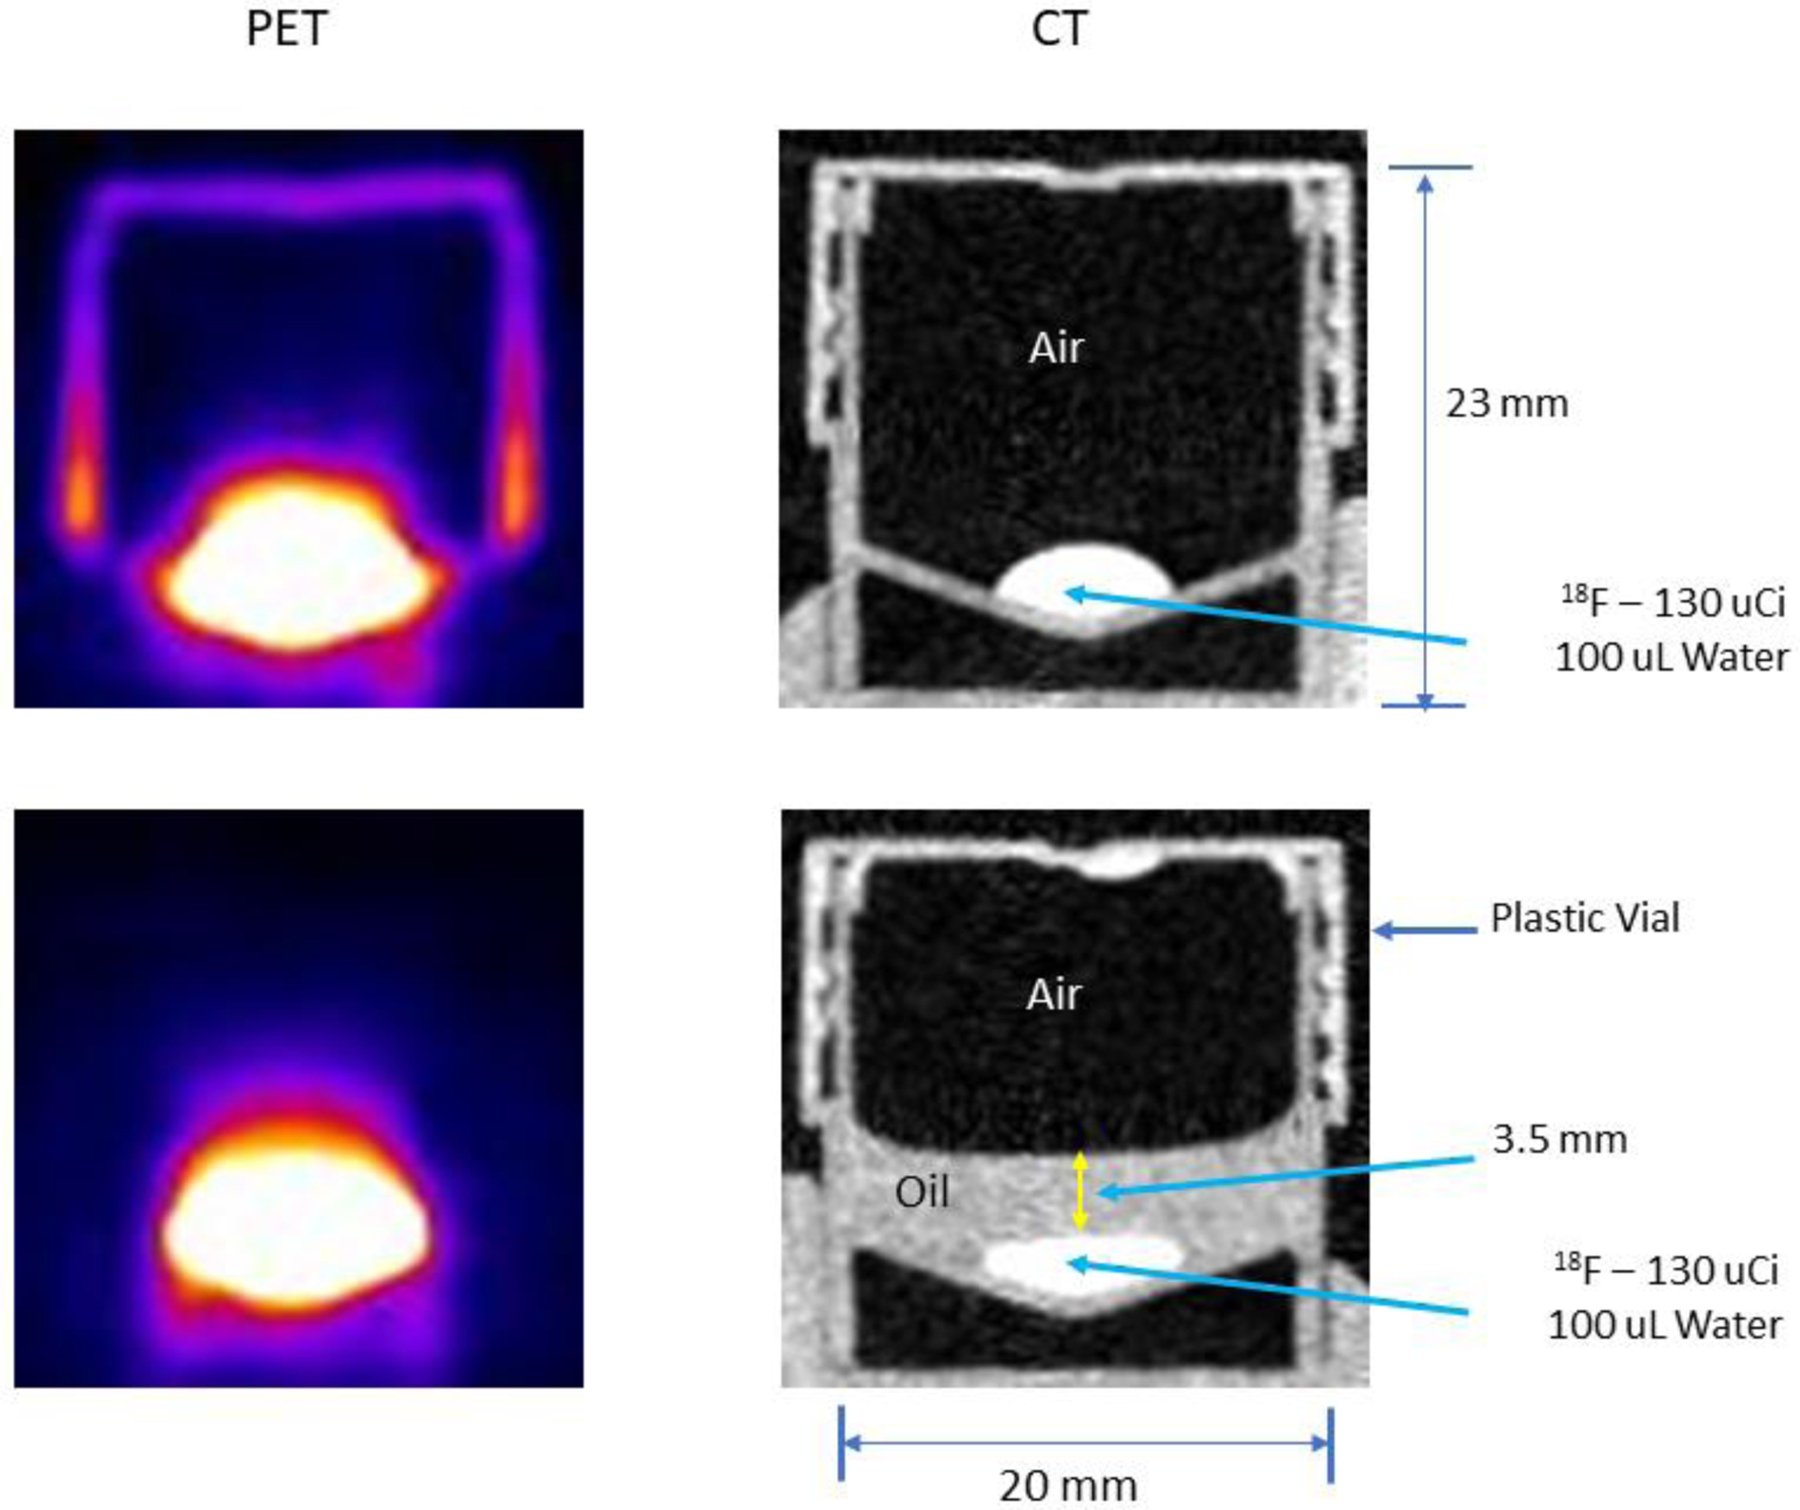
Cross sectional side view PET images (left column) of a capped, plastic container with a droplet of 18F in water at the (slightly conical) bottom and the corresponding CT images of the container (right column). The only difference between the images in the upper and lower rows is that a thin layer of non-radioactive oil has been spread over the droplet in the lower row. Without the oil, the plastic walls and cap of the container absorb positrons emitted from the surface of the droplet that pass through the air and annihilate in the walls and cap producing the PET image at the upper left. When the droplet is covered by oil, the positrons emitted from the droplet surface annihilate within the oil and very few escape to reach the walls and cap thereby rendering these structures invisible in the PET image (lower left).
The consequence of this effect on small animal studies can be significant. If a small animal PET scanner has an intrinsic physical spatial resolution of 0.5 mm (arguably, a value not yet achieved), and one attempts to image 18F would yield an effective resolution, by quadrature, of about 0.7 mm, a nearly 30% reduction therefore, negating a large portion of the technical gain evidenced in the scanner. This effect becomes even more significant with increasing positron energy. Isotopes like 18Rb, though useful for quantifying myocardial perfusion in humans, is impractical in rodent studies because many annihilations will take place outside the heart in animals this size. The effect shown in Figure 4 can occur in both humans and animals in the heterogenous mixture of tissue and air in the lungs so that the spatial distribution of positron annihilation sites becomes dependent on the local (and complex) tissue/air distribution. In either case, if high spatial resolution is to be achieved, corrections must be devised to counter such effects6,7.
Another effect also occurs in the imaging target that compromises resolution. Positron and electron annihilations give rise to 511 gamma ray pairs that do not always travel away from each other along a straight line but rather along paths that differ from linearity by a small variable angular amount8,9. The consequences of this effect (greatly exaggerated) are illustrated in Figure 5A for two PET scanners with different ring diameters. The true line-of-response (LOR) for a perfectly collinear gamma ray pair absorbed in either ring is shown in yellow, whereas the LORs generated by absorptions in the outer and inner rings (LORN) from non-collinear annihilations are shown as dotted red lines. As suggested by Figure 5A, this mis-location of arrival points of the gamma rays, i.e., the spatial resolution loss, is purely geometric and increases with ring diameter. This result, in turn, suggests that resolution degradation from non-collinearity can be minimized by matching the scanner ring diameter to the largest width of the objects being imaged including the animal(s), imaging bed and any ancillary equipment that might occupy the imaging bore. Scattering events (Figure 5B) also degrade resolution10 but their primary effect is to reduce image contrast. If uncorrected, attenuation produces distortions in the reconstructed images by misrepresenting the true spatial distribution of detected events.
Figure 5.
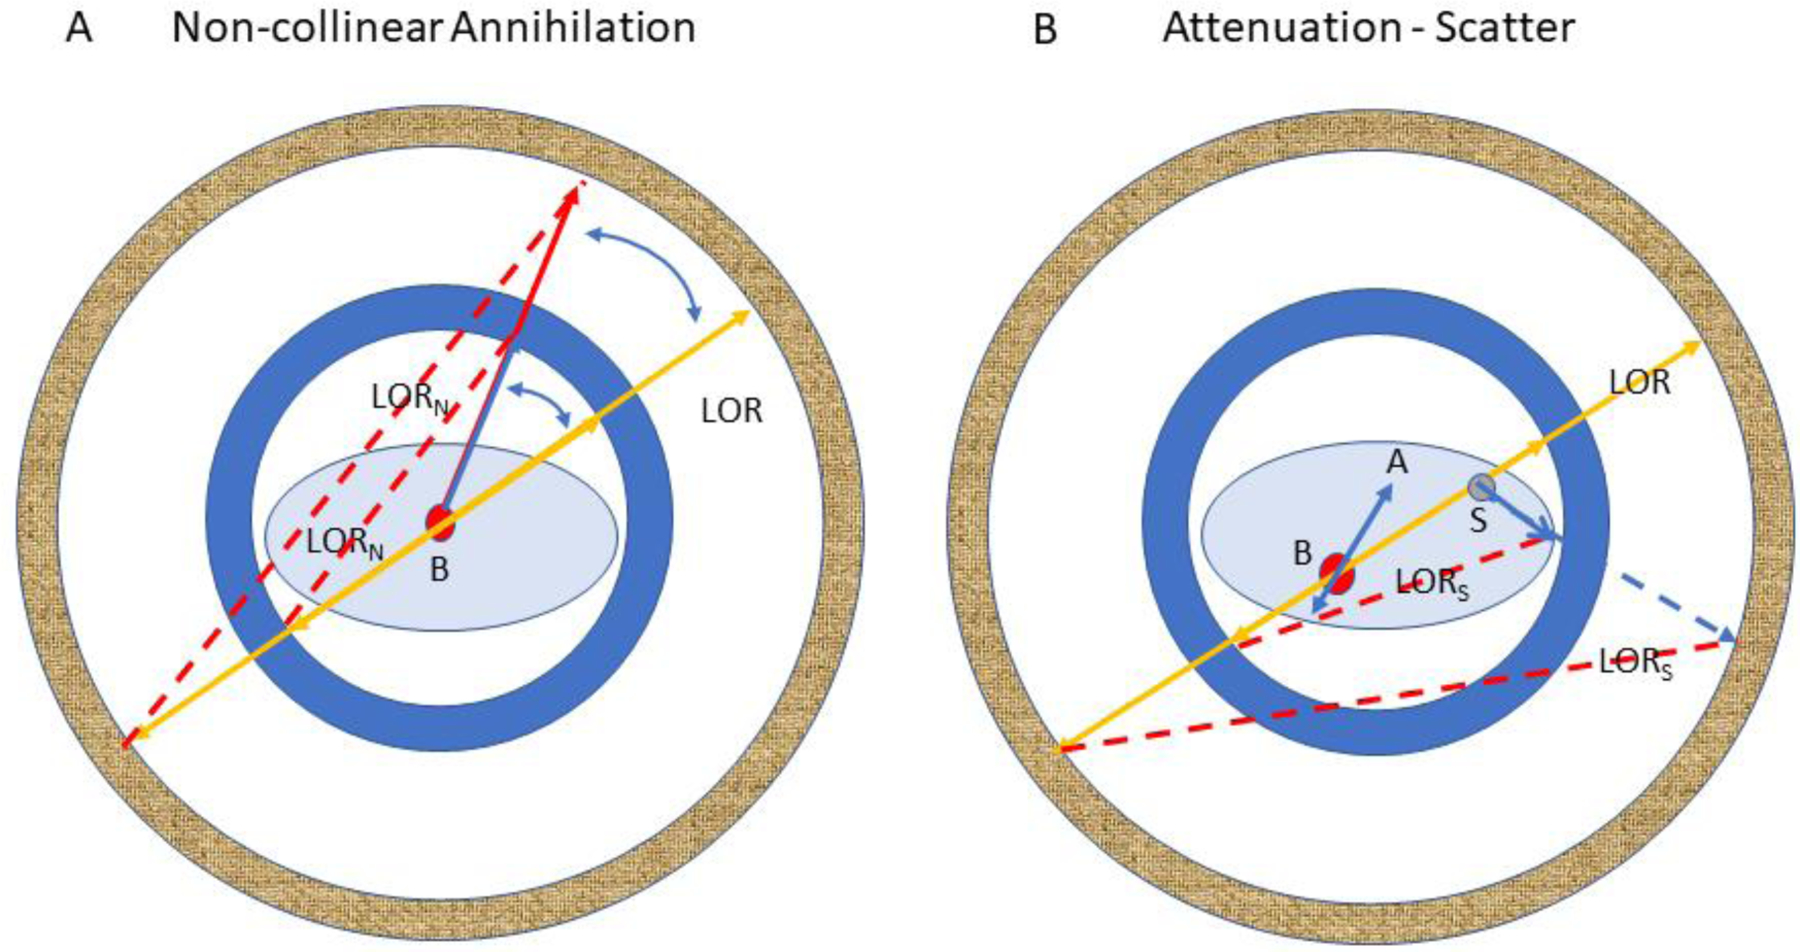
Illustration of the effects of non-colinear annihilation (A) and attenuation/scatter (B) in two PET scanners with different bore diameters. B: annihilation site; LORN: erroneous line-of-response for a non-colinear annihilation; LOR: correct line-of-response for a colinear annihilation; S: location of a 511 keV scattering event; LORS: erroneous line-of-response for a scatter event; A: without correction, spatially varying attenuation of either gamma ray will distort the true activity distribution in the reconstructed image of the object. Because of the very large mass difference, scatter and attenuation are much reduced in rodents compared to adult human subjects but are not ignorable. While attenuation for a single mouse plus bed is generally negligible, multiple mice and rats require attenuation correction. The frequency of scattered events within rodents is much smaller than in adult humans but detection of scattered events is higher in large solid angle machines, e.g., small bore diameter, long axial field-of-view small animal scanners, that also require correction.
Three other resolution degrading effects (Figure 6) are associated with the scanner design itself. Two crystals at opposite ends of a ring diameter are shown in (Figure 6A). An infinite number of straight lines can be drawn between these two crystals that join the points of interaction of each gamma ray of an annihilation ray pair but only one of these lines is the correct one. But while the number of lines is infinite, the vertical range of those lines (U1) is constrained by the width of the crystals, d, so that d/2 is a measure of the uncertainty in selecting one of those lines, i.e., the spatial resolution11. It follows that if “d” is reduced, this uncertainty declines and spatial resolution improves. This result suggests that small animal scanners employ the smallest cross-section crystals possible12, although a number of physical factors impose limits on this reduction.
Figure 6.
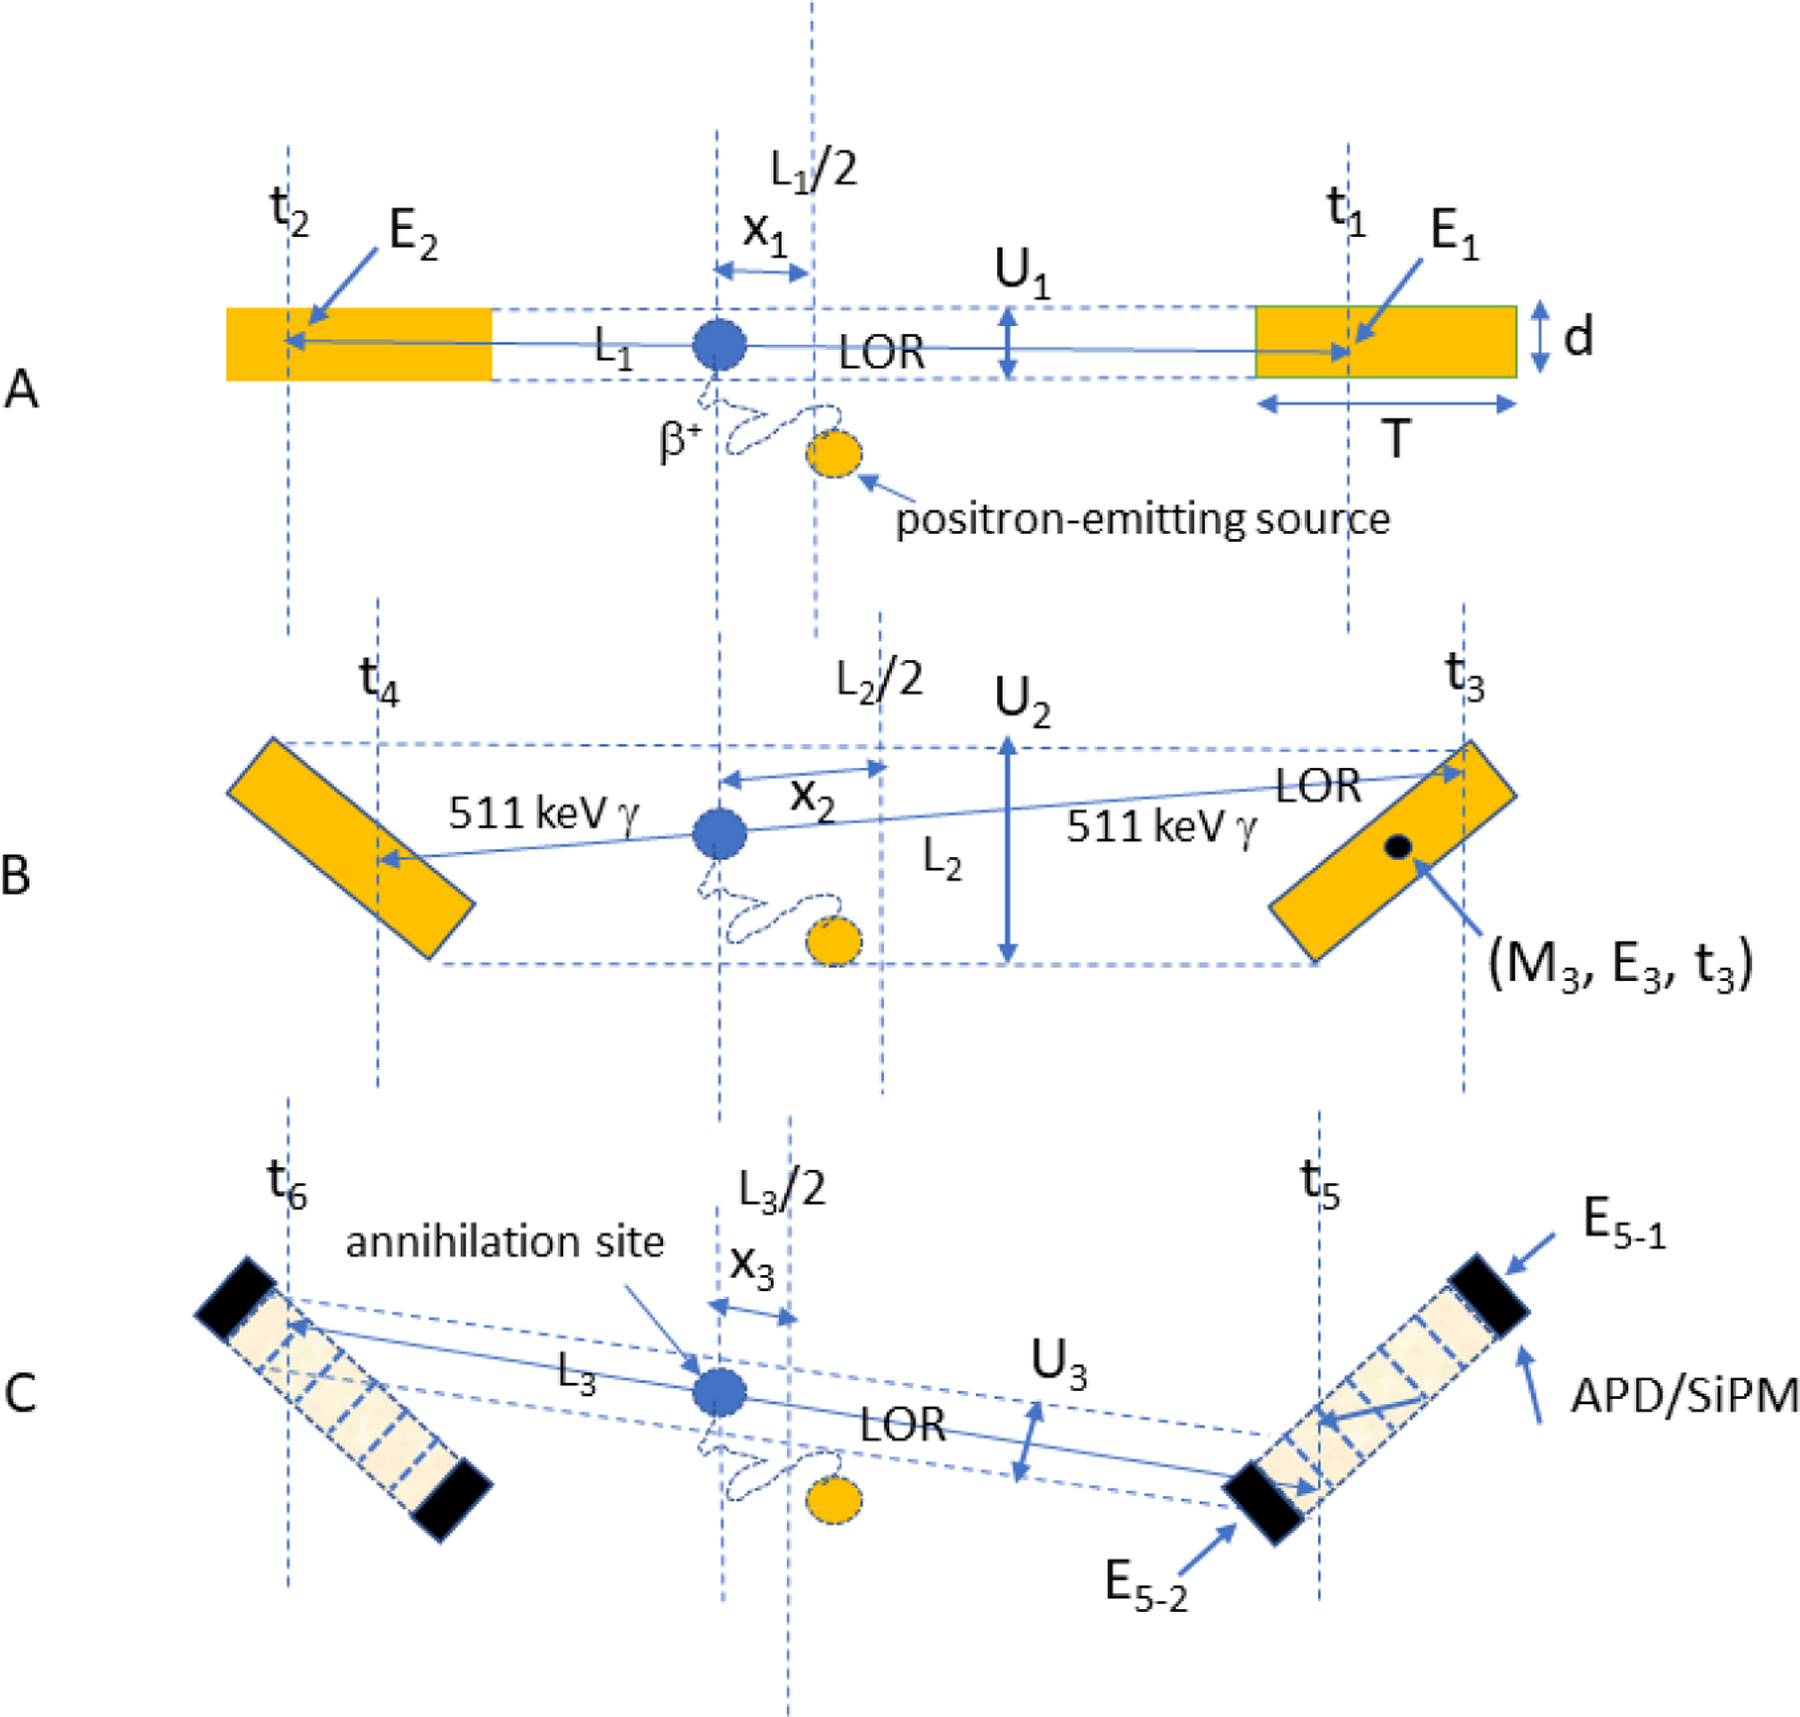
Lines-of-response joining a crystal pair at opposite ends of a ring diameter (A), a crystal pair off the scanner axis (B), and a crystal pair off the scanner axis but with depth-of-interaction readout of scintillation light collected for each event by individual solid state photosensors at each end (C, see text). APD: avalanche photodiode; SiPM: silicon photomultiplier; (C): dotted parallel lines: maximum constraints on LOR choices measured by Ui; Li: length of LOR between interaction sites; xi: distance between annihilation site and LOR midpoint; ti: time of arrival of photon; Ei: energy deposited by photon; Mi: ID number of crystal in detector array.
If the crystal pair is off a scanner diameter (Figure 6B) and therefore angled towards one another, the vertical range of LORs connecting these two crystals (U2) will increase and LOR identification, i.e., spatial resolution, will become increasingly uncertain11. U2 could be reduced by shortening both crystals but doing so would reduce the sensitivity of the scanner significantly since the probability of detecting coincidence events depends on the square of the detection efficiency of each crystal. Since the inclination angle between these crystal increases with increasing distance from the geometric axis of the scanner, spatial resolution in the radial direction will increasingly degrade as the source is moved off axis. This phenomenon is known as the “depth of interaction” (DOI)13 effect since correct LOR identification now depends on where along the length of the crystal the gamma ray interaction takes place. This effect is increasingly pronounced as ring diameter shrinks.
A potential solution to this problem is to measure the location of gamma ray interactions along the length, T, of each crystal (Figure 6C). In the Figure, the set of parallel lines along the length of each crystal is intended to suggest that each crystal has been divided along its length into discrete crystal elements each of which is a fraction of the total crystal length. If so, lines-of-response can be defined that connect LORs between these functional crystal pairs and at least partially restore LOR accuracy (U3). Importantly, this accuracy is maintained without sacrificing crystal length and thus preserves sensitivity. In the case shown in Figure 6C, the location of a scintillation flash along the crystal length is determined by using solid state photosensors (avalanche photodiodes, APD; silicon photomultipliers, SiPM) to measure the amount of scintillation light reaching opposite ends of the crystal for each event. The ratio of the light collected by one detector to the sum of light reaching both detectors is a function of to the event location along the crystal length4. This relationship is true for crystals with unpolished sides so that light loss becomes a function of depth. The primary effect of such DOI corrections is to homogenize radial spatial resolution across the imaging field of view. An additional advantage of this approach is that DOI detectors can increase spatial sampling density throughout the imaging volume by a large factor thereby improving image contrast. A number of different methods have been devised to correct for the DOI effect14–17 but the method described here provides a continuous estimate of depth whereas most other methods provide only a few levels of depth information.
The idealized crystal pair in Figure 6C embodies two ideas, DOI correction and direct, individual readout of each crystal by solid state photosensors and these capabilities are made possible by the properties of these devices. If both are combined in the same system, not only can DOI be corrected, but each crystal can potentially become an independent data channel operating in parallel with all other data channels with no need for “multiplexing” or combining signals during the detector readout process. Multiplexing, while reducing complexity of the readout system, also increases noise and degrades spatial resolution18.
Each of the phenomena described above have long been known as sources of image degradation in PET. It is not unreasonable to ask, therefore, what is the highest possible spatial resolution one might attain with a small animal PET scanner designed to minimize these effects and compare that value to the 0.2 mm ideal noted in Figure 3.
According to Moses11, the “best” physics-limited spatial resolution attainable by a PET scanner of conventional cylindrical design is given by Equation 2 and was derived assuming continuous depth of interaction estimation and individual readout of crystals in the detector array as just described (although these two conditions are not uniformly present in contemporary small animal scanners):
| (2) |
Here, Γ = width of the “best” spatial resolution response function (FWHM), d = the width of each (square) scintillation crystal, s = average positron range and D = the scanner bore diameter (the D term appears because the magnitude of the non-collinear resolution loss depends on ring diameter). “Ideal” resolution from Eqn. 2 is plotted against bore diameter in Figure 7.
Figure 7.
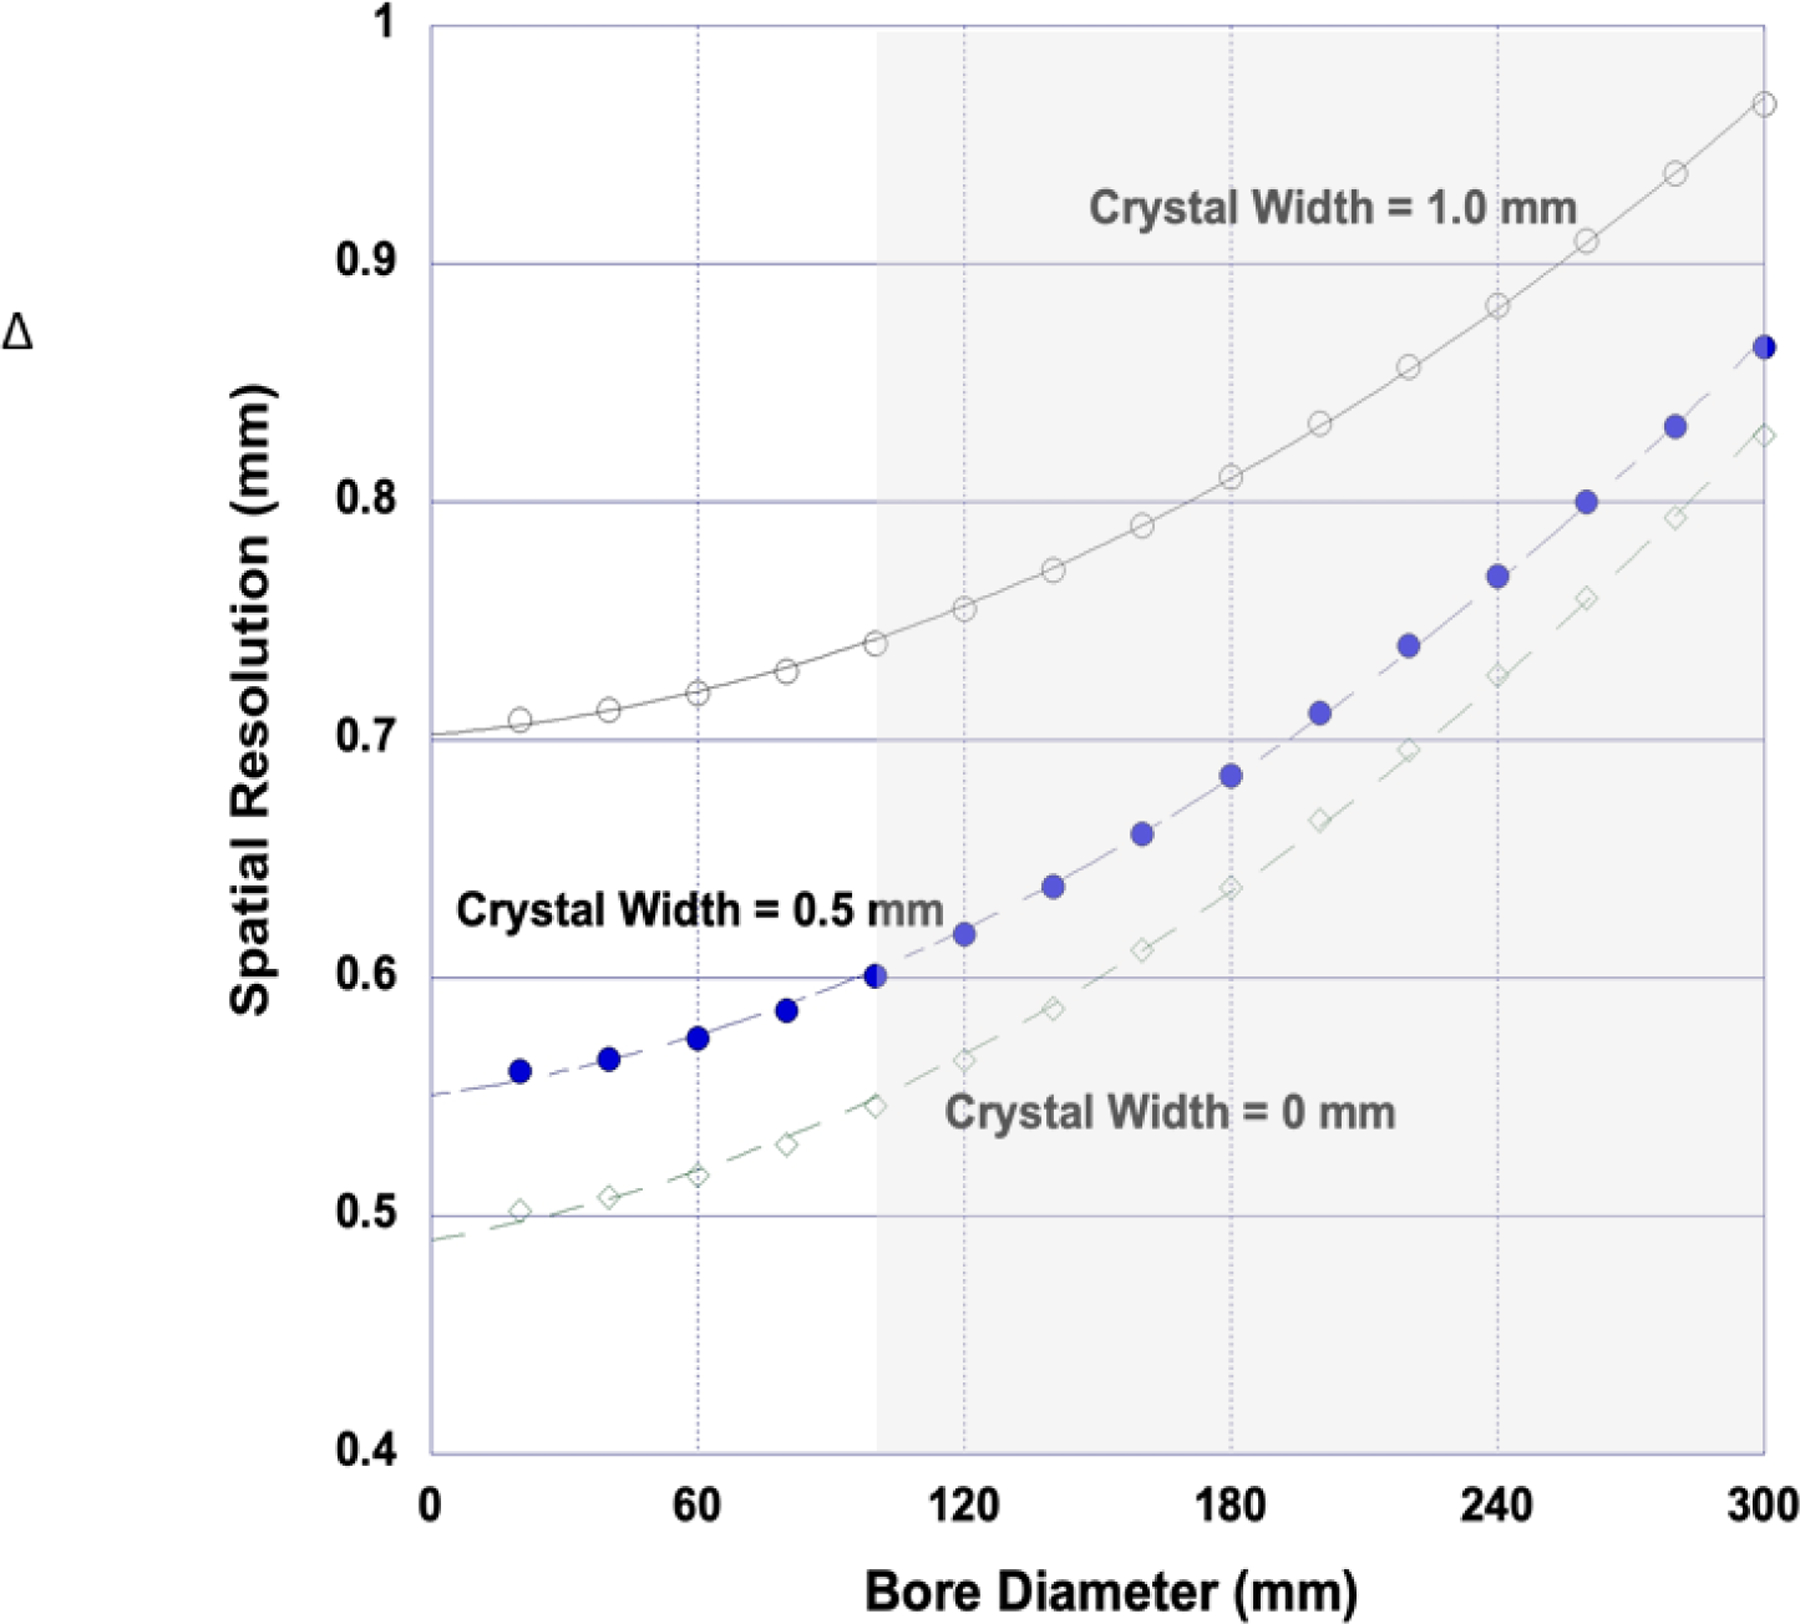
Spatial resolution vs. bore diameter for an “ideal” small animal PET scanner for several different crystal widths imaging 18F. Even a scanner with zero width crystals (and zero sensitivity) cannot physically achieve the 0.2 mm resolution needed to image mice with human equivalent sampling density. It can be argued that, for practical reasons, an ideal rodent scanner should have a ring diameter of about 150 mm yielding an ideal resolution of about 0.65 mm with d = 0.5 mm. Gray region spans the bore range of contemporary small animal PET scanners.
The 0 mm curve in this figure demonstrates the combined effect of positron range and bore diameter only. The other two curves with finite crystal widths (0.5 and 1.0 mm) combined with these effects suggest that reducing crystal width to 0.5 mm in the rodent imaging regime (D = 60–180 mm) would be a plausible strategy to improve spatial resolution. Several studies have explored reduced crystal sizes experimentally and by simulation that support this conclusion12.
Taken together, the observations suggest that the physical properties of an “ideal” small animal scanner should include detector modules with very small crystal widths, deep crystals to increase sensitivity, continuous DOI measurements, a bore diameter tailored to the size of the imaging subject(s) and any ancillary equipment located in the bore, and where each individual crystal defines an independent data channel.
But even if all these choices are implemented, this “ideal” 0.65 mm small animal scanner will still not meet the human sampling condition of 0.2 mm. In addition, it is also assumed that when imaging an actual subject, the “ideal” machine will be capable of the full range of corrections needed to compensate for all other phenomena that degrade PET images such as scatter and attenuation and many unremarked machine effects, e.g., random coincidences, dead time, detector gain variations, etc. If the goal is to produce PET images in the subject (vs. a phantom) with an effective resolution of 0.65 mm, then the cumulative effect of the physical scanner design and these corrections must achieve that result.
Other effects also require correction. If a point object imaged with PET is stationary with respect to the scanner, spatial resolution (RS) can be expressed as a quadrature combination of the perturbing physical effects and scanner resolution as indicated in Eqn. 2. If the point object being imaged is moving relative to the scanner, then the effective spatial resolution (RE) of the study becomes:
| (3) |
where RM is the FWHM of the point displacement histogram (assumed to be Gaussian-like). Effective spatial resolution is plotted against scanner resolution in Figure 8 for two different scanner resolutions. Inspection of this figure indicates that when the movement FWHM exceeds about twice the scanner resolution, the effective resolution of the study is set by movement and not by the scanner. When intrinsic spatial resolution is very high, as it must ultimately be for imaging mice, small and realizable object movements of the order of a millimeter or so can completely defeat the technological gains that made those high intrinsic resolutions possible. Indeed, it might be argued from this simplistic example that the “best” spatial resolution for a small animal scanner may not be set by the physics of the imaging process but rather by the accuracy of methods that correct for object motion19–21. Human and small animal organs in the torso both undergo substantial periodic displacements due to lung22 and cardiac23 movement and if the imaging target is located near, or in, these objects, movement effects are enhanced. Whole body movement can also sometimes occur in small animals under anesthesia.
Figure 8.
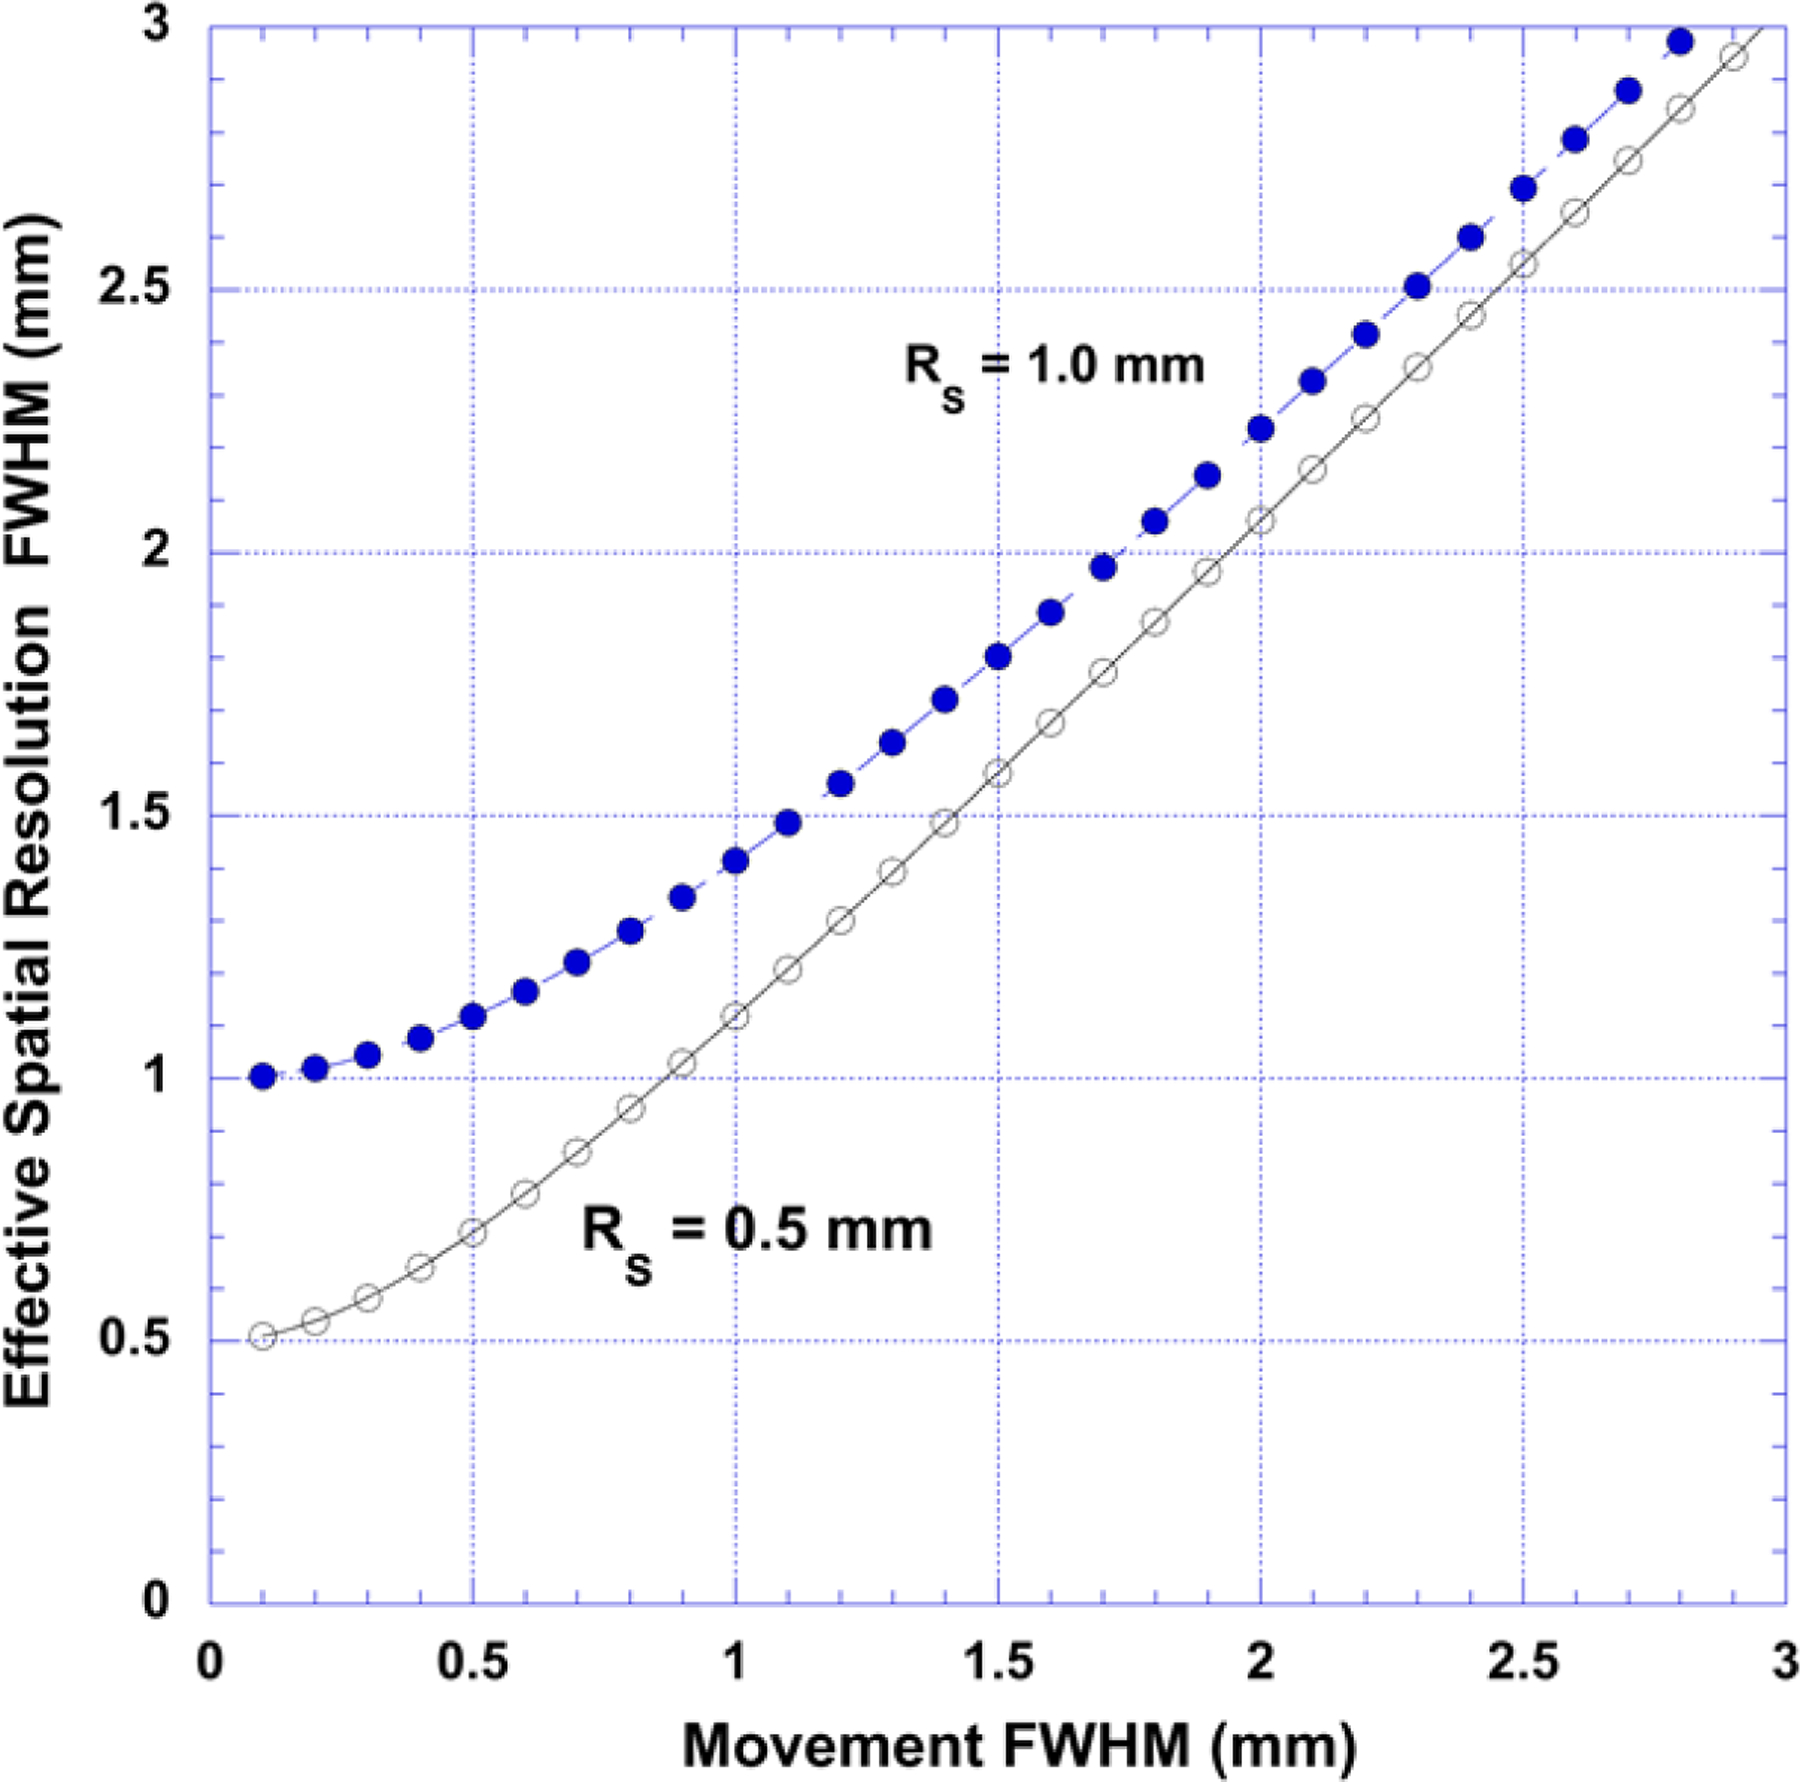
Effective spatial resolution (RE) when the object being imaged is moving relative to the scanner for two different scanner resolutions (assuming a Gaussian-like displacement histogram). When the movement histogram width (FWHM) exceeds about twice the scanner resolution, effective image resolution is set by motion and not by the scanner.
This introduction was intended to lay out some of the major factors that ultimately influence the ability of PET to accurately measure the radioactivity content of organs or small portions of organs in rodent-sized animals. The use of the mouse as a “standard” against which to judge progress in this area seems justified since mice are the most commonly used research animal in contemporary biomedical research and the size of the mouse presents a formidable challenge to PET instrument designers and the larger scientific community that supports these developments. The sections below attempt to highlight some of the advances across this development spectrum that address these issues.
PET Scanner Geometry
Total Body PET Scanners
Human and animal PET scanners are most often comprised of a circular or polygonal array of PET detector modules surrounding a (typically) cylindrical subject along a portion of their body length. The minimum diameter of this cylinder is dictated by the largest width needed to accommodate the imaging subject(s) (Figure 9A) and any attendant equipment such as the bed, anesthesia equipment including nose cones and lines for pre-clinical imaging, motion monitoring equipment, cardiac gating leads etc. needed in the bore during imaging. It is not uncommon in small animal PET research studies to scan several animals at the same time to increase “throughput”24, particularly in longitudinal studies of large cohorts of animals, but the larger scanner bore reduces both spatial resolution and sensitivity and increases attenuation and scatter effects.
Figure 9.
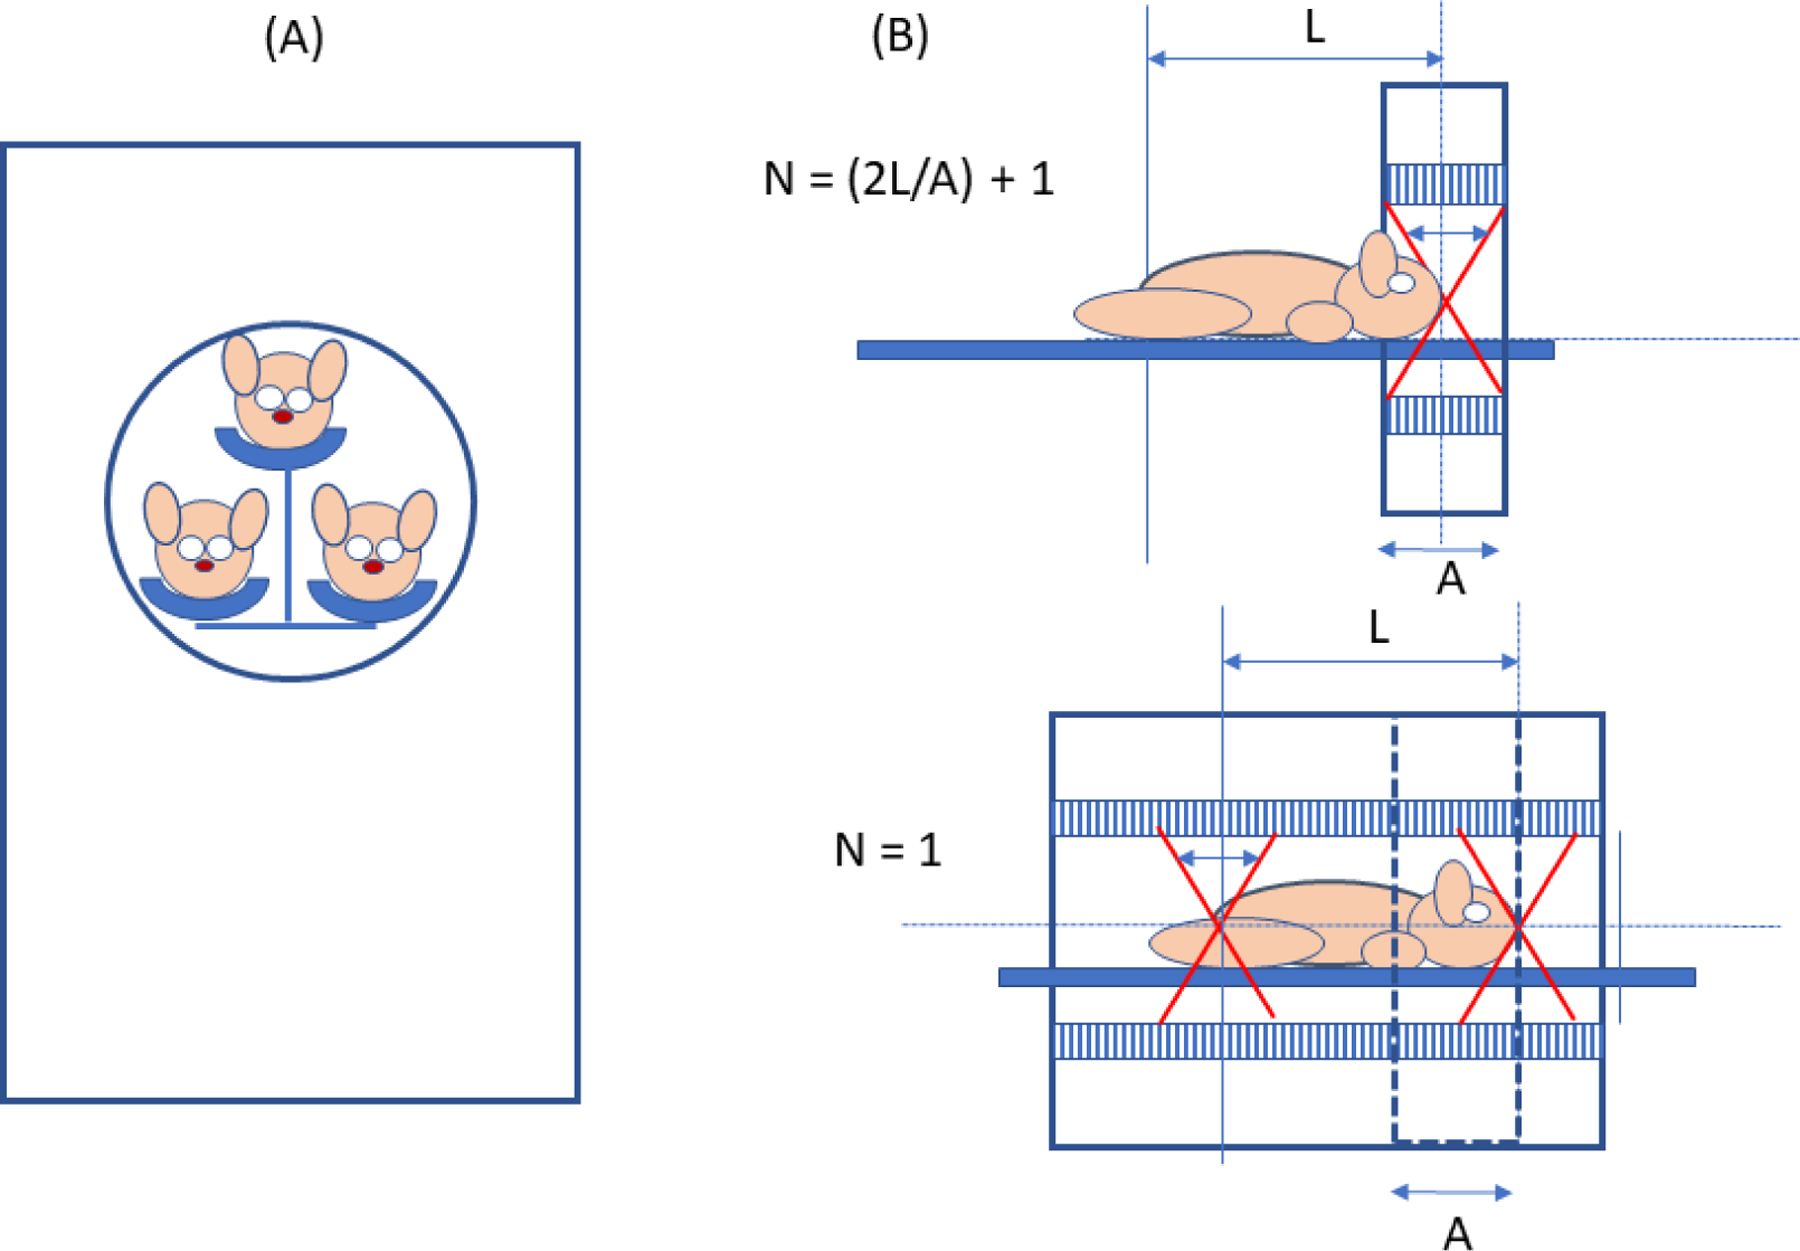
A: Example of multi-mouse PET imaging. B: Upper panel: “step and shoot” small animal PET scanner; lower panel: total-body small animal PET scanner. A = length of axial field of view of step and shoot (SAS) machine, N = number of bed positions needed to image the length L when the coincidence acceptance angle (small arrow in scanner bore) and injected activity are the same for both machines. If L= 3A, for example, N = 7 for the SAS machine and the total body machine will acquire 7 times more events from every voxel in the object compared to the SAS machine for equal total imaging times.
The length of the cylinder, however, is a “free” variable in the sense that it can be longer or shorter than the imaging subject. Early human and animal PET scanners had axial lengths only a fraction of the total length of the imaging subject. More recently, however, manufacturers have offered small animal machines with axial lengths that can span the entire body length of typical rodent-sized animals2,25–28. Indeed, a total body scanner has recently been developed that is capable of imaging an entire adult human in one bed position29.
The primary advantage of total body PET scanners, compared to “step and shoot” machines with equal bore diameter but shorter axial fields-of-view, is greater sensitivity. A total body scanner can acquire 3D coincidence data from a larger solid angle for every point in its FOV than a small axial FOV machine imaging the same object. When the target object is the whole body (Figure 9B), the sensitivity gain is even greater since every point in the object is seen simultaneously by the total body machine but only for a fraction of the total imaging time by the step and shoot machine. In both cases, the total number of events acquired for equal imaging times by the total body scanner will be greater than for the step and shoot machine and the signal to noise ratio for the former will exceed, often by a significant margin, the latter.
Practical reasons also exist for total body small animal scanners. It is not uncommon that rodent studies require total body images for experimental purposes and a total body scanner directly fills that need while also providing images of higher quality. Higher sensitivity might allow the user to shorten imaging time thereby increasing the number of animals that could be studied each day, yet still obtain images of better statistical quality. Similarly, the administered dose could be reduced, while preserving statistical quality. Keeping the time and dose the same, the whole-body machine should be able to detect smaller lesions throughout the FOV by virtue of improved statistical quality. In addition, since a total-body scanner sees all body organs at once, it is possible to generate the time-dependent organ arterial tracer input function required by pharmacokinetic models by measuring instantaneous blood activity in the heart30. This capability could eliminate the technically challenging step in small animals of continuous arterial blood sampling to obtain the same result. Seeing all major body organs at once also allows time-coherent time-activity curves for each organ to be generated that, in turn, allow determination of organ absorbed radiations doses needed in the drug approval process. Total body machines are also perfectly suited to image phenomena that occur throughout the body such as the spread of small metastatic lesions in cancer patients and in animal models31,32 of this condition.
The sensitivity gain associated with total body scanners may have a greater significance than might be imagined. Contemporary small animal PET scanners are approaching the physical performance limits suggested by Moses and some come near to reaching their “ideal” spatial resolution but only by resorting to advanced reconstruction methods. But if spatial resolution still falls short of the human sampling density “standard”, how might further progress toward that goal be made? It can be argued that progress can only be made by employing the most advanced system response models and correction methods possible, all of which are computationally intense and ultimately “noise” limited. Total body scanners may reduce that noise and bring small animal PET closer to the human goal.
As valuable as total body PET scanners may be, these geometric changes do not come without penalty. Total body machines detect disproportionately larger amounts of scattered radiation by virtue of their larger solid angle and accurate corrections for this effect become increasingly important. Lu-176, a radio-isotopic contaminant present in the scintillation crystals of Lu-based PET scanners generates a very high background count rate in the detector array that increases as the volume of Lu in the scanner increases. This condition requires detector electronics that suppress or eliminate these events. Finally, because of the larger numbers of detectors, total body PET scanners are considerably more expensive.
PET Detector Modules
Clinical and preclinical PET have predominantly used radiation detectors consisting of arrays of scintillation crystals coupled to photomultiplier tubes (PMTs)33. 511 keV gamma rays originating from the annihilation of a positron and an electron undergo interactions in the scintillation crystals that create flashes of scintillation light. The purpose of the photomultiplier is to convert that light into electrons and amplify their number to create a current signal of sufficient magnitude for subsequent pulse processing to determine energy, position, and arrival time of the absorbed photons. Although PMTs provide high amplification (typ. 106) and signal-to-noise ratio (SNR), they possess disadvantages such as sensitivity to magnetic fields, fragility, bulky housing, non-uniform gain, poor form factor due to inactive areas near the edges, a modest quantum efficiency (QE) of 15 – 25%, and the need for high operating voltages (~1000 V)34.
More recent alternatives, i.e., solid state photodiode sensors, are insensitive to magnetic fields, can be made very small in area and are only a few millimeters thick. Quantum efficiency of such devices is in the range of 50 – 60% and they operate in proportional mode at low voltages (e.g., 20V to 40V). Avalanche photodiodes (APDs) can reach gains up to 102 under these conditions but require external high-gain, low-noise amplification circuits for signal readout. The small size of APDs allows one-to-one coupling to individual detector crystals, something not possible with PMTs when crystal size is small. Notable applications of APD technology that exploit these features include the LabPETII35 (Figure 10), RatCAP36 and MADPET37 scanners. Among the drawbacks of APDs detectors is their low internal gain, increased sensitivity to voltage and temperature fluctuations and poorer timing properties compared to PMTs38.
Figure 10.:
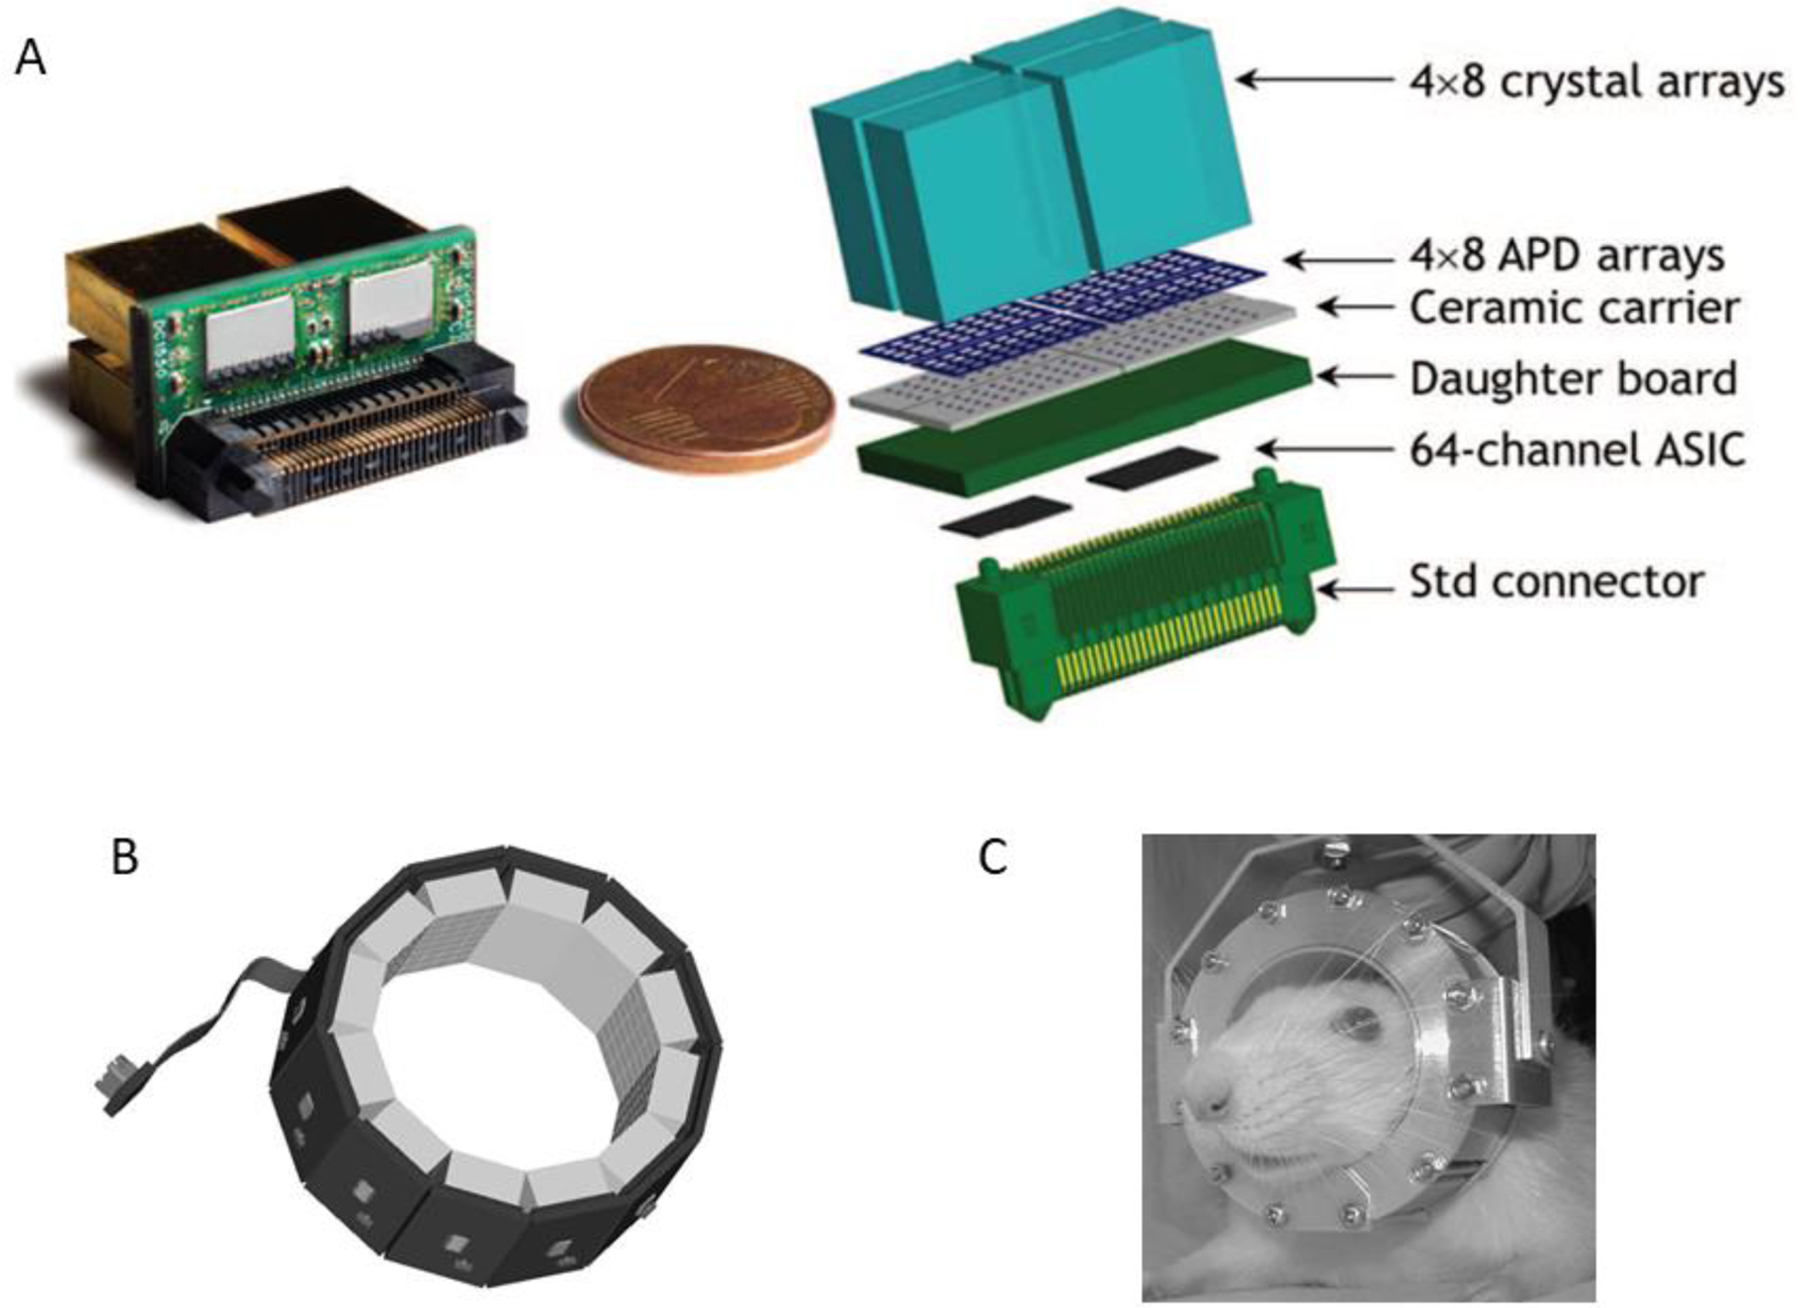
A: A Lab PETII detector module showing one-to-one coupling between crystals and individual APDs and between APD arrays and ASIC processors. This arrangement allows independent readout and processing of signals from 128 crystals in each of the 12 detector modules. B: RatCAP APD/ASIC-based PET detector ring. C: wearable rat brain PET scanner.
Fig A: Adapted with permission from “Firmware architecture of the data acquisition system for the LabPET II mouse scanner.”, Njejimana, L, et al., 2016 IEEE Nuclear Science Symposium, Medical Imaging Conference and Room-Temperature Semiconductor Detector Workshop (NSS/MIC/RTSD). IEEE, 2016.
Fig B and C: Adapted with permission from “RatCAP: miniaturized head-mounted PET for conscious rodent brain imaging.”, Vaska, P., et al. , IEEE Transactions on Nuclear Science 51.5 (2004): 2718–2722.
Silicon photomultipliers (SiPMs) do not share these negative features39. An SiPM consists of (very many) single-photon avalanche diodes (SPADs or microcells) operating in Geiger mode at a few volts above their break-down voltage (around 35 – 70 V). When hit by an optical photon, a self-sustained current avalanche is triggered in a SPAD that must be quenched via resistor so that the SPAD can fire again. When a scintillation flash illuminates many SPADs, the total signal from all SPADs (the SIPM output) is proportional to the number of SPADs hit and a function of energy deposited in the scintillation crystal by that event.
The response of SiPMs to incident optical photons is very fast and superior to PMTs. In a detailed investigation of several commercial SiPMs40, single-photon time resolution (SPTR) ranged from 70 ps to 135 ps which outperforms the 270 ps to 400 ps transit time spread (TTS) of very fast PMTs41. Recent clinical time-of-flight (TOF) scanners42–45 already employ SiPM sensors rather than PMTs for this reason.
SiPMs are currently manufactured in sizes ranging from 1×1 mm2 to 6×6 mm2 and can be mounted on PCB boards as 4×4, 8×8 or 12×12 arrays sold by Onsemi, Phoenix Arizona, Hamamatsu, Hamamastsu City Japan, and BROADCOM, San Jose California. Examples are shown in Figure 11. Such arrays possess high fill factors and minimal dead space at the edges. Multiple boards can be tiled together to create larger sensor arrays without introducing large gaps in the active area. In addition, signal gain across SiPM arrays is typically very uniform, unlike position-sensitive or multi-anode PMTs.
Figure 11.
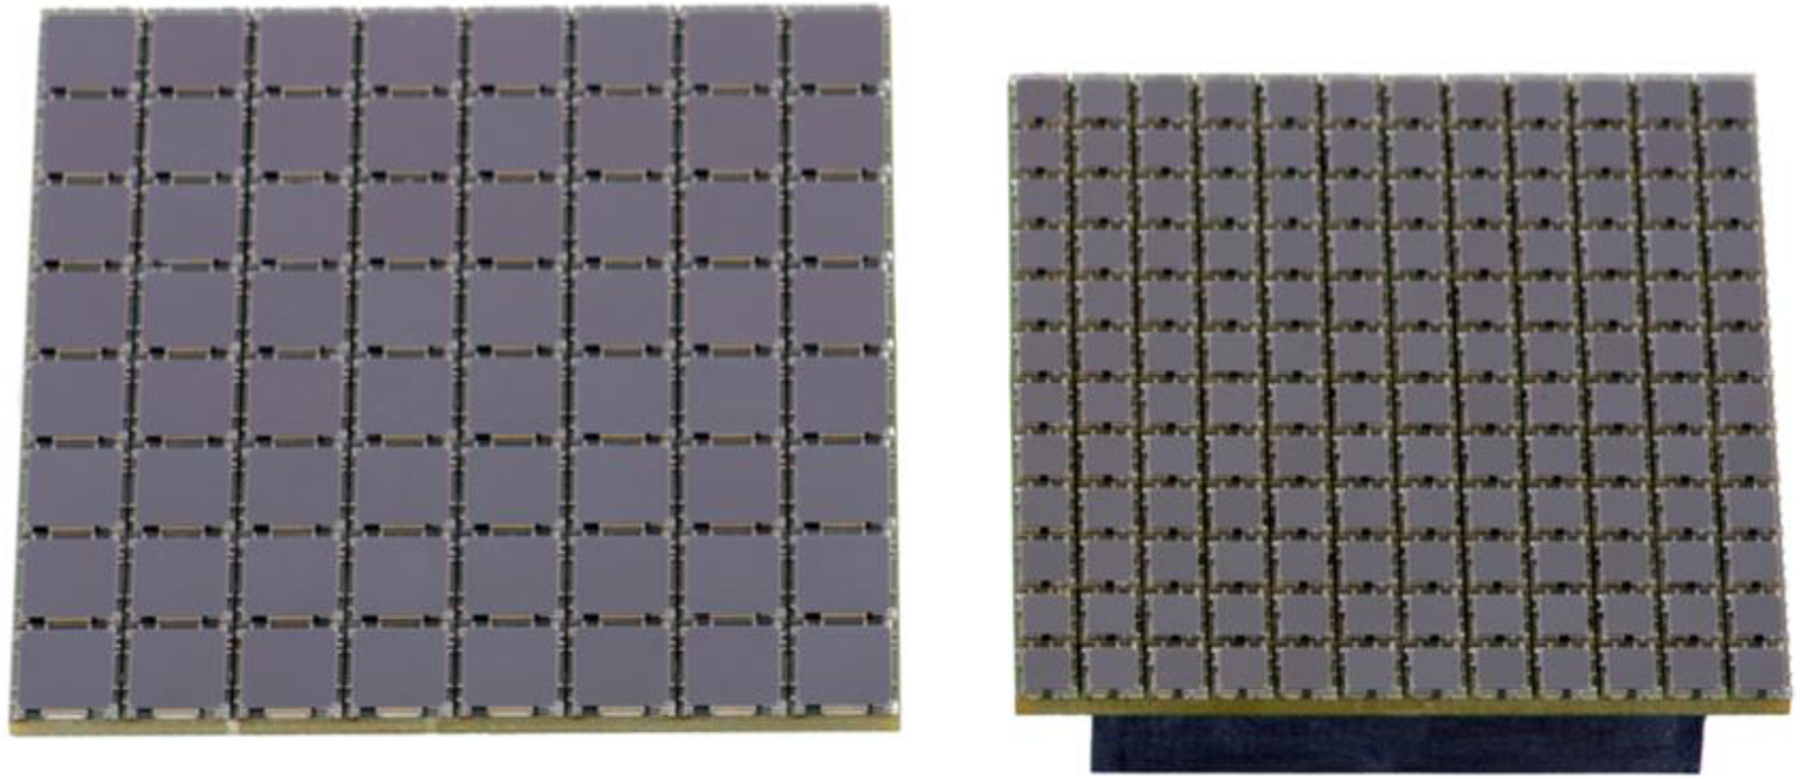
8×8 array of 6 mm2 SiPMs (left) and 12×12 array of 3 mm2 SiPMs (right). (ONsemi, Phoenix AZ).
SiPMs come in two forms, analog and digital. The most common form is the analog SIPM (Figure 12) where all SPADs are operated in parallel and their signals are summed to form a single analog output signal that is proportional to the number of microcells in which a photon was detected. The output signal is connected to an ASIC to digitize energy, location and the time of the event. In a digital SIPM, the SPADs are integrated with conventional CMOS circuits onto the same substrate and each SPAD is read out by its own circuit (Figure 12).
Figure 12.

Readout schematics for analog and digital SiPMs. Signal processing in the analog version is pictured as being accomplished by a separate applications specific integrated circuit (ASIC) while signal processing in the digital version is accomplished by reading out each individual SPADs with components physically integrated into the SiPM. ADC: analog to digital converter; TDC: time to digital converter; ID: digital location or SiPM identifier.
A now common feature of digital detector modules based on these devices is the time-over-threshold (TOT) method of measuring the energy deposited in a scintillation crystal (Figure 13)46. Rather than integrating the accumulating charge generated by a light flash with an ADC, TOTs make the measurement in the time domain and directly output a digital signal proportional to the incoming signal amplitude (energy).
Figure 13.
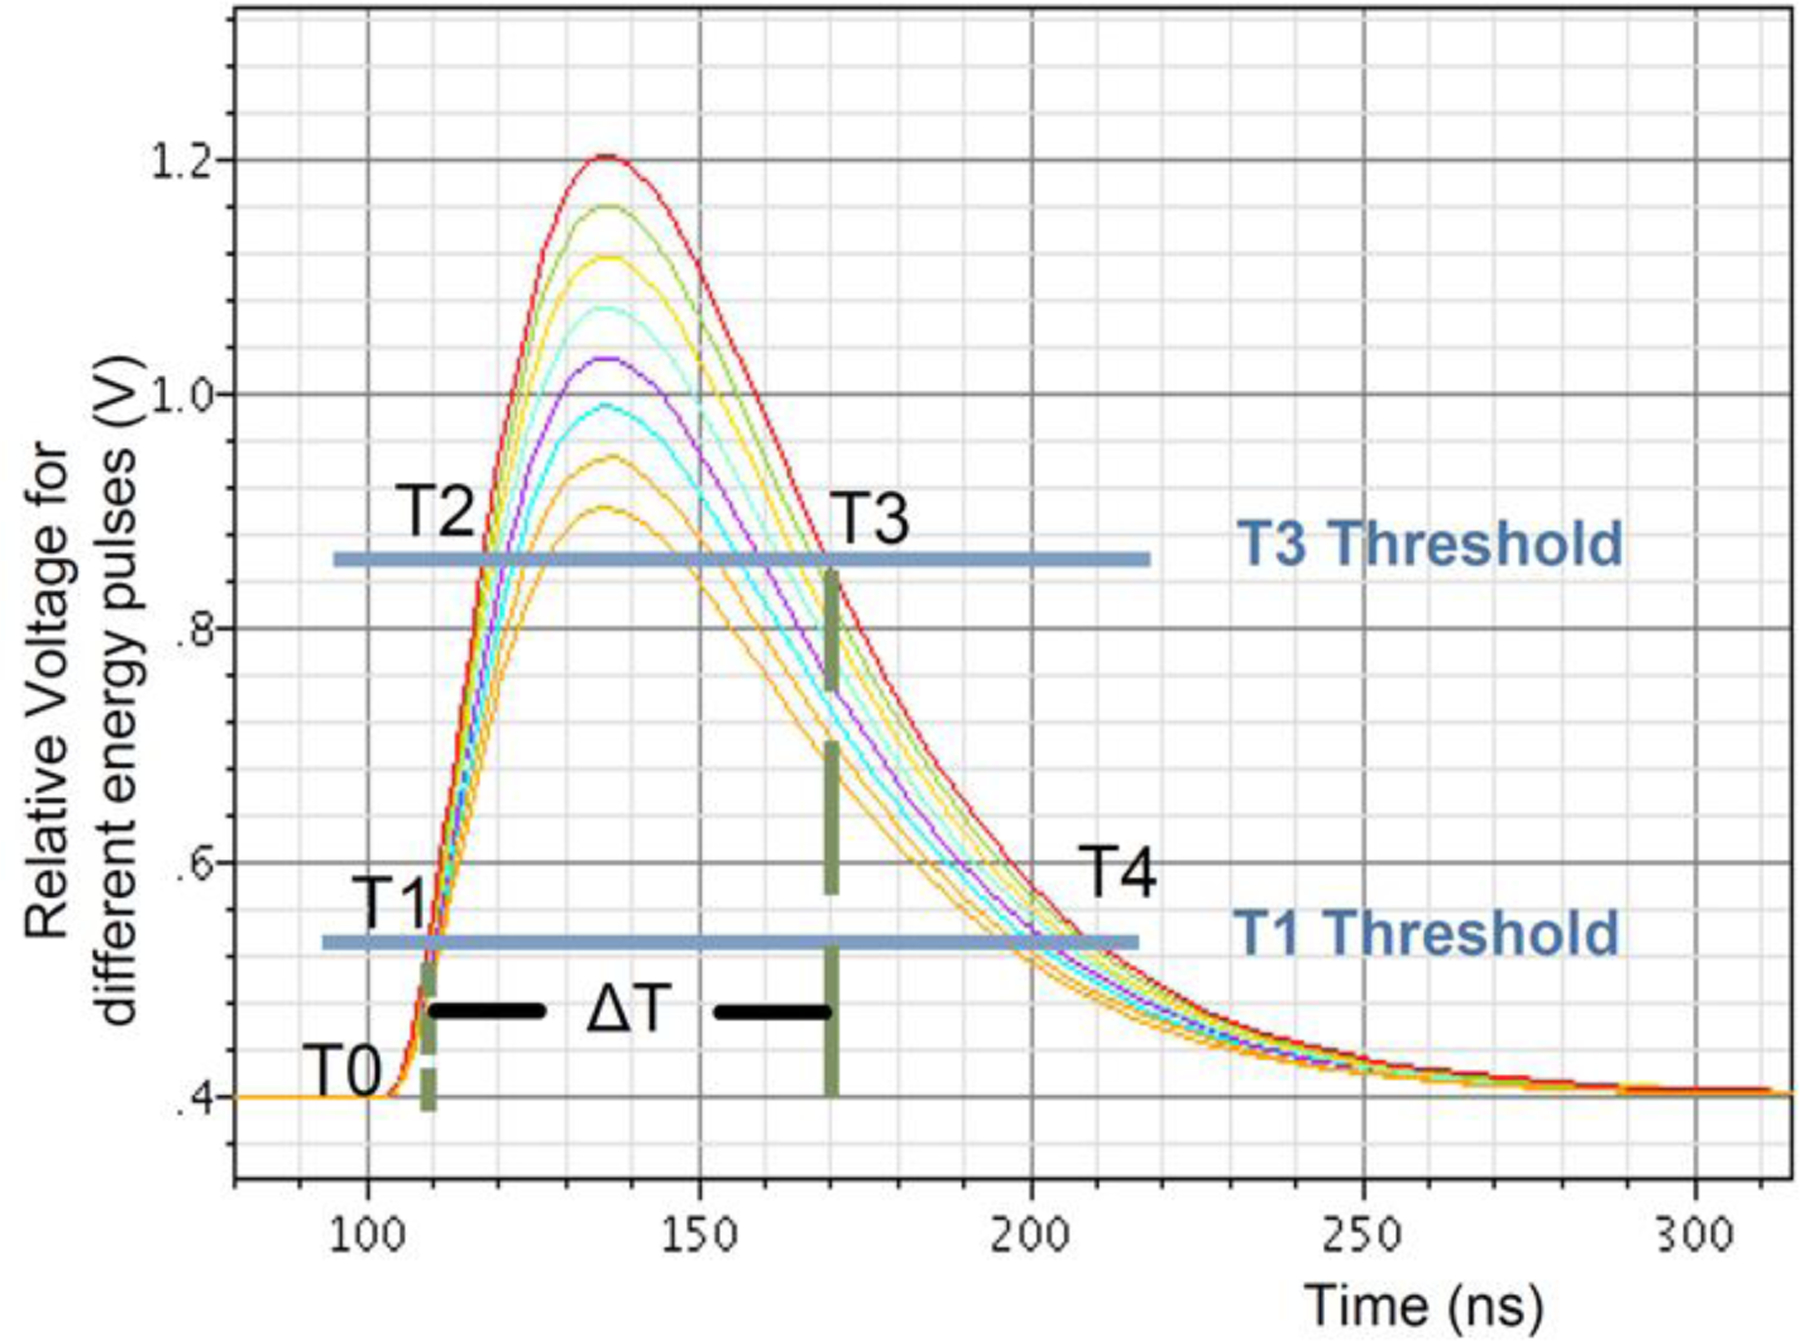
Time-over-threshold energy estimation. Simulated pulse shapes of various amplitudes crossing the low (T1) and high (T3) thresholds. The measured time difference between T3 and T1 is an effective estimate of the pulse area (energy). Crossing the T2 threshold insures a valid pulse. Figure from LabPETII (2012 Design of a real-time FPGA-based DAQ architecture for the LabPET II). Adapted with permission from “Design of a real-time FPGA-based DAQ architecture for the LabPET II, an APD-based scanner dedicated to small animal PET imaging.”, Njejimana, Larissa, et al., 2012 18th IEEE-NPSS Real Time Conference. IEEE, 2012.
As suggested in Figures 10 and 11, contemporary APD and SIPM-based detector modules are physically compact, allowing creation of high density, low volume PET detector arrays surrounding an imaging subject that, at the same time, carry out substantial signal processing within the module itself. This capability has been largely realized by incorporating field programmable gate arrays (FPGAs) and/or application specific integrated circuits (ASICs) directly into detector module designs (Figure 12)46–48. These compact, high-performance devices make possible the efficient processing of parallel digital inputs at scales commensurate with high packing density scintillation detector modules and outputting these packets to downstream processors. Importantly, the insensitivity of these devices to magnetic fields, combined with these properties, has created an entirely new imaging regime that allows simultaneous PET and magnetic resonance (MR) imaging of both human and small animal subjects.
PET Data Acquisition
The data acquired and processed by a detector module (an “event”) has generally been the time of occurrence of a flash in a scintillation crystal in the module, the signal amplitude (energy) of that flash and an identifier that locates the module within the detector array where the flash took place. The position of the flash within the detector module has most often been determined by some form of signal multiplexing, e.g., Anger positioning by resistive charge division, a process that itself adds noise to spatial position measurements and reduces resolution11. In an “ideal” small animal PET scanner, this noise source would be eliminated, and individual crystals would be read out and their signals processed independently (Figures 11, 12). In addition to noise suppression, independent readout of each crystal would significantly improve the count rate capability of a module since the event rates in individual crystals in PET scanners is low despite very high rates for the entire detector array. In such a module the “quantum” of information for each event might be encoded as (Mi, E1, E2 ti) where Mi is the crystal ID number (in contrast to module number), E1 and E2 are the signals acquired by the photosensors at each end of the crystal and ti is the time of occurrence of the event (Figure 6C). These data from all modules would then be organized into data packets and forwarded for coincidence processing (Figure 14). Here, if t2 was the measured time of an event in another crystal, and t1 – t2 < Δt, where Δt was the width of the coincidence time window, the event pair would be declared in coincidence thereby forming a line-of-response (LOR) across the imaging volume and passed on for further processing. At some point in this process, the depth of interaction in each crystal of the coincident pair would also be calculated, e.g., ΔT = (E2/(E1 + E2)) T where T is the length of the crystal. The end point of the line of response (LOR) in that crystal in “real space” would be R + ΔT, θi, Hi where R is the bore radius, θ is the angular position around the detector array and H is the crystal location along the scanner axis. These paired coincident events would then be forwarded for further processing and image reconstruction.
Figure 14.
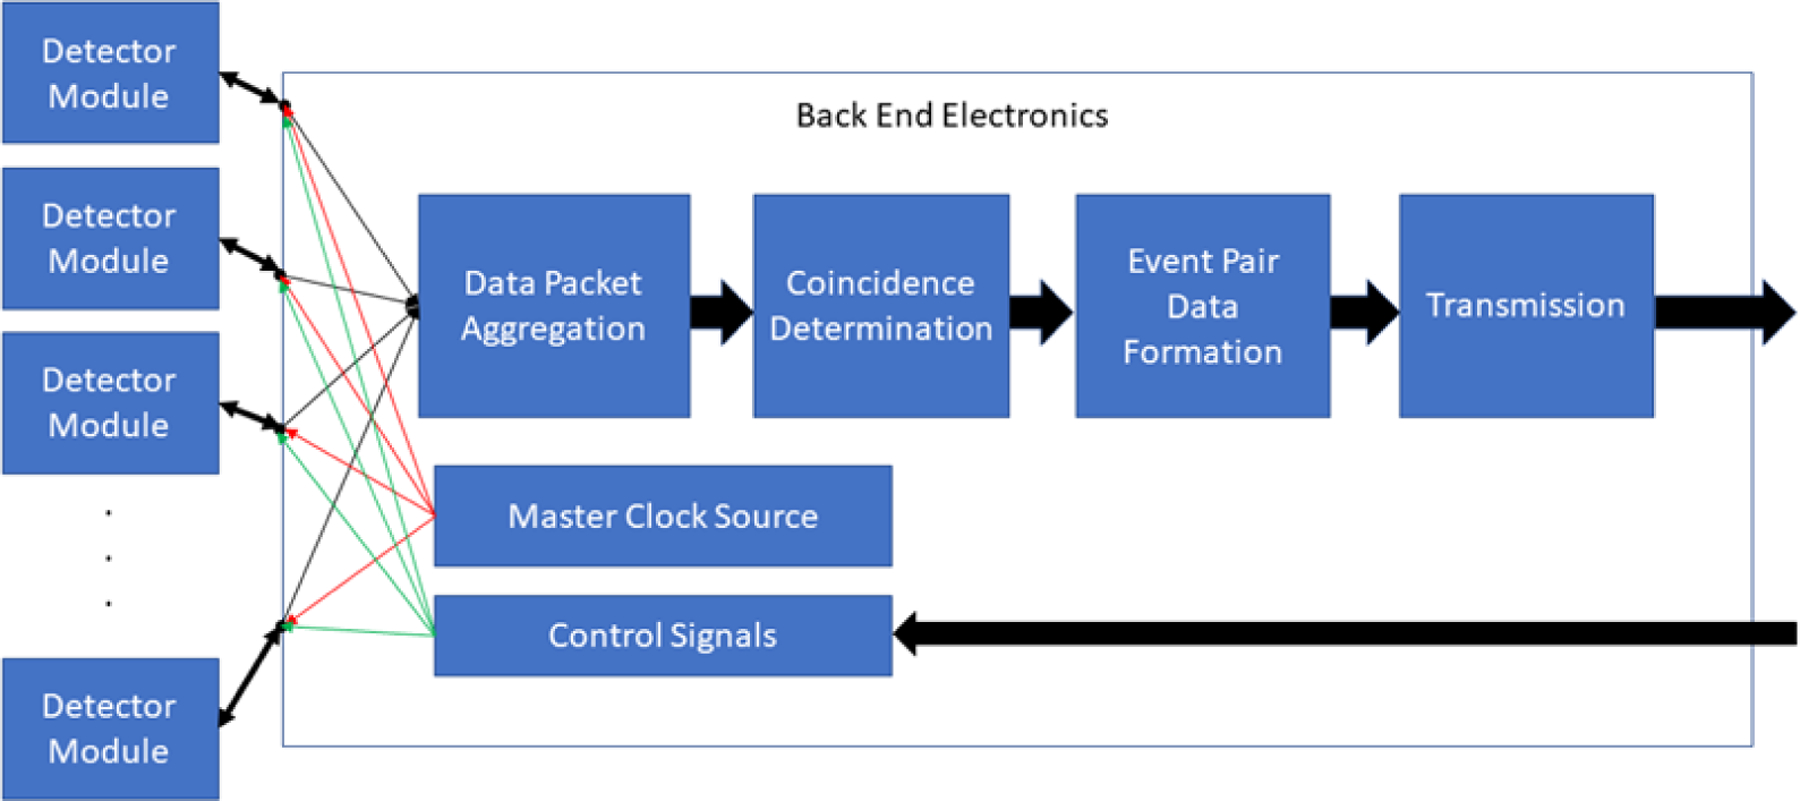
Schematic illustration of data processing elements downstream from the detector module array. Time markers from the master clock ensure that events occurring in the detector array are stamped with a common reference time that allows subsequent determination of coincidence events between scintillation crystals anywhere in the array.
PET Image Reconstruction
If the physical limits of small animal PET scanners are within view, the only path available to bring small animal imaging closer to the human sampling goal must be through increasingly refined corrections introduced during image formation. Interestingly, there are three conceptually different ways such “corrective” transformations can be implemented: (1) by continuing to refine current 3D reconstruction methods based on the known physical principles that govern each source of error6,19,49, (2) train artificial intelligence algorithms to transform LOR data sets or PET (or other) images directly into the “correct” version without specific knowledge of these physical effects50–52 or, (3) combine these two approaches to exploit the advantages of both53–55.
3D Statistical Image Reconstruction
Image reconstruction in its purest form is a transformation from activity in the “image space”, I, to events in “projection space”, P, where the scanner, M, carries out this transformation56. The scanner imaging volume can be visualized as being penetrated by a very large number of LORs that connect all valid opposing crystal pairs and where each of these LORs is paired with a counter that records the number of times an event occurred along that LOR. This process can be visualized as the multiplication of an image vector Ij, by the system matrix MIJ, to yield the projection vector Pi:
where i = 1 to N and N is the (very large) number of LORs in the scanner and where j = 1 to K, where K is the number of points in the image (not small). With iterative methods, an initial guess is made about the contents of the I vector, and that guess is transformed by M into a P vector. That P vector is then compared to the actual P vector and corrections based on the difference between these vectors determined. That difference is then used to adjust the guessed vector which is then forward projected to be compared to the original P vector. This process is continued until the difference between the guessed and original P vector falls below some predetermined value terminating the procedure and yielding the “best” PET image.
This (much oversimplified) formulation has defined the common conceptual bias for making these corrections by modeling the physics of each phenomenon and embedding these corrections in the M matrix to include, and thereby remove, their collective effects. This approach has been successful and 3D iterative reconstructions methods, e.g., 3D MLEM57, OSEM58, MAP-EM59, etc. are in widespread use in both clinical and small animal PET. It would not be surprising if noise reducing changes in small animal scanner design, e.g., total body scanners, one to one crystal/photosensor coupling, etc. allowed even more sophisticated computational methods to push performance limits even higher.
AI Image Reconstruction and Corrections
There is an alternative to physics-based reconstruction and correction of PET images that is currently under intense investigation: the use of artificial intelligence (AI) methods to potentially provide solutions to an enormous variety of practical problems that emerge during the creation and analysis of medical images, including PET. While most of this work has been directed towards clinical PET, similar applications also exist in small animal PET. The literature on AI is rapidly evolving and many excellent review articles are available60–65 that describe in detail the wide variety of methods and applications now being investigated. Although AI methods are well beyond the scope of this review, it is useful to consider a few examples that illustrate these possibilities.
Image Reconstruction
The basic data acquired during a PET scan is the P vector noted above and this vector must be transformed into a PET image. But this transformation can also be carried out by a neural network “trained” with a large “ground truth” data set to recognize a “true” reconstructed PET image from a “corrupt” reconstructed PET image66. If the training set captures the full range of variations in the P vector across the population of all such matrices, then when presented with an arbitrary P vector, the network should produce the corresponding “true” PET image. An example of this process (omitting significant details) is shown in Figure 15 where the “ground truth” was obtained by simulating the entire PET imaging process in a whole-body digital phantom66.
Figure 15.
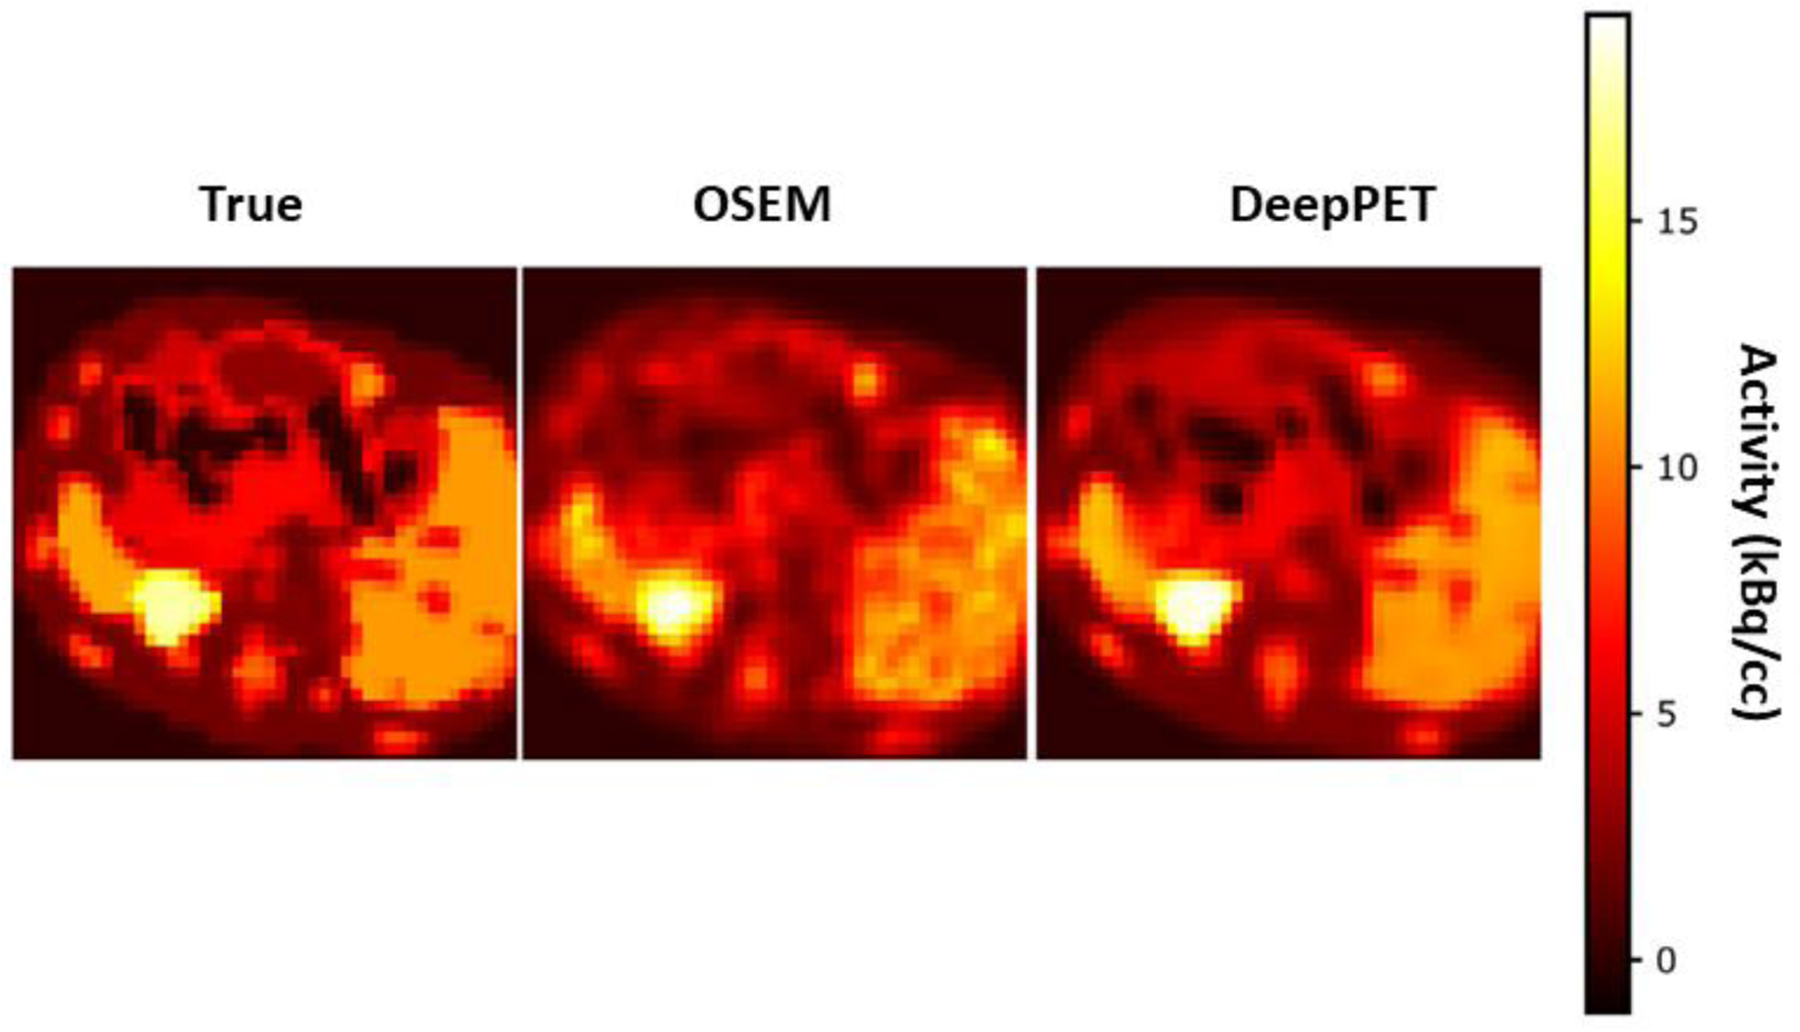
Comparison of ground truth (left), OSEM (center) and AI (DeepPET, right) PET image reconstructions of the same image slice. OSEM is nearly equal to DeepPET in terms of image quality metrics, albeit mostly appearing noisier and less detailed. Adapted with permission from “DeepPET: A deep encoder–decoder network for directly solving the PET image reconstruction inverse problem.”, Häggström, Ida, et al., Medical image analysis 54 (2019): 253–262.
A detailed visual inspection of these images shows that, while remarkably similar, the AI image is subtly different from the ground truth image and does not faithfully portray all structures visible in the ground truth image nor the sharpness of edges of various structures. On the other hand, the AI images reproduces the uniformity of the large structure at the right while the OSEM image does not. Nonetheless, the AI images appear to reproduce the ground truth image with greater fidelity than the “standard” OSEM version and that reason alone would suggest its use. Not insignificantly, the DeepPET image was computed more than two orders of magnitude faster than the OSEM image. This computing speed difference has real world consequences in both human and animal studies where clinical time constraints are significant in-patient care and where minimization of computing time for large number of small animal PET studies is also important.
Attenuation Correction
AI can be applied in many other settings related to PET67,68. Attenuation correction of PET image data is critical to the accuracy of estimating tissue radioactivity content in human subjects and larger “small” animals such as rats, rabbits, monkeys, etc., It is also necessary when imaging multiple mice at the same time. Most often, a CT scan obtained immediately before or after PET imaging is used to make this measured correction while also providing an anatomical overlay on the PET images. While this methodology is in widespread use, there has been a continuing effort to reduce the CT radiation dose component of this process69–71. Figures 16–17 show the results of using a “deep learning” (DL) neural network to create a CT scan (Figure 16) using only the corresponding PET image as input72. The synthesized CT image is then used to correct the PET image for attenuation (Figure 17). This process thus eliminates the time and radiation exposure of an actual CT scan yet preserves its utility as an anatomical overlay.
Figure 16.
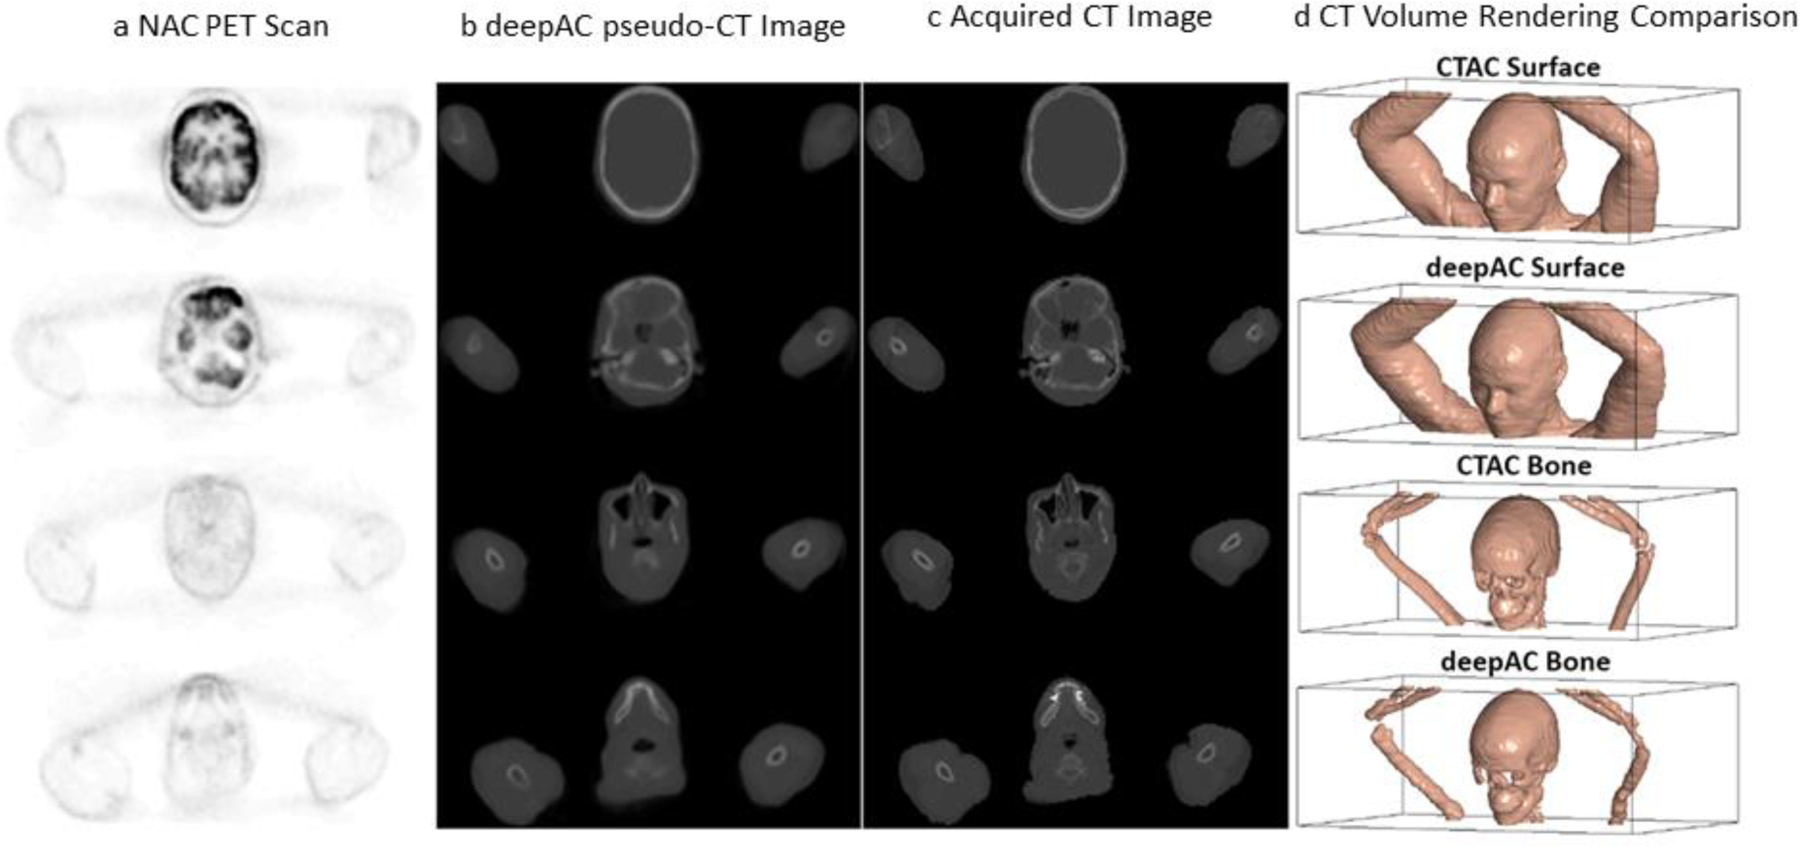
Deep learning (DL) derived CT scan from an FDG PET image of the same section. NAC: non-attenuation corrected PET FDG scan, deepACpseudo-CT image: DL created CT image; Acquired CT image: actual CT scan of the same section. Adapted with permission from “A deep learning approach for 18 F-FDG PET attenuation correction.”, Liu, Fang, et al., EJNMMI physics 5.1 (2018): 1–15.
Figure 17.
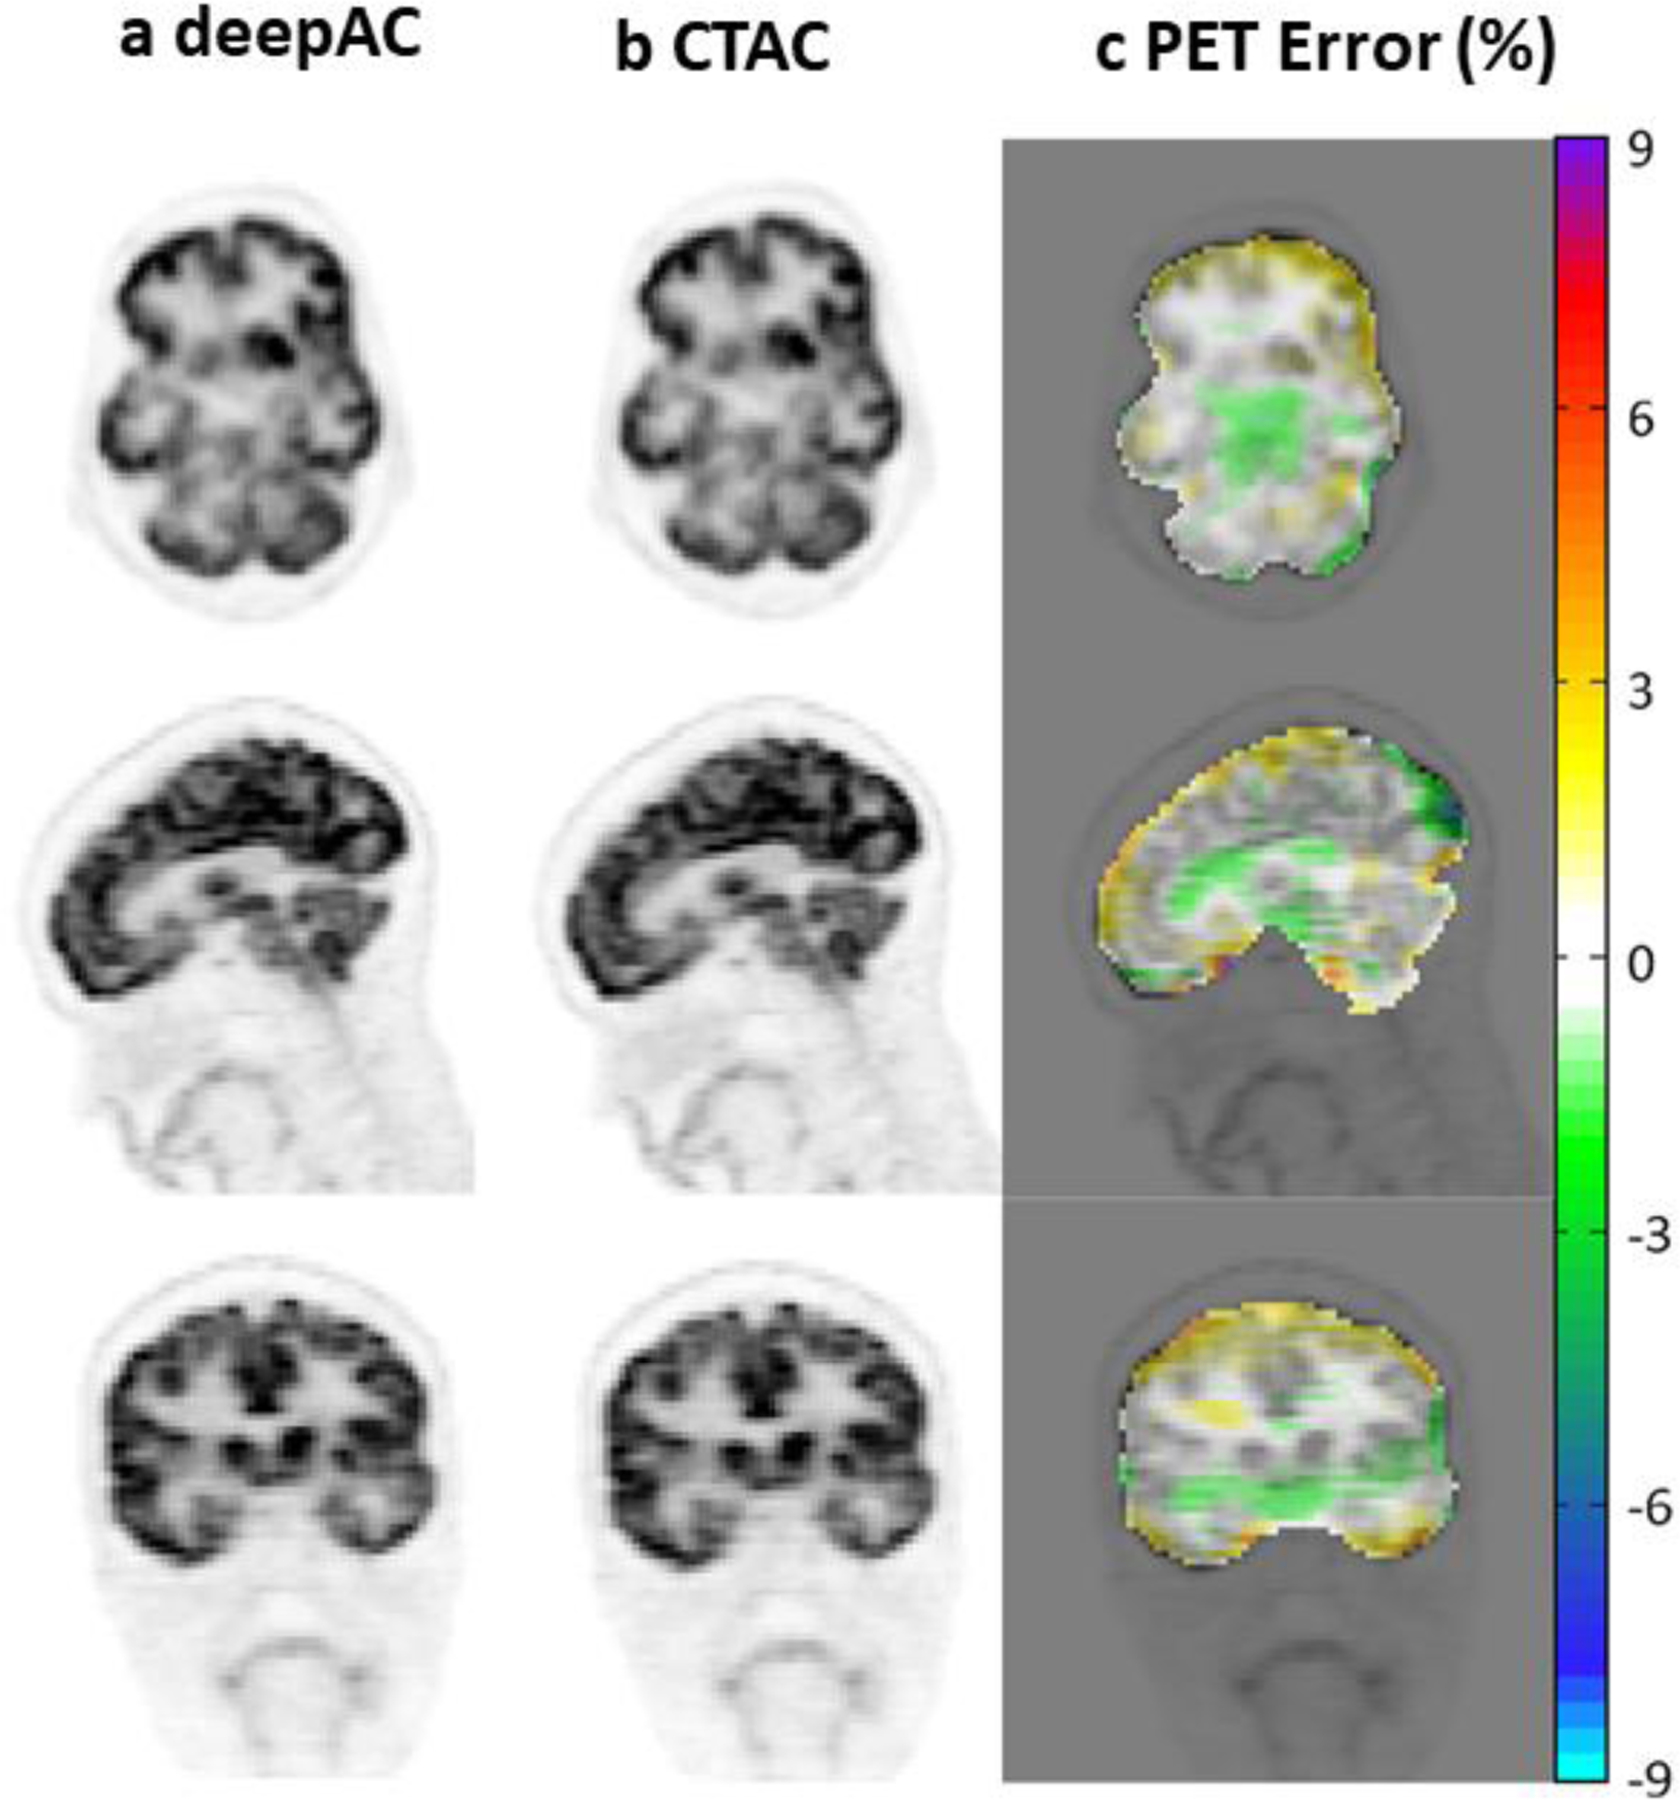
Comparison of FDG PET scans corrected for attenuation with the DL attenuation image (a) and the actual CT image (b). PET error is the difference between the derived and actual PET image. Adapted with permission from “A deep learning approach for 18 F-FDG PET attenuation correction.”, Liu, Fang, et al., EJNMMI physics 5.1 (2018): 1–15.
Low Dose PET- De-noising
Radionuclide imaging studies are characterized by poor signal-to-noise ratios (SNRs) that arise from the combination of maximum allowable radiation exposure, low detection efficiencies and the statistical properties of radioactive decay. Increases in SNR would benefit every aspect of PET imaging, both human and animal. Figure 18 shows the results of an iterative convolutional neural network (CNN) reconstruction that uses prior MRI data to create PET images comparable to state-of-the art MAP-EM images, but with 100 times less PET data73.
Figure 18.
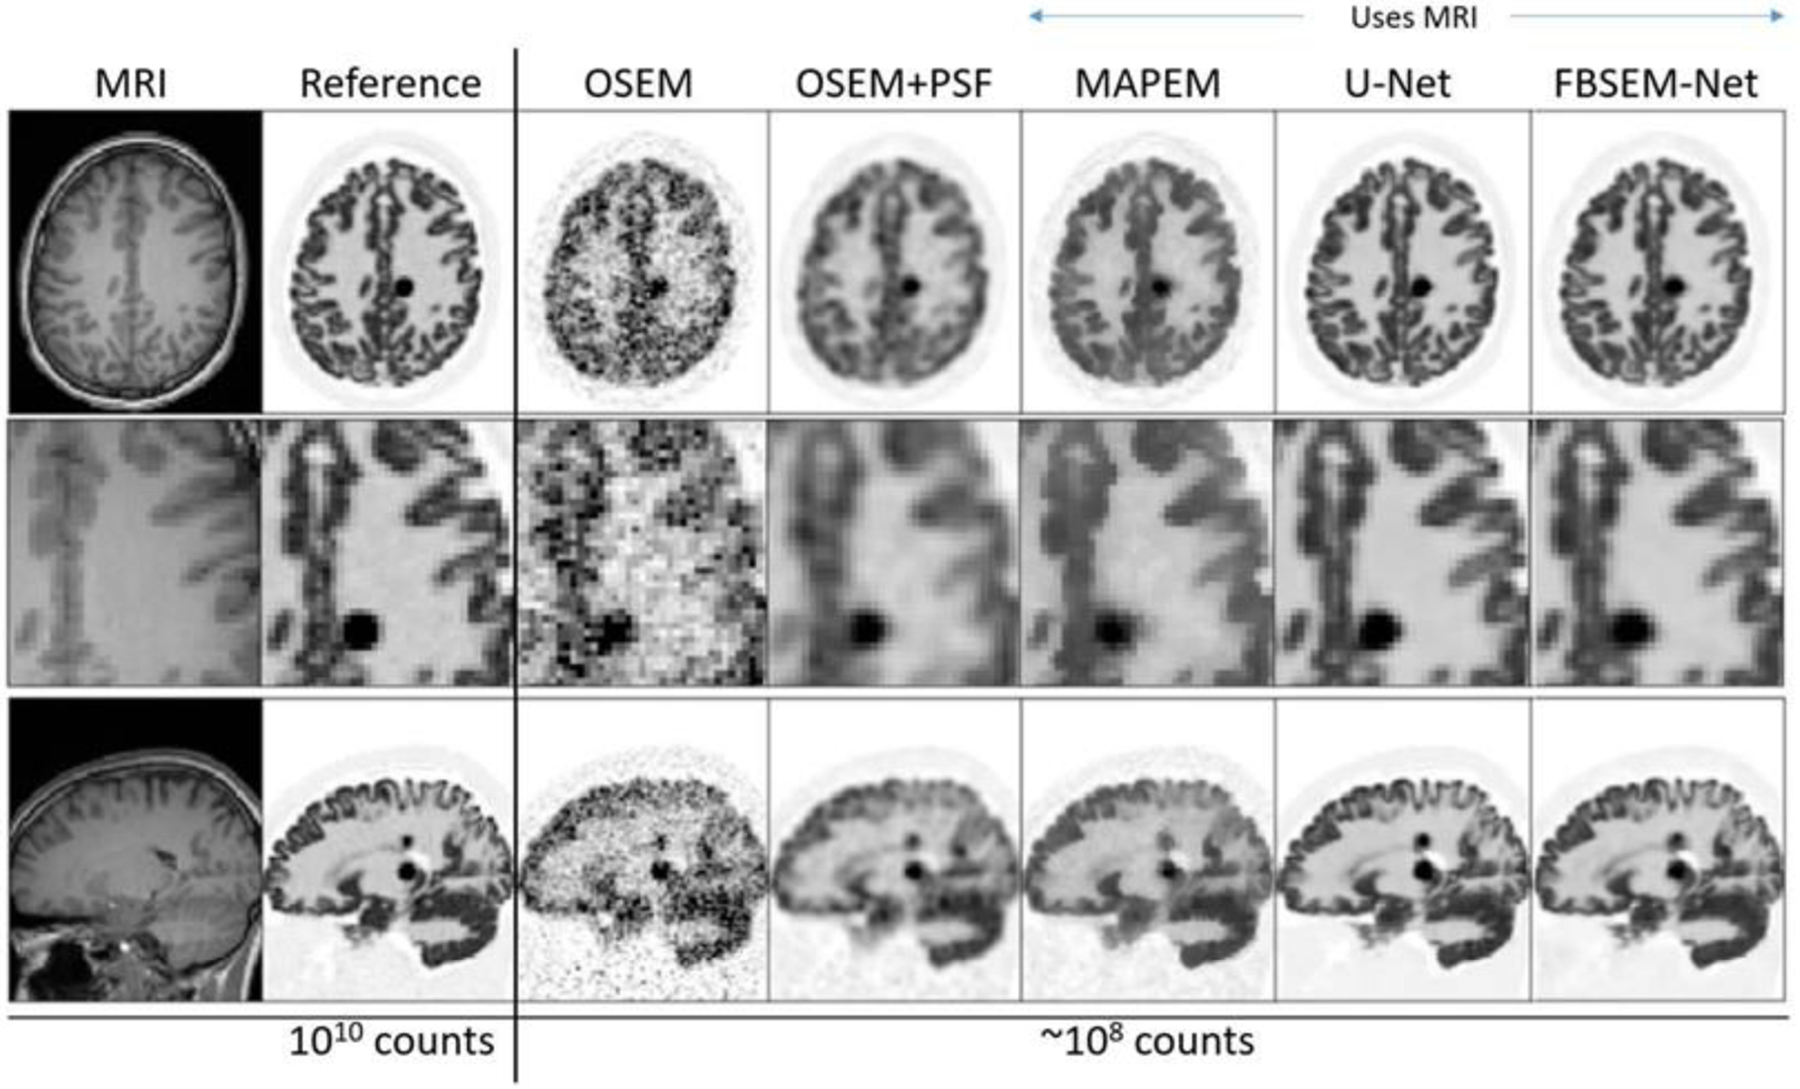
Example slices for 3D simulated [18F]FDG data for a forward-backward splitting expectation maximization (FBSEM-Net network), trained to match high-count reference data, when using ~100 times less data along with a T1w MR image for further information. FBSEM-Net is compared to conventional ordered subset expectation maximization (OSEM, no MRI benefit), without and with point spread function (PSF) modelling, maximum a posteriori expectation maximization (MAP-EM) with MRI guidance, and to a post-reconstruction denoised reconstruction using a U-Net supplied with MRI information. Adapted with permission from2 “Deep learning for PET image reconstruction.”, Reader, Andrew J., et al., IEEE Transactions on Radiation and Plasma Medical Sciences 5.1 (2020): 1–25.
Such methods could allow significant reductions in administered tracer dose (and attendant radiation exposure) without significant compromise in image quality74. Other AI methods have also been proposed that do not require a priori information to achieve nearly the same end75–77. Dose reductions could also be of benefit in longitudinal small animal studies where multiple tracer doses are required over time.
AI Positron Range Correction
As noted previously, positron range is a significant source of image degradation in small animal PET and corrections for this effect can directly improve the accuracy of activity measurements made in small animal organs. An example of an AI method that corrects for positron range78 is shown in Figure 19. The majority of human and small animal studies are purposefully carried out with 18F where positron range has minimal effect. But other isotopes of potential interest in both human and small animal studies have substantially greater ranges, e.g., 89Zr, range = 1.2 mm, that by virtue of half-life (78.4 hours), are able to accurately quantify the transport of agents with much longer biological transit times, e.g., monoclonal antibodies, than typical 18F labeled agents.
Figure 19.

Coronal section through a simulated mouse CT scan (a), and simulated PET images of the same slice distribution of 18F (b), 68Ga (c) and 68Ga (d) corrected for positron range using the Deep-PRC neural network. Note similarity between (b) and (d) and the difference between the uncorrected 68Ga image (c). Adapted with permission from “Deep-learning based positron range correction of PET images.”, Herraiz, Joaquín L. et al., Applied sciences 11.1 (2021): 266.
AI methods such as these offer novel opportunities to create and correct PET images of all kinds, human and animal, for degrading effects but typical AI methods often require very large training sets to achieve results like those describe here. On the other hand, many small animal studies are “one shot” in nature. For example, a putative diagnostic drug with a certain biodistribution targeting certain tumor types might require evaluation in only a small cohort of mice so that a large training set would never be available to make these corrections. This problem also occurs in the clinical environment where it is no accident that many published AI PET-related studies use patient data sets where 18FDG is the tracer since the great majority of human studies employ this compound. As a result, a large amount of clinical data exists for this compound along with correlative a priori information, e.g., CT or MRI scans, that can provide additional inputs to neural networks. There are also standards for carrying out FDG studies in human subjects that specify administered dose, uptake/imaging time, etc. that narrow the range of possible FDG image outcomes in humans where the anatomy is fully defined. Changes to compounds with bio-distributions dramatically different from 18FDG could lead to the same learning set problem in human subjects. But there may be a potential solution to this problem: “transfer learning”79, a process whereby a network can be trained on a (larger) data set, then fine-tuned with a (smaller) different data set to accomplish a related task. Importantly, in some cases Monte Carlo simulations can be used to create the larger data set and (fewer) small animal (or human) studies used for tuning. Given the variety of compounds evaluated in these experiments, transfer learning may expand the use of AI methods by building on already acquired or simulated data sets.
PET Image Analysis
Contemporary commercial small animal PET scanners have been designed for general purpose tomographic imaging that, when combined with other imaging modalities, e.g., CT, MRI, present the user with virtually unlimited measurement opportunities. But while acquisition of these data is relatively straightforward, reconstructing and analyzing tomographic images is often very time consuming when the number of studies is large. In particular, in order to measure organ or tissue radioactivity content, many 2D regions-of-interest (ROIs) must be defined that bound these structures in 3D. And it is common that some degree of user interaction accompanies this step, from fully manual definition of the 2D ROIs to supervision and correction of automated ROIs.
There are, however, experimental circumstances where tomography and definition of 3D ROIs is not required and an imaging system designed specifically for a small range of applications can more efficiently solve the experimental problem at hand. A positron projection imager (PPI), an electronically collimated, high energy gamma camera is a device of this kind80 intended to quantify the amount of positron-emitting radioactivity in human tumor xenografts implanted on a lateral side of an immune compromised mouse81. The FOV is 5 × 10 cm, a size sufficient to image a single mouse whole body in one projection or a portion of two mice containing xenografts when placed side by side perpendicular to the long axis of the FOV (Figure 20). This scanner design takes explicit advantage of the fact that, unlike endogenous tumors, xenografts can be placed anywhere on the animal, including on a lateral side where, in posterior projection, the growing tumor is in relief against the animal body and largely surrounded by air. In this geometry, projection imaging of the tumor will yield estimates of tumor activity that are largely free of background and scatter effects that might otherwise confound quantitative accuracy were the target tumor located within the body proper. Moreover, since these tumors are of the order of 1 cm across or less, attenuation across the tumor is largely ignorable and no CT scan is required. In addition, since the tumors are generally isolated from other labeled structures, generous regions-of-interest can be drawn around these tumors with recovery coefficients near unity. Once the net total count rate within a tumor ROI is known, that value is scaled by a constant calibration factor for that isotope to give tumor activity in units of Bq.
Figure 20.
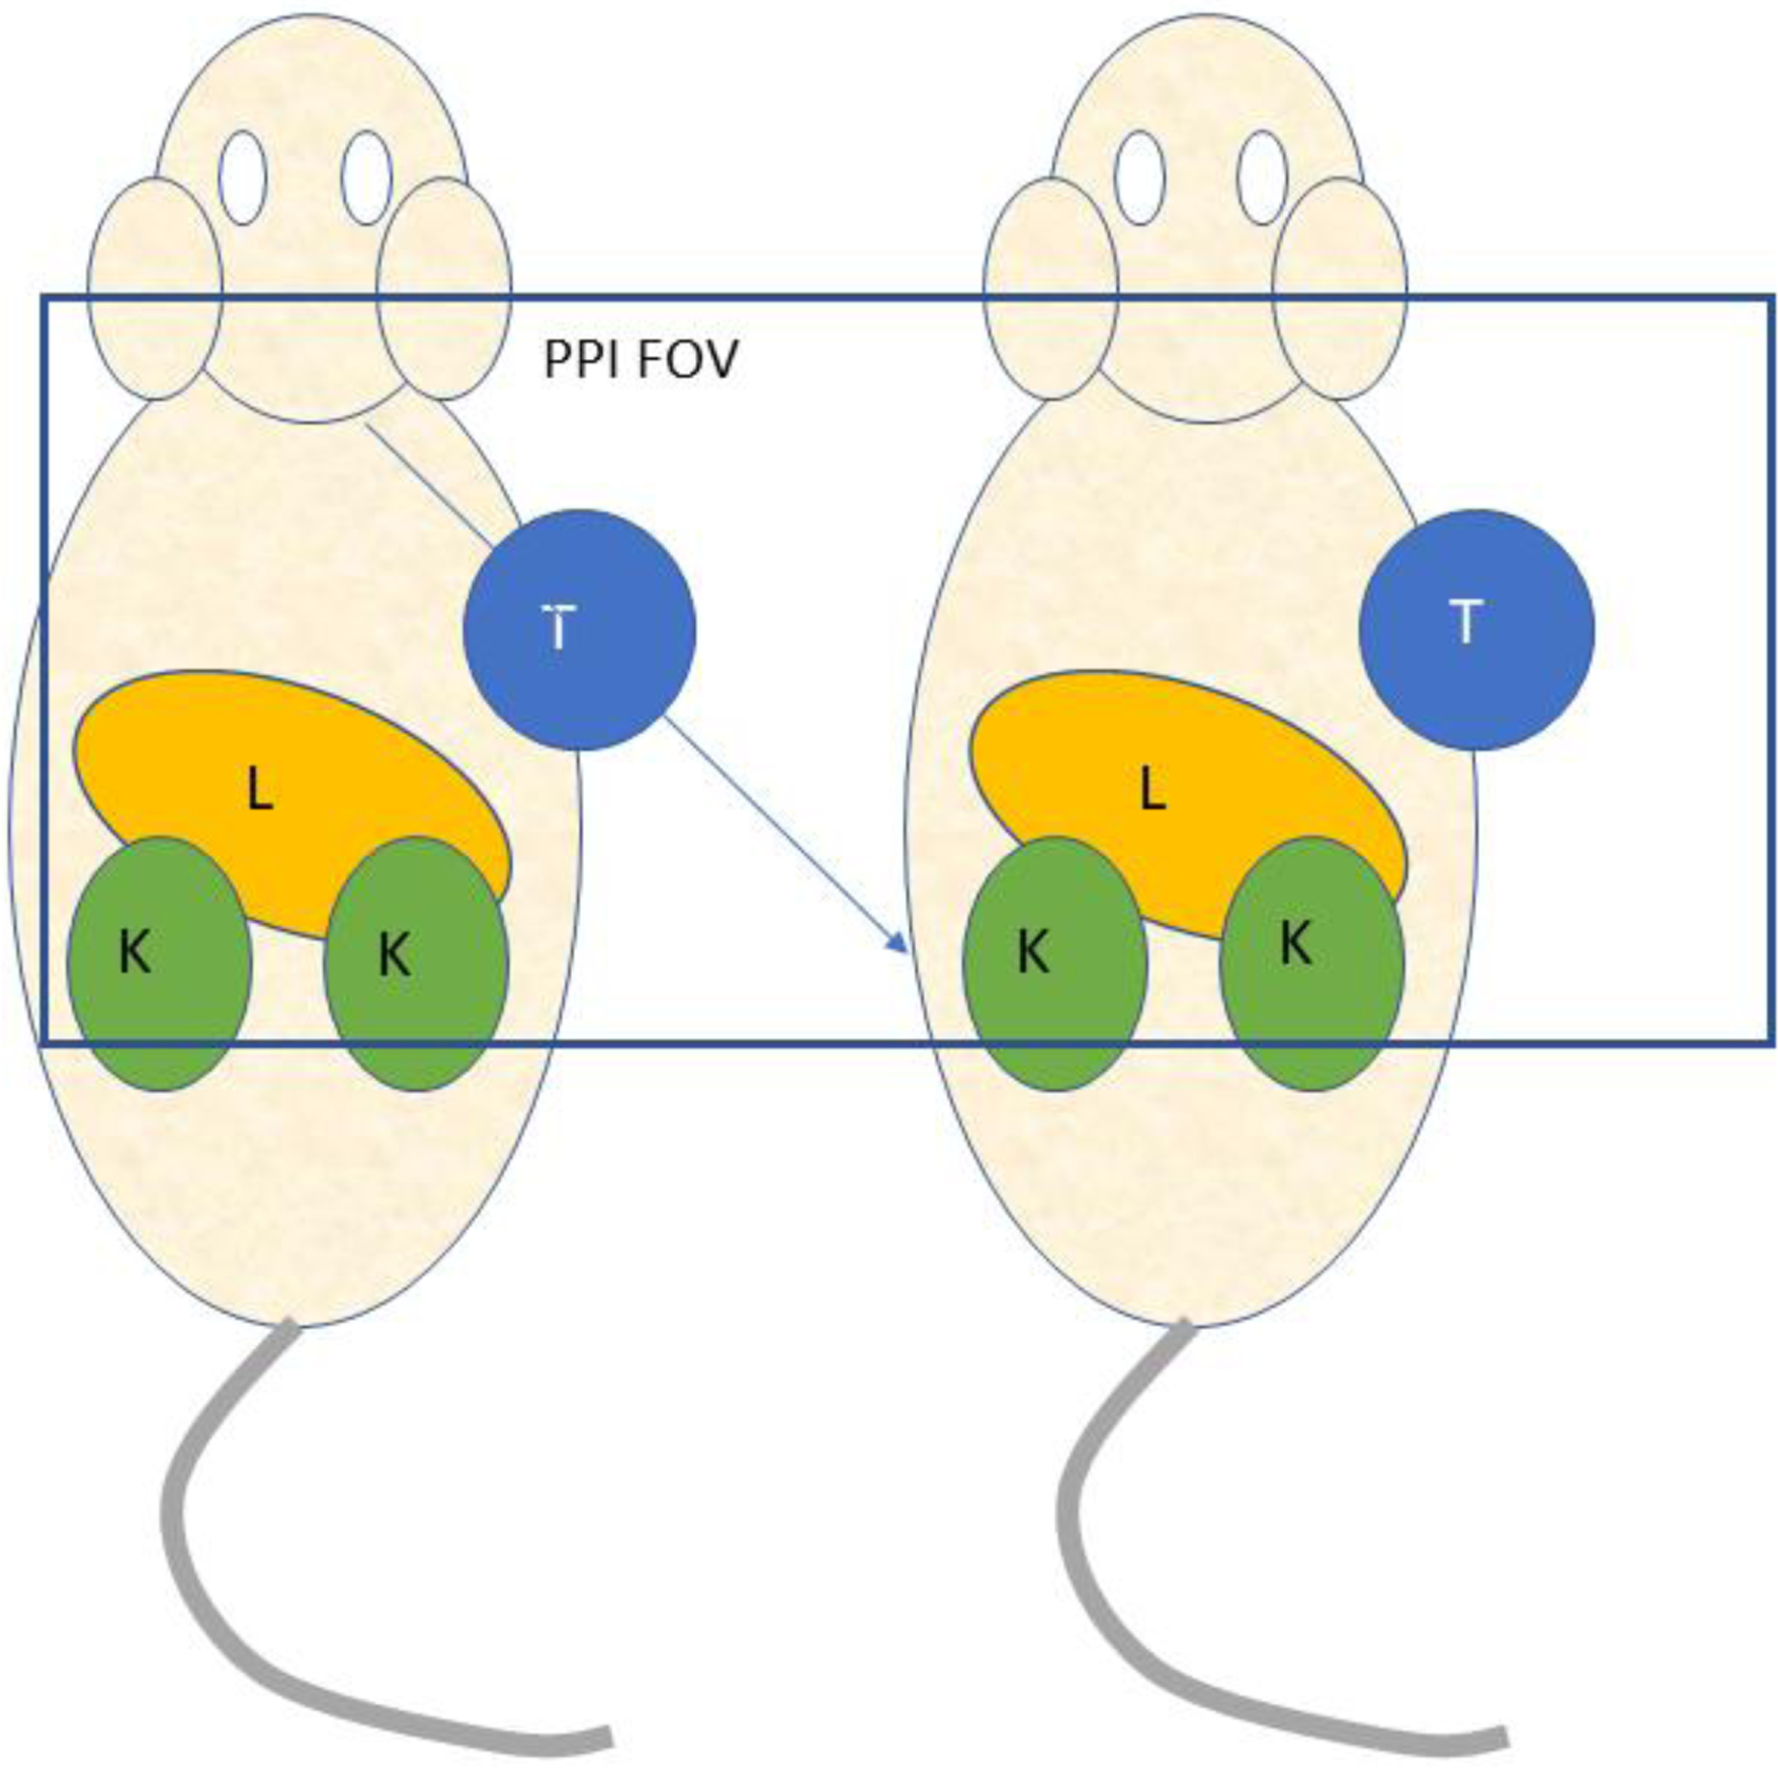
Posterior view of a mouse pair imaged with the positron projection imager (PPI). T = tumor; L = liver; K = kidney. Overlayed rectangle indicates the field-of-view of the device.
A singular advantage of this PPI/animal model combination is that the image of the field of view is available immediately at the end of data collection and ready to be analyzed. To do so, only one tumor ROI need be defined in each mouse (and one background ROI) to measure total tumor radioactivity. In contrast, dozens of ROIs must be defined in each mouse after image reconstruction to obtain the same result if the pair were imaged with a conventional PET scanner. Moreover, CT attenuation correction is also required if a conventional PET scanner is used to image two mice at the same time. This difference in ROI numbers and no CT makes PPI imaging in this particular application a far more efficient way to obtain tumor activity measurements.
But data reduction could be further speeded if regions-of-interest around these tumors could be identified automatically at the end of data collection. If so, the PPI could be converted from an imaging device to a “mouse tumor assay machine”, just like any other piece of lab equipment. Mice would be put in at one end and the corresponding total tumor activities would come out the other. This process is illustrated in (Figure 21) where tumor regions-of-interest have been drawn on PPI images by the deep-learning U-net algorithm after training the algorithm with a set of 247 similar images derived from 76 mice pairs analyzed manually. AI-generated tumor ROIs were in generally good spatial agreement with manual ROIs and produced values for total tumor activity that were virtually identical to the manual values with only a few exceptions. As one might expect, an image differing substantially in appearance from a “typical” image in the training set might be incorrectly analyzed as shown in the Figure 21, lower right, but as the size of the training set increases, such errors should occur less and less frequently. It is noteworthy that the U-net algorithm outperformed several other popular image segmentation algorithms (region-growing Level-Set, threshold-based Otsu and mean value) in this application. Given this outcome, it is not difficult to imagine the U-net algorithm immediately defining the ROIs for the two side-by-side mice at the end of data collection, calculating the tumor activities in each, displaying the PPI image with the defined ROIs overlayed on the image (for QC purposes) and adding the tumor activities values to the growing list of studies done that day. Here, the use of AI is entirely practical and is simply a means of accelerating the analysis of the data acquired in large numbers of mice, a common feature of cancer drug development studies.
Figure 21.
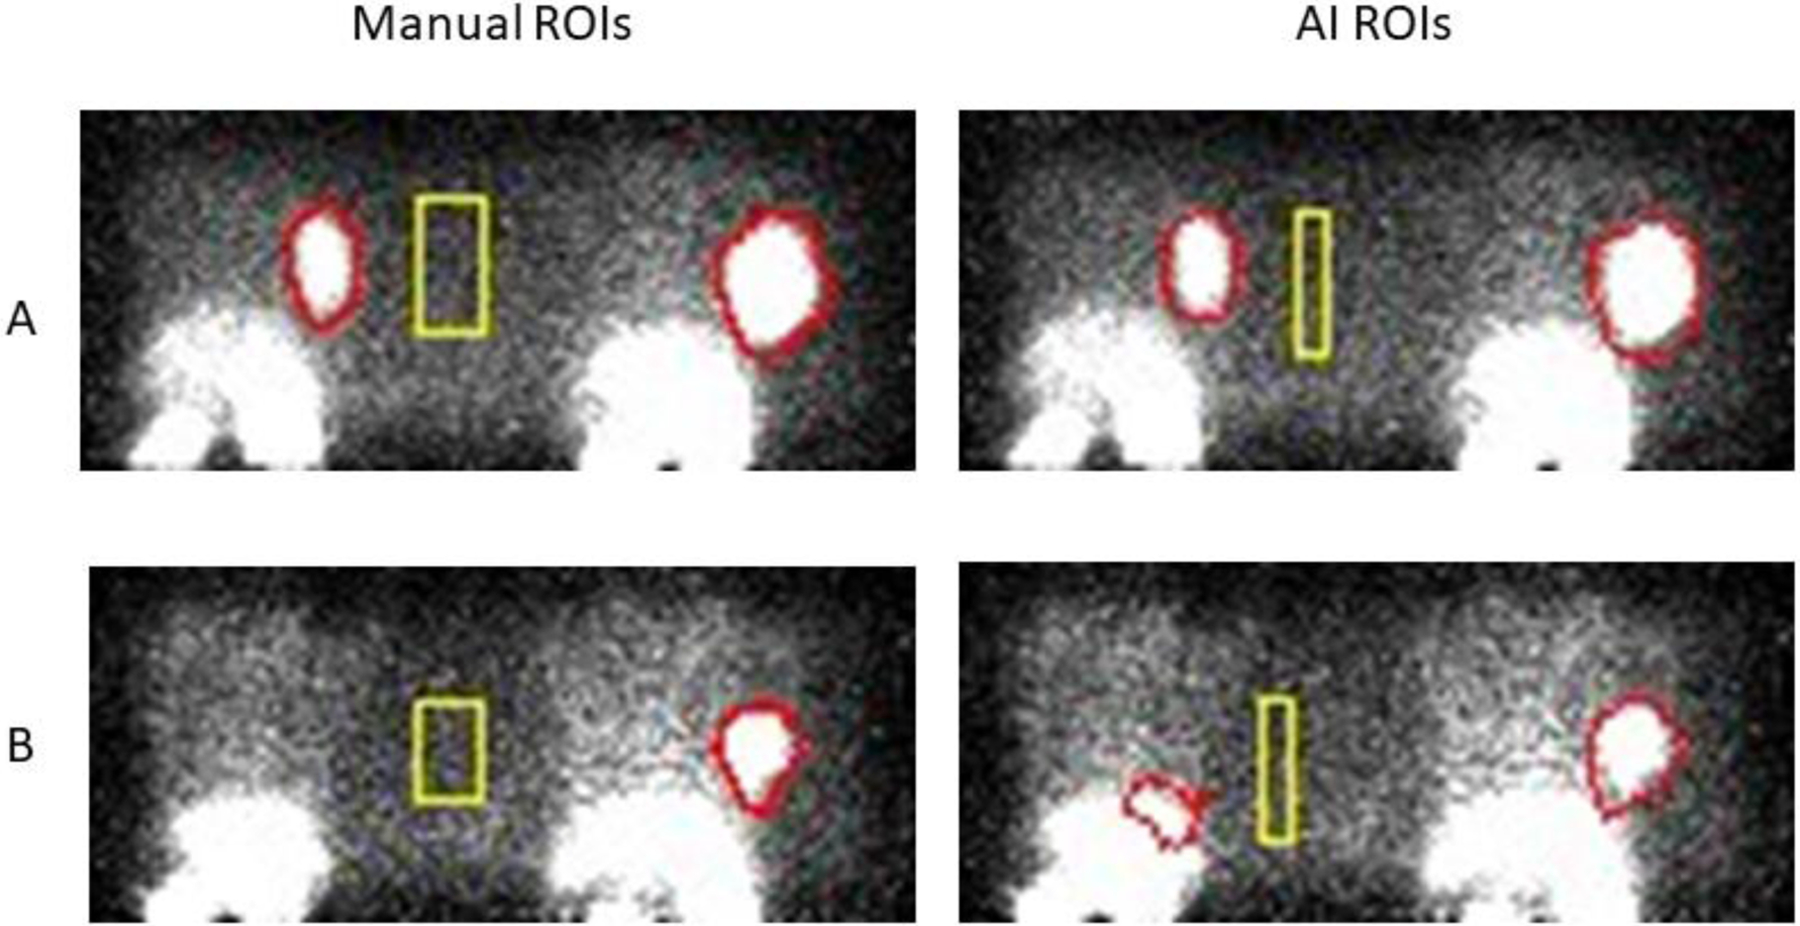
PPI images of two different mouse pairs (A and B) imaged in the geometry shown in Figure 20 where regions of interest (ROIs) have been defined manually (left panels) and by the U-net AI algorithm (right panels). Most of these test studies showed good agreement (as in A) but occasionally disagreed on the size of a background region (rectangle) and/or tumor boundaries (there was no lesion in the mouse at the left in B). Total tumor activity is relatively insensitive to the size of the background ROI but does depend on location between animals. Mean background values in the ROIs shown were not significantly different between methods. (Courtesy of K. Ma, S. Harmon, NCI/NIH)
In this trial, the U-net algorithm was trained with images of mice containing the same radioactive compound (18FDCPyl) so that the body distribution of this agent was similar from animal to animal. The biodistribution of this compound was also favorable by accumulating in the tumor in reasonable amounts and in only a few major body organs. Changes in amount (Figure 21, lower right) or in bio-distribution (Figure 2) could alter this outcome.
Complementary Imaging Methods
Conventional PET imaging is fundamentally based on detecting time-coincident 511 keV annihilation gamma rays but other more subtle information is also embedded in these timing data.
High Resolution Time of Flight (TOF)
Measurement of the arrival time difference of 511 keV photons from a positron/electron annihilation event is now used during clinical image reconstruction to significantly reduce image noise and improve image quality. The FWHM of the time difference spectra in these machines has, until recently, been of the order of 200–300 picoseconds, a range that correspond to a distance in the object being imaged of about Δx = 3–4.5 cm where Δx is related to the time difference Δt via Δx=cΔt/2 and c is the speed of light82. The effectiveness of TOF noise suppression increases as the ratio D/Δx increases, where D is the width of the object being imaged. If the average width of a human adult is about 30 cm, this ratio takes on a value between 6 and 10 for this timing difference. However, if this same TOF correction were applied to a mouse PET study, there would be no benefit because the width of the mouse (2 cm) would give a much smaller ratio (between 0.4 and 0.7) and TOF would have very little effect on reconstruction noise. But this situation could change for human PET and, perhaps, in the future for small animal PET. Kwon, et al.83 recently described a bench top, proof-of-principle TOF experiment with a timing FWHM of 32 ps, nearly a factor of 10 improvement over current TOF machines and an in-object distance, i.e., spatial resolution, of about 4.8 mm, a value roughly comparable to the spatial resolution of contemporary human PET scanners (2–4 mm). In this experiment, an image of a realistic test object was created by locating annihilation sites along their respective LORs (Figure 6) using only the arrival time difference between annihilation photons, i.e., a useful image was formed without reconstruction from projections. This experiment employed an entirely novel detector module that generates (fast) Cerenkov photons from the transfer of energy from a 511 keV photon to an electron in a thin Pb glass substrate, collection of these photons by a photocathode deposited on the back of the Pb glass, followed by amplification of the electron cloud released from the photocathode by a multi-channel plate amplifier. This method also employed a trained convolutional neural network to improve estimation of arrival time differences.
Although this timing resolution would not allow direct creation of meaningful images in mouse-sized objects, the ratio of body width to timing distance for a mouse at this very high timing resolution, would be about 20 mm/4.8 mm = 4.2, a value similar to the current human value. Thus, at this much higher timing resolution, TOF could substantially reduce image reconstruction noise in animals as small as mice and more so in rats and larger animals and, because of this reduction, allow more accurate correction for the effects that degrade small animal PET images.
While this achievement may foretell fundamental changes in the way PET imaging is carried out with future human scanners (projection-less imaging), the effects illustrated in Figure 6 will still be present and will require correction. The obstacles to implementing high resolution TOF in full-scale human or animal scanners are formidable but it is likely that research interest in this area will intensify. It is of interest that should ultra-high resolution TOF become a reality, the PPI, as described above, could be transformed into a tomograph with no geometric changes to the instrument. The two planar detector modules could be placed on opposite sides of a breast or above and below the prostate to create tomographic images of both.
Positronium PET Imaging
Emission of a positron during nuclear decay often creates a bound electron/positron pair (positronium) whose lifetime is determined by the immediate atomic and molecular environment in which the pair forms. If the parent nucleus emits a gamma ray at the moment the positron is created, detection of that gamma ray can be imagined as starting a clock that counts down until the arrival of the annihilation gamma ray pair from the eventual decay of the positronium. This time difference, in turn, encodes some features of the positronium environment that are of potential medical interest, e.g., local tissue oxygen content. This methodology is applicable in principle to PET studies in both humans and animals. Technical details and initial experimental findings are found in the reference section84–86.
Dual Isotope PET Imaging
A disadvantage of imaging positron emitting isotopes by their annihilation gamma ray emissions is that these events always result in gamma rays of the same energy and thus cannot be energetically separated to visualize different positron labelled compounds in the body. A potential solution to this problem would be to image one “pure” positron emitting isotope, e.g., 18F, in the presence of a second positron emitter that also emitted an energetically favorable nuclear gamma ray at the moment of positron emission, e.g., 124I. If the nuclear gamma ray was detected at the same time as the 511 keV coincidence event, that event would be flagged as coming from the second isotope. Flagged and un-flagged coincidence data would then be separated to produce images corresponding to each isotope (and compound). In principle, this method is applicable to both animal and human studies. Technical details of this method are found in the reference section87–91.
Single Photon PET Imaging
An alternative to time-coincidence small animal PET imaging is to treat annihilation gamma rays from positron-emitting isotopes as (×2) single photon emissions and use high energy, multi-pinhole collimators and tomographic reconstruction for image formation. The factors that determine the performance and applications and of such devices differ from conventional PET scanners in several important ways.
As emphasized in previous sections, PET does not image the location of the site of radioactive decay (the desired outcome) but, instead, images the location of positron/electron annihilation events some distance away from the decaying nucleus. Although positron range is modest for isotopes like 18F, many biologically useful isotopes have positron ranges that preclude their use in rodents, e.g., 124I, or are a significant source of image degradation, e.g., 89Zr. However, as described above, a number of these isotopes emit abundant nuclear gamma rays at the same time as positron emission, but nuclear gamma rays are not subject to the positron range effect. As a result, single photon imaging of these nuclear gamma rays yields images free of positron range blurring91 thereby allowing the use of these isotopes in small animals. This same strategy can also be employed to image combinations of single photon and positron emitting tracers when gamma ray energies are favorable91, a capability that greatly expands the range of potential isotopic labels and compounds. It is noteworthy that single photon imaging of single photon emitters like 99mTc, with near ideal imaging properties, has yielded SPECT images that approach the human sampling goal in mice of 0.2 mm (0.25 mm)92,93, the highest spatial resolution yet reported. The principal limitations of this technology are much lower sensitivity compared to conventional PET and limitations on the size of the FOV.
Multi-modality Imaging
The combination of PET with sequential CT was transformative for both human94,95 and small animal imaging studies25,96–100 and spurred development of other potentially synergistic technological combinations such as small animal PET/MRI101–105. Such systems take direct advantage of the fact that digital detector modules using solid state photodetectors and compact data processing elements can be operated in strong magnetic fields (unlike photomultiplier tubes). This capability is compelling in a research environment because it not only allows the high soft tissue contrast of MRI to be combined with functional PET measurements but also adds MR spectroscopic (and other) information to the acquired data. The improvements in PET detector technology have been so great that a small animal PET detector array can now be carried by hand from a CT scanner to an MR scanner and used interchangeably for sequential PET/CT and sequential PET/MR small animal imaging106, an unimaginable possibility a decade ago. Other combination technologies have also been developed for animals including PET/optical imaging107–109 and PET/CT/Ultrasound110. Experiments that fully exploit these capabilities are still in their infancy but it is likely that such multimodality methods will become increasingly common in the future.
Novel PET and Positron Imaging Applications
“Preclinical PET imaging” became generally descriptive of this technology because it was thought, rightly, that the primary use of PET in biomedical animal research would be the investigation of new diagnostic drugs and treatments prior to their use in humans. But it is also true that PET and related radionuclide imaging technology can be applied to basic science research where study outcomes are simply a clearer understanding of basic physiological or biological processes.
The study by Balaban111, et al. is a remarkable example of such an application. Here, 18F-FDG was used to image regional function of the embryonic chicken brain, i.e., inside the egg, during external auditory stimulation to identify waking-like brain activity before hatching. This technologically elaborate experiment probed brain function and structure in ways that would be unreachable by other methodologies. Similarly, Weisenberger112–114, et al., and others115,116 have devised imaging systems capable of visualizing and quantifying the photosynthesis-driven transport of positron emitting compounds such as 11CO2 or 22Na+ ions through the leaf and root structures of plants, information invaluable in understanding the response of plants to a host of environmental challenges. In other disciplines, PET imaging has been combined with motion tracking of the heads of rodents117,118 to allow “motion free” imaging of the brain without anesthetizing the animal, thereby removing a serious confounding factor in the study of brain function in these animals. Given this flexibility, it is very likely that development of these kinds of devices will continue to open new areas of investigation in the basic sciences.
Progress in small animal and human PET emanates from the continuous interplay between physics, mathematics and technological advances that together have been combined to improve imaging performance and the range of applications of this technology. The development of modern small animal PET imaging system is a perfect example of this synergistic process. In the beginning, simply being able to image small structures in rodents was a major challenge given the tools at hand. Nonetheless, small ring diameter machines subject to significant DOI effects lead to development of high crystal packing density, DOI correcting detector modules, a process that continues today. Module designs have been further improved by the use of compact, high performance, digital solid state photosensors that allow new scanner geometries and applications, e. g., PET/MRI. At the same time, the need for high resolution in rodent studies spurred investigation of computational methods that could correct, at least in part, for instrument blur and noise even though such computations could not be performed on a realistic time scale using computer technology available at the time. Such computational schemes are now routine in both human and small animal PET because of the astonishing increases in computational power over the past few decades, a power that now enables a whole host of new applications that include sophisticated granular modeling of the entire PET imaging process, simulations as input to AI algorithms and the potential use of AI algorithms themselves at every step in the data acquisition/imaging processing chain. This evolution is evident today in the remarkable time of flight experiments described earlier that could potentially change the way PET is carried out in future. This multi-disciplinary synergy has transformed PET, animal and human, and continues unabated today.
Acknowledgements
The authors wish to thank Esther Mena, M.D., Kevin Ma, PhD., Stephanie Harmon, PhD., Elaine M. Jagoda, MS and Michael V. Green, MS, NCI, NIH, for their contributions to this work. This project has been funded in whole or in part with federal funds from the National Cancer Institute, National Institutes of Health, under contract No. 75N91019D00024, Task Order No. 75N91019F00129. The content of this publication does not necessarily reflect the views of policies of the Department of Health and Human services, nor does mention of trade names, commercial products, or organization imply endorsement by the U.S. Government.
Footnotes
Publisher's Disclaimer: This is a PDF file of an unedited manuscript that has been accepted for publication. As a service to our customers we are providing this early version of the manuscript. The manuscript will undergo copyediting, typesetting, and review of the resulting proof before it is published in its final form. Please note that during the production process errors may be discovered which could affect the content, and all legal disclaimers that apply to the journal pertain.
Declaration of interests
The authors declare that they have no known competing financial interests or personal relationships that could have appeared to influence the work reported in this paper
References
- 1.Vaquero JJ, Kinahan P. Positron emission tomography: current challenges and opportunities for technological advances in clinical and preclinical imaging systems. Annual review of biomedical engineering. 2015;17:385–414. [DOI] [PMC free article] [PubMed] [Google Scholar]
- 2.Amirrashedi M, Zaidi H, Ay MR. Advances in preclinical PET instrumentation. PET clinics. 2020;15(4):403–426. [DOI] [PubMed] [Google Scholar]
- 3.Miyaoka RS, Lehnert AL. Small animal PET: a review of what we have done and where we are going. Physics in Medicine & Biology. 2020;65(24):24TR04. [DOI] [PubMed] [Google Scholar]
- 4.Yang Y, Bec J, Zhou J, et al. A prototype high-resolution small-animal PET scanner dedicated to mouse brain imaging. Journal of Nuclear Medicine. 2016;57(7):1130–1135. [DOI] [PMC free article] [PubMed] [Google Scholar]
- 5.Levin CS, Hoffman EJ. Calculation of positron range and its effect on the fundamental limit of positron emission tomography system spatial resolution. Physics in Medicine & Biology. 1999;44(3):781. [DOI] [PubMed] [Google Scholar]
- 6.Bertolli O, Eleftheriou A, Cecchetti M, Camarlinghi N, Belcari N, Tsoumpas C. PET iterative reconstruction incorporating an efficient positron range correction method. Physica medica. 2016;32(2):323–330. [DOI] [PubMed] [Google Scholar]
- 7.Emond EC, Groves AM, Hutton BF, Thielemans K. Effect of positron range on PET quantification in diseased and normal lungs. Physics in Medicine & Biology. 2019;64(20):205010. [DOI] [PubMed] [Google Scholar]
- 8.Shibuya K, Yoshida E, Nishikido F, et al. Limit of spatial resolution in FDG-PET due to annihilation photon non-collinearity. World Congress on Medical Physics and Biomedical Engineering 2006. 2007:1667–1671. [Google Scholar]
- 9.Beringer R, Montgomery CG. The angular distribution of positron annihilation radiation. Physical Review. 1942;61(5–6):222. [Google Scholar]
- 10.Ma B, Gaens M, Caldeira L, et al. Scatter correction based on GPU-accelerated full Monte Carlo simulation for brain PET/MRI. IEEE Transactions on Medical Imaging. 2019;39(1):140–151. [DOI] [PubMed] [Google Scholar]
- 11.Moses WW. Fundamental limits of spatial resolution in PET. Nuclear Instruments and Methods in Physics Research Section A: Accelerators, Spectrometers, Detectors and Associated Equipment. 2011;648:S236–S240. [DOI] [PMC free article] [PubMed] [Google Scholar]
- 12.St James S, Yang Y, Wu Y, et al. Experimental characterization and system simulations of depth of interaction PET detectors using 0.5 mm and 0.7 mm LSO arrays. Physics in Medicine & Biology. 2009;54(14):4605. [DOI] [PMC free article] [PubMed] [Google Scholar]
- 13.Mohammadi I, Castro I, Correia P, Silva A, Veloso J. Minimization of parallax error in positron emission tomography using depth of interaction capable detectors: methods and apparatus. Biomedical Physics & Engineering Express. 2019;5(6):062001. [Google Scholar]
- 14.Pizzichemi M, Stringhini G, Niknejad T, et al. A new method for depth of interaction determination in PET detectors. Physics in Medicine & Biology. 2016;61(12):4679. [DOI] [PubMed] [Google Scholar]
- 15.Green MV, Ostrow HG, Seidel J, Pomper MG. Experimental evaluation of depth-of-interaction correction in a small-animal positron emission tomography scanner. Molecular imaging. 2010;9(6):7290.2010. 00038. [PMC free article] [PubMed] [Google Scholar]
- 16.Tsuda T, Murayama H, Kitamura K, et al. A four-layer depth of interaction detector block for small animal PET. IEEE Transactions on Nuclear Science. 2004;51(5):2537–2542. [Google Scholar]
- 17.Yang Y, Dokhale PA, Silverman RW, et al. Depth of interaction resolution measurements for a high resolution PET detector using position sensitive avalanche photodiodes. Physics in Medicine & Biology. 2006;51(9):2131. [DOI] [PubMed] [Google Scholar]
- 18.Chinn G, Olcott PD, Levin CS. Sparse signal recovery methods for multiplexing PET detector readout. IEEE transactions on medical imaging. 2013;32(5):932–942. [DOI] [PubMed] [Google Scholar]
- 19.Nehmeh SA, Erdi YE. Respiratory motion in positron emission tomography/computed tomography: a review. Elsevier; 2008:167–176. [DOI] [PubMed] [Google Scholar]
- 20.Kesner AL, Abourbeh G, Mishani E, Chisin R, Tshori S, Freedman N. Gating, enhanced gating, and beyond: information utilization strategies for motion management, applied to preclinical PET. EJNMMI research. 2013;3(1):1–15. [DOI] [PMC free article] [PubMed] [Google Scholar]
- 21.Catana C Motion correction options in PET/MRI. Elsevier; 2015:212–223. [DOI] [PMC free article] [PubMed] [Google Scholar]
- 22.Otani T, Otsuka H, Kondo K, et al. Utility of respiratory-gated small-animal PET/CT in the chronologic evaluation of an orthotopic lung cancer transplantation mouse model. Radiological physics and technology. 2015;8(2):266–277. [DOI] [PubMed] [Google Scholar]
- 23.Herraiz JL, Herranz E, Cal-González J, et al. Automatic cardiac self-gating of small-animal PET data. Molecular imaging and biology. 2016;18(1):109–116. [DOI] [PubMed] [Google Scholar]
- 24.Aide N, Desmonts C, Briand M, Meryet-Figuiere M, Poulain L. High-throughput small animal PET imaging in cancer research: evaluation of the capability of the Inveon scanner to image four mice simultaneously. Nuclear medicine communications. 2010;31(10):851–858. [DOI] [PubMed] [Google Scholar]
- 25.Szanda I, Mackewn J, Patay G, et al. National Electrical Manufacturers Association NU-4 performance evaluation of the PET component of the NanoPET/CT preclinical PET/CT scanner. Journal of nuclear medicine. 2011;52(11):1741–1747. [DOI] [PubMed] [Google Scholar]
- 26.Lee T-S, Rittenbach A, Fernández CG, Lopez-Longas J, Arco JM, Tsui BM. Initial evaluation of a state-of-the-art commercial preclinical PET/CT scanner. IEEE; 2016:1–4. [Google Scholar]
- 27.Belcari N, Camarlinghi N, Ferretti S, et al. NEMA NU-4 performance evaluation of the IRIS PET/CT preclinical scanner. IEEE Transactions on Radiation and Plasma Medical Sciences. 2017;1(4):301–309. [Google Scholar]
- 28.Spencer BA, Berg E, Schmall JP, et al. Performance evaluation of the uEXPLORER total-body PET/CT scanner based on NEMA NU 2–2018 with additional tests to characterize PET scanners with a long axial field of view. Journal of Nuclear Medicine. 2021;62(6):861–870. [DOI] [PMC free article] [PubMed] [Google Scholar]
- 29.Badawi RD, Shi H, Hu P, et al. First human imaging studies with the EXPLORER total-body PET scanner. Journal of Nuclear Medicine. 2019;60(3):299–303. [DOI] [PMC free article] [PubMed] [Google Scholar]
- 30.Huang Q, Massey JC, Mińczuk K, Li J, Kundu BK. Non-invasive determination of blood input function to compute rate of myocardial glucose uptake from dynamic FDG PET images of rat heart in vivo: comparative study between the inferior vena cava and the left ventricular blood pool with spill over and partial volume corrections. Physics in Medicine & Biology. 2019;64(16):165010. [DOI] [PMC free article] [PubMed] [Google Scholar]
- 31.Gómez-Cuadrado L, Tracey N, Ma R, Qian B, Brunton VG. Mouse models of metastasis: progress and prospects. Disease models & mechanisms. 2017;10(9):1061–1074. [DOI] [PMC free article] [PubMed] [Google Scholar]
- 32.Yang S, Zhang JJ, Huang X-Y. Mouse models for tumor metastasis. Rational drug design. Springer; 2012:221–228. [DOI] [PMC free article] [PubMed] [Google Scholar]
- 33.Casey M, Nutt R. A multicrystal two dimensional BGO detector system for positron emission tomography. Ieee transactions on nuclear science. 1986;33(1):460–463. [Google Scholar]
- 34.Knoll GF. Radiation detection and measurement. John Wiley & Sons; 2010. [Google Scholar]
- 35.Bergeron M, Thibaudeau C, Cadorette J, et al. LabPET II, an APD-based detector module with PET and counting CT imaging capabilities. IEEE Transactions on Nuclear Science. 2015;62(3):756–765. [Google Scholar]
- 36.Vaska P, Woody C, Schlyer D, et al. The design and performance of the 2 nd-generation RatCAP awake rat brain PET system. IEEE; 2007:4181–4184. [Google Scholar]
- 37.Spanoudaki V, Torres-Espallardo I, Rafecas M, Ziegler S. Performance evaluation of MADPET-II, a small animal dual layer LSO-APD PET scanner with individual detector read out and depth of interaction information. Soc Nuclear Med; 2007. [Google Scholar]
- 38.Bisogni MG, Morrocchi M. Development of analog solid-state photo-detectors for positron emission tomography. Nuclear Instruments and Methods in Physics Research Section A: Accelerators, Spectrometers, Detectors and Associated Equipment. 2016;809:140–148. [Google Scholar]
- 39.Roncali E, Cherry SR. Application of silicon photomultipliers to positron emission tomography. Annals of biomedical engineering. 2011;39(4):1358–1377. [DOI] [PMC free article] [PubMed] [Google Scholar]
- 40.Gundacker S, Heering A. The silicon photomultiplier: fundamentals and applications of a modern solid-state photon detector. Physics in Medicine & Biology. 2020;65(17):17TR01. [DOI] [PubMed] [Google Scholar]
- 41.Ito M, Lee JP, Lee JS. Timing performance study of new fast PMTs with LYSO for time-of-flight PET. IEEE Transactions on Nuclear Science. 2012;60(1):30–37. [Google Scholar]
- 42.Pan T, Einstein SA, Kappadath SC, et al. Performance evaluation of the 5-Ring GE Discovery MI PET/CT system using the national electrical manufacturers association NU 2–2012 Standard. Medical physics. 2019;46(7):3025–3033. [DOI] [PMC free article] [PubMed] [Google Scholar]
- 43.Surti S, Viswanath V, Daube-Witherspoon ME, Conti M, Casey ME, Karp JS. Benefit of improved performance with state-of-the art digital PET/CT for lesion detection in oncology. Journal of Nuclear Medicine. 2020;61(11):1684–1690. [DOI] [PMC free article] [PubMed] [Google Scholar]
- 44.Van Sluis J, De Jong J, Schaar J, et al. Performance characteristics of the digital biograph vision PET/CT system. Journal of Nuclear Medicine. 2019;60(7):1031–1036. [DOI] [PubMed] [Google Scholar]
- 45.Zhang J, Maniawski P, Knopp MV. Performance evaluation of the next generation solid-state digital photon counting PET/CT system. EJNMMI research. 2018;8(1):1–16. [DOI] [PMC free article] [PubMed] [Google Scholar]
- 46.Njejimana L, Tétrault M-A, Arpin L, et al. Design of a real-time FPGA-based data acquisition architecture for the LabPET II: An APD-based scanner dedicated to small animal PET imaging. IEEE Transactions on Nuclear Science. 2013;60(5):3633–3638. [Google Scholar]
- 47.Rolo MD, Bugalho R, Gonçalves F, et al. A 64-channel ASIC for TOFPET applications. IEEE; 2012:1460–1464. [Google Scholar]
- 48.Pratte J-F, Junnarkar S, Deptuch G, et al. The RatCAP front-end ASIC. IEEE Transactions on Nuclear Science. 2008;55(5):2727–2735. [Google Scholar]
- 49.Alessio AM, Stearns CW, Tong S, et al. Application and evaluation of a measured spatially variant system model for PET image reconstruction. IEEE transactions on medical imaging. 2010;29(3):938–949. [DOI] [PMC free article] [PubMed] [Google Scholar]
- 50.Liu J, Malekzadeh M, Mirian N, Song T-A, Liu C, Dutta J. Artificial intelligence-based image enhancement in pet imaging: Noise reduction and resolution enhancement. PET clinics. 2021;16(4):553–576. [DOI] [PMC free article] [PubMed] [Google Scholar]
- 51.Whiteley W, Luk WK, Gregor J. DirectPET: full-size neural network PET reconstruction from sinogram data. Journal of Medical Imaging. 2020;7(3):032503. [DOI] [PMC free article] [PubMed] [Google Scholar]
- 52.Whiteley W, Panin V, Zhou C, Cabello J, Bharkhada D, Gregor J. FastPET: near real-time reconstruction of PET histo-image data using a neural network. IEEE Transactions on Radiation and Plasma Medical Sciences. 2020;5(1):65–77. [Google Scholar]
- 53.Kaplan S, Zhu Y-M. Full-dose PET image estimation from low-dose PET image using deep learning: a pilot study. Journal of digital imaging. 2019;32(5):773–778. [DOI] [PMC free article] [PubMed] [Google Scholar]
- 54.Gong K, Guan J, Kim K, et al. Iterative PET image reconstruction using convolutional neural network representation. IEEE transactions on medical imaging. 2018;38(3):675–685. [DOI] [PMC free article] [PubMed] [Google Scholar]
- 55.Gong K, Catana C, Qi J, Li Q. PET image reconstruction using deep image prior. IEEE transactions on medical imaging. 2018;38(7):1655–1665. [DOI] [PMC free article] [PubMed] [Google Scholar]
- 56.Tong S, Alessio AM, Kinahan PE. Image reconstruction for PET/CT scanners: past achievements and future challenges. Imaging in medicine. 2010;2(5):529. [DOI] [PMC free article] [PubMed] [Google Scholar]
- 57.Shepp LA, Vardi Y. Maximum likelihood reconstruction for emission tomography. IEEE transactions on medical imaging. 1982;1(2):113–122. [DOI] [PubMed] [Google Scholar]
- 58.Hudson HM, Larkin RS. Accelerated image reconstruction using ordered subsets of projection data. IEEE transactions on medical imaging. 1994;13(4):601–609. [DOI] [PubMed] [Google Scholar]
- 59.Lange K Convergence of EM image reconstruction algorithms with Gibbs smoothing. IEEE transactions on medical imaging. 1990;9(4):439–446. [DOI] [PubMed] [Google Scholar]
- 60.Gong K, Kim K, Cui J, Wu D, Li Q. The evolution of image reconstruction in PET: from filtered back-projection to artificial intelligence. PET clinics. 2021;16(4):533–542. [DOI] [PubMed] [Google Scholar]
- 61.Reader AJ, Schramm G. Artificial Intelligence for PET Image Reconstruction. Journal of Nuclear Medicine. 2021;62(10):1330–1333. [DOI] [PubMed] [Google Scholar]
- 62.Arabi H, AkhavanAllaf A, Sanaat A, Shiri I, Zaidi H. The promise of artificial intelligence and deep learning in PET and SPECT imaging. Physica Medica. 2021;83:122–137. [DOI] [PubMed] [Google Scholar]
- 63.Wang G, Ye JC, Mueller K, Fessler JA. Image reconstruction is a new frontier of machine learning. IEEE transactions on medical imaging. 2018;37(6):1289–1296. [DOI] [PubMed] [Google Scholar]
- 64.Wang T, Lei Y, Fu Y, et al. Machine learning in quantitative PET: A review of attenuation correction and low-count image reconstruction methods. Physica Medica. 2020;76:294–306. [DOI] [PMC free article] [PubMed] [Google Scholar]
- 65.Zaidi H, El Naqa I. Quantitative molecular positron emission tomography imaging using advanced deep learning techniques. Annual review of biomedical engineering. 2021;23:249–276. [DOI] [PubMed] [Google Scholar]
- 66.Häggström I, Schmidtlein CR, Campanella G, Fuchs TJ. DeepPET: A deep encoder–decoder network for directly solving the PET image reconstruction inverse problem. Medical image analysis. 2019;54:253–262. [DOI] [PMC free article] [PubMed] [Google Scholar]
- 67.Lee JS. A review of deep-learning-based approaches for attenuation correction in positron emission tomography. IEEE Transactions on Radiation and Plasma Medical Sciences. 2020;5(2):160–184. [Google Scholar]
- 68.Dong X, Lei Y, Wang T, et al. Deep learning-based attenuation correction in the absence of structural information for whole-body positron emission tomography imaging. Physics in Medicine & Biology. 2020;65(5):055011. [DOI] [PMC free article] [PubMed] [Google Scholar]
- 69.Yang J, Sohn JH, Behr SC, Gullberg GT, Seo Y. CT-less direct correction of attenuation and scatter in the image space using deep learning for whole-body FDG PET: potential benefits and pitfalls. Radiology: Artificial Intelligence. 2020;3(2):e200137. [DOI] [PMC free article] [PubMed] [Google Scholar]
- 70.Ladefoged C, Marner L, Hindsholm A. Deep learning based attenuation correction of PET/MRI in pediatric brain tumor patients: evaluation in a clinical setting. Front. Neurosci 12, 1005. 2018. [DOI] [PMC free article] [PubMed] [Google Scholar]
- 71.Shiri I, Ghafarian P, Geramifar P, et al. Direct attenuation correction of brain PET images using only emission data via a deep convolutional encoder-decoder (Deep-DAC). European radiology. 2019;29(12):6867–6879. [DOI] [PubMed] [Google Scholar]
- 72.Liu F, Jang H, Kijowski R, Zhao G, Bradshaw T, McMillan AB. A deep learning approach for 18 F-FDG PET attenuation correction. EJNMMI physics. 2018;5(1):1–15. [DOI] [PMC free article] [PubMed] [Google Scholar]
- 73.Reader AJ, Corda G, Mehranian A, da Costa-Luis C, Ellis S, Schnabel JA. Deep learning for PET image reconstruction. IEEE Transactions on Radiation and Plasma Medical Sciences. 2020;5(1):1–25. [DOI] [PMC free article] [PubMed] [Google Scholar]
- 74.Xu J, Gong E, Pauly J, Zaharchuk G. 200x low-dose PET reconstruction using deep learning. arXiv preprint arXiv:171204119. 2017; [Google Scholar]
- 75.Cui J, Gong K, Guo N, et al. PET image denoising using unsupervised deep learning. European journal of nuclear medicine and molecular imaging. 2019;46(13):2780–2789. [DOI] [PMC free article] [PubMed] [Google Scholar]
- 76.Lu W, Onofrey JA, Lu Y, et al. An investigation of quantitative accuracy for deep learning based denoising in oncological PET. Physics in Medicine & Biology. 2019;64(16):165019. [DOI] [PubMed] [Google Scholar]
- 77.Gong K, Wu D, Kim K, et al. EMnet: an unrolled deep neural network for PET image reconstruction. SPIE; 2019:1203–1208. [Google Scholar]
- 78.Herraiz JL, Bembibre A, López-Montes A. Deep-learning based positron range correction of PET images. Applied sciences. 2021;11(1):266. [Google Scholar]
- 79.Capobianco N, Gafita A, Platsch G, et al. Transfer learning of AI-based uptake classification from 18F-FDG PET/CT to 68Ga-PSMA-11 PET/CT for whole-body tumor burden assessment. Soc Nuclear Med; 2020. [Google Scholar]
- 80.Seidel J, Xi W, Kakareka JW, et al. Performance characteristics of a positron projection imager for mouse whole-body imaging. Nuclear medicine and biology. 2013;40(3):321–330. [DOI] [PMC free article] [PubMed] [Google Scholar]
- 81.Green MV, Seidel J, Williams MR, et al. Comparison of planar, PET and well-counter measurements of total tumor radioactivity in a mouse xenograft model. Nuclear medicine and biology. 2017;53:29–36. [DOI] [PMC free article] [PubMed] [Google Scholar]
- 82.Schaart DR, Schramm G, Nuyts J, Surti S. Time of flight in perspective: instrumental and computational aspects of time resolution in positron emission tomography. IEEE transactions on radiation and plasma medical sciences. 2021;5(5):598–618. [DOI] [PMC free article] [PubMed] [Google Scholar]
- 83.Kwon SI, Ota R, Berg E, et al. Ultrafast timing enables reconstruction-free positron emission imaging. Nature Photonics. 2021;15(12):914–918. [DOI] [PMC free article] [PubMed] [Google Scholar]
- 84.Shibuya K, Saito H, Nishikido F, Takahashi M, Yamaya T. Oxygen sensing ability of positronium atom for tumor hypoxia imaging. Communications Physics. 2020;3(1):1–8. [Google Scholar]
- 85.Moskal P, Kisielewska D, Curceanu C, et al. Feasibility study of the positronium imaging with the J-PET tomograph. Physics in Medicine & Biology. 2019;64(5):055017. [DOI] [PubMed] [Google Scholar]
- 86.Moskal P, Dulski K, Chug N, et al. Positronium imaging with the novel multiphoton PET scanner. Science Advances. 2021;7(42):eabh4394. [DOI] [PMC free article] [PubMed] [Google Scholar]
- 87.Fukuchi T, Okauchi T, Shigeta M, Yamamoto S, Watanabe Y, Enomoto S. Positron emission tomography with additional γ-ray detectors for multiple-tracer imaging. Medical Physics. 2017;44(6):2257–2266. [DOI] [PubMed] [Google Scholar]
- 88.Andreyev A, Celler A. Dual-isotope PET using positron-gamma emitters. Physics in Medicine & Biology. 2011;56(14):4539. [DOI] [PubMed] [Google Scholar]
- 89.Miyaoka RS, Hunter WC, Andreyev A, et al. Dual-radioisotope PET data acquisition and analysis. IEEE; 2011:3780–3783. [Google Scholar]
- 90.Parot V, Moore SC, Sitek A, et al. Recovery and normalization of triple coincidences in PET. 2015; [DOI] [PubMed] [Google Scholar]
- 91.Moore SC, Krishnamoorthy S, Blankemeyer E, Carlin SD, Karp JS, Metzler SD. Simultaneous micro-PET imaging of F-18 and I-124 with correction for triple-random coincidences. International Society for Optics and Photonics; 2019:110720I. [Google Scholar]
- 92.Beekman F, Kamphuis C, Koustoulidou S, Ramakers R, Goorden M. Positron range-free and multi-isotope tomography of positron emitters. Physics in Medicine & Biology. 2021;66(6):065011. [DOI] [PubMed] [Google Scholar]
- 93.Ivashchenko O, van der Have F, Villena JL, et al. Quarter-millimeter-resolution molecular mouse imaging with U-SPECT+. Molecular imaging. 2015;14(1):7290.2014. 00053. [DOI] [PubMed] [Google Scholar]
- 94.Townsend DW. Combined positron emission tomography–computed tomography: the historical perspective. Elsevier; 2008:232–235. [DOI] [PMC free article] [PubMed] [Google Scholar]
- 95.Townsend DW, Carney JP, Yap JT, Hall NC. PET/CT today and tomorrow. Journal of Nuclear Medicine. 2004;45(1 suppl):4S–14S. [PubMed] [Google Scholar]
- 96.Sato N, Wu H, Asiedu KO, Szajek LP, Griffiths GL, Choyke PL. 89Zr-oxine complex PET cell imaging in monitoring cell-based therapies. Radiology. 2015;275(2):490–500. [DOI] [PMC free article] [PubMed] [Google Scholar]
- 97.Mirbolooki MR, Constantinescu CC, Pan M-L, Mukherjee J. Quantitative assessment of brown adipose tissue metabolic activity and volume using 18 F-FDG PET/CT and β3-adrenergic receptor activation. EJNMMI research. 2011;1(1):1–11. [DOI] [PMC free article] [PubMed] [Google Scholar]
- 98.Lasnon C, Quak E, Briand M, Gu Z, Louis M-H, Aide N. Contrast-enhanced small-animal PET/CT in cancer research: strong improvement of diagnostic accuracy without significant alteration of quantitative accuracy and NEMA NU 4–2008 image quality parameters. EJNMMI research. 2013;3(1):1–11. [DOI] [PMC free article] [PubMed] [Google Scholar]
- 99.Molinos C, Sasser T, Salmon P, et al. Low-dose imaging in a new preclinical total-body PET/CT scanner. Frontiers in medicine. 2019;6:88. [DOI] [PMC free article] [PubMed] [Google Scholar]
- 100.Warnock G, Turtoi A, Blomme A, et al. In vivo PET/CT in a human glioblastoma chicken chorioallantoic membrane model: a new tool for oncology and radiotracer development. Journal of Nuclear Medicine. 2013;54(10):1782–1788. [DOI] [PubMed] [Google Scholar]
- 101.Wehrl HF, Judenhofer MS, Wiehr S, Pichler BJ. Pre-clinical PET/MR: technological advances and new perspectives in biomedical research. European journal of nuclear medicine and molecular imaging. 2009;36(1):56–68. [DOI] [PubMed] [Google Scholar]
- 102.Goertzen AL, Stortz G, Thiessen JD, et al. First results from a high-resolution small animal SiPM PET insert for PET/MR imaging at 7T. IEEE Transactions on Nuclear Science. 2016;63(5):2424–2433. [Google Scholar]
- 103.Son J-W, Kim KY, Park JY, et al. SimPET: a preclinical PET insert for simultaneous PET/MR imaging. Molecular imaging and biology. 2020;22(5):1208–1217. [DOI] [PubMed] [Google Scholar]
- 104.Courteau A, McGrath J, Walker PM, et al. Performance evaluation and compatibility studies of a compact preclinical scanner for simultaneous PET/MR imaging at 7 Tesla. IEEE Transactions on Medical Imaging. 2020;40(1):205–217. [DOI] [PubMed] [Google Scholar]
- 105.Hallen P, Schug D, Weissler B, et al. PET performance evaluation of the small-animal Hyperion IID PET/MRI insert based on the NEMA NU-4 standard. Biomedical physics & engineering express. 2018;4(6):065027. [DOI] [PMC free article] [PubMed] [Google Scholar]
- 106.Vrigneaud J, McGrath J, Courteau A, et al. Initial performance evaluation of a preclinical PET scanner available as a clip-on assembly in a sequential PET/MRI system. Physics in Medicine & Biology. 2018;63(12):125007. [DOI] [PubMed] [Google Scholar]
- 107.Molotkov A, Bhatt N, Doubrovin M, et al. Multimodality molecular imaging of the alveolar-capillary barrier in lung disease using albumin based optical and PET tracers. Molecular Biomedicine. 2020;1(1):1–8. [DOI] [PMC free article] [PubMed] [Google Scholar]
- 108.Nahrendorf M, Keliher E, Marinelli B, et al. Hybrid PET-optical imaging using targeted probes. Proceedings of the National Academy of Sciences. 2010;107(17):7910–7915. [DOI] [PMC free article] [PubMed] [Google Scholar]
- 109.Seibold U, Wängler B, Schirrmacher R, Wängler C. Bimodal imaging probes for combined PET and OI: recent developments and future directions for hybrid agent development. Biomed Res Int. 2014;153741. [DOI] [PMC free article] [PubMed] [Google Scholar]
- 110.Perez-Liva M, Viel T, Yoganathan T, et al. Performance evaluation of the PET component of a hybrid PET/CT-ultrafast ultrasound imaging instrument. Physics in Medicine & Biology. 2018;63(19):19NT01. [DOI] [PubMed] [Google Scholar]
- 111.Balaban E, Desco M, Vaquero J-J. Waking-like brain function in embryos. Current Biology. 2012;22(10):852–861. [DOI] [PubMed] [Google Scholar]
- 112.Weisenberger AG, Kross B, Lee SJ, et al. Nuclear physics detector technology applied to plant biology research. Nuclear Instruments and Methods in Physics Research Section A: Accelerators, Spectrometers, Detectors and Associated Equipment. 2013;718:157–159. [Google Scholar]
- 113.Weisenberger A, Stolin A, Kross B, et al. Compact beta particle/positron imager for plant biology. IEEE; 2010:1752–1754. [Google Scholar]
- 114.Weisenberger AG, Kross B, Lee S, et al. PhytoBeta imager: a positron imager for plant biology. Physics in Medicine & Biology. 2012;57(13):4195. [DOI] [PubMed] [Google Scholar]
- 115.Mincke J, Courtyn J, Vanhove C, Vandenberghe S, Steppe K. Guide to plant-PET imaging using 11CO2. Frontiers in plant science. 2021;12. [DOI] [PMC free article] [PubMed] [Google Scholar]
- 116.Ariño-Estrada G, Mitchell GS, Saha P, et al. Imaging salt uptake dynamics in plants using PET. Scientific reports. 2019;9(1):1–9. [DOI] [PMC free article] [PubMed] [Google Scholar]
- 117.Arias-Valcayo F, Herraiz JL, Galve P, Vaquero J, Desco M, Udías JM. Awake preclinical brain PET imaging based on point sources. International Society for Optics and Photonics; 2019:1107235. [Google Scholar]
- 118.Miranda A, Glorie D, Bertoglio D, et al. Awake 18F-FDG PET imaging of memantine-induced brain activation and test–retest in freely running mice. Journal of Nuclear Medicine. 2019;60(6):844–850. [DOI] [PMC free article] [PubMed] [Google Scholar]


