Abstract
Most integral endpoints of the antimicrobial effect are determined over an arbitrarily chosen time period, such as the dosing interval (τ), regardless of the actual effect duration. Unlike the τ-related endpoints, the intensity of the antimicrobial effect (IE) does consider its duration—from time zero to the time when bacterial counts on the regrowth curve achieve the same maximal numbers as in the absence of the antimicrobial. To examine the possible impact of this fundamental difference on the relationships of the antimicrobial effect to the ratio of the area under the concentration-time curve (AUC) to the MIC, a clinical isolate of Staphylococcus aureus was exposed to simulated gemifloxacin pharmacokinetics over a 40-fold range of AUC/MIC ratios, from 11 to 466 h. In each run, IE and four τ-related endpoints, including the area under the time-kill curve (AUBC), the area above the curve (AAC), the area between the control growth and time-kill curves (ABBC), and the ABBC related to the area under the control growth curve (AUGC), were calculated for τ = 24 h. Unlike the IE, which displayed pseudolinear relationships with the AUC/MIC ratio; each τ-related endpoint showed a distinct saturation at potentially therapeutic AUC/MIC ratios (116 to 466 h) when the antimicrobial effect persisted longer than τ. This saturation results from the underestimation of the true effect and may be eliminated if ABBC, AAC, and AUBC (but not AUGC) are modified and determined in the same manner as the IE to consider the actual effect duration. These data suggest a marginal value of the τ-related endpoints as indices of the total antimicrobial effect. Since all of them respond to AUC/MIC ratio changes less than the IE, the latter is preferable in comparative pharmacodynamic studies.
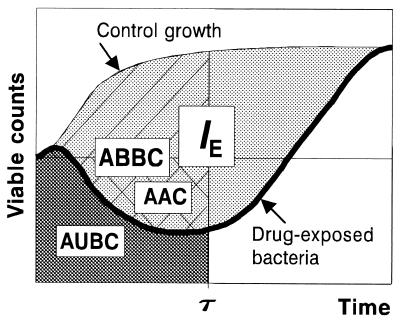
Different integral endpoints (Fig. 1), including the area under the time-kill curve (AUBC, sometimes abbreviated AUBKC [9]) (12; S. M. Navashin, I. P. Fomina, V. M. Chernykh, A. D. Nazarov, and A. A. Firsov, Abstr. 9th Int. Congr. Infect. Parasitic Dis., abstr. 1394, 1986), the area above the curve (AAC) (13), the algebraic sum of the areas around the level of the initial inoculum, the area between the control growth and time-kill curves (ABBC) (4), and the ABBC related to area under the control growth curve (AUGC) (J. Bosso, C. Bonapace, R. White, L. Friedrich, D. Cappeletty, R. Mercier, H. Houlihan, J. Aeschliman, and M. Rybak, Abstr. 38th Intersci. Conf. Antimicrob. Agents Chemother., abstr. 134, 1998), have been described and applied in pharmacodynamic studies using in vitro models. All of these endpoints are determined over an arbitrarily chosen time period, such as the dosing interval (τ), regardless of the actual effect duration. Unlike the τ-related endpoints, the intensity of the antimicrobial effect (IE) does consider its duration, from time zero to the time when bacterial counts on the regrowth curve achieve the same maximal numbers as in the absence of the antimicrobial (3, 7).
FIG. 1.
Integral endpoints of the antimicrobial effect.
This study was designed to examine the possible impact of the fundamental difference between the IE and the τ-related endpoint ABBC, AAC, AUGC, or AUBC on the area under the concentration-time curve (AUC)/MIC-response relationships, with special emphasis on AUC/MIC ratios in the therapeutic range, 100 to 500 h (10, 11), and the possibility of improving the τ-related endpoints with the use of specific modifications. To compare the different endpoints of the effect, simulated gemifloxacin pharmacodynamics with Staphylococcus aureus were studied over a wide range of AUC/MIC ratios using an in vitro dynamic model.
MATERIALS AND METHODS
Antimicrobial agent and bacterial strain.
Gemifloxacin mesylate powder, kindly provided by SmithKline Beecham Pharmaceuticals, and a clinical isolate of methicillin-resistant S. aureus were used in this study. The MIC of gemifloxacin, determined as described elsewhere (5), was 0.01 μg/ml.
In vitro dynamic model and simulated pharmacokinetic profiles.
A previously described dynamic model (7) was used in this study. The operation procedure, reliability of simulations of quinolone pharmacokinetic profiles, and the high reproducibility of the time-kill curves provided by the model have been reported elsewhere (5).
A series of monoexponential profiles that mimic single-dose administration of gemifloxacin was simulated. The simulated half-life (7.4 h) represented weighted medians of values reported for humans: 5.88 to 8.77 h (1, 2). The simulated AUC/MIC ratios and the peak concentration-to-MIC ratios varied from 11 to 466 h and from 1 to 44, respectively.
Quantitation of time-kill curves and antimicrobial effect.
In each experiment, multiple sampling of bacterium-containing medium from the central compartment was performed throughout the observation period. In each case, the duration of the experiments was defined as the time until antibiotic-exposed bacteria reached the maximum numbers observed in the absence of the antimicrobial (≥1010 CFU/ml). The procedure used to quantitate viable counts has been reported elsewhere (5). The lower limit of accurate detection was 5 × 10² CFU/ml.
Based on time-kill data, four τ-related endpoints of the antimicrobial effect, i.e., the ABBC, AAC, AUGC, and AUBC at τ = 24 h, as well as the τ-independent IE, were determined in each run. The upper limit of bacterial numbers, i.e., the cutoff level on the regrowth and control growth curves used to determine the ABBC, AAC, AUGC, AUBC, and IE was 109 CFU/ml.
Relationships of antimicrobial effect to the AUC/MIC ratio.
Each integral endpoint of the antimicrobial effect was related to the log AUC/MIC of gemifloxacin. The τ-related endpoint-log AUC/MIC ratio data sets were fitted by sigmoidal models. For the ABBC and AUGC, the following equation was used:
 |
1 |
For the AUBC and AAC; the following equation was used:
 |
2 |
where x is the log AUC/MIC ratio, Emax and Emin are the maximal and minimal values of the antimicrobial effect, x50 is x corresponding to Emax/2, and dx and s are parameters reflecting width and sigmoidicity, respectively. Equation 1 was also used to described the AUC/MIC relationships of the modified AUGC (AUGCE; see Results).
As for most AUC/MIC ratio ranges, IES were linearly related to the log AUC/MIC ratio; the IE-log AUC/MIC ratio data, except for the IE value corresponding to the minimal AUC/MIC ratio of 11 h, were fitted by the linear equation
 |
3 |
where a and b are parameters. The same equation was also applied to the modified AAC (AACE) and AUBC (AUBCE).
RESULTS
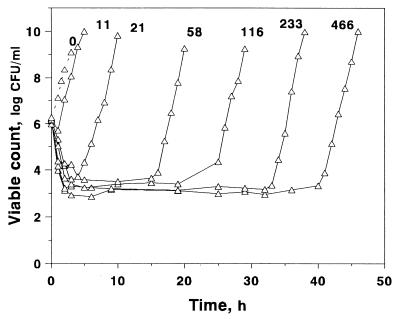
The time-kill curves of S. aureus exposed to different AUC/MIC ratios of gemifloxacin are shown in Fig. 2, which shows that gemifloxacin rapidly killed bacteria during the first 3 to 4 h at AUC/MIC ratios of ≥21 h. At the lowest AUC/MIC ratio of 11 h, a reduction in viable counts was observed only over the first hour. The minimal numbers of surviving bacteria differed substantially when the simulated AUC/MIC ratio increased from 11 to 58 h. Further increases in the AUC/MIC ratio were accompanied only by a small decrease in minimal counts, although the AUC/MIC ratio increase-induced differences in this endpoint were still seen. Unlike the minimal counts, the times to regrowth were much more dependent on the AUC/MIC ratio: the higher the AUC/MIC ratio, the later the regrowth.
FIG. 2.
Killing and regrowth kinetics of S. aureus exposed to different AUC/MIC ratios (indicated in hours above each curve) of gemifloxacin.
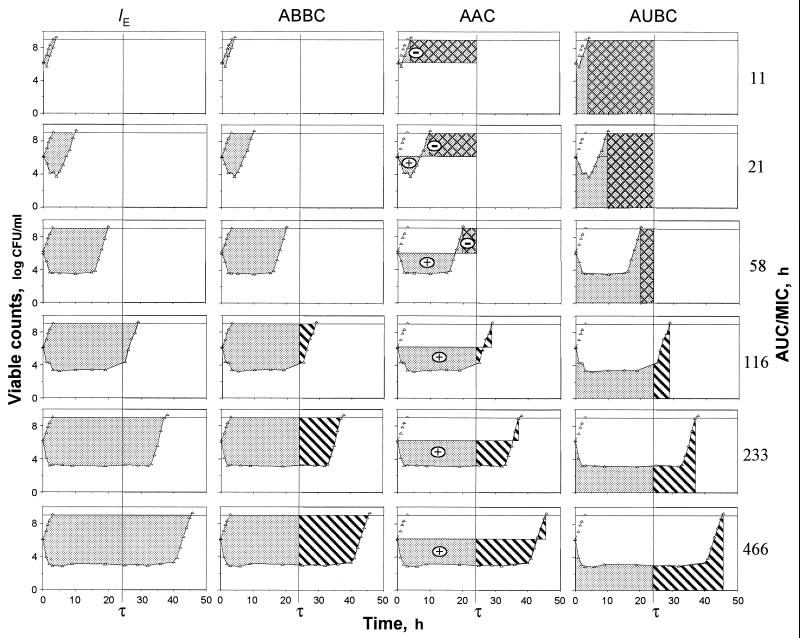
Figure 3 reflects the areas that are exploited by the IE, ABBC, AAC, and AUBC. As seen in Fig. 3, only the areas associated with the IE systematically increase in the AUC/MIC ratio, including potentially therapeutic values of 116 to 466 h. Unlike the IE, the ABBC and AAC increased up to an AUC/MIC ratio of 116 h, with minimal further increases in these endpoints at AUC/MIC ratios of 233 and 466 h. Similarly, the AUBC decreased up to an AUC/MIC ratio of 116 h, with a minimal further decrease at the higher AUC/MIC ratios. As seen in the three bottom rows of Fig. 3, the inability of the ABBC, AAC, and AUBC to adequately reflect the apparently greater effects of gemifloxacin at AUC/MIC ratios of 233 and 466 h is because these τ-related endpoints exploit the truncated areas that ignore substantial portions of the actual effect. Neither the ABBC, the AAC, nor the AUBC considers the persisting effect at times of >τ, and therefore, they underestimate the true antimicrobial effect of a single dose at therapeutic AUC/MIC ratios. This also applies to the AUGC. Moreover, because of their τ-related nature, the AAC and AUBC (but not the ABBC) underestimate the effect at lower AUC/MIC ratios (e.g., the three upper rows of Fig. 3). Indeed, the respective areas cover the zones where the effect has vanished. This results in even more negative values of the AAC and the overestimated AUBC.
FIG. 3.
Areas exploited by the IE, ABBC, AAC, and AUBC ( ) including the zones of vanished effect (
 ) and excluding the zones of persisting effect (
 ).
).
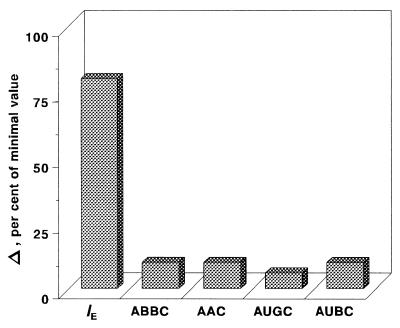
These shortcomings of the τ-related endpoints are reflected in the specific patterns of the AUC/MIC-response curves that contain something like a plateau at therapeutic AUC/MIC ratios (Fig. 4). For example, only a 10% increase in the ABBC and AAC, a 6% increase in the AUGC, and a 10% decrease in the AUBC accompany a 300% increase in the AUC/MIC ratio from 116 to 466 h (Fig. 5). The modest sensitivity of these τ-related endpoints to the AUC/MIC ratio, i.e., the saturation of the effect expressed by the ABBC, AUGC, AAC, and AUBC, is the result of their underestimating the effect. No such saturation is seen with the IE, an endpoint that considers the effect duration-dependent areas rather than the truncated areas. This results in an 80% increase in the IE associated with the same 300% increase in the AUC/MIC ratio (Fig. 5).
FIG. 4.
AUC/MIC ratio-dependent endpoints of the antimicrobial effect of gemifloxacin fitted by equations 1 (ABBC, AUGC, and AUGCE), 2 (AUBC and AAC), and 3 (IE ≡ ABBCE, AACE; and AUBCE). IE ≡ ABBCE, a = −187 and b = 164; ABBC; Emax = 137, x50 = 1.54, and s = 8.38; AUGC, Emax = 65, x50 = 1.55, and s = 8.36; AUGCE; Emax = 59, x50 = 1.25, and s = 7.05; AAC, Emax = 71, Emin = −77, x50 = 1.51, and dx = 0.2; AACE, a = −93 and b = 79; AUBC, Emax = 219, Emin = 76, x50 = 1.53, and dx = 0.2; AUBCE, a = −50 and b = 78. The therapeutic range of AUC/MIC ratios is indicated by the shaded area.
FIG. 5.
AUC/MIC ratio increase-induced changes (Δ) in the integral endpoints over the therapeutic range of AUC/MIC ratios (116 to 466 h).
DISCUSSION
Although each of the five integral endpoints, ABBC, AUGC, AAC, AUBC, and IE, is purported to be a measure of the total antimicrobial effect observed in in vitro pharmacodynamic studies, they reflect it differently. In contrast to IE, which considers the actual effect duration, the τ-related ABBC, AUGC, AAC, and AUBC underestimate the effect when its duration exceeds τ. In addition, the AAC and AUBC underestimate the effect if its duration is less than τ (Fig. 3). As a result, the respective ABBC-, AUGC-, AAC-, and AUBC-log AUC/MIC curves were saturable whereas no saturation was seen in the IE-log AUC/MIC plots (Fig. 4). Although much less pronounced than with τ-related endpoints, a slight saturation may be seen in the IE-log AUC/MIC ratio plots as reported in studies with ciprofloxacin (6) and levofloxacin (8). In this light, the patterns of the IE-log AUC/MIC ratio plots shown in Fig. 4 can be considered pseudolinear.
The observed saturation of the τ-related endpoints, i.e., small, if any, changes in the ABBC, AAC, and AUBC at AUC/MIC ratios of approximately 50 to 1,000 h, was reported previously in a pharmacodynamic study with ciprofloxacin (7) and that of the AUBC at AUC/MIC ratios of 100 to 500 h in a study with gemifloxacin (A. P. MacGowan, A. Janowska, R. S. Hillman, H. A. Holt, and K. E. Bowker, Abstr. 39th Intersci. Conf. Antimicrob. Agents Chemother., abstr. 21, 1999). Moreover, the extent of the saturation of the ABBC-, AAC-, and AUBC-log AUC/MIC ratio curves was less noticeable with the longer τ (7). In fact, with the prolonged observation periods that cover more of the time-kill curves, the limitations of the τ-related endpoints became less dramatic and the τ-related endpoints correlated better with the IE, which is free of these limitations. So, the saturable patterns of the ABBC-, AUGC-, AAC-, and AUBC-log AUC/MIC ratio curves may not be identified with saturation of the antimicrobial effect as such.
It is interesting that if the ABBC and AAC were determined in the same manner as the IE, i.e., by considering the effect duration, both endpoints (ABBCE and AACE) should be much more sensitive to increases in the AUC/MIC ratio (Fig. 4). In this case, the 300% increase in the AUC/MIC ratio would give an 80% increase in the ABBCE (that is identical to the IE) and a 100% increase in the AACE and there would be no more saturation of the effect at the higher AUC/MIC ratios. In addition, at the lower AUC/MIC ratios, the contribution of the negative areas in the AACE is less substantial than the AAC and the respective AACES are less negative than the AACs. A similarly modified AUBC (AUBCE) responds to the AUC/MIC ratio changes better than the AUBC (a 30% increase in the AUBCE versus a 10% decrease in the AUBC). Moreover, unlike the AUBC, which is a reverse measure of the antimicrobial effect, being a direct measure of the effect duration, the AUBCE systematically increases with an increase in the AUC/MIC ratio. As seen in Fig. 4, in contrast to the unmodified endpoints ABBC, AAC, and AUBC, the respective modified endpoints ABBCE (IE), AACE, and AUBCE exhibit plateau-free AUC/MIC ratio relationships at potentially therapeutic AUC/MIC ratios. Unlike the ABBCE, the AACE, and the AUBCE, a modified AUGC (AUGCE) shows a plateau that is similar to that of the AUGC: a 10% increase in the AUGCE appears to be comparable to a 6% increase in the AUGC that is associated with the 300% increase in the AUC/MIC ratio.
In conclusion, this and a previous study (7) suggest that an optimal endpoint of the total antimicrobial effect may not be independent of its duration. In its turn, the duration of the effect is directly related to the definition of the effect. If it is defined as the difference between logarithms of a number of antimicrobial-exposed and -unexposed organisms (7), the initial reduction of viable counts may be attributed to killing that predominates over their growth, whereas regrowth results from bacterial growth that predominates over killing. In this light, all of the events that occur from the moment of initial deflection of the time-kill curve from the control growth curve to the moment of subsequent rapprochement of these curves (at the end of the regrowth phase) may be attributed to the antimicrobial effect. As the IE reflects these events most comprehensively, it may be considered a preferable endpoint of the total antimicrobial effect in an in vitro setting.
ACKNOWLEDGMENT
This study was supported by SmithKline Beecham Pharmaceuticals.
REFERENCES
- 1.Allen A, Bygate E, Teillol-Foo M, Oliver S, Johnson M R, Ward C. Pharmacokinetics and tolerability of gemifloxacin after administration of single oral doses to healthy volunteers. J Antimicrob Chemother. 1999;44(Suppl. A):137. doi: 10.1128/aac.44.6.1604-1608.2000. [DOI] [PMC free article] [PubMed] [Google Scholar]
- 2.Allen A, Bygate E, Teillol-Foo M, Oliver S, Johnson M R, Ward C. Multiple-dose pharmacokinetics and tolerability of gemifloxacin following oral doses to healthy volunteers. J Antimicrob Chemother. 1999;44(Suppl. A):133. [Google Scholar]
- 3.Firsov A A, Chernykh V M, Navashin S M. Quantitative analysis of antimicrobial effect kinetics in an in vitro dynamic model. Antimicrob Agents Chemother. 1991;34:1312–1317. doi: 10.1128/aac.34.7.1312. [DOI] [PMC free article] [PubMed] [Google Scholar]
- 4.Firsov A A, Savarino D, Rubble M, Gilbert D, Manzano B, Medeiros A A, Zinner S H. Predictors of effect of ampicillin-sulbactam against TEM-1 β-lactamase-producing Escherichia coli in an in vitro dynamic model: enzyme activity versus MIC. Antimicrob Agents Chemother. 1996;40:734–738. doi: 10.1128/aac.40.3.734. [DOI] [PMC free article] [PubMed] [Google Scholar]
- 5.Firsov A A, Shevchenko A A, Vostrov S N, Zinner S H. Inter- and intraquinolone predictors of antimicrobial effect in an in-vitro dynamic model: new insight into a widely used concept. Antimicrob Agents Chemother. 1998;42:659–665. doi: 10.1128/aac.42.3.659. [DOI] [PMC free article] [PubMed] [Google Scholar]
- 6.Firsov A A, Vostrov S N, Lubenko I Yu, Kononenko O V, Zinner S H, Cornaglia G. A comparison of the AUC/MIC-response plots of gemifloxacin and ciprofloxacin: critical value of the AUC/MIC ranges simulated in an in vitro dynamic model. J Antimicrob Chemother. 1999;44(Suppl. A):130. [Google Scholar]
- 7.Firsov A A, Vostrov S N, Shevchenko A A, Cornaglia G. Parameters of bacterial killing and regrowth kinetics and antimicrobial effect examined in terms of area under the concentration-time curve relationships: action of ciprofloxacin against Escherichia coli in an in vitro dynamic model. Antimicrob Agents Chemother. 1997;41:1281–1287. doi: 10.1128/aac.41.6.1281. [DOI] [PMC free article] [PubMed] [Google Scholar]
- 8.Firsov A, Zinner S, Vostrov S, Lubenko I. AUC/MIC breakpoints of moxifloxacin (MOX) relative to levofloxacin (LEV) predicted with in vitro dynamic models: single dose versus multiple dose simulations. Clin Microbiol Infect. 2000;6(Suppl.1):199. [Google Scholar]
- 9.MacGowan A P, Bowker K E, Wootton M, Holt H A. Activity of moxifloxacin, administered once a day, against Streptococcus pneumoniae in an in vitro pharmacodynamic model of infection. Antimicrob Agents Chemother. 1999;43:1560–1564. doi: 10.1128/aac.43.7.1560. [DOI] [PMC free article] [PubMed] [Google Scholar]
- 10.Schentag J J. Pharmacokinetic and pharmacodynamic surrogate markers: studies with fluoroquinolones in patients. Am J Health-Syst Pharm. 1999;56(Suppl. 3):S21–S24. doi: 10.1093/ajhp/56.suppl_3.S21. [DOI] [PubMed] [Google Scholar]
- 11.Schentag J J, Nix D E, Forrest A. Pharmacodynamics of the fluoroquinolones. In: Hooper D C, Wolfson J S, editors. Quinolone antimicrobial agents. 2nd ed. Washington, D.C.: American Society for Microbiology; 1993. pp. 259–271. [Google Scholar]
- 12.White C A, Toothaker R. Influence of ampicillin elimination half-life on in-vitro bactericidal effect. J Antimicrob Chemother. 1985;15(Suppl. A):257–260. doi: 10.1093/jac/15.suppl_a.257. [DOI] [PubMed] [Google Scholar]
- 13.Wiedemann B, Jansen A. Antibacterial activity of cefpodoxime proxetil in a pharmacokinetic in-vitro model. J Antimicrob Chemother. 1990;26:71–79. doi: 10.1093/jac/26.1.71. [DOI] [PubMed] [Google Scholar]


