

Abstract
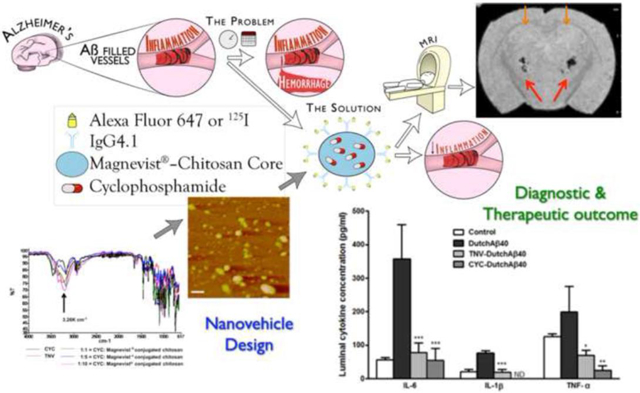
Cerebral amyloid angiopathy (CAA), is characterized by the deposition of amyloid beta (Aβ) proteins within the walls of the cerebral vasculature with subsequent aggressive vascular inflammation leading to recurrent hemorrhagic strokes. The objective of the study was to develop theranostic nanovehicles (TNVs) capable of a) targeting cerebovascular amyloid; b) providing magnetic resonance imaging (MRI) contrast for the early detection of CAA; and c) treating cerebrovascular inflammation resulting from CAA. The TNVs comprised of a polymeric nanocore made from Magnevist® (MRI contrast agent) conjugated chitosan. The nanocore was also loaded with cyclophosphamide (CYC), an immunosuppressant shown to reduce the cerebrovascular inflammation in CAA. Putrescine modified F(ab’)2 fragment of anti-amyloid antibody, IgG4.1, (pF(ab’)24.1) was conjugated to the surface of the nanocore to target cerebrovascular amyloid. The average size of the control chitosan nanoparticles (conjugated with albumin and are devoid of Magnevist®, CYC, and pF(ab’)24.1) was 164 ± 1.2 nm and that of the TNVs was 239 ± 4.1 nm. The zeta potential values of the CCNs and TNVs were 21.6 ± 1.7 mV and 11.9 ± 0.5 mV, respectively. The leakage of Magnevist® from the TNVs was a modest 0.2% over 4 days, and the CYC release from the TNVs followed Higuchi’s model that describe sustained drug release from polymeric matrices. The studies conducted in polarized human microvascular endothelial cell monolayers (hCMEC/D3) in vitro as well as in mice in vivo have demonstrated the ability of TNVs to target cerebrovascular amyloid. In addition, the TNVs provided contrast for imaging cerebrovascular amyloid using MRI and single photon emission computed tomography. Moreover, the TNVs were shown to reduce pro-inflammatory cytokine production by the Aβ challenged blood brain barrier (BBB) endothelium more effectively than the cyclophosphamide alone.
Keywords: Amyloid beta protein, Alzheimer’s disease, cerebrovascular amyloid angiopathy, theranostic nanoparticles, blood brain barrier, cerebrovascular inflammation
Graphical Abstract
1. Introduction
Cerebral amyloid angiopathy (CAA) is characterized by the deposition of amyloid beta (Aβ) proteins within the walls of small to medium-sized blood vessels of the brain and leptomeninges. About 80% of Alzheimer’s disease (AD) patients manifest some degree of CAA [1]. Several studies have demonstrated that AD patients with CAA show worst cognitive test performance during life [2–4]. In addition to causing cerebrovascular inflammation, CAA triggers vascular dysfunction, which is believed to accelerate AD progression [5–7]. If detected in the early stages, the vascular inflammation resulting from CAA can be treated using immunosuppressants such as cyclophosphamide [8]. However, cyclophosphamide has narrow therapeutic index and long-term cyclophosphamide administration via conventional routes is associated with severe side effects.
On the other hand, a definitive diagnosis of CAA requires pathological examination of the affected tissue, which can only be done at autopsy [9]. Computed axial tomography (CT) is commonly used to detect CAA. However, due to low sensitivity of CT, only advanced stages of CAA associated with acute stroke and massive hemorrhages can be detected. Theoretically, magnetic resonance imaging (MRI) has sufficient spatial and contrast resolution to visualize cerebrovascular amyloid deposits. However, visualization of deposits less than 35 μm in diameter will require contrast enhancement [10]. Due to the lack of effective contrast agents, clinicians currently make a probable diagnosis of CAA based on the occurrence of strictly lobar hemorrhages, particularly in the cortico-subcortical area, detected by T2*-weighted MRI [11]. Unfortunately, these hemorrhages occur in the advanced stages of CAA, when the opportunities of intervention are limited [12].
The objective of this study is to develop a theranostic nanovehicle (TNV) capable of permeating the blood brain barrier (BBB) and specifically targeting cerebrovascular amyloid deposits. By providing MRI contrast and delivering immunosuppressants to the amyloid ridden cerebrovascular tissue, the TNVs aid in the early detection of CAA and allows for pre-symptomatic treatment. In addition, using a 21.1 T (900 MHz) magnet, the strongest magnetic field available for MRI [13] the gain in signal-to-noise ratio (SNR) is increased and the biodistribution of administered Gadolinium conjugated TNVs can be visualized with increased sensitivity.
2. Materials and Methods
2.1. Materials.
Medium molecular weight chitosan with a degree of deacetylation around 84%, pentasodium tripolyphosphate (TPP), donor horse serum, heparin, and gentamicin sulphate were purchased from Sigma-Aldrich (St. Louis, USA). Dulbecco’s modified Eagle medium and F-12 nutrient mixture 50:50 (DMEM/F-12), Ultra-pure agarose, 1-ethyl-3-(3 dimethylaminopropyl) carbodiimide (EDC), and N-hydroxyl-succinimide (NHS) were procured from Invitrogen, (Carlsbad, CA). Cyclophosphamide was purchased from MP Biomedicals (Solon, OH). Magnevist® containing 469 mg/ml gadopentetate dimeglumine (Gd-DTPA) was procured from Berlex Laboratories (Montville, New Jersey).
2.2. Animals.
B6SJLF1/J mice were obtained from Harlan Laboratories Inc. (Madison, WI) at 6–8 weeks of age and maintained in a virus-free, light and temperature controlled barrier environment until 12–14 months old. The animals were provided with standard pellets diet and water ad libitum. All procedures with the mice were performed in accordance with the National Institutes of Health Guide for the Care and Use of Laboratory Animals and were approved by the Mayo Institutional Animal Care and Use Committee.
2.3. In vitro BBB models.
For amyloid targeting experiments, human cerebral microvascular endothelial cell (hCMEC/D3) monolayers were cultured on the Transwell® inserts (Costar, Cambridge, MA) coated with 0.01 % rat-tail collagen (type 1), as described previously [14]. The inflammation studies were conducted using bovine brain microvascular endothelial cell (BBMVEC) monolayers grown on Transwell® inserts collated with 0.01 % rat tail collagen and 0.01 % bovine fibronectin [15]. High transendothelial electrical resistance values, which are characteristic of well-formed polarized endothelial monolayers, were ascertained using ‘chopstick’ electrodes attached to a Millicell-ERS meter (Millipore Corp., Bedford, MA). Monolayers with mean transendothelial electrical resistance (TEER) values greater than 170 Ω per cm2 were selected for this study.
2.4. Preparation of TNVs
2.4.1. Modification of F(ab’)2 fragments of IgG4.1.
The F(ab’)2 portion of IgG4.1 was cationized with putrescine (1,4-diaminobutane) using carbodiimide chemistry [16]. The pF(ab’)24.1 thus formed was concentrated in Vivaspin® with 30-kDa molecular weight cut off (MWCO) filter.
2.4.2. Preparation of Magnevist®-conjugated chitosan.
MRI contrast agent, Magnevist®, was attached to chitosan as described previously [17, 18]. The Magnevist® conjugated chitosan solution thus obtained was lyophilized for later use. The presence of amide bond that signifies the successful conjugation of Magnevist® to chitosan was verified by Fourier-transformed infrared spectroscopy (FTIR).
2.4.3. TNV formulation.
Cyclophosphamide was entrapped in the nanocore made from Magnevist®-conjugated chitosan and TPP using ionic gelation method, described previously [15]. Surface of the nanocore was conjugated with pF(ab’)24.1 using carbodiimide chemistry to form the TNVs. The control chitosan nanoparticles (CCN) were prepared in a similar fashion except that they were conjugated with bovine serum albumin (BSA). Albumin binds to a variety of proteins and was shown to act as a carrier protein for Aβ proteins. The BSA conjugated control nanoparticles were employed to demonstrate the specificity of TNV binding to amyloid deposits in comparison to the nonspecific interactions promoted by BSA conjugated control nanoparticles.
2.4.4. Radioiodination of TNVs.
The TNVs and CCNs were labeled with carrier-free Na125I, using the chloramine-T procedure as described previously [19]. Free 125I was separated from the radiolabeled TNVs by dialysis against 0.01 M phosphate-buffered saline at pH 7.4.
2.5. TNV characterization
2.5.1. Particle size and zeta potential of TNVs.
TNVs morphology was assessed using a multimode scanning probe atomic force microscope (AFM, Veeco Metrology Inc., Plainview, NY). The mean hydrodynamic diameter of TNVs dispersed in distilled water was determined using photon correlation spectroscopy (Particle sizer; Brookhaven Instruments, NY, US), whereas the zeta potential was determined using laser doppler anemometry (Zeta Potential Analyzer, Brookhaven Instruments, NY, US).
2.5.2. Encapsulation and release of cyclophosphamide from TNVs.
To quantify the amount of cyclophosphamide incorporated in TNVs, physical mixtures of cyclophosphamide and lyophilized blank nanoparticles made from Magnevist®-conjugated chitosan were prepared in the ratio of 1:1, 1:4 and 1:9, respectively. The IR spectra (500 – 4000 cm−1) for each component, the physical mixtures, and the TNVs were acquired using FTIR spectrophotometer (Perkin Elmer Life and Analytical Sciences, Connecticut). Cyclophosphamide absorbance peaks that are distinct from the blank nanoparticles were selected, and a standard curve of the peak height versus cyclophosphamide percentage was constructed. The percentage of unknown amount of cyclophosphamide in the TNVs was determined from the standard curve.
To evaluate cyclophosphamide release from the TNVs, 30 mg of lyophilized TNVs were re-suspended in 3 ml distilled water and placed in a dialysis bag (MWCO = 12.5 kDa), which was then immersed completely in a trough containing 50 ml PBS maintained at 37 °C. The trough contents were stirred constantly at 150 rpm, sampled at predetermined time intervals (0, 0.25, 0.5, 0.75, 1, 2, 3, 6, 14, 18 hrs), and was replaced with the same volume of fresh PBS. The amount of cyclophosphamide in the collected samples was determined using the high performance liquid chromatography (HPLC) method reported previously [20]. Gadolinium (Gd) content in TNVs was determined as per the previously published Arsenazo III colorimetric method [21, 22].
2.6. Ability of TNVs to bind to Aβ fibrils.
ELISA and quartz crystal microbalance-dissipation (QCM-D) methods were used to investigate the ability of TNVs to bind to pre-formed Aβ40 fibrils. To form Aβ fibrils, 1 mg/ml monomeric Aβ40 solution was prepared, filtered through 0.22 μm filter, and the filtrate was agitated at 250 rpm on orbital shaker for 48 hrs at 37 °C. The fibrils thus obtained were sonicated for 60 seconds and diluted with distilled water to obtain 0.5 mg/ml Aβ fibril suspensions.
A high protein binding 96-well plate was coated with freshly formed Aβ fibrils and then ELISA was conducted to evaluate the binding TNVs or CCNs, as described previously [23]. The ability of TNVs to bind to Aβ fibrils adsorbed to the gold/quartz crystal surface was determined by QCM-D method described as follows [24]. The gold/quartz crystal surface was equilibrated with distilled water and then Aβ40 fibril suspension (0.5 mg/ml) was passed over the crystal at a flow rate of 100 μl/min. Binding of Aβ40 fibrils to the gold surface was monitored by recording the frequency changes in the sensors and the flow of Aβ40 fibril suspension was continued until the frequency plateaued. Distilled water was again passed over the crystal for 10 min to remove the loosely bound Aβ40 fibrils. Then TNV or CCN suspension (10 mg/ml) was passed over the Aβ40 fibril bed adsorbed to the crystal surface. The mass of Aβ40 fibrils adsorbed on the quartz crystal or TNVs bound to the pre-adsorbed Aβ40 fibrils on the crystal was calculated as follows:
| (1) |
where C is the mass sensitivity constant (C = 17.7 ng cm−2), n is the harmonic overtones number and ΔF is the change in frequency.
2.6.4. The uptake of TNVs by BBB endothelial cells in vitro.
The in vitro CAA model was prepared by pre-incubating the hCMEC/D3 monolayer with 25 μg/ml fluorescein isothiocyanate (FITC)-DutchAβ40 protein for 30 min. The FITC-DutchAβ40 was aspirated, 30 μg/ml Alexa Fluor 647 (AF647)-TNVs were added and incubated for 60 min at 5% CO2 and 37°C with minimal shaking. The TNVs were removed, the monolayer was washed with Hank’s balanced salt solution (HBSS), and fixed using 4% paraformaldehyde. The Transwells® were stained with DAPI, mounted, and imaged with an Axiovert 100M microscope equipped with Zeiss LSM 510 laser confocal microscope (DAPI, Ex/Em: 350/470 nm; FITC, Ex/Em: 488/535 nm; AF647, Ex/Em: 652/668). The extents of intracellular accumulation of AF647-IgG4.1 and AF647-TNVs were determined by FACSCalibur (Becton Dickinson) with excitation and emission wavelengths set at 652 and 668 nm, respectively.
2.7. In vivo Studies
2.7.1. Plasma pharmacokinetics and tissue distribution of 125I-TNVs.
For the in vivo studies 125I-TNVs were prepared by radioiodinating the pF(ab)24.1 using chloramine-T reaction. The femoral vein and artery of each mouse were catheterized under general anesthesia (isoflurane = 1.5% and oxygen = 4 l/min). A bolus IV dose of 125I-TNVs (100 μCi) was administered to a group of three mice previously injected with 150 μl PBS. The treatment group of mice received a pre-injection of 150 μl (3.3 mg/ml) of DutchAβ40, followed by an IV bolus dose of 125I-TNVs (100 μCi) after 30 min. Blood was sampled (20 μl) from the femoral artery of each mouse at various time intervals (1, 5, 10, 15, 30, 45 and 60 min). Each blood sample was diluted to a volume of 100 μl with normal saline, the plasma was separated by centrifugation and analyzed for 125I activity using a two-channel gamma counter (Cobra II; Amersham Biosciences Inc., Piscataway, NJ). At the end of the experiment, the animals were transcardially perfused with excess saline. Various peripheral organs such as heart, liver, kidney, spleen as well as the brain of each animal were removed. The brain was then dissected into various anatomical regions (cortex, caudate putamen, hippocampus, thalamus, brain stem, and cerebellum) and were all analyzed for 125I radioactivity. Pharmacokinetic modeling was conducted using 1 compartmental analysis with uniform weighting (WinNonlin®, Version 5.2, Mountain View, CA) as defined by the equation:
| (2) |
Where Cp is the plasma concentration at time = t; Cp0 is the plasma concentration at time = 0; kel is the elimination rate constant; and t = time. Using these parameters, the area under the curve (AUC), clearance (CL) and volume of distribution (Vd) were determined. Student’s t-test was performed to test statistical significance of the pharmacokinetic parameters. Whereas, comparisons of the biodistribution were made using two-way analysis of variance (ANOVA) with a Tukey post-test.
2.7.2. Dynamic single photon emission computed tomography coupled computed tomography (SPECT/CT) imaging.
To evaluate the brain distribution of 125I-TNVs, a 500 μCi dose of 125I-CCNs or 125I-TNVs was administered to mice intravenously under general anesthesia (isoflurane = 1.5% and oxygen = 4 l/min). Then the cerebrovascular uptake of either 125I-CCNs or 125I-TNVs was monitored by dynamic SPECT imaging with continuous image acquisitions every minute for 10 min.
2.8. Magnetic resonance imaging
2.8.1. Preparation of TNV phantoms.
Phantoms were prepared according to the procedures described previously [25]. Briefly, 10 mg/ml of TNV stock suspension was prepared in distilled water, which was further diluted with distilled water to obtain 1:1, 1:5, 1:10, 1:30 and 1:100 dilutions. Each dilution was then mixed with 1% agarose at a ratio of 1:1. The TNV-agarose mixtures containing gadolinium concentration of 2000, 200, 70, 20, 7 μM were carefully injected into microcapillary tubes (Wilmad-Labglass Co, Vineland NJ) without forming air bubbles. Each capillary tube containing 900 μl of TNV-agarose mixture was allowed to solidify on ice. The control phantoms were prepared by replacing TNVs with distilled water and were simultaneously imaged with the TNV phantoms.
2.8.2. MRI relaxation of phantoms.
All MR images were acquired using a 21.1 T vertical magnet with a bore diameter of 105-mm [13]. The magnet was equipped with a Bruker Avance III spectrometer console and acquisition was performed with ParaVision 5.1 software (Biospin Corp., Billerica, MA) and a 64-mm inner diameter high performance gradient (Resonance Research Inc, MA). All samples were imaged in unison within a 10-mm NMR tube using a 10-mm birdcage coil tuned to 900 MHz. Measurements were performed to quantify 1/T1 relaxation rate (R1) and 1/T2 relaxation rate (R2) for each sample. Common acquisition parameters for all sequences included: Matrix = 128 × 128, FOV = 8.8 × 8.8 mm, slice thickness = 1.0 mm, and 2 averages. For R1 and R2 measurements, a single slice 2D spin-echo (SE) sequence was used with nine incrementing repetition times (TR = 25–15000 ms) and 16 incrementing echo times (TE = 8–124 ms) for each respective contrast weighting. Magnitude images were analyzed using regions of interest (ROIs) drawn to cover each individual microcapillary tube as well as a noise ROI for baseline corrections. The ROI signal intensities were fitted by non-linear regression using the Levenburg-Marquadt algorithm in SigmaPlot 7.101 (SPSS Inc, Chicago, IL). For R2 measurements, a single exponential decay function with baseline adjustment was employed while a single exponential growth with baseline adjustment was applied for R1.
2.8.3. MR imaging of ex vivo mouse brain.
Mice were administered with an IV bolus dose of PBS (150 μl) or 0.5 mg of DutchAβ40 in 150 μl of PBS under general anesthesia (isoflurane 1.5% and oxygen 4 l/min). After 30 min, 200 μl of TNV suspension containing 2 mM gadolinium was injected. The mice were deeply anesthetized during ensuing time period. At the end of each experiment, the animals were transcardially perfused with 20 ml of PBS followed by 10 ml of 4% paraformaldehyde (PFA). The mice brains were excised and stored in 4% paraformaldehyde prior to MRI. The brains were placed individually in 10-mm NMR tubes containing fluorinert (3M Center, St. Paul, MN), a perfluorinated liquid with no 1H MRI signal. The brains were imaged in unison with a 35-mm RF birdcage coil resonating at 900 MHz. A 3D GRE was used to generate high resolution T2* weighted images. Echo (TE) and repetition (TR) times were set to 4 and 50 ms respectively and acquired with a 100-μm isotropic resolution.
2.9. Cytokines inhibition studies.
Luminal or abluminal region of BBMVE cell monolayer was either challenged with DutchAβ40 alone, in the presence of TNVs, or with cyclophosphamide (TNV = 1.74 mg/ml, DutchAβ40 = 25 μg/ml, cyclophosphamide = 3.05 mg/ml) at 37 °C for 24 hr. At the end of 24 hour treatment, the luminal or abluminal solution of the control or the treated Transwells® was assayed for interleukin-6 (IL-6), interleukin-1beta (IL-1β) and tumor necrosis factor-alpha (TNF-α) using cytokine enzyme linked immunosorbent assay (ELISA) kit (Thermo Scientific, Rockford, IL). The cytokine levels secreted by the control BBMVE cell monolayer incubated with HBSS were used as the baseline values.
3. Results
3.1. TNV characterization.
The FTIR spectrum of Magnevist®-conjugated chitosan (MCC) exhibited prominent absorbance band around 3260 cm−1 (Fig. 1A), most likely from the free hydroxyl groups on chitosan, and an absorbance peak at 1599 cm−1 that may signify amide linkage between chitosan and Magnevist® (Fig. 1B). The AFM micrograph demonstrated that the TNVs made from the MCC are roughly spherical particles and a majority of them are smaller than 250 nm (Fig. 2A). The mean hydrodynamic diameter of TNVs (239 ± 4.1 nm) determined by photon correlation spectroscopy was 45% larger than that of CCNs (164 ± 1.2 nm) made from chitosan. However, the CCNs showed mean zeta potential value almost twice as much as the TNVs (Table 1).
Figure 1.
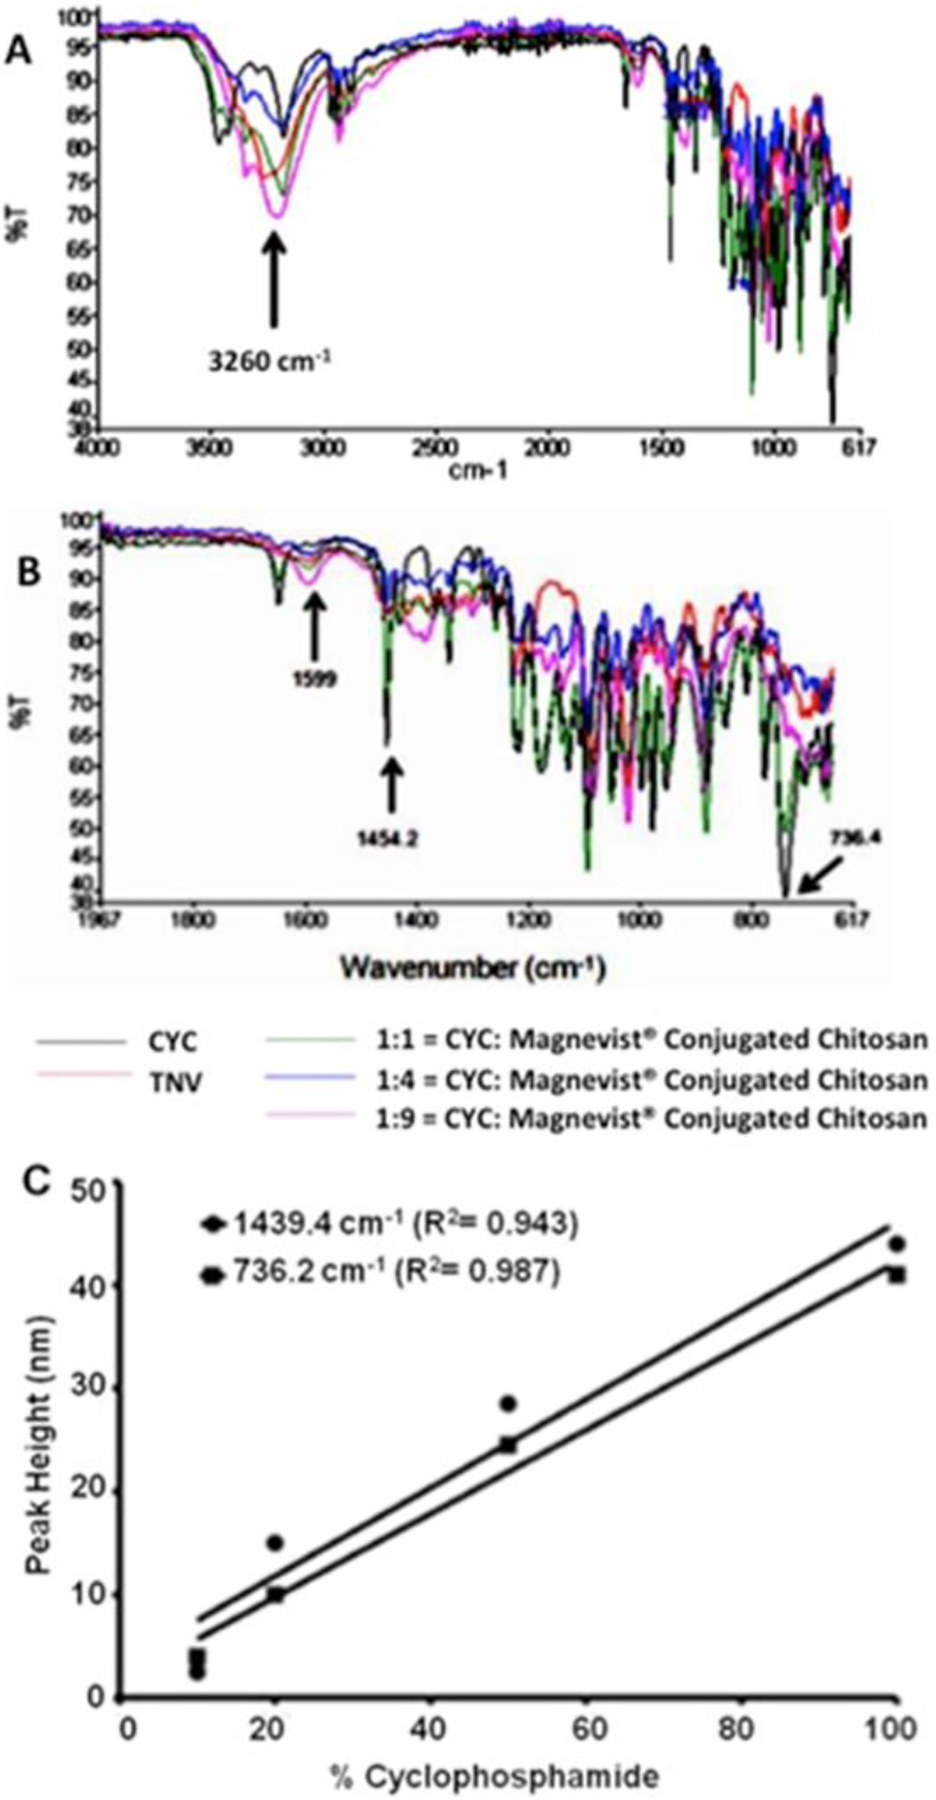
(A) Fourier transform infrared (FTIR) spectra showing the absorption peaks of cyclophosphamide (CYC); theranostic nanovehicle (TNV); 1:1 = CYC: Magnevist®-conjugated chitosan (MCC); 1:4 = CYC: MCC; 1:9 = CYC: MCC. (A) FTIR spectra between the wave numbers 617–4000 cm−1. The absorbance peak (shown by an arrow) at 3.26 K cm−1 is most likely due to hydroxyl groups on chitosan. (B) FTIR spectra of CYC, TNV, and various physical mixtures of cyclophosphamide and MCC between wavenumber 1967 and 617 cm−1. The peaks at wavenumbers at 1439.4 and 736.2 cm−1 are unique to cyclophosphamide. (C) Standard curve of absorption peak heights, measured at 1439.4 or 736.2 cm−1, and cyclophosphamide content (%) in TNV and other physical mixtures of cyclophosphamide and Magnevist®-conjugated chitosan.
Figure 2.
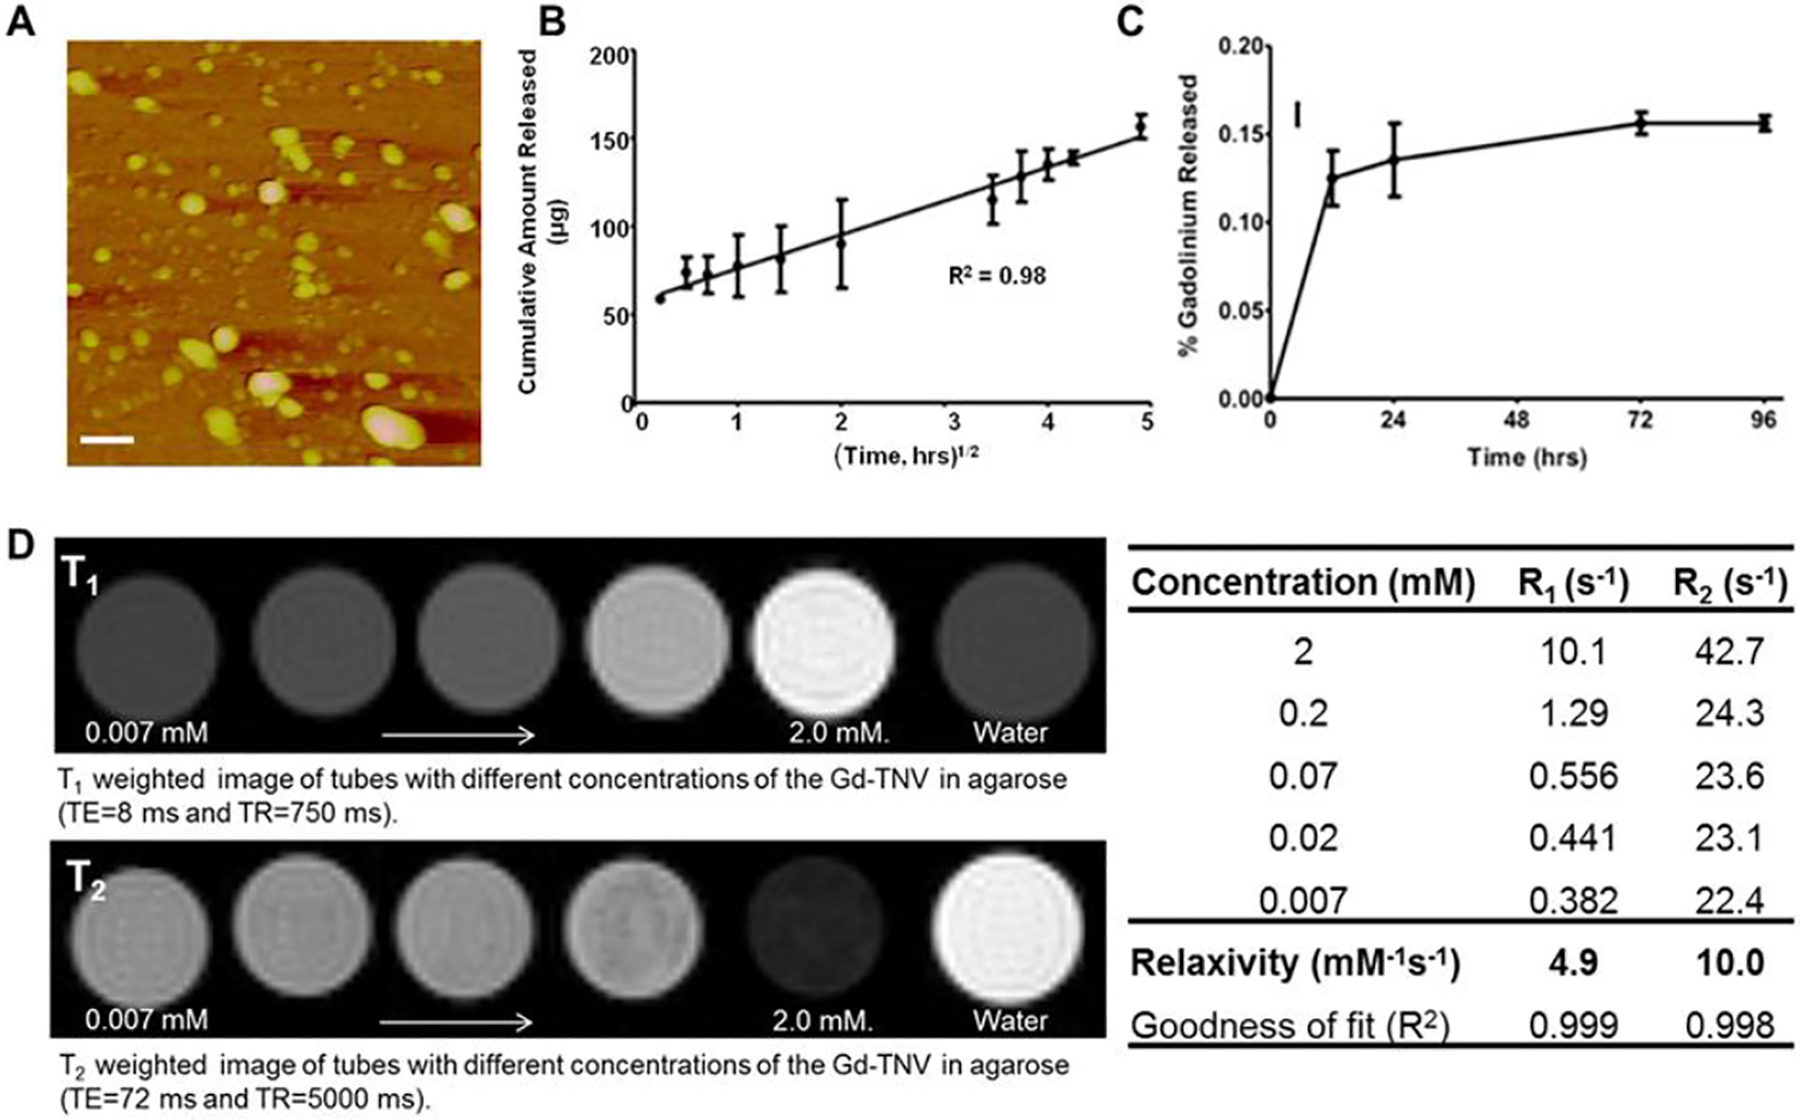
(A) Atomic force micrograph of theranostic nanovehicles (TNV); scale bar represents 250 nm. (B) Cyclophosphamide release profile from TNVs in phosphate buffer solution (pH 7.4) at 37 °C; (C) Leakage of gadolinium from TNVs in four days. (D) Images showing the increase in T1 and T2 contrast with increasing Gd concentration on the TNV; the corresponding relaxation times and the relaxivities were shown in the table.
Table 1.
Physical characteristics and loading efficiencies of control chitosan nanoparticles (CCNs) and theranostic nanovehicles (TNVs).
| Formulation | Size (nm) | Zeta Potential (mV) | Cyclophosphamide (w/w, %) | Gadolinium (w/w, %) |
|---|---|---|---|---|
| CCN | 164 ± 1.2 | 21.6 ± 1.7 | — | — |
| TNV | 239 ± 4.1 | 11.9 ± 0.5 | 21.7 ± 1.3 | 60.67 ± 9.2 |
— = contains no cyclophosphamide (CYC) or Magnevist®. Data shown are mean ± SEM (n=3).
3.1.1. Gadolinium and cyclophosphamide content in TNVs.
The loading efficiency of cyclophosphamide in TNVs was predicted using FTIR spectroscopy. The FTIR peak intensities at 1454 or 736 cm−1 are unique to cyclophosphamide in the MCC and cyclophosphamide mixtures shown in Fig. 1B. These intensities were plotted against the known cyclophosphamide concentrations in MCC matrix (Fig. 1C). From this standard curve, the unknown cyclophosphamide concentration in the TNVs was predicted to be 21.7 ± 1.31 % w/w (Table 1), which coincided with that obtained from mass balance studies. The gadolinium content in the TNVs was determined as 60.67 ± 9.2 % using Arsenazo III assay (Table 1).
3.1.2. In vitro release of cyclophosphamide.
Release of cyclophosphamide from TNVs over a period of 24 hours was linear with √time, and exhibited adequate fit to Higuchi’s model with r2 = 0.98 (Fig. 2B). However, the leakage of gadolinium from the TNVs was as low as 0.1% in the first 12 hours and was insignificant (<0.02%) for the following four days (Fig. 2C).
3.1.3. MRI relaxometry of TNVs.
The TNVs were embedded in tissue mimicking agarose and the MRI contrast generated by these phantoms was evaluated as a function of gadolinium concentration (Fig. 2D). As the amount of gadolinium increased in the phantoms, T1 and T2 contrast increased by the respective shortening of T1 and T2 relaxation times. Utilizing the inverse relaxations times (R1 = 1/T1 and R2 = 1/T2) as a function of concentration, relaxivities r1 and r2 were calculated and estimated to be 4.9 and 10.0 mM−1s−1, respectively at 900 MHz.
3.2. Ability of TNVs to bind to amyloid deposits.
The ability of CCNs or TNVs to detect and bind to Aβ fibrils was determined by two approaches, ELISA and QCM-D methods. The ELISA data showed stronger TNV binding to Aβ40 fibril coated-substrate than that of CCNs (Fig. 3A). However, p(Fab2)4.1 showed slightly stronger binding to Aβ40 fibrils (Fig. 3A) than either TNV or CCN. There was no statistically significant difference between the binding of freshly prepared TNVs or lyophilized TNVs (TNVlyo) to Aβ40 fibrils (Fig. 3A). According to the QCM-D method, the adsorption of TNVs to the Aβ40 fibril-bed deposited on the gold-coated quartz crystal surface (Fig. 3C) was estimated to be 3.1 ± 0.2 μg/cm−2 (Fig. 3B). Conversely, the mass of CCNs (Fig. 3D) adsorbed to the Aβ40 fibril-bed was 2.5 ± 0.4 μg/cm−2 (Fig. 3B).
Figure 3.
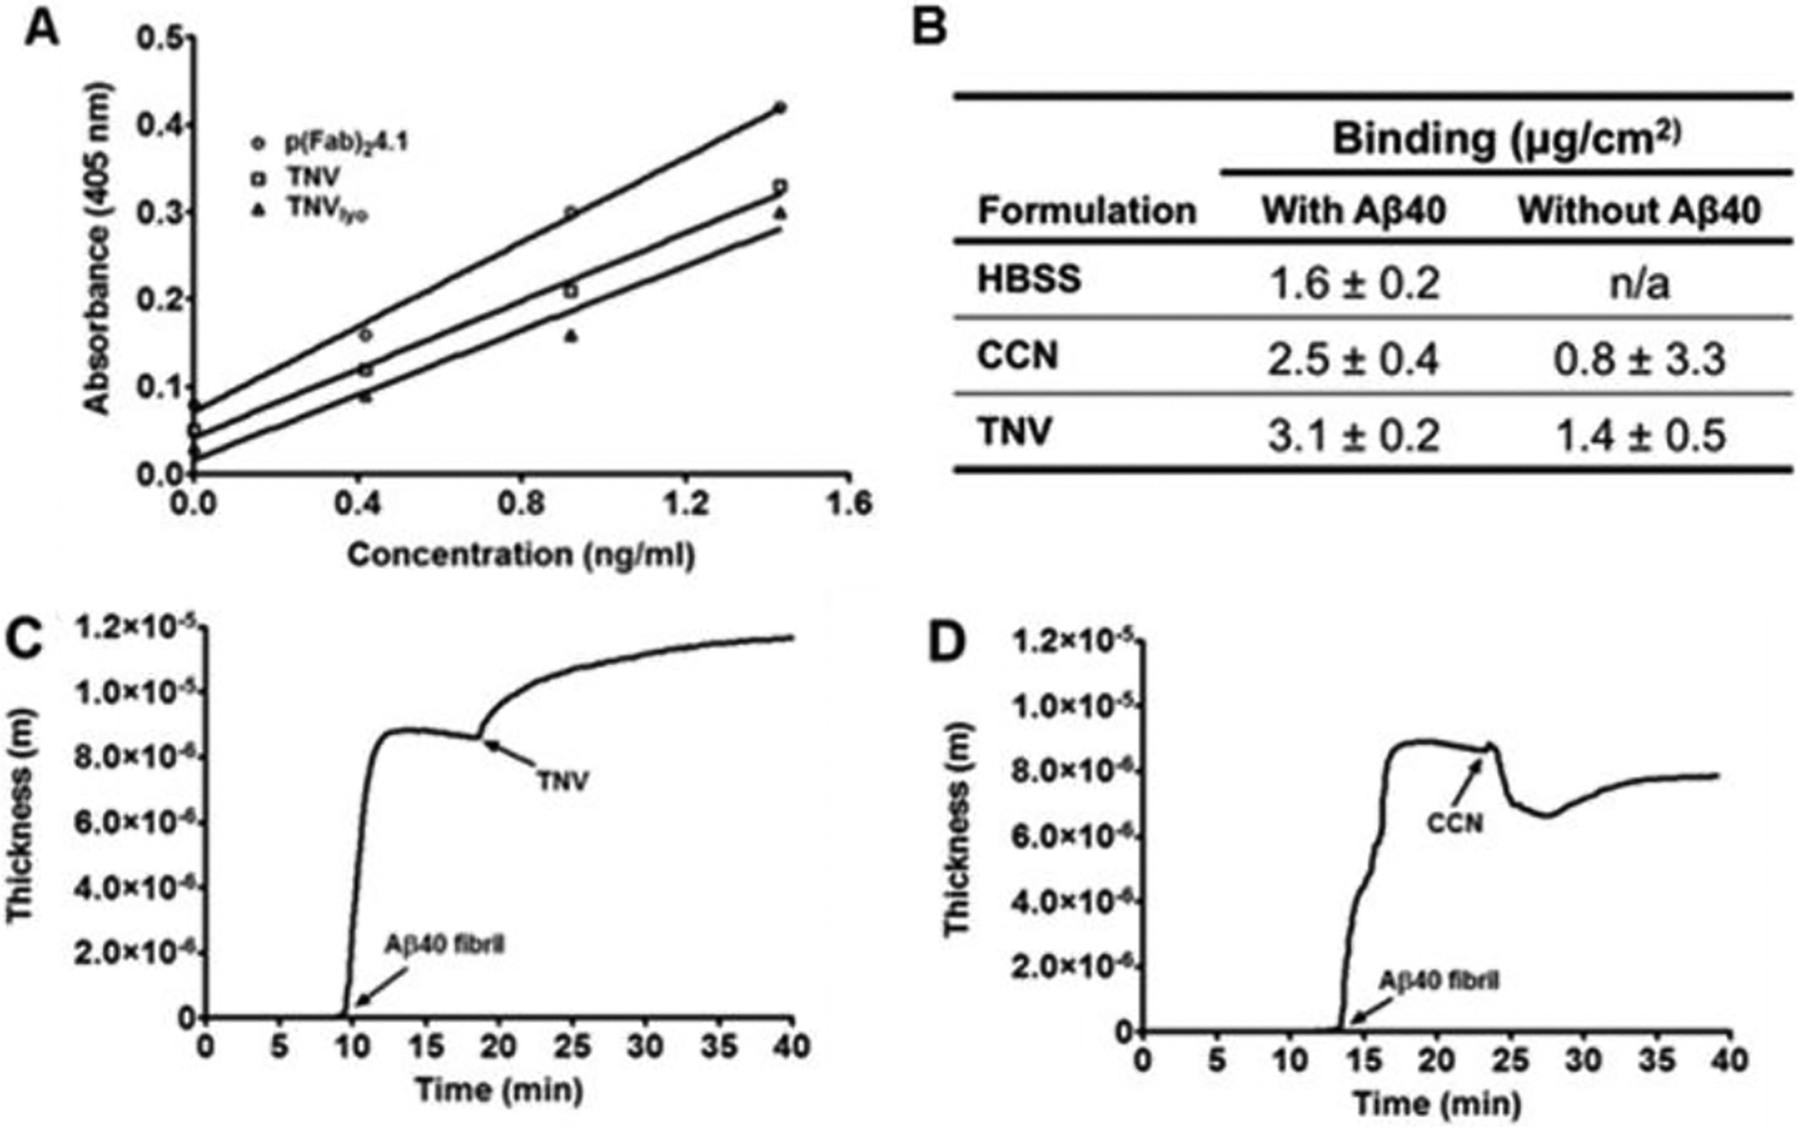
Binding of control chitosan nanoparticles (CCNs) and theranostic nanovehicles (TNV) to Aβ40 fibrils determined by ELISA and quartz crystal microbalance-dissipation QCM-D methods. (A) Binding of pF(ab’)24.1, freshly prepared TNVs, and lyophilized TNVs (TNVlyo) to human Aβ40 fibrils; (B) Extent of TNV binding to Aβ40 fibrils adsorbed on the QCM-D crystal sensor. QCM-D binding profiles of (C) TNV and (D) CCN to Aβ40 fibrils. Arrows indicate the time of injection of various samples
3.3. The uptake of TNVs in the in vitro BBB model.
The uptake of AF647-TNVs by the hCMEC/D3 monolayers pretreated with FITC-DutchAβ40, a vasculotropic Aβ mutant [15], was first examined using laser confocal microscopy. The results showed uptake of AF647-TNVs in the hCMEC/D3 monolayer (Fig. 4A) and the colocalization of TNVs (red fluorescence) with the green fluorescence of FITC-DutchAβ40. We further quantified the amount of intracellular AF647 fluorescence using flow cytometry as a measure of AF647-TNV uptake by the hCMEC/D3 cells. The accumulation of AF647-TNVs in DutchAβ40 pre-treated hCMEC/D3 cells was 30-fold greater than the accumulation of AF647-IgG4.1 antibody (Fig. 4B).
Figure 4.
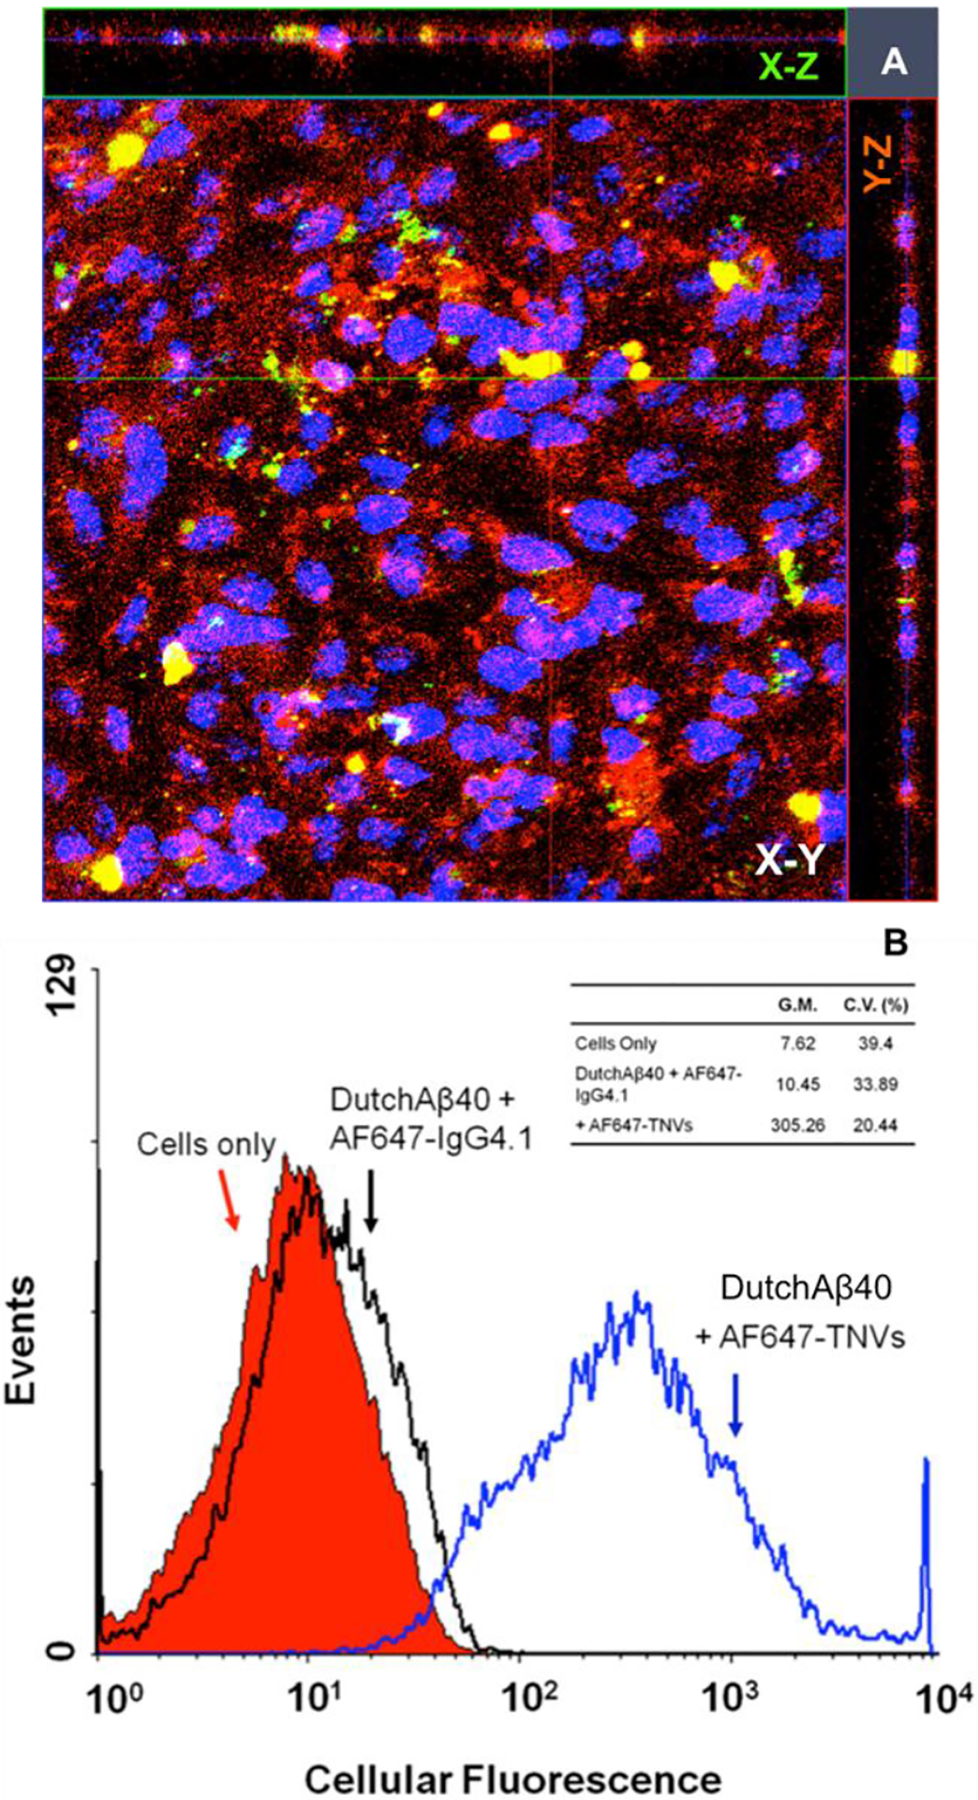
(A) The uptake of Alexa Fluor 647 labeled TNVs (AF647-TNVs) by fluorescein labeled DutchAβ40 (FITC-DutchAβ40) treated human microvascular endothelial cell (hCMEC/D3) monolayers imaged using laser confocal microscopy. (B) Flow cytometry of hCMEC/D3 monolayers treated with HBSS (control); DutchAβ40 followed by AF647 labeled IgG4.1 (AF647-IgG4.1); or AF647-TNVs with DutchAβ40 pretreatment. G.M. is geometric mean whereas C.V. is the coefficient of variance.
3.4. Biodistribution of TNVs.
Following intravenous bolus administration, the plasma pharmacokinetics of 125I-TNVs in PBS (control) and DutchAβ40 pre-injected WT mice exhibited a monoexponential disposition (Fig. 5A). Initial plasma concentration (Cp0) and AUC of 125I-TNVs in DutchAβ40 pre-injected mice were significantly lower (p <0.001) than that in the control mice injected with PBS (Table 2). In addition, no significant difference in the 125I-TNVs accumulation was observed in the heart, liver, kidney and spleen of control versus DutchAβ40 pre-injected mice (Table 3). To further investigate the ability of TNVs to target Aβ protein accumulated in the cerebral vasculature, the mice were pre-injected with vasculotropic DutchAβ40 prior to the 125I-TNVs administration. The 125I-TNV accumulation in various brain regions of DutchAβ40 pre-injected mice was found to be 2- to 4-fold greater than that in the control mice pre-injected with PBS (Fig. 5B). Moreover, dynamic SPECT/CT imaging demonstrated two-fold greater cerebrovascular accumulation of 125I-TNVs than that of 125I-CCNs (Fig. 5C).
Figure 5.
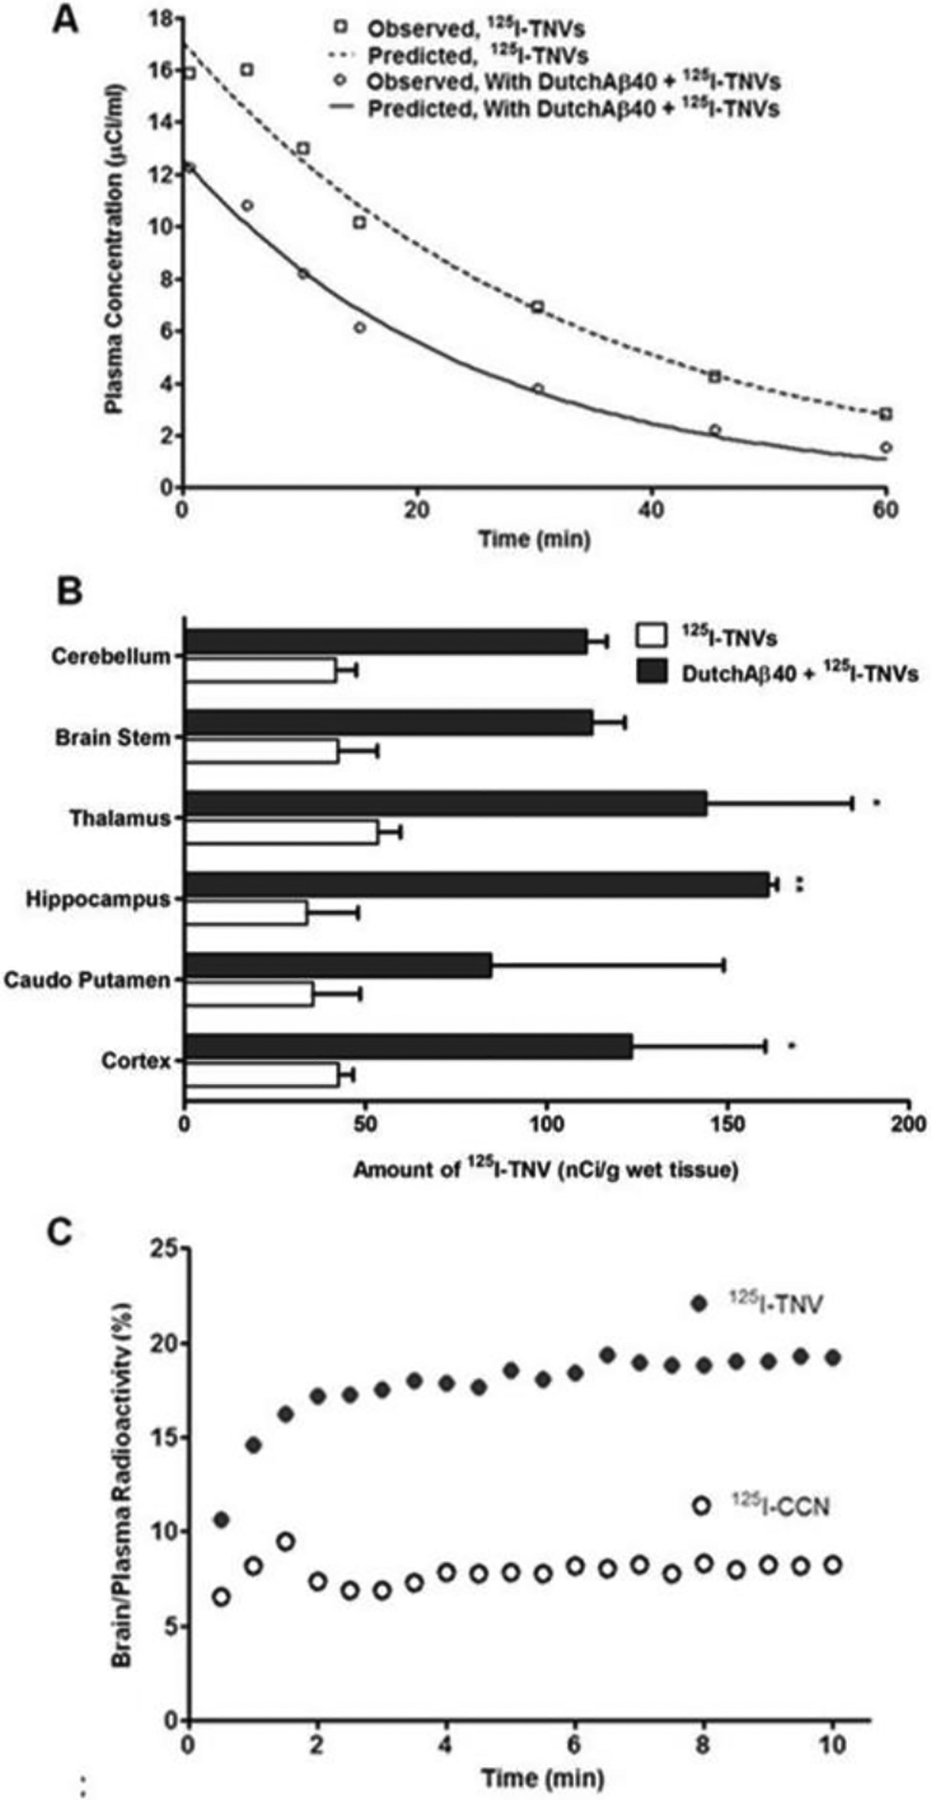
(A) Plasma pharmacokinetics of radioiodinated theranostic nanovehicles (125I-TNV) in control and DutchAβ40 pre-injected mice. (B) Accumulation of 125I-TNVs in the various brain regions in control and DutchAβ40 pre-injected mice. (C) Uptake of 125I-TNV or control chitosan nanoparticles (125I-CCN) by cerebrovascular endothelium as determined by dynamic single photon emission computed tomography (SPECT/CT).
Table 2.
Plasma pharmacokinetic parameters of 125I-theranostic nanovehicles (125I-TNV) in control and DutchAβ40 pre-injected mice.
| Parameter | 125I-TNVs | ||
|---|---|---|---|
| With DutchAβ40 | Without DutchAβ40 | p | |
| AUC (min × μCi/ml) | 303.2 ± 29.91 | 567.8 ± 5.16 | *** |
| K10 (min−1) | 0.045 ± 0.01 | 0.031 ± 0.002 | ns |
| Cl (ml/min/μCi) | 0.34 ± 0.036 | 0.18 ± 0.002 | * |
| Vd (ml/μCi) | 7.48 ± 0.30 | 5.90 ± 0.53 | ns |
Data presented as mean ± standard error,
p<0.05,
p<0.001.
ns = not significant
Table 3.
Biodistribution of 125I-theranostic nanovehicles (125I-TNV) in control and DutchAβ40 preinjected adult mice
| Organ | 125I-TNVs | ||
|---|---|---|---|
| With DutchAβ40 (nCi/g wet tissue) | Without DutchAβ40 (nCi/g wet tissue) | p | |
| Heart | 674.1 ± 498.5 | 1350 ± 202.5 | N.S. |
| Liver | 9696 ± 4869 | 12515 ±4957 | N.S. |
| Kidney | 10173 ± 6209 | 19685 ± 5316 | N.S. |
| Spleen | 7699 ± 4586 | 5285 ± 1986 | N.S. |
Data are mean ± standard error (n = 3); ns = not significant
3.5. Detection of cerebral DutchAβ40 by MRI using TNVs as contrast agents.
High-resolution GRE images displayed in the coronal orientation clearly demonstrated the accumulation of TNVs in ex vivo mouse brain (Fig. 6). Highest contrast enhancement manifested as signal voids appeared in the cortex as well as in the hippocampal regions. In addition, hypointensity in larger arteries indicated with solid arrows was found in TNV injected brains but not in the control specimen. Dotted arrows indicate the structural delineation of sub-regions within the highly vascularized hippocampus of DutchAβ40 treated brains.
Figure 6.
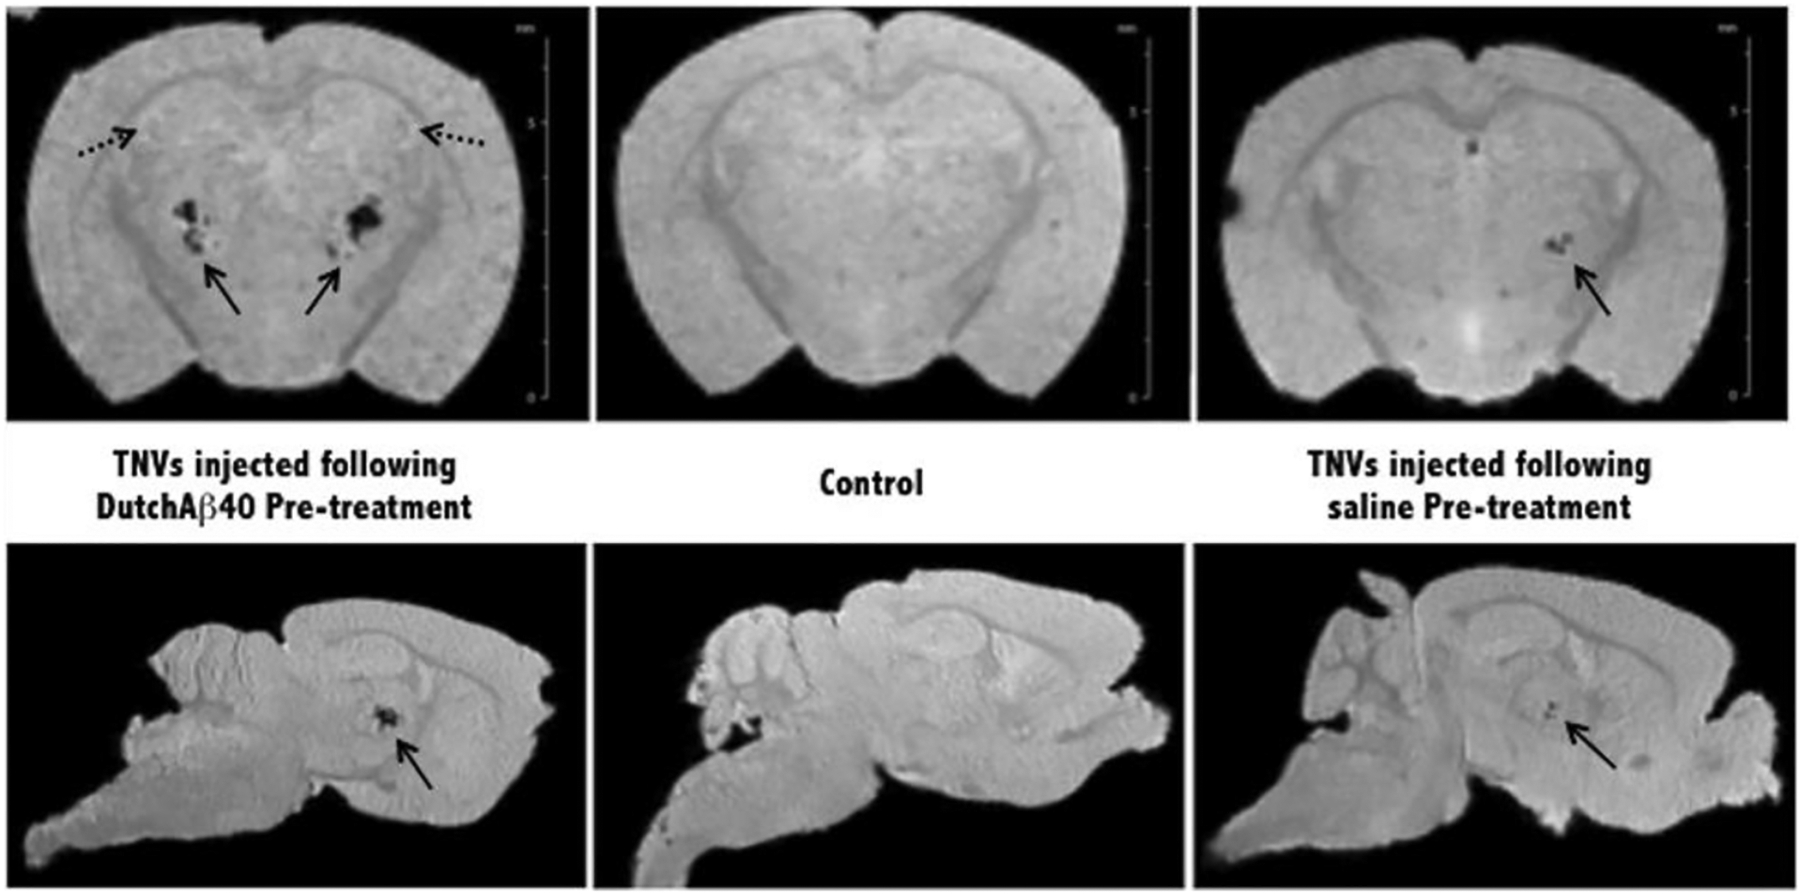
Ex vivo magnetic resonance (MR) images of PBS and DutchAβ40 pre-treated mice injected with theranostic nanovehicles (TNV). Control mouse received neither pre-treatment nor TNV injection and no evidence of specific contrast was found in the control specimen. Bold arrows indicate hypointense larger arteries in mice injected with TNVs. Dotted arrows indicate representative hyperintense regions found in the highly vascularized hippocampus and cortex.
3.6. TNVs ability to inhibit pro-inflammatory cytokines.
TNVs inhibit pro-inflammatory cytokine release triggered by DutchAβ40 exposure in BBMVEC monolayers. When treated with vasculotropic DutchAβ40 on the luminal side, the monolayer showed an enhanced release of pro-inflammatory cytokines such as interleukin-6 (IL-6), interleukin-1beta (IL-1β) and tumor necrosis factor-alpha (TNF-α). However, when the TNVs or cyclophosphamide alone (at a concentration 10-fold greater than that found in TNVs) were added to the luminal side along with DutchAβ40 protein, a significant decrease in the secretion of these cytokines was observed (Fig. 7).
Figure 7.
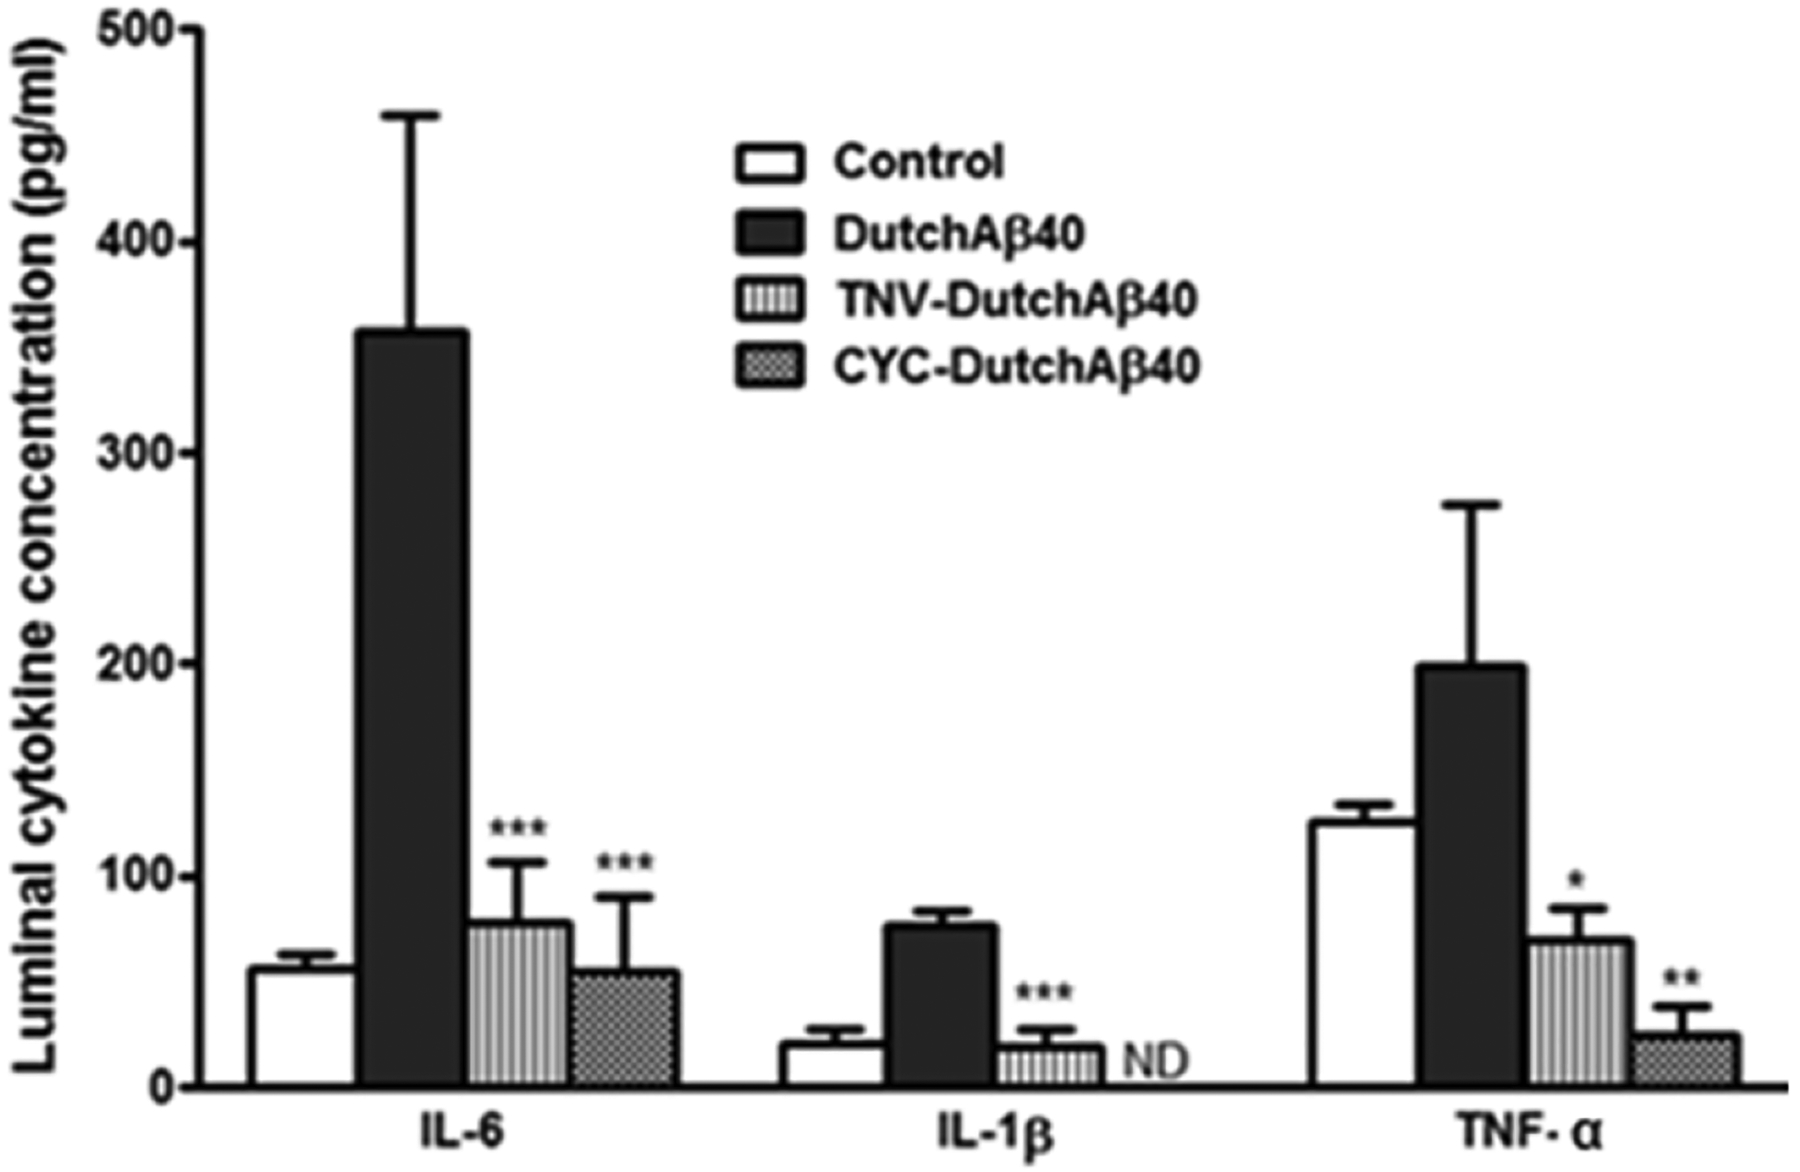
Luminal secretions of interleukin-6 (IL-6), interleukin-1beta (IL-1β) and tumor necrosis factor-alpha (TNF-α) by control BBMVE cell monolayers in control and when challenged with DutchAβ40; theranostic nanovehicle (TNV) + DutchAβ40; or cyclophoshamide (CYC) + DutchAβ40 (TNV = 1.74 mg/ml, DutchAβ40 = 25 μg/ml, cyclophosphamide = 3.05 mg/ml). Data is expressed as mean ± S.D (n = 3) and analyzed using one-way ANOVA followed by Turkey’s multiple comparison test. ***p < 0.001, IL-6 secretion by DutchAβ40 challenged versus TNV + DutchAβ40 treated or CYC + DutchAβ40 treated BBMVE cells; ***p < 0.001, IL-1β secretion by DutchAβ40 challenged versus TNV + DutchAβ40 treated BBMVE cells; *p < 0.05, TNF-α secretion by DutchAβ40 challenged versus TNV + DutchAβ40 treated BBMVE cells. **p < 0.01, TNF-α secretion by DutchAβ40 challenged versus CYC + DutchAβ40 treated BBMVE cells; ND = not detected.
4. Discussion
Currently there is no diagnosis or treatment for CAA [22]. The definitive CAA diagnosis is reached post mortem by histopathological examination of the patient’s brain. On the other hand, the current CAA treatment with immunosuppressants such as cyclophosphamide and methylprednisolone is associated with extensive systemic toxicity. To address these limitations, we designed TNVs comprising of cyclophosphamide loaded nanocore made of Magnevist® conjugated chitosan. The F(ab’)2 fragment (F(ab’)24.1) of a novel anti-amyloid antibody, IgG4.1, is grafted on the polymeric core to aid the targeting of TNVs to cerebrovascular amyloid. The F(ab’)24.1 is cationized with putrescine, which we have shown to enhance the BBB permeability of nanoparticles [15]. By providing MRI contrast and delivering therapeutic agents to the amyloid ridden cerebrovascular tissue, the TNVs aid in the early detection of CAA and allows for its pre-symptomatic treatment.
The mean hydrodynamic diameter of TNVs (239 ± 4.1 nm) was greater than that of the blank nanoparticle (164 ± 1.2 nm), most likely due to the incorporation of cyclophosphamide and Magnevist® (Table 1). However, the mean zeta potential value of the blank nanoparticles was almost 2-fold greater than that of the TNVs. Such reduction of TNV zeta potential value could be attributed to the participation of amine groups (−NH2) on chitosan, which contributes to the positive zeta potential value when protonated, in the amide bond formation with the carboxyl groups of the Magnevist® [17]. The amide bond formation was indicated by the increased FTIR absorption at 1599 cm−1 (Fig. 1B). The FTIR spectroscopy was also employed to assay the cyclophosphamide entrapped in TNVs by quantifying the absorption peak at 736.2 cm−1, which is unique to cyclophosphamide (Fig. 1C). When exposed to aqueous environment, the cyclophosphamide release from TNVs was linear with √time, which is typically seen with controlled drug release from polymeric matrices (Fig. 2B). To serve as good contrast agents, the TNVs are expected to retain most of the Magnevist® during the imaging-time window. This was achieved by chemically conjugating Magnevist® to the TNVs. Nevertheless, a very small percentage (<1%) of Magnevist® could also remain entrapped or physically adsorbed to the nanovehicles. It is clear from the data presented in Fig. 2C that Magnevist® was not lost appreciably from the TNVs either by the release of unconjugated Magnevist® or due to the unraveling of Magnevist® conjugated chitosan strands. Moreover agarose TNV phantoms provided excellent contrast enhancement at ultra-high field strength [21.1 T] (Fig. 2D–E).
The ability of TNVs to detect and bind to Aβ fibrils was determined using ELISA and QCM-D methods. The ELISA data has shown that the extent of pF(ab’)24.1 binding to Aβ40 fibrils was not significantly compromised after conjugation to the nanovehicle (Fig. 3A). Moreover, freshly prepared as well as lyophilized TNVs have comparable binding to Aβ40 fibrils, which suggested that the integrity of pF(ab’)24.1 was not significantly altered during lyophilization. The ability of TNVs to target Aβ40 fibrils under the shear force exerted by the blood flow in the cerebral vasculature was determined by QCM-D, in which the TNV suspension was passed through a microfluidic channel over the Aβ40 fibril bed adsorbed to the gold-coated quartz crystal. The QCM-D data showed higher binding of TNVs than CCNs to the Aβ fibril bed adsorbed on the gold/quartz crystal (Fig. 3B–D). Although, the CCNs have comparable concentration and viscosity as TNVs, they created an initial trough in the mass adsorbed to the sensor (Fig. 3D). This could be attributed to the removal of trapped water by the CCNs as they exited from the microfluidic chamber. In case of TNVs, however, the loss of weight due to water removal is most likely compensated by the enhanced binding of the nanovehicles to the Aβ fibril bed on the crystal.
A substantial increase in uptake of AF647-TNVs was seen in the hCMEC/D3 cell monolayers pre-treated with FITC-DutchAβ40 (Fig. 4A). Moreover, the AF647-TNVs colocalized with FITC-DutchAβ40 accumulated in the hCMEC/D3 cells. Next, flow cytometry was used to determine differences in the extents of intracellular accumulated AF647-IgG4.1 and AF647-TNVs in DutchAβ40 treated hCMEC/D3 cells. A 30-fold increase in internalization of AF647-TNVs by hCMEC/D3 cells pre-treated with DutchAβ40 as compared to the uptake of AF647-IgG4.1 (Fig. 4B). These results clearly show that the nanovehicle design but not the IgG4.1 plays a major role in facilitating the intracellular accumulation of TNVs in the DutchAβ40 treated monolayers.
Further studies were conducted to determine the biodistribution of TNVs and their ability to serve as MRI and SPECT contrast agents to detect cerebrovascular amyloid (Fig. 5). The TNVs in DutchAβ40 pre-treated mice showed lower AUC and greater clearance from the plasma than the mice treated with PBS (Figure 5A and Table 2), which is most likely due to the ability of TNVs to follow DutchAβ40 distribution to the vascular endothelium. This inference is supported by the observations that: i) TNV accumulation in the cerebral vasculature is much higher in DutchAβ40 pre-treated than in PBS pre-treated mice (Figure 5B); ii) TNV sequestration in peripheral clearing organs, such as liver, kidney and spleen is not significantly different between DutchAβ40 and PBS pre-treated mice (Table 3). Moreover, the SPECT/CT imaging of the mice injected with 125I-TNVs demonstrated greater ability to target cerebrovascular endothelium than the 125I-CCNs (radiolabeled albumin grafted-control chitosan nanoparticles) (Fig. 5C). Based on these major findings, we could conclude that TNVs are capable of targeting cerebral vasculature and detecting cerebrovascular amyloid accumulation.
Ex vivo MR images revealed greater contrast provided by TNVs in the brains pre-treated with DutchAβ40 than in the untreated mice brains or those treated with PBS (Fig. 6). However, compared to TNV phantoms, the contrast enhancement in these images is represented by signal voids with no T1 enhancement. This may be due to the confinement of TNV to cells or intracellular vesicles where the surface-to-volume ratio is low and consequently limits water access, thus resulting in a phenomenon known as T1-quenching [26, 27].
Enhanced expression of pro-inflammatory cytokines, such as IL-6, IL-1β and TNF-α, has been observed in the brains of CAA and/or AD patients [28]. The cytokine upregulation was shown to trigger the overexpression of amyloid precursor protein [29], microglial activation, and the release of free radicals. On the other hand, amyloid accumulation in the cerebral vasculature has been shown to enhance cytokine secretion, stimulate immune response mediated by monocyte invasion into the brain tissue, and trigger hemorrhages seen in CAA patients [30, 31]. Hence, the ability of TNVs to reduce the cytokine secretion provoked by the exposure of vasculotropic DutchAβ40 was tested. Our data showed that TNVs significantly inhibited IL-6, IL-1β and TNF-α secretion engendered by DutchAβ40 on the luminal side (Fig. 7A). Further studies are needed to determine the efficacy of TNVs to treat cerebral inflammation in CAA transgenic animals.
Based on these major findings, we could conclude that TNVs are capable of detecting amyloid accumulation in the cerebral vasculature and also inhibit cytokines secreted by the BBMVE cell monolayer triggered by the Aβ40 exposure.
Acknowledgements:
The authors acknowledge the financial assistance provided by the Alzheimer’s Association grant NIRG-09-133017 (KKK), RCMI 5G12MD007582-30 and NIH P20 MD006738, and the Minnesota Partnership for Biotechnology and Medical Genomics (KKK/JFP). The sponsor had no role in study design, collection, data analysis, data interpretation, and played no role in the decision to submit this paper for publication. The authors would like to thank James Ahlschwede for his assistance in designing the graphical abstract.
Footnotes
Publisher's Disclaimer: This is a PDF file of an unedited manuscript that has been accepted for publication. As a service to our customers we are providing this early version of the manuscript. The manuscript will undergo copyediting, typesetting, and review of the resulting proof before it is published in its final citable form. Please note that during the production process errors may be discovered which could affect the content, and all legal disclaimers that apply to the journal pertain.
References
- [1].Vinters HV, Gilbert JJ, Cerebral amyloid angiopathy: incidence and complications in the aging brain. II. The distribution of amyloid vascular changes, Stroke, 14 (1983) 924–928. [DOI] [PubMed] [Google Scholar]
- [2].Arvanitakis Z, Leurgans SE, Wang Z, Wilson RS, Bennett DA, Schneider JA, Cerebral amyloid angiopathy pathology and cognitive domains in older persons, Ann Neurol, (2010) [DOI] [PMC free article] [PubMed] [Google Scholar]
- [3].Cordonnier C, van der Flier WM, Brain microbleeds and Alzheimer’s disease: innocent observation or key player?, Brain, 134 (2011) 335–344. [DOI] [PubMed] [Google Scholar]
- [4].Viswanathan A, Patel P, Rahman R, Nandigam RN, Kinnecom C, Bracoud L, Rosand J, Chabriat H, Greenberg SM, Smith EE, Tissue microstructural changes are independently associated with cognitive impairment in cerebral amyloid angiopathy, Stroke, 39 (2008) 1988–1992. [DOI] [PMC free article] [PubMed] [Google Scholar]
- [5].Kloppenborg RP, Richard E, Sprengers ME, Troost D, Eikelenboom P, Nederkoorn PJ, Steroid responsive encephalopathy in cerebral amyloid angiopathy: a case report and review of evidence for immunosuppressive treatment, J Neuroinflammation, 7 (2010) 18. [DOI] [PMC free article] [PubMed] [Google Scholar]
- [6].Fountain NB, Lopes MB, Control of primary angiitis of the CNS associated with cerebral amyloid angiopathy by cyclophosphamide alone, Neurology, 52 (1999) 660–662. [DOI] [PubMed] [Google Scholar]
- [7].Greenberg SM, Cerebral amyloid angiopathy and vessel dysfunction, Cerebrovasc Dis, 13 Suppl 2 (2002) 42–47. [DOI] [PubMed] [Google Scholar]
- [8].Oh U, Gupta R, Krakauer JW, Khandji AG, Chin SS, Elkind MS, Reversible leukoencephalopathy associated with cerebral amyloid angiopathy, Neurology, 62 (2004) 494–497 [DOI] [PubMed] [Google Scholar]
- [9].Thanvi B, Robinson T, Sporadic cerebral amyloid angiopathy--an important cause of cerebral haemorrhage in older people, Age Ageing, 35 (2006) 565–571 [DOI] [PubMed] [Google Scholar]
- [10].Jack CR Jr., Wengenack TM, Reyes DA, Garwood M, Curran GL, Borowski BJ, Lin J, Preboske GM, Holasek SS, Adriany G, Poduslo JF, In vivo magnetic resonance microimaging of individual amyloid plaques in Alzheimer’s transgenic mice, J Neurosci, 25 (2005) 10041–10048. [DOI] [PMC free article] [PubMed] [Google Scholar]
- [11].Gonzalez-Duarte A, Cantu C, Ruiz-Sandoval JL, Barinagarrementeria F, Recurrent Primary Cerebral Hemorrhage : Frequency, Mechanisms, and Prognosis, Stroke, 29 (1998) 1802–1805. [DOI] [PubMed] [Google Scholar]
- [12].Ellis RJ, Olichney JM, Thal LJ, Mirra SS, Morris JC, Beekly D, Heyman A, Cerebral amyloid angiopathy in the brains of patients with Alzheimer’s disease: the CERAD experience, Part XV, Neurology, 46 (1996) 1592–1596. [DOI] [PubMed] [Google Scholar]
- [13].Fu R, Brey WW, Shetty K, Gor’kov P, Saha S, Long JR, Grant SC, Chekmenev EY, Hu J, Gan Z, Sharma M, Zhang F, Logan TM, Bruschweller R, Edison A, Blue A, Dixon IR, Markiewicz WD, Cross TA, Ultra-wide bore 900 MHz high-resolution NMR at the National High Magnetic Field Laboratory, J Magn Reson, 177 (2005) 1–8. [DOI] [PubMed] [Google Scholar]
- [14].Weksler BB, Subileau EA, Perriere N, Charneau P, Holloway K, Leveque M, Tricoire-Leignel H, Nicotra A, Bourdoulous S, Turowski P, Male DK, Roux F, Greenwood J, Romero IA, Couraud PO, Blood-brain barrier-specific properties of a human adult brain endothelial cell line, FASEB J, 19 (2005) 1872–1874. [DOI] [PubMed] [Google Scholar]
- [15].Agyare EK, Curran GL, Ramakrishnan M, Yu CC, Poduslo JF, Kandimalla KK, Development of a smart nano-vehicle to target cerebrovascular amyloid deposits and brain parenchymal plaques observed in Alzheimer’s disease and cerebral amyloid angiopathy, Pharm Res, 25 (2008) 2674–2684. [DOI] [PMC free article] [PubMed] [Google Scholar]
- [16].Poduslo JF, Hultman KL, Curran GL, Preboske GM, Chamberlain R, Marjanska M, Garwood M, Jack CR Jr., Wengenack TM, Targeting vascular amyloid in arterioles of Alzheimer disease transgenic mice with amyloid beta protein antibody-coated nanoparticles, J Neuropathol Exp Neurol, 70 (2011) 653–661. [DOI] [PMC free article] [PubMed] [Google Scholar]
- [17].Saha TK, Ichikawa H, Fukumori Y, Gadolinium diethylenetriaminopentaacetic acid-loaded chitosan microspheres for gadolinium neutron-capture therapy, Carbohydr Res, 341 (2006) 2835–2841. [DOI] [PubMed] [Google Scholar]
- [18].Shikata F, Tokumitsu H, Ichikawa H, Fukumori Y, In vitro cellular accumulation of gadolinium incorporated into chitosan nanoparticles designed for neutron-capture therapy of cancer, Eur J Pharm Biopharm, 53 (2002) 57–63. [DOI] [PubMed] [Google Scholar]
- [19].Poduslo JF, Curran GL, Wengenack TM, Malester B, Duff K, Permeability of proteins at the blood-brain barrier in the normal adult mouse and double transgenic mouse model of Alzheimer’s disease, Neurobiol Dis, 8 (2001) 555–567. [DOI] [PubMed] [Google Scholar]
- [20].Larson RR, Khazaeli MB, Dillon HK, Development of an HPLC method for simultaneous analysis of five antineoplastic agents, Appl Occup Environ Hyg, 18 (2003) 109–119. [DOI] [PubMed] [Google Scholar]
- [21].Darras V, Nelea M, Winnik FM, Buschmann MD, Chitosan modified with gadolinium diethylenetriaminepentaacetic acid for magnetic resonance imaging of DNA/chitosan nanoparticles, Carbohydr Polym, 80 1137–1146. [Google Scholar]
- [22].Rowatt E, Williams RJ, The interaction of cations with the dye arsenazo III, Biochem J, 259 (1989) 295–298. [DOI] [PMC free article] [PubMed] [Google Scholar]
- [23].Poduslo JF, Ramakrishnan M, Holasek SS, Ramirez-Alvarado M, Kandimalla KK, Gilles EJ, Curran GL, Wengenack TM, In vivo targeting of antibody fragments to the nervous system for Alzheimer’s disease immunotherapy and molecular imaging of amyloid plaques, J Neurochem, 102 (2007) 420–433. [DOI] [PubMed] [Google Scholar]
- [24].Jaruszewski GLCKM, Swaminathan SK, Rosenberg JT, Grant SC, Ramakrishnan S, Lowe VJ, Poduslo JF, Kandimalla KK, Multimodal nanoprobes to target cerebrovascular amyloid in Alzheimer’s disease brain., Biomaterials, (2013) [DOI] [PMC free article] [PubMed] [Google Scholar]
- [25].Cheng FY, Su CH, Yang YS, Yeh CS, Tsai CY, Wu CL, Wu MT, Shieh DB, Characterization of aqueous dispersions of Fe(3)O(4) nanoparticles and their biomedical applications, Biomaterials, 26 (2005) 729–738. [DOI] [PubMed] [Google Scholar]
- [26].Kok MB, Hak S, Mulder WJ, van der Schaft DW, Strijkers GJ, Nicolay K, Cellular compartmentalization of internalized paramagnetic liposomes strongly influences both T1 and T2 relaxivity, Magn Reson Med, 61 (2009) 1022–1032. [DOI] [PubMed] [Google Scholar]
- [27].Rosenberg JT, Kogot JM, Lovingood DD, Strouse GF, Grant SC, Intracellular bimodal nanoparticles based on quantum dots for high-field MRI at 21.1 T, Magn Reson Med, 64 (2010) 871–882. [DOI] [PubMed] [Google Scholar]
- [28].Mrak RE, Griffin WS, Interleukin-1, neuroinflammation, and Alzheimer’s disease, Neurobiol Aging, 22 (2001) 903–908. [DOI] [PubMed] [Google Scholar]
- [29].Lannfelt L, Bogdanovic N, Appelgren H, Axelman K, Lilius L, Hansson G, Schenk D, Hardy J, Winblad B, Amyloid precursor protein mutation causes Alzheimer’s disease in a Swedish family, Neurosci Lett, 168 (1994) 254–256. [DOI] [PubMed] [Google Scholar]
- [30].Maat-Schieman ML, van Duinen SG, Rozemuller AJ, Haan J, Roos RA, Association of vascular amyloid beta and cells of the mononuclear phagocyte system in hereditary cerebral hemorrhage with amyloidosis (Dutch) and Alzheimer disease, J Neuropathol Exp Neurol, 56 (1997) 273–284. [DOI] [PubMed] [Google Scholar]
- [31].Miao J, Xu F, Davis J, Otte-Holler I, Verbeek MM, Van Nostrand WE, Cerebral microvascular amyloid beta protein deposition induces vascular degeneration and neuroinflammation in transgenic mice expressing human vasculotropic mutant amyloid beta precursor protein, AM J Pathol, 167 (2005) 505–515. [DOI] [PMC free article] [PubMed] [Google Scholar]