

Abstract
IBD represents a set of idiopathic and chronic inflammatory diseases of the gastrointestinal tract. Central to the pathogenesis of IBD is a dysregulation of normal intestinal epithelial homeostasis. cGAS is a DNA sensing receptor demonstrated to promote autophagy, a mechanism that removes dysfunctional cellular components. Beclin-1 is a crucial protein involved in the initiation of autophagy. We hypothesized that cGAS plays a key role in intestinal homeostasis by upregulating Beclin-1 mediated autophagy. We evaluated intestinal cGAS levels in humans with IBD and in murine colonic tissue after performing a 2% DSS colitis model. Autophagy and cell death mechanisms were studied in cGAS KO and WT mice via qPCR, WB analysis, H&E, IF, and TUNEL staining. Autophagy was measured in stimulated IECs via WB analysis. Our data demonstrates cGAS to be upregulated during human and murine colitis. Furthermore, cGAS deficiency leads to worsened colitis and decreased levels of autophagy proteins including Beclin-1 and LC3-II. Co-IP demonstrates a direct binding between cGAS and Beclin-1 in IECs. Transfection of cGAS in stimulated HCT-116 cells leads to increased autophagy. IECs isolated from cGAS KO have diminished autophagic flux. cGAS KO mice subjected to DSS have increased cell death and cleaved caspase-3. Lastly, Treatment of cGAS KO mice with rapamycin decreased the severity of colitis. Our data suggest that cGAS maintains intestinal epithelial homeostasis during human IBD and murine colitis by upregulating Beclin-1 mediated autophagy and preventing IEC death. Rescue of autophagy can attenuate the severity of colitis associated with cGAS deficiency.
Keywords: Colitis, cGAS, intestinal epithelium, DSS
Introduction
Inflammatory bowel disease (IBD), including Crohn’s disease (CD) and ulcerative colitis (UC), represents a set of idiopathic, chronic, and unremitting inflammatory diseases of the gastrointestinal tract. The incidence of disease continues to rise worldwide. In the United States alone, the direct cost of IBD care is approximately $28 billion dollars a year (1,2). The pathogenesis of IBD is multifactorial, encompassing a complex interplay between the gut microbiota and environmental exposures in a genetically susceptible host (1). Although innate and adaptive immune cells drive much of the inflammation during IBD, a disruption of the intestinal epithelial barrier is a key hallmark of disease. Damage and loss of the epithelium—a protective barrier formed by a single layer of cells that serve to defend the host against the luminal microenvironment—contributes to ongoing inflammation and prevents mucosal healing (3,4).
Central to the pathogenesis and progression of IBD is a dysregulation of normal intestinal epithelial homeostasis driven, in part by the self-recognition of free intracellular DNA by pattern-recognition receptors (PRRs) (5,6). Intestinal epithelial cells possess a variety of intracellular PRRs, such as retinoic acid-inducible gene-I (RIG-I), absent in melanoma-2 (AIM2), and toll-like receptor-9 (TLR9), that function as intracellular sensors for cytoplasmic DNA (7–9). The presence of DNA within the cytoplasm, whether endogenous or exogenous, can thus initiate a robust inflammatory response. Conversely, adaptive cellular responses have developed to control pro-inflammatory signaling. One such homeostatic cellular mechanism is autophagy. During autophagy, damaged organelles are directed to double-membrane vesicles called autophagosomes, which then fuse with lysosomes for subsequent degradation (10,11). Autophagy also protects against inflammation by eliminating pattern-associated molecular patterns and damage-associated molecular patterns, such as microbes or cytoplasmic nucleic acids, respectively (12). Studies have demonstrated that certain PRRs can sense cytoplasmic DNA and activate autophagy (13,14).
Cyclic-GMP-AMP Synthase (cGAS) is a cytoplasmic PRR that senses double-stranded DNA in a sequence-independent manner (15). Upon stimulation by DNA, cGAS undergoes a conformational change allowing it to convert ATP and GTP into 2’-3’ cyclic GMP-AMP (cGAMP) (15,16). cGAMP, a secondary messenger, then binds to Stimulator of interferon (IFN genes (STING), leading to phosphorylation of IFN regulatory factor 3 (IRF-3). Phosphorylated IRF-3 then translocates into the nucleus and induces the transcription of type I IFNs (15,16). Activation and upregulation of cGAS has been associated with a number of autoimmune diseases, such as Aicardi-Goutieres syndrome, allergic airway inflammation, and rheumatoid arthritis (17–19). Although cGAS has been shown to increase type I IFN-mediated inflammation, it has also conversely also been demonstrated to dampen excessive inflammation via an upregulation of autophagy (20). A recent study focusing on fibroblasts and bone marrow-derived macrophages (BMDMs) demonstrated that cGAS can dampen inflammation by upregulating Beclin-1-mediated autophagy (20). Limited data exists on the role of cGAS in intestinal epithelial inflammation. One study demonstrated cGAS to be upregulated during human IBD and cGAS deficiency to be associated with diminished severity of murine colitis (21). Another study looked at the role of cGAS in colitis-associated cancer and found that cGAS deficiency was associated with increased colitis-associated tumorigenesis (22). Thus, our understanding of the role that cGAS plays during intestinal inflammation remains incomplete.
Our data demonstrate that cGAS activity is increased within the intestinal epithelium during human IBD and murine experimental colitis. Further, a deficiency in cGAS leads to worsened intestinal inflammation. cGAS appears to protect against pro-inflammatory signaling and drive epithelial homeostasis via an upregulation of Beclin-1-mediated autophagy. Our data demonstrate that cGAS-deficient mice experience increased intestinal inflammation, in part, due to a decrease in autophagy as demonstrated by decreased Beclin-1, microtubule associated light chain 3-II (LC3-II), and increased Sequestosome-1/p-62 (SQSTM1/p-62). Diminished autophagy is associated with an increase in intestinal epithelial cell death in cGAS-deficient mice. We demonstrate direct binding between cGAS and Beclin-1 in HCT-116 cells, an intestinal epithelial cell (IEC) line. Furthermore, we demonstrate an upregulation of autophagy in HCT-116 cells transfected with cGAS when stimulated with poly dA:dT and treated with chloroquine. Finally, we demonstrate that rapamycin, a medication known to benefit a small cohort of patients with IBD, attenuates the severity of intestinal inflammation in cGAS-deficient mice via a rescue of autophagy.
Materials and Methods:
Animals
C57BL/6J male mice aged 6–8 weeks (20–25 grams) (cat #: 000664) from the Jackson Laboratory (Bar Harbor, ME, USA) were used in this study as WT mice. cGAS KO mice (6–8 weeks; 20–25 grams) were provided by Dr. Timothy Billiar, Department of Surgery, University of Pittsburgh School of Medicine, Pittsburgh, PA, USA. All mice were housed in a barrier facility within an Association for Assessment and Accreditation of Laboratory Animal Care International–accredited animal facility at the University of Pittsburgh Medical Center (UPMC) Children’s Hospital of Pittsburgh, Pittsburgh, PA. USA. All experiments were approved by the Institutional Animal Care and Use Committee at the University of Pittsburgh. Experiments were in accordance with federal guidelines for the care and use of laboratory animals, as well as the guidelines set forth by the Animal Research and Care Committee at the UPMC Children’s Hospital of Pittsburgh.
Human tissue
Human tissue samples were obtained from patients at the UPMC Children’s Hospital of Pittsburgh after Institutional Review Board (IRB) approval at the University of Pittsburgh (IRB approval number: MOD19100232–003). Diseased human tissue was obtained from patients undergoing surgical bowel resection for IBD. Age-matched, non-disease control human tissue was obtained from patients undergoing surgery for a non-inflammatory- or non-cancer-based diagnosed. All patients were 5–21 years of age and underwent surgery at the UPMC Children’s Hospital of Pittsburgh. Patients were excluded if there was 1) lack of parental consent, 2) congenital anomalies, and 3) pregnant females. All patient samples were de-identified and handled in a blinded manner with the coding system only being known to the research coordinator. Samples were processed and analyzed without knowledge of the patient’s private information. Final pathology reports were used to group patient samples according to the IBD subset.
Antibodies and reagents
Antibodies to cGAS (dilution 1:500; cat #: 31659), Beclin-1 (dilution 1:1000; cat #: 3738), STING (dilution 1:1000; cat #: 13647), LC3I-II (dilution 1:1000: cat #: 2775), Cleaved-Caspase 3 (dilution 1:1000; cat #: 9662), m-TOR, (dilution 1:1000; cat #: 2983), and β-Actin (1:10,000; cat #: 4970) were purchased from Cell Signaling Technologies (CST) (Danvers, Massachusetts, USA). Antibodies to human-cGAS (dilution 1:1000; cat #: ab224144), SQSTM1/P62 (dilution 1:1000; cat #: ab56416), anti-HA (cat #: ab1424), and anti-GFP (cat #: ab290) were from Abcam (Cambridge, Massachusetts, USA). The antibody to phospho-IRF-3 (dilution 1:1000; cat #: S385) was purchased from Thermo Fisher Scientific (Waltham, Massachusetts, USA). Antibody to Mouse E-Cadherin (dilution 1/100; cat# AF748) was purchased from R&D Systems (Minneapolis, Minnessota, USA). The antibody to human-beclin-1 (dilution 1:1000; cat #: TA5026435) was from Origene (Rockville, Maryland, USA). DSS (36,000–50,000 kDA) was purchased from MP Biomedicals (MP Biomedicals, Solon, OH, USA). Opti-MEM™ I Reduced Serum Medium (cat #: 31985088), prolong diamond antifade mountant with DAPI (cat #: P36971), and Poly dA:dT were from Thermo Fisher Scientific (Waltham, Massachusetts, USA). Protein A/G plus-agarose (cat #: sc-2003) was from Santa Cruz Biotechnology (Dallas, Texas, USA). HCT-116 cells (CCL-247) were from American Type Culture Collection (ATCC) (Manassas, Virginia, USA). Beclin plasmid/HA-beclin-1 (cat #: 12163) was from Addgene (Watertown, Massachusetts, USA). cGAS plasmid, GFP-cGAS (cat #: RG212386), was from OriGene (Rockville, Maryland, USA). The maxi prep kit (cat #: 12163), RNeasy Kit, and QuantiTect Reverse Transcription Kit (cat #: 74004) were from Qiagen (Germantown, Maryland, USA). Rapamycin (R-5000; >99%) was purchased from LC laboratories (Woburn, Massachusetts, USA).
DSS-induced murine model of colitis
The DSS-induced colitis model was performed per our published protocol by treating WT and cGAS KO male mice (6–8 weeks, 20–25 g) with 2% DSS in their drinking water for 7 days (23). Mice were euthanized at day 7. DAI scores were calculated each day for all mice. For the rapamycin model, mice were subjected to the DSS colitis model for 7 days and injected intraperitoneally with rapamycin (2 mg/kg dissolved in PBS) or PBS alone on days 0–6. For the cohousing model, age-matched male WT and cGAS KO mice from different litters and cages were cohoused at a 1:1 ratio for 4 weeks prior to the addition of DSS into their drinking water. Stool was collected prior to cohousing and 4 weeks after cohousing but prior to the initiation of the DSS colitis model. The body weight, stool consistency, and fecal occult were measured every day to assess the disease activity index (DAI) scores. The DAI score was comprised of weight loss [0 (> 1%), 1 (1–5%), 2 (5–10%), 3 (10–15%), and 4 (15–20%)], stool consistency [0 (hard stool), 1 (soft stool), 2 (loose stool), 3 (watery diarrhea), and 4 (gross diarrhea)], and fecal blood [0 (no blood), 1 (positive fecal occult), and 2 (gross blood)]. Mice were euthanized at day 7 of the model, colon lengths were immediately measured, and colonic segments (5 mm) were then flash frozen in liquid nitrogen for further protein and gene analysis. The remaining colon was then submerged in 4% paraformaldehyde for further histologic analysis.
RNA isolation, cDNA synthesis, and real-time quantitative polymerase chain reaction (RT-qPCR)
The RNeasy kit was used to isolate total RNA from murine colonic tissue per the manufacturer’s instructions. Concentration and purity of RNA samples were measured via spectrophotometry using a ND-2000 spectrophotometer (NanoDrop Technologies, Inc., Wilmington, DE, USA). The QuantiTect Reverse Transcription Kit was used to prepare first-strand cDNA (0.5 μg of RNA). Diluted cDNA (0.5 ng/μl) was stored at −20°C until further use. The RT-qPCR final reaction volume of 10 μl was created with 2.5 ng of cDNA, primers (500 nM final concentration), and 1× PowerUp SYBR Green Mastermix (Thermo Fisher Scientific, Waltham, Massachusetts, USA). cDNA was amplified using a QuantStudio real-time PCR detection system (Thermo Fisher Scientific, Waltham, Massachusetts, USA). All reactions were performed in triplicate. The amplification conditions for the RT-qPCR reactions were as follows: 1 cycle of initial denaturation at 95°C for 20 seconds, followed by 40 cycles of denaturation at 95°C for 1 second, annealing at 60°C for 20 seconds, and elongation at 95°C for 1 second. RT-qPCR data was analyzed using the comparative threshold (ΔΔCt) method, and the housekeeping gene 50s ribosomal subunit protein L15 (Rplo) was used for calculation of relative gene expression for all genes. The derived ΔΔCt values were then adapted to fold difference values, and the range of the fold difference was represented as the standard deviation (SD) of the ΔΔCt value.
Histologic analysis
For histological analysis, human and murine colonic tissue were fixed in 4% paraformaldehyde for 18–20 hours, dehydrated, and them embedded in paraffin. Tissue sections were cut at 5-μm thickness, placed on tissue slides, and then deparaffinized and rehydrated via a gradient of xylene and ethanol. The tissue was then stained with hematoxylin and eosin (H&E; Millipore Sigma, Burlington, Massachusetts, USA). Tissue sections were scored for inflammation by a blinded pathologist based on a published protocol (24). Pathologic scoring was as follows: 0, no signs of inflammation; 1, very low level; 2, low level of leukocyte infiltration; 3, high level of leukocyte infiltration, high vascular density, thickening of colon wall; 4, transmural infiltration, loss of goblet cells, high vascular density, and thickening of colon wall (26). Images were acquired with a light microscope (Leica DFC9000 GT, Leica Microsystems, Illinois, USA).
Immunofluorescence microscopy
Paraffin-embedded tissue sections from human and murine colonic tissue were cut at 5 μm, deparaffinized, and rehydrated via xylene and ethanol gradient baths. Antigen retrieval was performed by submerging tissue in a 10 mM citric acid bath at 95°C for 30 minutes. The tissue was then blocked with 1% donkey serum and then blocked with 5% donkey serum for 30 minutes. Sections were then incubated at 4°C overnight with a primary antibody diluted in 1% donkey serum. The next day the tissue was washed with PBS and probed with the appropriate secondary antibody diluted in 1% donkey serum for 1–2 hours. Coverslips were then mounted with mounting media on the tissue sections for imaging on a fluorescence microscope (Leica DFC9000 GT epifluorescence microscope, Leica Microsystems Inc., Buffalo Grove, Illinois, USA). Three tissue sections with four images per section were imaged per mouse. Quantification of fluorescence was performed when appropriate in a blinded manner. The level of fluorescence in each region was determined by using the following equation: corrected total cell fluorescence (CTCF) = area of selected cell × mean fluorescence of background readings. The CTCF values, which are arbitrary numbers, were graphed, and standard deviations were calculated.
Assessment of intestinal epithelial LC3
Tissue removed after perfusion with cold PBS, followed by 2% paraformaldehyde perfusion and incubated further for an additional 2 hours to complete tissue fixation. Cell membrane integrity was preserved with incubation for 24 hours in 30% sucrose, followed by cryopreservation in liquid nitrogen cooled 2-Methylbutane. Tissue sections of 6μm were permeabilized with 0.3% TritonX-100 for 20min, followed by cell death staining according to the manufacturers protocol of the In-Situ Cell Death Detection Kit-TMR red (12156792910, Roche). Samples stained for LC3 puncta (rabbit: Novus cat no. NB100) and Belcin-1 (rabbit, Novus, cat no. 3738) were incubated overnight at 4°C with the indicated primary antibody at 5 ug/ml overnight at 4°C. Following three washes in PBS, slides were incubated with fluorescent-conjugated secondary antibodies for 45 minutes in combination with Alexa Fluor-conjugated 647 phalloidin (1:500, Invitrogen, A22287). Nuclear stain was accomplished using with 1 mg/ml Hoechst (B-2883, Sigma-Aldrich). Imaging conditions were maintained at identical settings within each antibody-labeling experiment with original gating performed using the primary depletion control. Large area images equivalent to nine unique fields were taken in X and Y with a Nikon A1 confocal microscope (purchased with 1S10OD019973–01 awarded to Dr. Simon C. Watkins).
TUNEL staining
Colon tissues were fixed in 4% paraformaldehyde (PFA), embedded in paraffin, sectioned, and further detected using In Situ Cell Death Detection Kit, Fluorometric TUNEL System (Promega, Madison, WI, USA) according to manufacturer’s instruction
Western blot analysis
Tissue homogenates were lysed in 1× RIPA buffer (Boston Bio, Ashland, Massachusetts, USA) containing protease and phosphatase. A bicinchoninic acid assay (Millipore Sigma, Burlington, Massachusetts, USA) was used to measure the protein concentration of each sample. Protein lysates (20–40 μg/sample) were separated by SDS-polyacrylamide gel electrophoresis utilizing 10–15% SDS gels. Proteins were then transferred onto PDVF membranes. Membranes were washed for 5 minutes with a Tris-buffered saline + Tween-20 buffer (1× TBST; 20 mM Tris, 150 mM NaCl, 0.1% Tween-20) three times and then blocked with either 5% nonfat dry milk or 5% BSA in 1× TBST. Membranes were probed with a primary antibody and incubated overnight at 4°C on a rotating platform. The next day the membranes were washed 3 times with 1× TBST for 5 minutes each and secondarily probed with the appropriate HRP-conjugated anti-rabbit or anti-mouse antibody. Proteins were visualized using ECL substrate (Millipore). Images were then acquired using a Kodak X-Omat 2000 processor (Eastman Kodak Company, Rochester, NY, USA). Where necessary, the relative intensity of protein bands was quantified and analyzed with ImageJ (National Institutes of Health, Bethesda, MD, USA; http://rsb.info.nih.gov/jj/). Relative band intensity was calculated as the ratio of total target protein to total actin or as the ratio of phosphorylated target protein to total target protein.
Co-immunoprecipitation (Co-IP):
Human colonic HCT-116 cells (ATCC, Manassas, VA) were cultured with DMEM (Gibco) supplemented with 10% FBS (Atlanta, Flowery Branch, GA), 100x Glutamax, 100x sodium pyruvate, and 1% penicillin/ streptomycin. Cells (2.5×10⁵ cells/well) were seeded in a 6-well plate overnight and co-transfected with 0.5μg HA-beclin-1 and 0.5μg GFP-cGAS plasmids via Lipofectamine™ 2000 per the manufacturer’s instructions. Forty-eight hours after transfection, cells were stimulated with 1μg/mL Poly(dA:dT) for 4 hours and subsequently lysed in 50 mM Tris-HCl, pH 7.4, 150 mM NaCl, 0.5% Triton X-100, 2.5 mM EDTA, protease cocktail inhibitors, and phosphatase cocktail inhibitors. Five percent of the cell lysate was reserved as input prior to performing a pre-clearing step with protein A/G agarose beads (Santa Cruz Biotechnology) and incubation with 5 μg of either anti-HA antibody (cat #: ab1424) or control anti-mouse IgG (cat# sc-2025) overnight. The next day, the immunocomplexes were incubated with protein A/G agarose beads (Santa Cruz Biotechnology) for three hours, washed in lysis buffer 3 times, and eluted with 2X Laemmli sample buffer after boiling for 5 min at 95°C. Proteins were resolved using SDS-PAGE and blotted with the indicated antibodies as described above.
Cell culture/transfection/immunoblot analysis of LC3:
Human colonic HCT-116 cells (ATCC, Manassas, VA) were cultured with DMEM (Gibco) supplemented with 10% FBS (Atlanta, Flowery Branch, GA), 100x Glutamax, 100x sodium pyruvate, and 1% penicillin/ streptomycin. Cells (2.5×10⁵ cells/well) were seeded in a 6-well plate overnight and transfected with 0.5ug GFP-cGAS plasmids or 0.5ug GFP-tagged vector plasmids via Lipofectamine™ 2000 per the manufacturer’s instructions. Forty-eight hours after transfection, cells were stimulated with 1ug/mL Poly(dA:dT) and 50uM of chloroquine for up to 6 hours and subsequently lysed in 50 mM Tris-HCl, pH 7.4, 150 mM NaCl, 0.5% Triton X-100, 2.5 mM EDTA, protease cocktail inhibitors, and phosphatase cocktail inhibitors. Protein lysates were collected at time points 0, 0.5, 1, 2, 4, and 6 hours. Western blot analysis was subsequently performed in the manner listed above for LC3 I/II. To measure the effect of rapamycin on autophagy, cells were similarly transfected with 0.5ug GFP-cGAS plasmids or 0.5ug GFP-tagged vector plasmids via Lipofectamine™ 2000 per the manufacturer’s instructions. Forty-eight hours after transfection, cells were stimulated with 1ug/mL Poly(dA:dT), 50uM of chloroquine, and 2uM of rapamycin for up to 6 hours and subsequently lysed in RIPA buffer, protease cocktail inhibitors, and phosphatase cocktail inhibitors. Protein lysates were collected at time points 0, 4, and 6 hours. Western blot analysis was subsequently performed in the manner listed above for LC3 I/II.
Chloroquine-treatment of intestinal epithelial crypts:
Crypts were isolated from mouse colonic tissue from WT and cGAS KO subjected to 2% DSS treatment for 4 days. Colons were opened longitudinally, washed in 1x ice-cold D-PBS, and cut into 2–3cm long pieces before incubating the tissue in ice-cold D-PBS supplemented with 30mM EDTA and 1.5mM DTT for 20 minutes on ice. A second incubation of the tissue in D-PBS supplemented with 30mM EDTA was performed for 5 minutes at 37°C. Crypts were resuspended in 20mL of Advanced DMEM/F12 supplemented with 2mM Glutmax, 10mM HEPES, and 1% penicillin/ streptomycin, vigorously shaken for 45 seconds to dislodge crypts, and the supernatant was filtered through a 70μM filter. This entire process was subsequently repeated to further enrich for crypts. The crypts were centrifuged at 300g for 10 minutes at 4°C. The crypts were resuspended in 10mL of Advanced DMEM/F12 supplemented with 2mM Glutmax, 10mM HEPES, and 1% penicillin/ streptomycin and centrifuged at 300g for 5 minutes at 4°C. Crypts were resuspended at a concentration of 1000 crypts/mL in WRN media (Miyoshi and Stappenback, 2013) supplemented with 1x N2 supplement, 1x B27 supplement, 50ng/mL EGF, and 1mM N-acetyl cysteine, and 1mL of media was placed in each well of a collagen coated 12-well plate. The crypts were allowed to acclimate for 30 minutes prior to treatment with 50μM of chloroquine. Protein was extracted from crypts at 0, 0.5-, 1-, 2-, and 4-hour timepoints. To harvest protein, crypts were pulled from 4 wells and centrifuged at 300g at 4°C for 5 minutes. They were washed in ice-cold D-PBS supplemented with 0.1% BSA and centrifuged at 3500rpm at 4°C for 5 minutes. Cells were lyses in RIPA buffer supplemented with protease and phosphatase inhibitors and Western blot analysis was subsequently performed as previously described above for LC3 I/II.
Collagen-coated Tissue Culture Plates:
12-well tissue culture plates were coated by covering the bottom of each well with a 300μg/mL Collagen-I (BD sciences # 354236) diluted in 1x D-PBS, pH 7.4. The plates were incubated overnight at 37°C and the solution was removed the next morning. Plates were allowed to dry for 30 minutes prior to washing with 1x D-PBS for 30 minutes. The D-PBS was removed, and the plates were either immediately used or allowed to dry and stored at 4°C for future use.
16S rRNA gene sequencing:
DNA extraction for 16S analysis:
DNA was extracted from samples using the Qiagen PowerSoil kit (Qiagen, Germantown, Maryland, USA) according to the manufacturer’s protocol and eluted using 50 uL of DNase/RNase free water. After extraction, samples were quantified using an Invitrogen Qubit 4 Fluorometer and 1X Qubit dsDNA High Sensitivity Assay Kit (ThermoFisher Scientific, Waltham, MA, USA).
16S amplicon PCR and sequencing:
All 16S rRNA illumina-tag PCR reactions were performed on DNA extracts per the Earth Microbiome Project’s protocol (25). PCR products were pooled and gel purified on a 2% agarose gel using the Qiagen Gel Extraction Kit (Qiagen, Germantown, Maryland, USA). Before sequencing, the purified pool was quality checked using an Agilent 2100 BioAnalyzer and Agilent DNA High Sensitivity DNA kit (Agilent Technologies, Santa Clara, California, USA). The purified pool was stored at −20°C and then sequenced by Wright Labs (Huntingdon, PA, USA) using an Illumina MiSeq v2 chemistry with paired-end 250 base pair reads.
Statistical analysis
Data were analyzed using GraphPad Prism 7.0 software (San Diego, California, USA) and presented as mean ± SD. The data were analyzed by either a two-tailed unpaired t test for two groups, one-way analysis of variance (ANOVA) for multiple groups with one independent variable, or a two-way ANOVA for multiple groups with two independent variables. P values were provided as * P < 0.05, ** P < 0.01, *** P < 0.001, and **** P < 0.0001. Microbiome analyses were performed using the Vegan and Phyloseq libraries in R. Generation of an OTU table, phylogenetic tree and taxonomic predictions were done using the QIIME2 package. Differences in beta-diversity were tested using the ADONIS2 test, and group homogeneity was tested using the PERMDISP test.
Results
cGAS is significantly elevated in the intestinal epithelium of humans with IBD and wild-type (WT) mice subjected to acute intestinal injury
We performed real-time quantitative polymerase (RT-qPCR) and western blot analysis of colonic tissue from patients with active IBD. We found significantly higher levels of cGAS mRNA in patients with UC as compared to control patients (Fig. 1A). Western blot analysis demonstrated upregulation of cGAS protein in humans with UC as compared to controls (Fig. 1B, C). Immunofluorescence (IF) staining of patient samples demonstrated that the increase in cGAS protein levels primarily localized within the intestinal epithelium of patients with UC as compared to controls (Fig. 1D, E). Next, we subjected C57BL/6J WT mice to a 7-day model of 2% Dextran Sulfate Sodium (DSS) induced colitis. Analogous to our human data, western blot analysis and IF staining demonstrated an upregulation of cGAS protein in the intestinal epithelium of WT mice subjected to DSS colitis as compared to their controls (Fig. 2). These data demonstrate an upregulation of epithelial cGAS during intestinal inflammation and suggest that cGAS may play an important role in both human and murine disease.
Figure 1. cGAS is Upregulated in the Intestinal Epithelium of Humans with Inflammatory Bowel Disease (IBD).
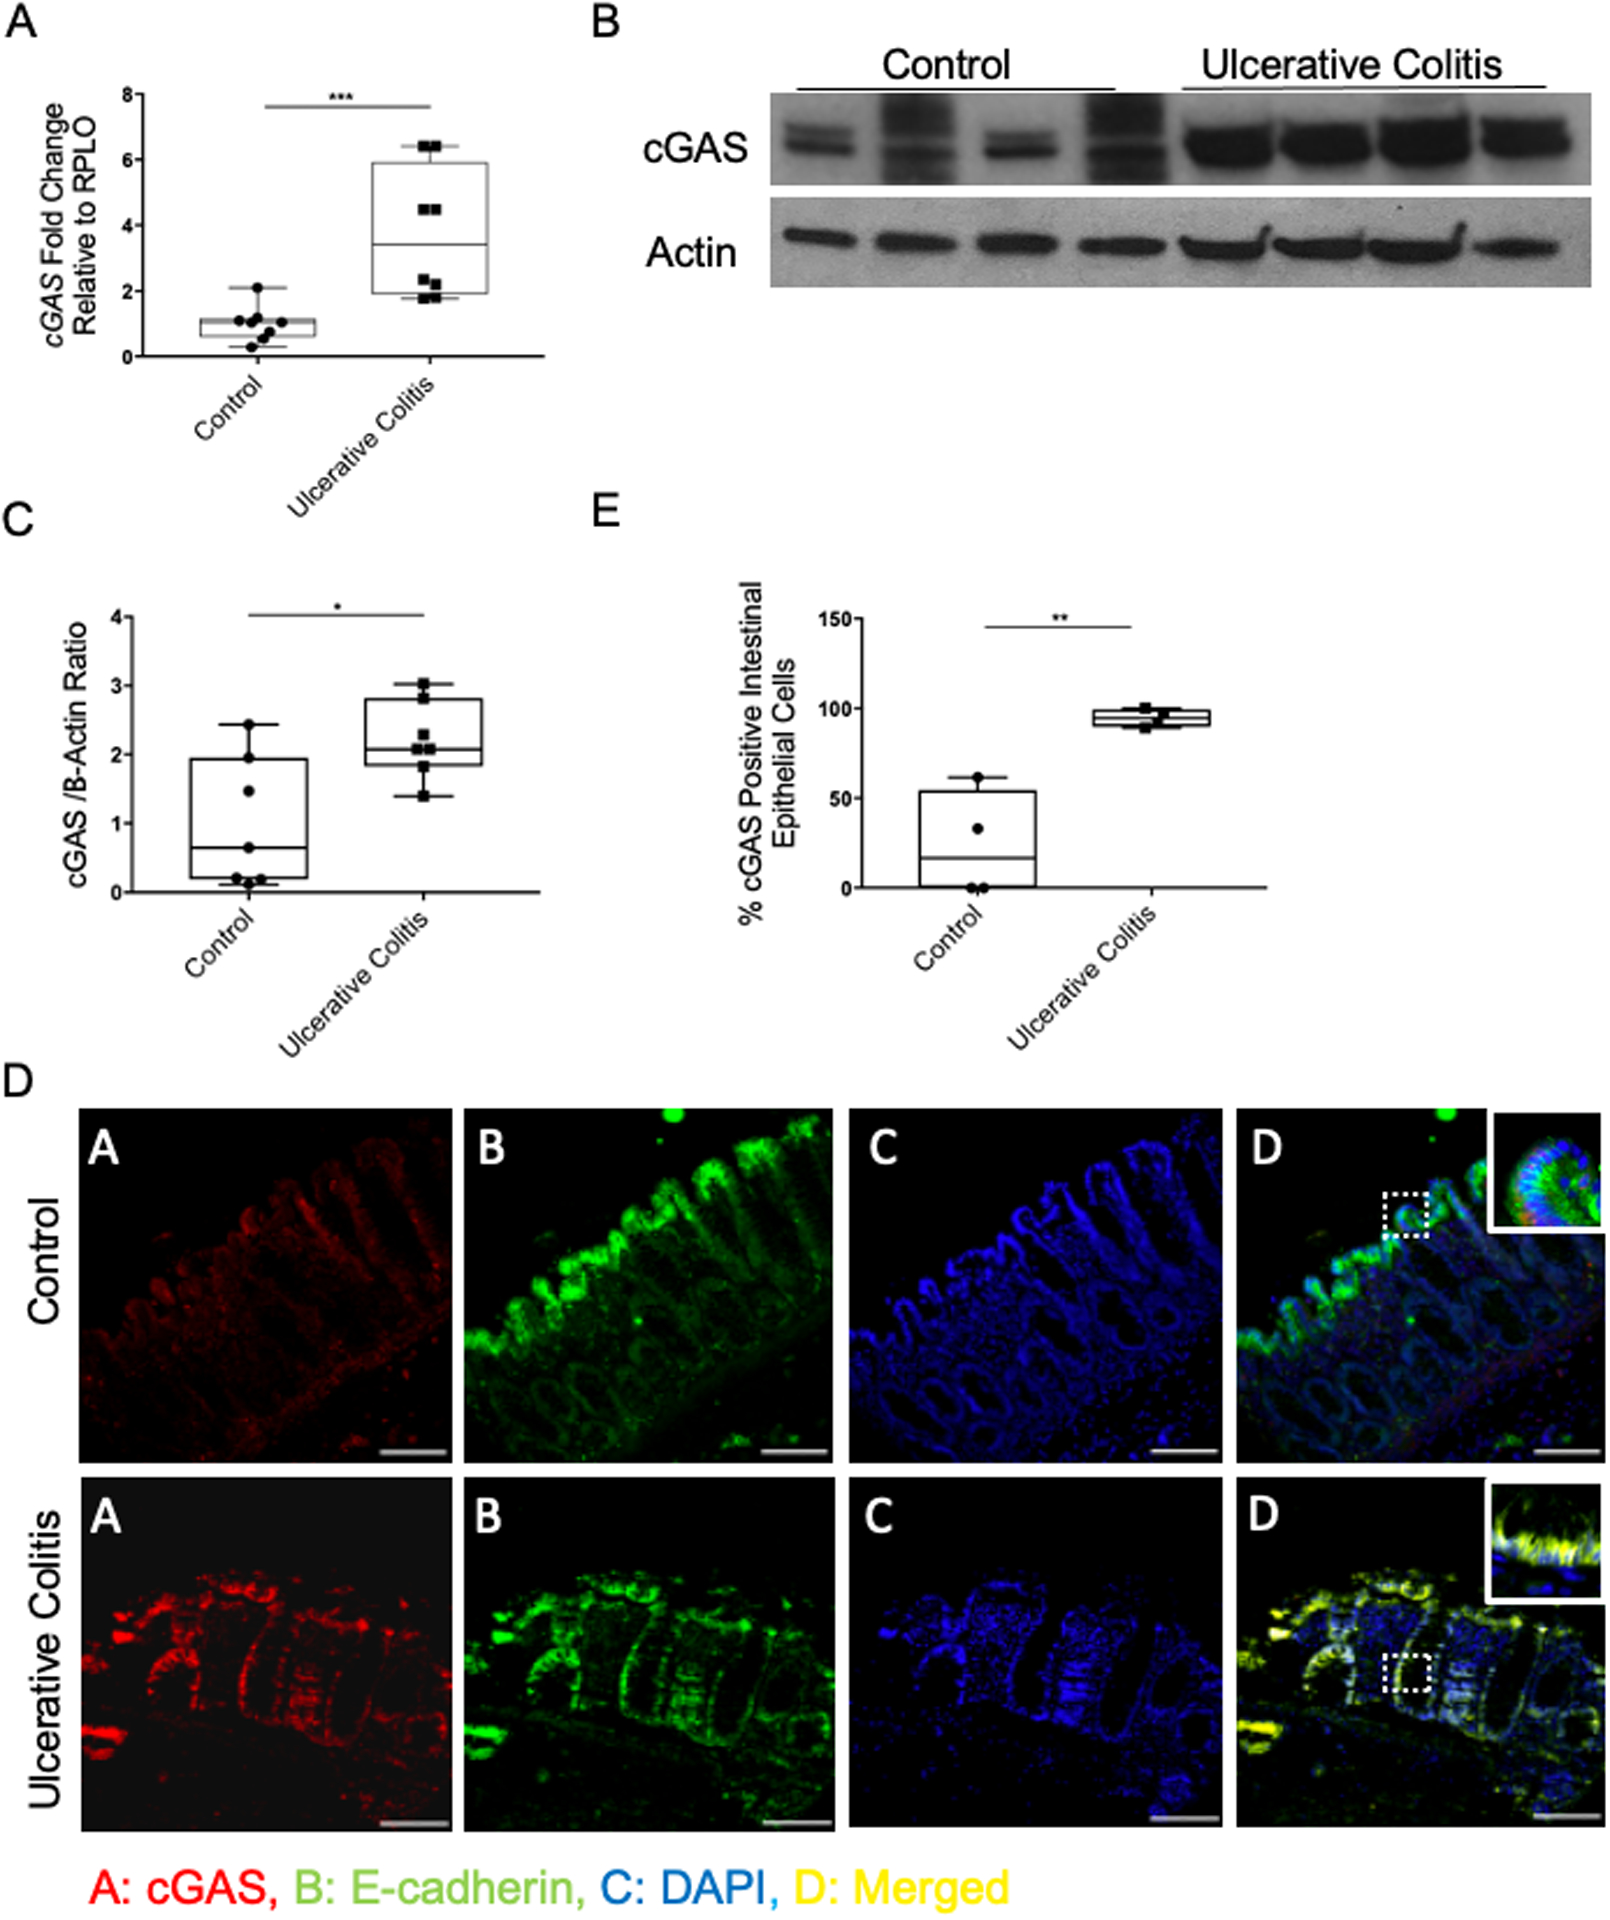
(A) RT-qPCR analysis of the relative mRNA expression of cGAS in the colonic tissue of humans with ulcerative colitis (UC) and control human tissue (n=8/group). (B) Western blot (WB) analysis of cGAS expression in human with UC and control human colonic tissue (n=7/group). (C) WB quantification of cGAS. (D) Immunofluorescence (IF) labeling of cGAS (red), e-cadherin (green), DAPI (blue), merged (yellow) in colon sections from humans with UC and control tissue; Scale bar represents 100 mm (n=4). (E) Quantification was performed by calculating percentage of cGAS positive intestinal epithelial cells compared to all intestinal epithelial cells. The data are representative of at least three independent experiments. Data represent the mean ± SD. * P < 0.05, ** P < 0.01, *** P < 0.001 by Student t test and Mann–Whitney.
Figure 2. cGAS is Upregulated in the Intestinal Epithelium of Mice Subjected to 2% Dextran Sodium Sulfate (DSS) Colitis.
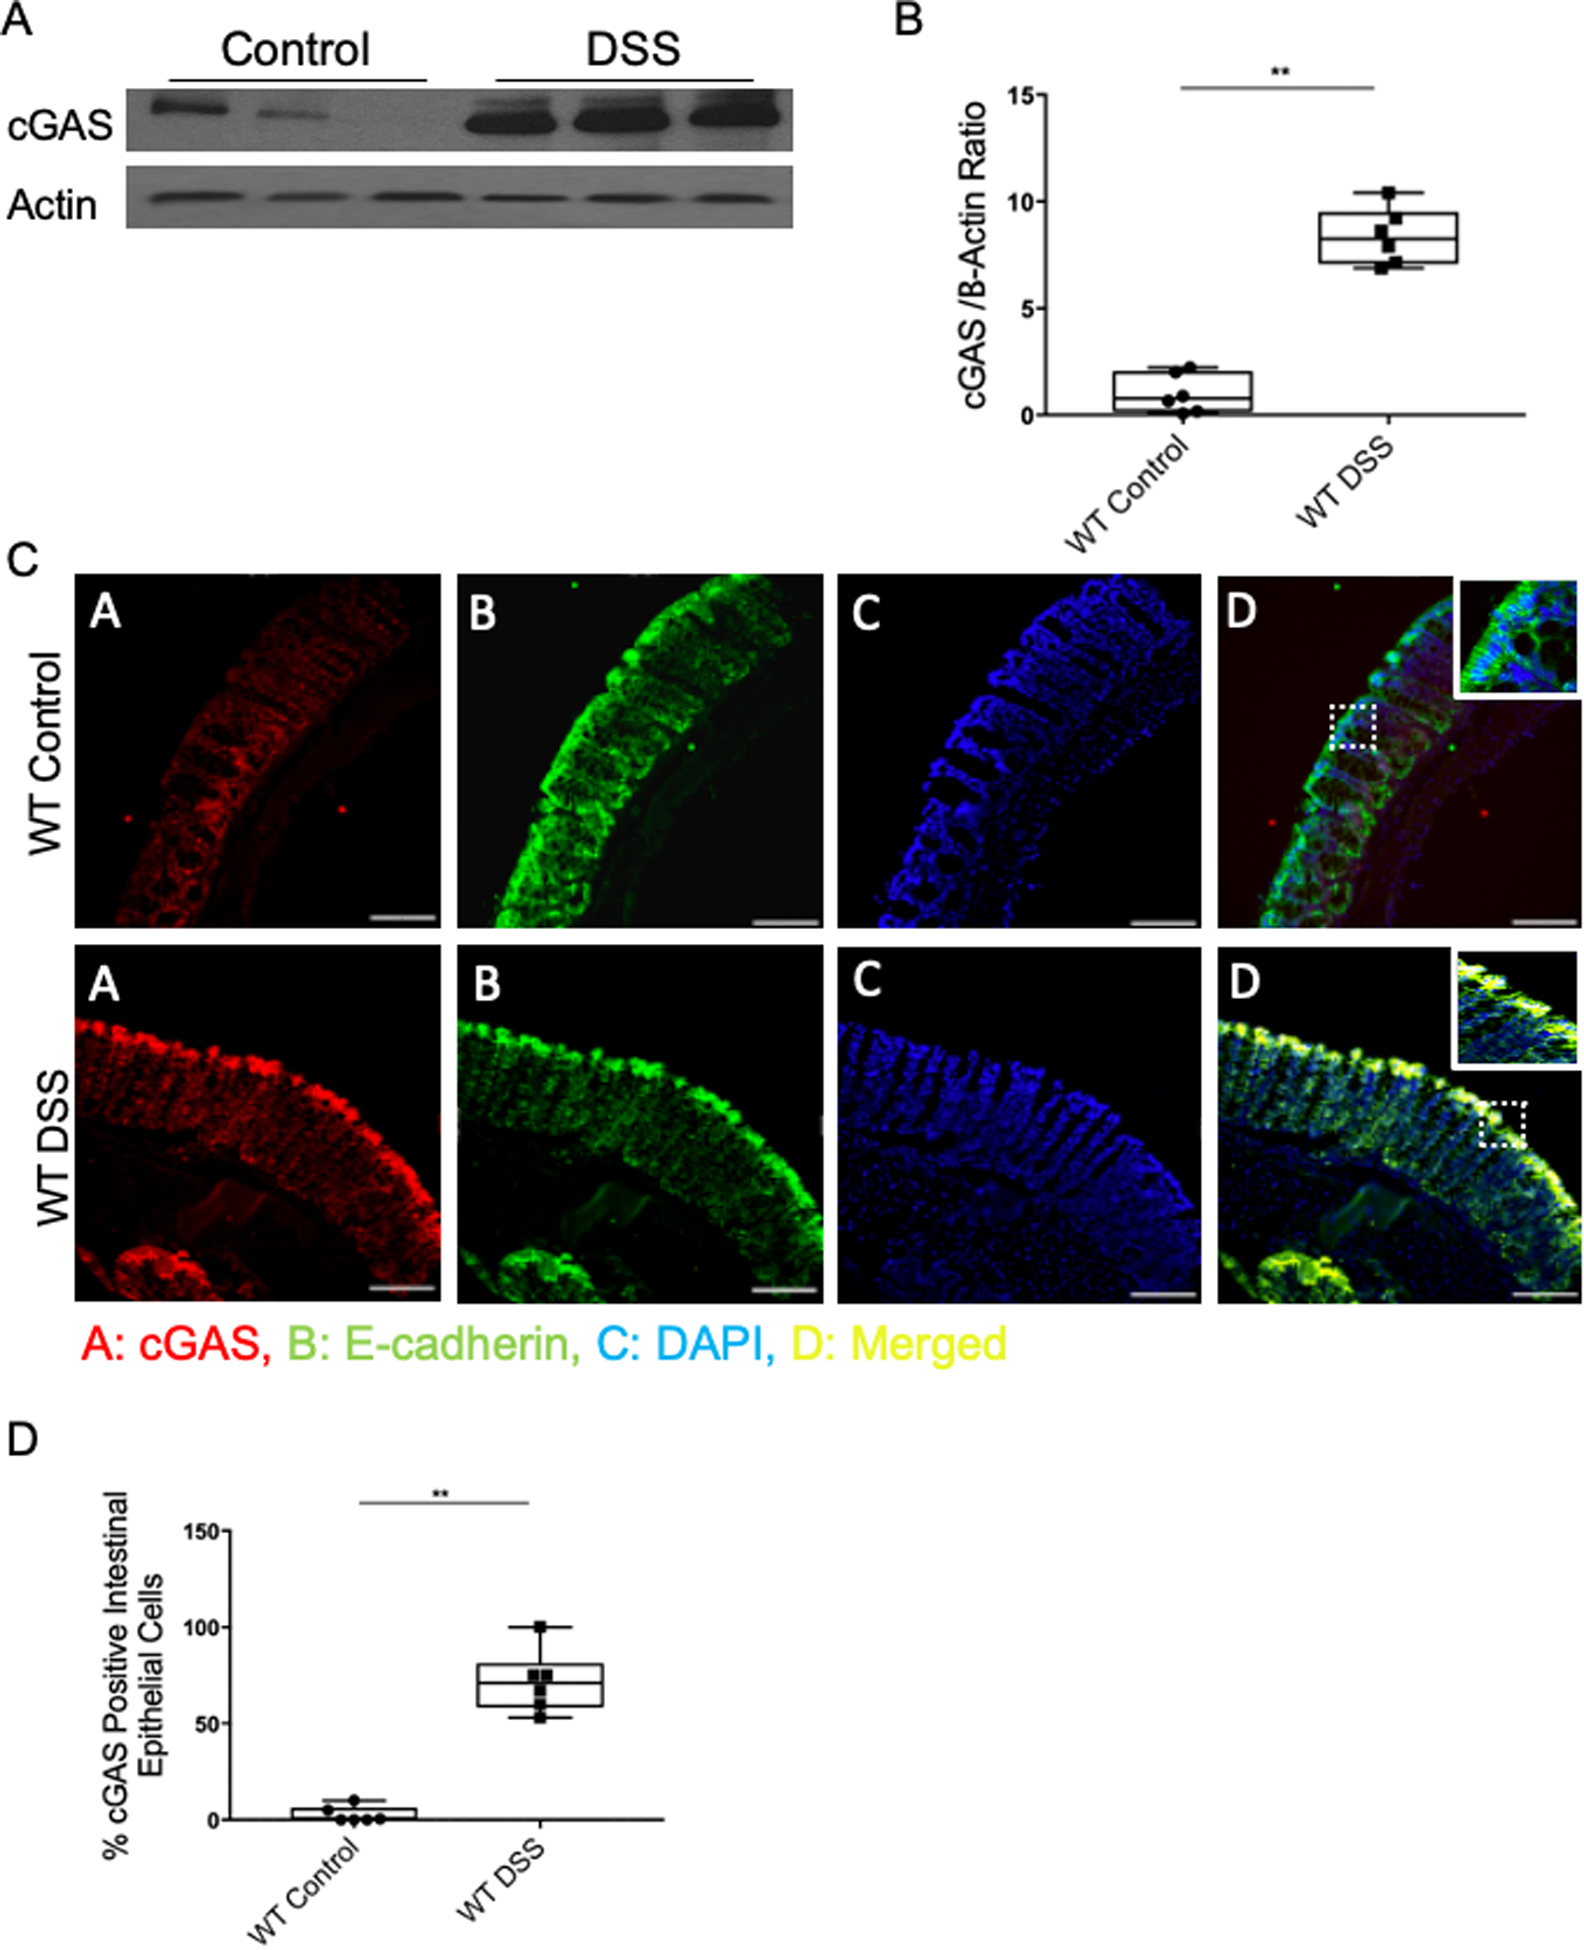
C57Bl/6J wild-type (WT) mice were subjected to a 2% DSS-induced colitis model for 7 days. (A) WB analysis of cGAS expression in WT control and DSS-treated mice (n=6). (B) WB quantification of cGAS. (C) IF labeling of cGAS (red), e-cadherin (green), DAPI (blue), and merged (yellow) in the intestinal epithelium of WT control and DSS-treated mice; Scale bar represents 300 mm (n=6). (D) Quantification was performed by calculating percentage of cGAS positive intestinal epithelial cells compared to all intestinal epithelial cells. The data are representative of at least three independent experiments. Data represent the mean ± SD.** P < 0.01 by Student t test and Mann–Whitney.
cGAS deficiency increased the severity of intestinal inflammation
In order to evaluate the role of cGAS in intestinal inflammation, we subjected mice that were deficient for cGAS (cGAS KO), as well as age- and gender-matched WT mice, to the 2% DSS colitis model. Each day the disease activity index (DAI) score, comprised of weight loss, stool consistency, and fecal blood, was calculated (26). Mice were euthanized on day 7 and colon lengths were measured as an additional surrogate for colitis severity. cGAS KO mice demonstrated more weight loss and significantly higher DAI scores as compared with WT mice subjected to colitis (Fig. 3A, B). cGAS KO mice also exhibited significantly shorter colons, signifying worse intestinal inflammation (Fig. 3C). Next, we performed histopathological analysis [hematoxylin and eosin (H&E) staining] to examine intestinal architecture. We found significantly increased intestinal inflammation, as exhibited by severe disruption of the intestinal epithelium, increased inflammatory cell infiltrate, and thickened lamina propria and muscularis mucosa in the intestines of cGAS KO mice subjected to DSS colitis as compared to WT mice (Fig. 3D). Scoring of slides by a blinded pathologist confirmed this result (Fig. 3E). RT-qPCR analysis of murine colonic tissue demonstrated significantly higher levels of pro-inflammatory cytokines, including Tnfα, Il6, Il1β, and Il18 in cGAS KO mice subjected to DSS-colitis as compared to WT mice (Fig. 3F–I). Together, these data demonstrate that cGAS KO mice are highly susceptible to DSS colitis. This suggests that the upregulation of cGAS that is a hallmark of human and murine colitis may serve important homeostatic roles during disease.
Figure 3. cGAS Deficiency Increased the Severity of Colitis.
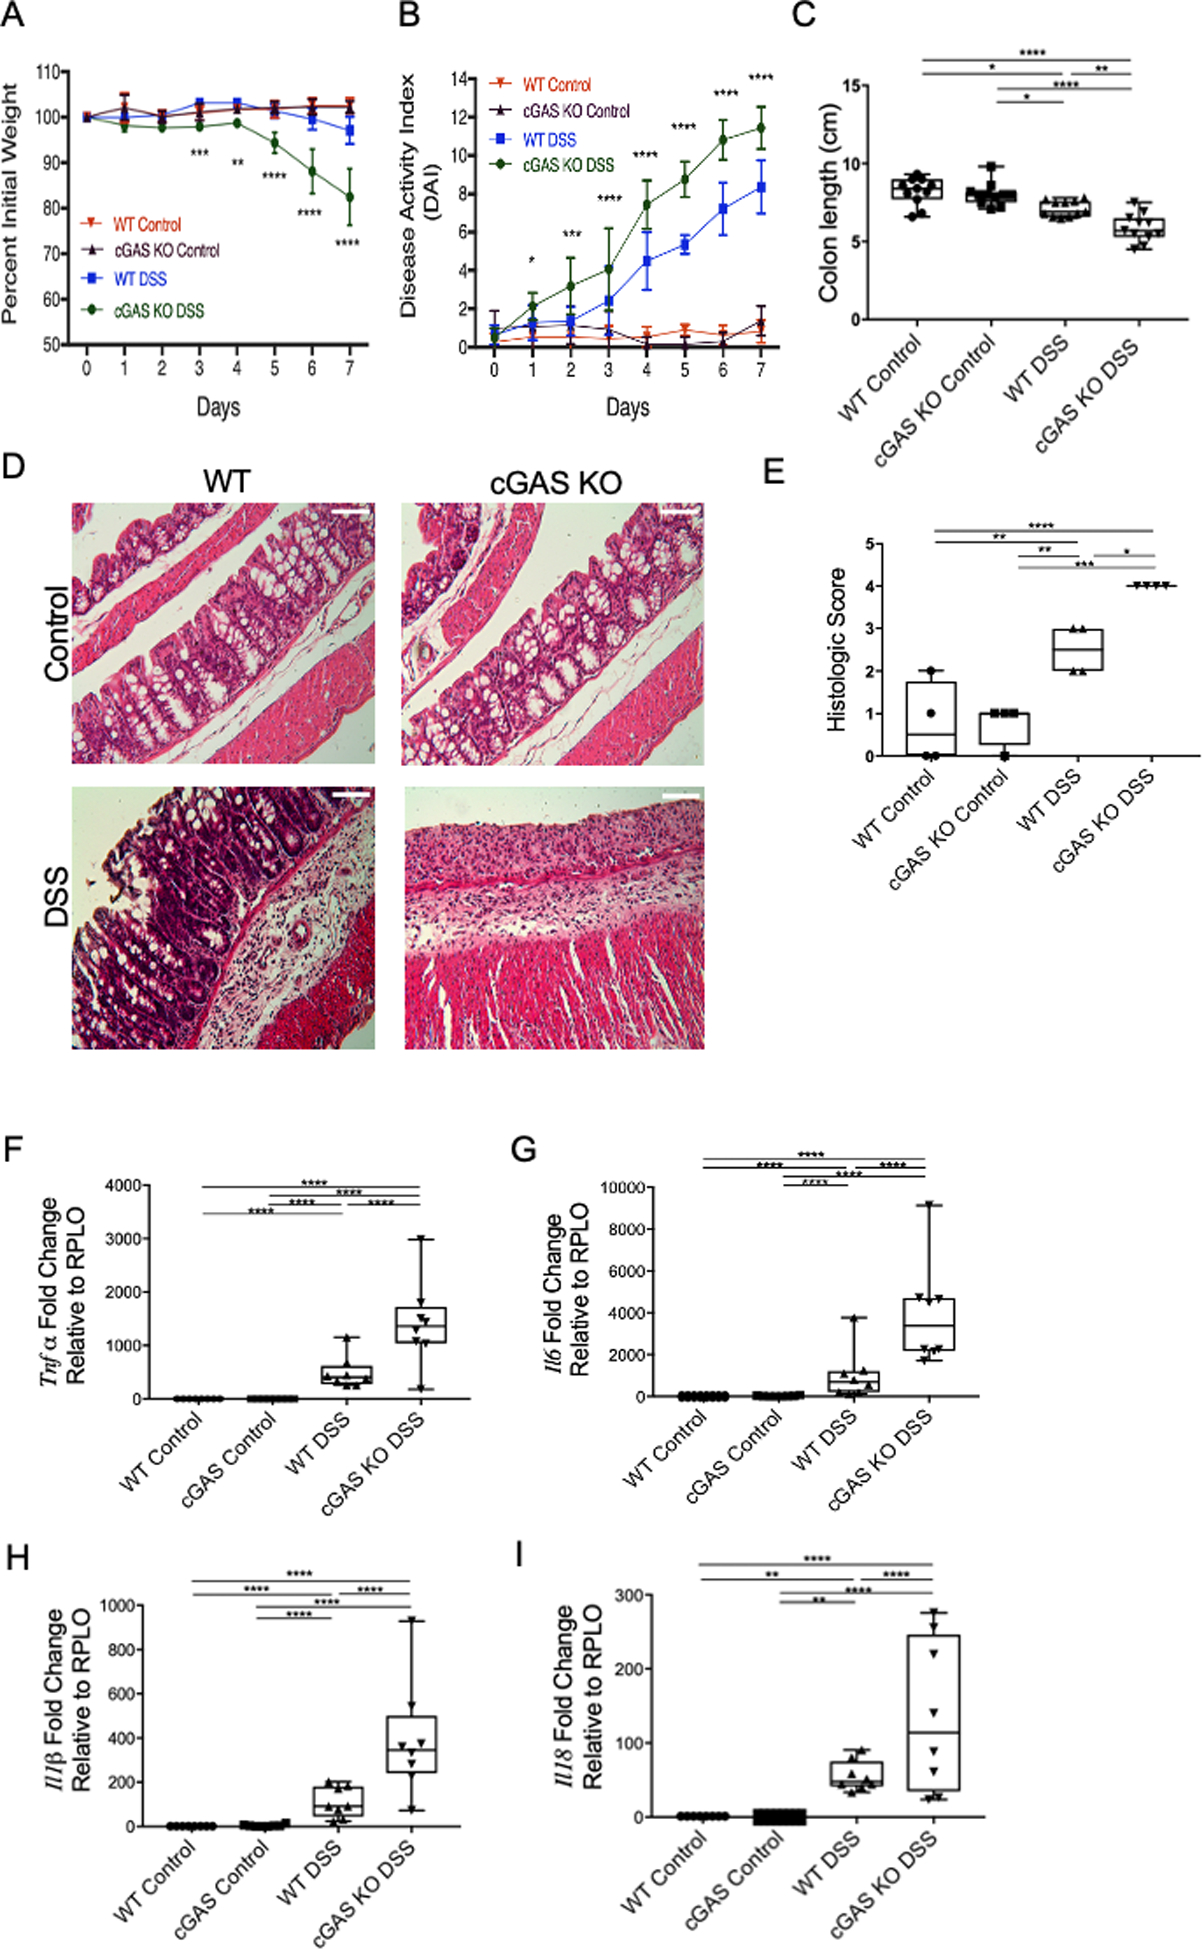
(A–B) Age- and gender-matched WT and cGAS KO mice were subjected to a 2% DSS-induced colitis model for 7 days and compared to their respective controls (n=11/group). Weight changes and DAI scores were measured daily. Asterix represent differences between cGAS KO DSS and WT DSS mice. Data represent the mean ± SD. * P < 0.05, ** P < 0.01, *** P < 0.001, and **** P < 0.0001 by two-way ANOVA followed by Tukey’s multiple-comparison test. (C) Colon lengths were measured after mice were euthanized on day 7 after DSS treatment (n=11/group). (D–E) Representative H&E staining of colon sections and blinded histology scores of WT control, cGAS KO control, WT mice subjected to DSS, and cGAS KO mice subjected to DSS. Scale bars represents 200 μm (n=4). (F–I) RT-qPCR analysis of relative mRNA expression of Tnfα (n=8), Il6 (n=8), Il1β (n=8), and Il18 (n=8) from WT control, cGAS KO control, WT DSS, and cGAS KO DSS mice. The data are representative of at least three independent experiments. Data represent the mean ± SD. * P < 0.05, ** P < 0.01, *** P < 0.001, and **** P < 0.0001 by one-way ANOVA followed by Tukey’s multiple-comparison test.
cGAS deficiency exacerbates DSS-induced colitis despite cohousing with wild type mice
Loss of specific cytoplasmic DNA sensing proteins have been shown to be associated with a shift in microbial communities towards more colitogenic bacteria such as entero-invasive E. coli that can accelerate DSS induced colitis (27). To determine the role of microbiota on the increased severity of colitis demonstrated in cGAS KO mice relative to WT mice, we performed a 4-week cohousing model. cGAS KO and WT mice were cohoused for 4 weeks (n=6), 3 mice per cage, after which they were subjected to the 7-day, 2% DSS colitis model. Fecal pellets were collected pre-cohousing and then 4 weeks after co-housing but prior to initiation of the DSS- induced colitis model. Microbiome profile analysis 16S ribosomal RNA (rRNA) gene sequence analysis was performed. Beta diversity analysis of bacterial communities (Bray-Curtis analysis) demonstrate that fecal samples from cGAS KO and WT mice clustered separately in Principal coordinate analysis (PCoA) space prior to cohousing (Fig. 4A) (ADONIS2 analysis, p-value=0.003, R2=0.638). After cohousing, samples from the same WT and cGAS KO mice no longer cluster separately in PCoA space (p-value>0.05) (Fig. 4B). Prior to cohousing, the relative abundance plot demonstrates cGAS KO mice to have a higher abundance of one family of commensal bacteria, S24–7 (Muribaculaceae), while WT mice have a higher abundance of Lactobacillaceae (Fig. 4C). No such differences are seen in the taxa after cohousing (Fig. 4C). Cohoused WT and cGAS KO mice were then subjected to the 2% DSS colitis model. DAI scores demonstrate continued worsened severity of colitis in cGAS KO mice when compared to WT mice (Fig. 4D, E). Our data suggest that the more severe colitis observed in cGAS KO mice likely cannot simply be explained by differential effects of the gut microbiome alone.
Figure 4. cGAS Deficiency Leads to Increased Severity of Colitis Despite Cohousing with WT Mice.
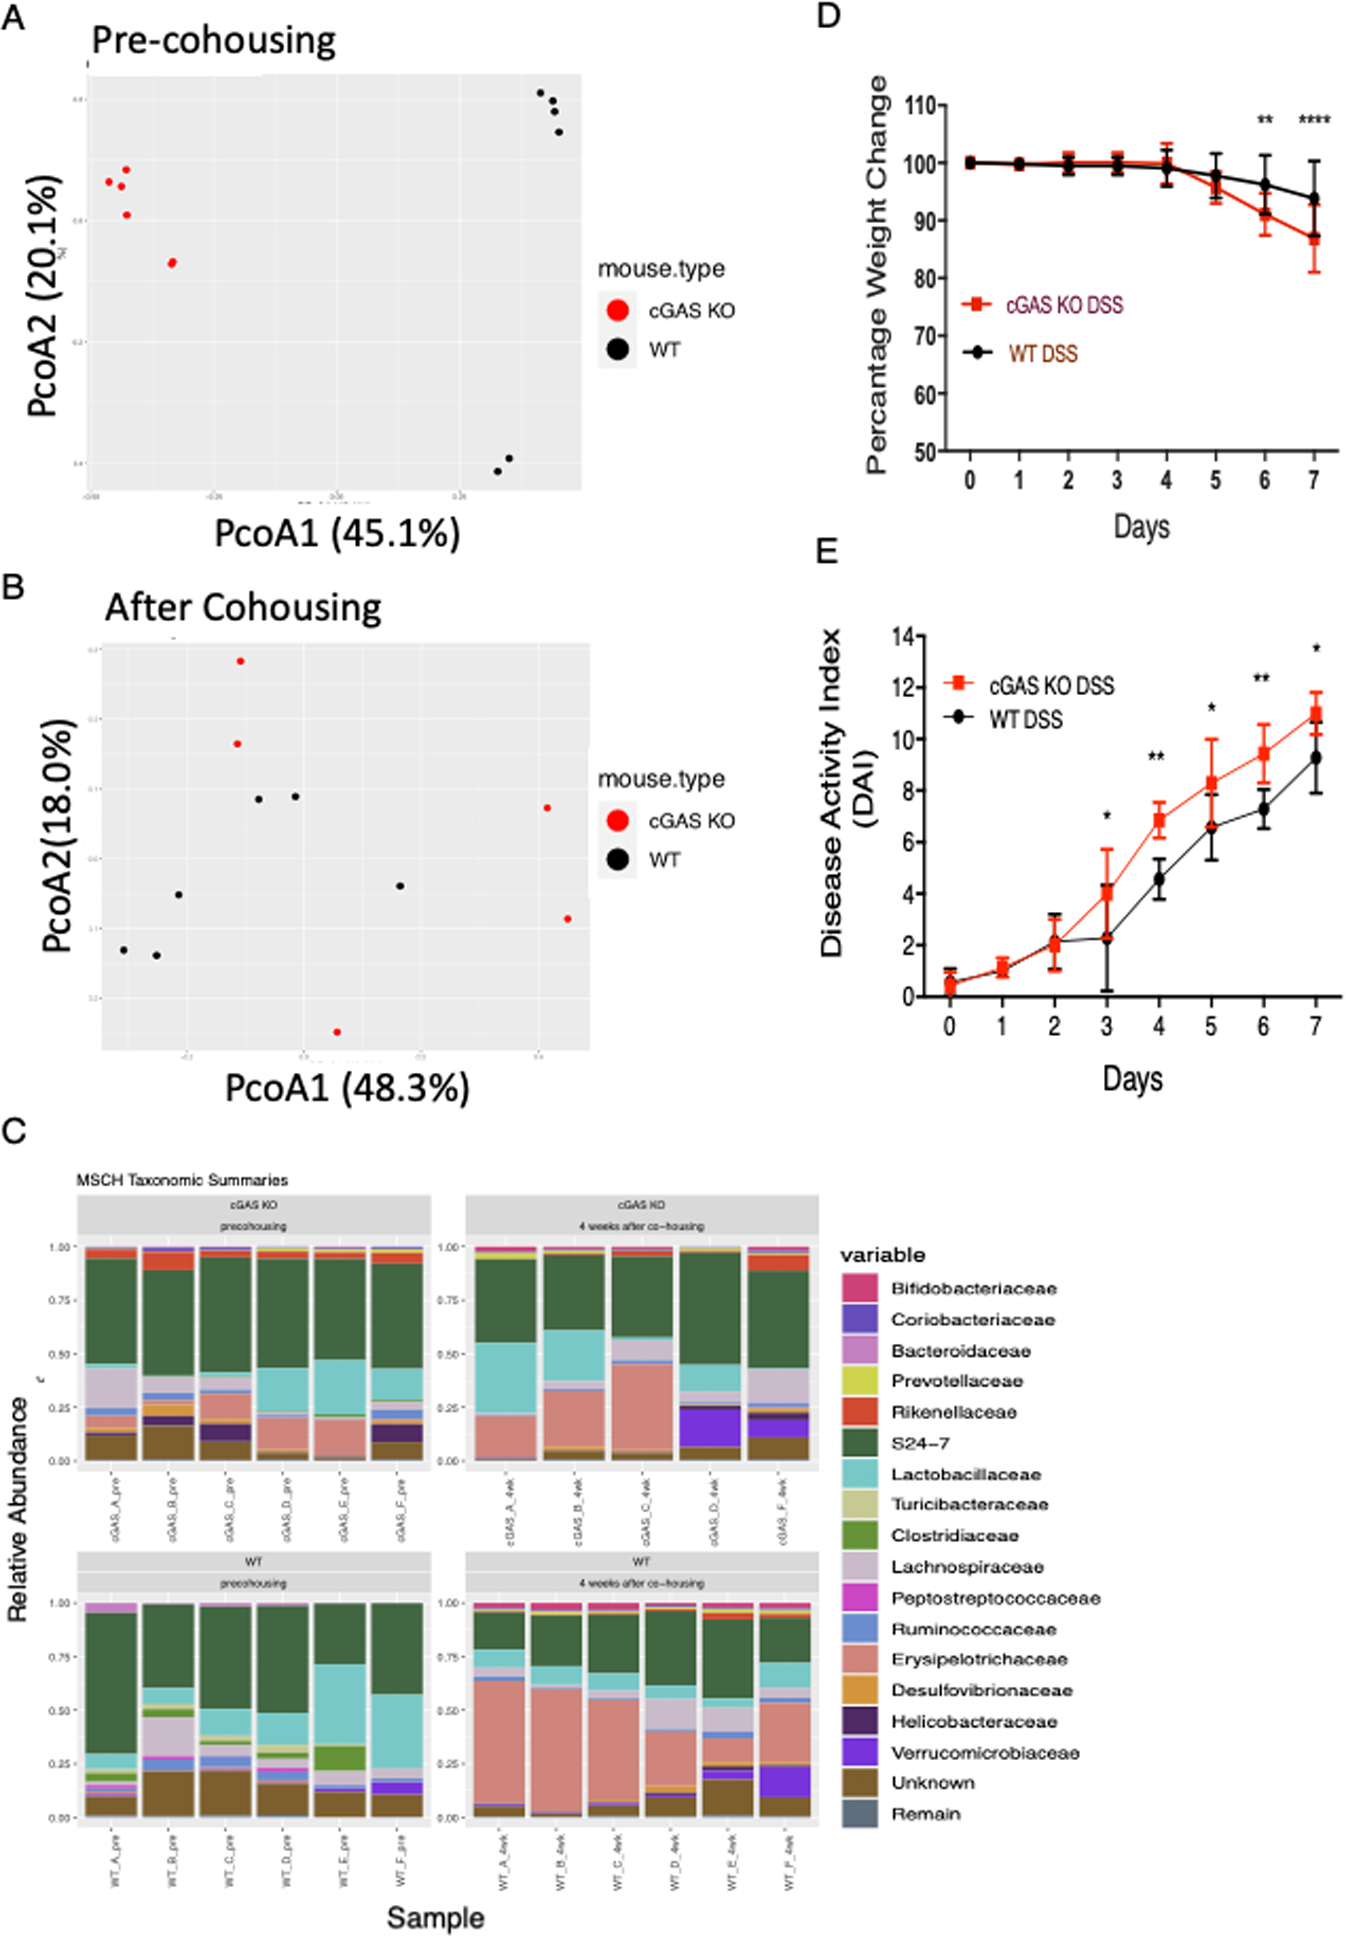
Age- and gender-matched male WT and cGAS KO mice were cohoused for 4 weeks. Fecal stool was collected prior to cohousing and 4 weeks after cohousing. Beta diversity of co-housed WT and cGAS KO mice represented by Principal Coordinates Analysis (PCoA) at (A) pre-cohousing and (B) 4 weeks after cohousing. Differences in genotypes were significant in samples from pre-housed mice (ADONIS2 test, p-value=0.003, R2=0.638), but not in samples from mice 4 weeks after cohousing (p-value > 0.05). (C) Relative abundance of major bacterial families relative to total bacteria in co-housed WT and cGAS KO mice. (D–E) A 7 day, 2% DSS-induced colitis model was performed on these WT and cGAS KO mice after being co-housed for 4 weeks (n=6). Weight changes and DAI scores were measured daily. The data are representative of two independent experiments. Data represent the mean ± SD. ** P < 0.01, *** P < 0.001, and ****P < 0.0001 by two-way ANOVA followed by Tukey’s multiple-comparison test.
cGAS deficiency is associated with decreased Beclin-1-mediated autophagy during intestinal inflammation
Dysregulation of autophagy pathway proteins have been implicated in a multitude of diseases, including IBD and have been shown to play significant roles in DSS-induced colitis (27–31). It was previously demonstrated that autophagy could be initiated via a direct interaction between cGAS and Beclin-1 in fibroblasts and BMDMs in vitro (16). Investigating this potential interaction in our model, we demonstrated an upregulation of Beclin-1 protein within the intestinal epithelium of WT mice during DSS-induced colitis (Fig. 5A). To determine if loss of cGAS compromised Beclin-1 expression and autophagy in vivo, we assessed the levels of key proteins involved in autophagy in cGAS-deficient mice treated with DSS, including Beclin-1, LC3-I, LC3II, and SQSTM1/p-62 (31). During autophagy, an LC3-I undergoes lipidation to yield the processed form, LC3-II. LC3-II contributes to the closure of autophagosomes and marks cargo proteins such as SQSTM1/p-62 for subsequent degradation. LC3-II is widely used as a quantitative marker of autophagy (32). SQSTM1/p-62 directly binds to LC3-II to facilitate the degradation of pathogenic substances. Build-up of or increased levels of SQSTM1/p-62 is another marker for autophagic dysfunction (33). We report lower levels of Beclin-1 protein and diminished LC3-II in cGAS KO mice subjected to DSS colitis as compared to WT mice subjected to DSS colitis (Fig. 5B–D). Simultaneously, we also demonstrate increased levels of SQSTM1/p-62 in cGAS KO mice subjected to DSS-induced colitis as compared to WT mice, again signifying autophagic dysfunction (Fig. 5B, E). As an alternate measurement of autophagy, we performed IF staining to assess the levels of LC3-I and -II within the colonic epithelium. Diffuse red staining signifies LC3-I and red punctum signify LC3-II (31). We found lower levels of LC3-II in the colonic epithelium of cGAS KO mice subjected to DSS colitis as compared to WT mice (Fig. 5F, G). Quantification of the IF images demonstrated significantly higher levels of LC3-II punctum in WT mice subjected to DSS colitis (Fig. 5F, G).
Figure 5. cGAS Deficiency is Associated with Decreased Beclin-1-mediated Autophagy During Intestinal Inflammation.
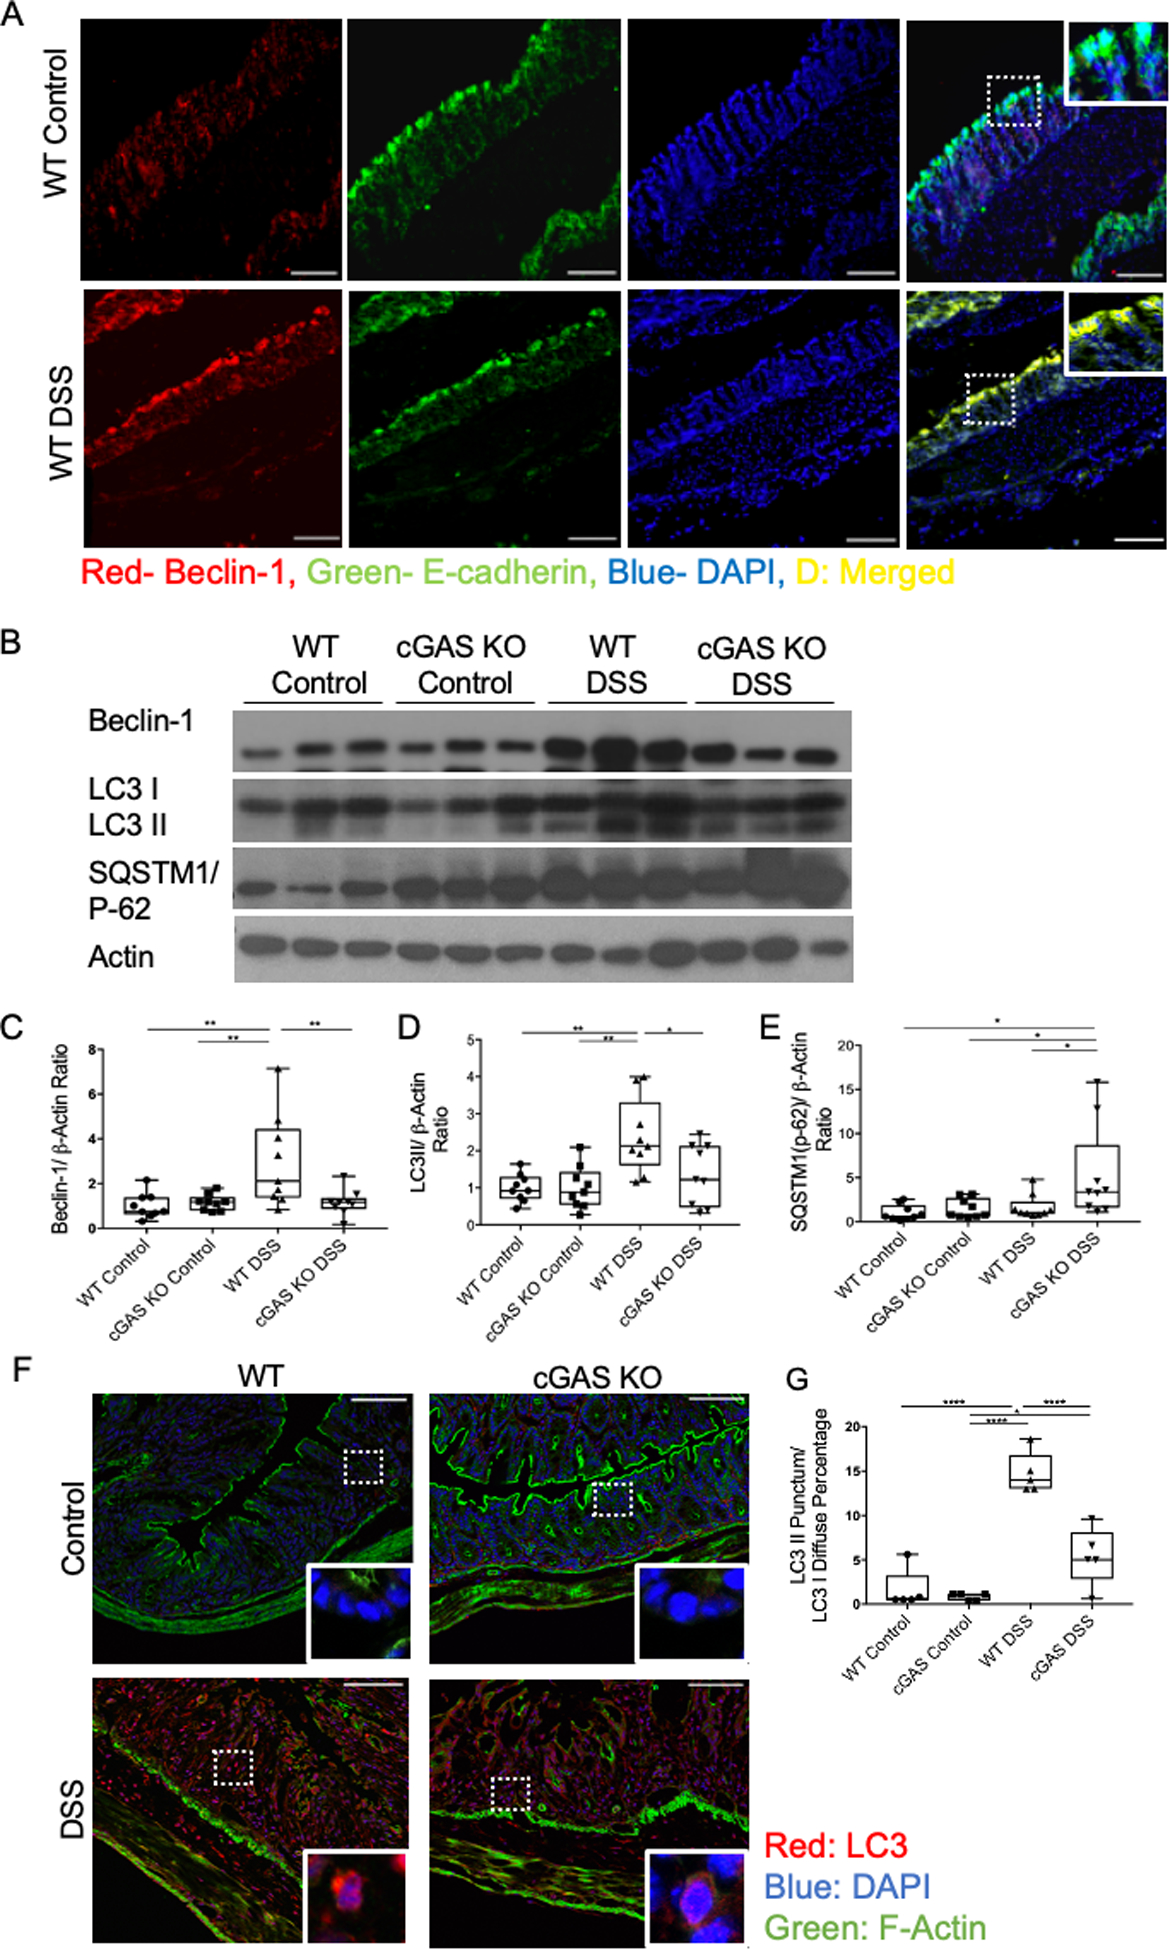
(A) Immunofluorescence (IF) labeling of beclin-1 (red), e-cadherin (green), DAPI (blue), and merged (yellow) in the intestinal epithelium of mice with and without DSS-induced colitis, scale bars represents 300 mm (n=4) (B) Western blot (WB) analysis of Beclin-1, LC3 I/II, and SQSTM1/p-62 in WT and cGAS KO mice subjected to DSS colitis and respective controls (n=9/group). (C–E) WB quantification for Beclin-1, LC3 II, and SQSTM1/p-62. (F) IF labeling of LC3I (diffuse red)/LC3II (red punctum), DAPI (blue),and actin (green) in WT and cGAS KO mice subjected to DSS colitis along with controls, scale bars represents 200 μm (n=5). (G) IF quantification of LC3-II punctum to LC3-I diffuse percentage. The data are representative of three independent experiments. Data represent the mean ± SD. * P < 0.05, ** P < 0.01, *** P < 0.001, and **** P < 0.0001, by an one-way ANOVA followed by Tukey’s multiple-comparison test.
cGAS interacts with Beclin-1 and upregulates autophagy
To understand how cGAS regulates autophagy, we assessed for direct binding between cGAS and Beclin-1 in IECs. Coimmunoprecipitation (coIP) showed that GFP-cGAS directly binds to HA-Beclin-1 in HCT-116 cells after transient over expression (Fig. 6A). This interaction continues to persist after stimulation with poly dA:dT, but interestingly it did not significantly increase (Fig. 6A).
Figure 6. cGAS Deficiency is Associated with Decreased Beclin-1-mediated Autophagy During Intestinal Inflammation.
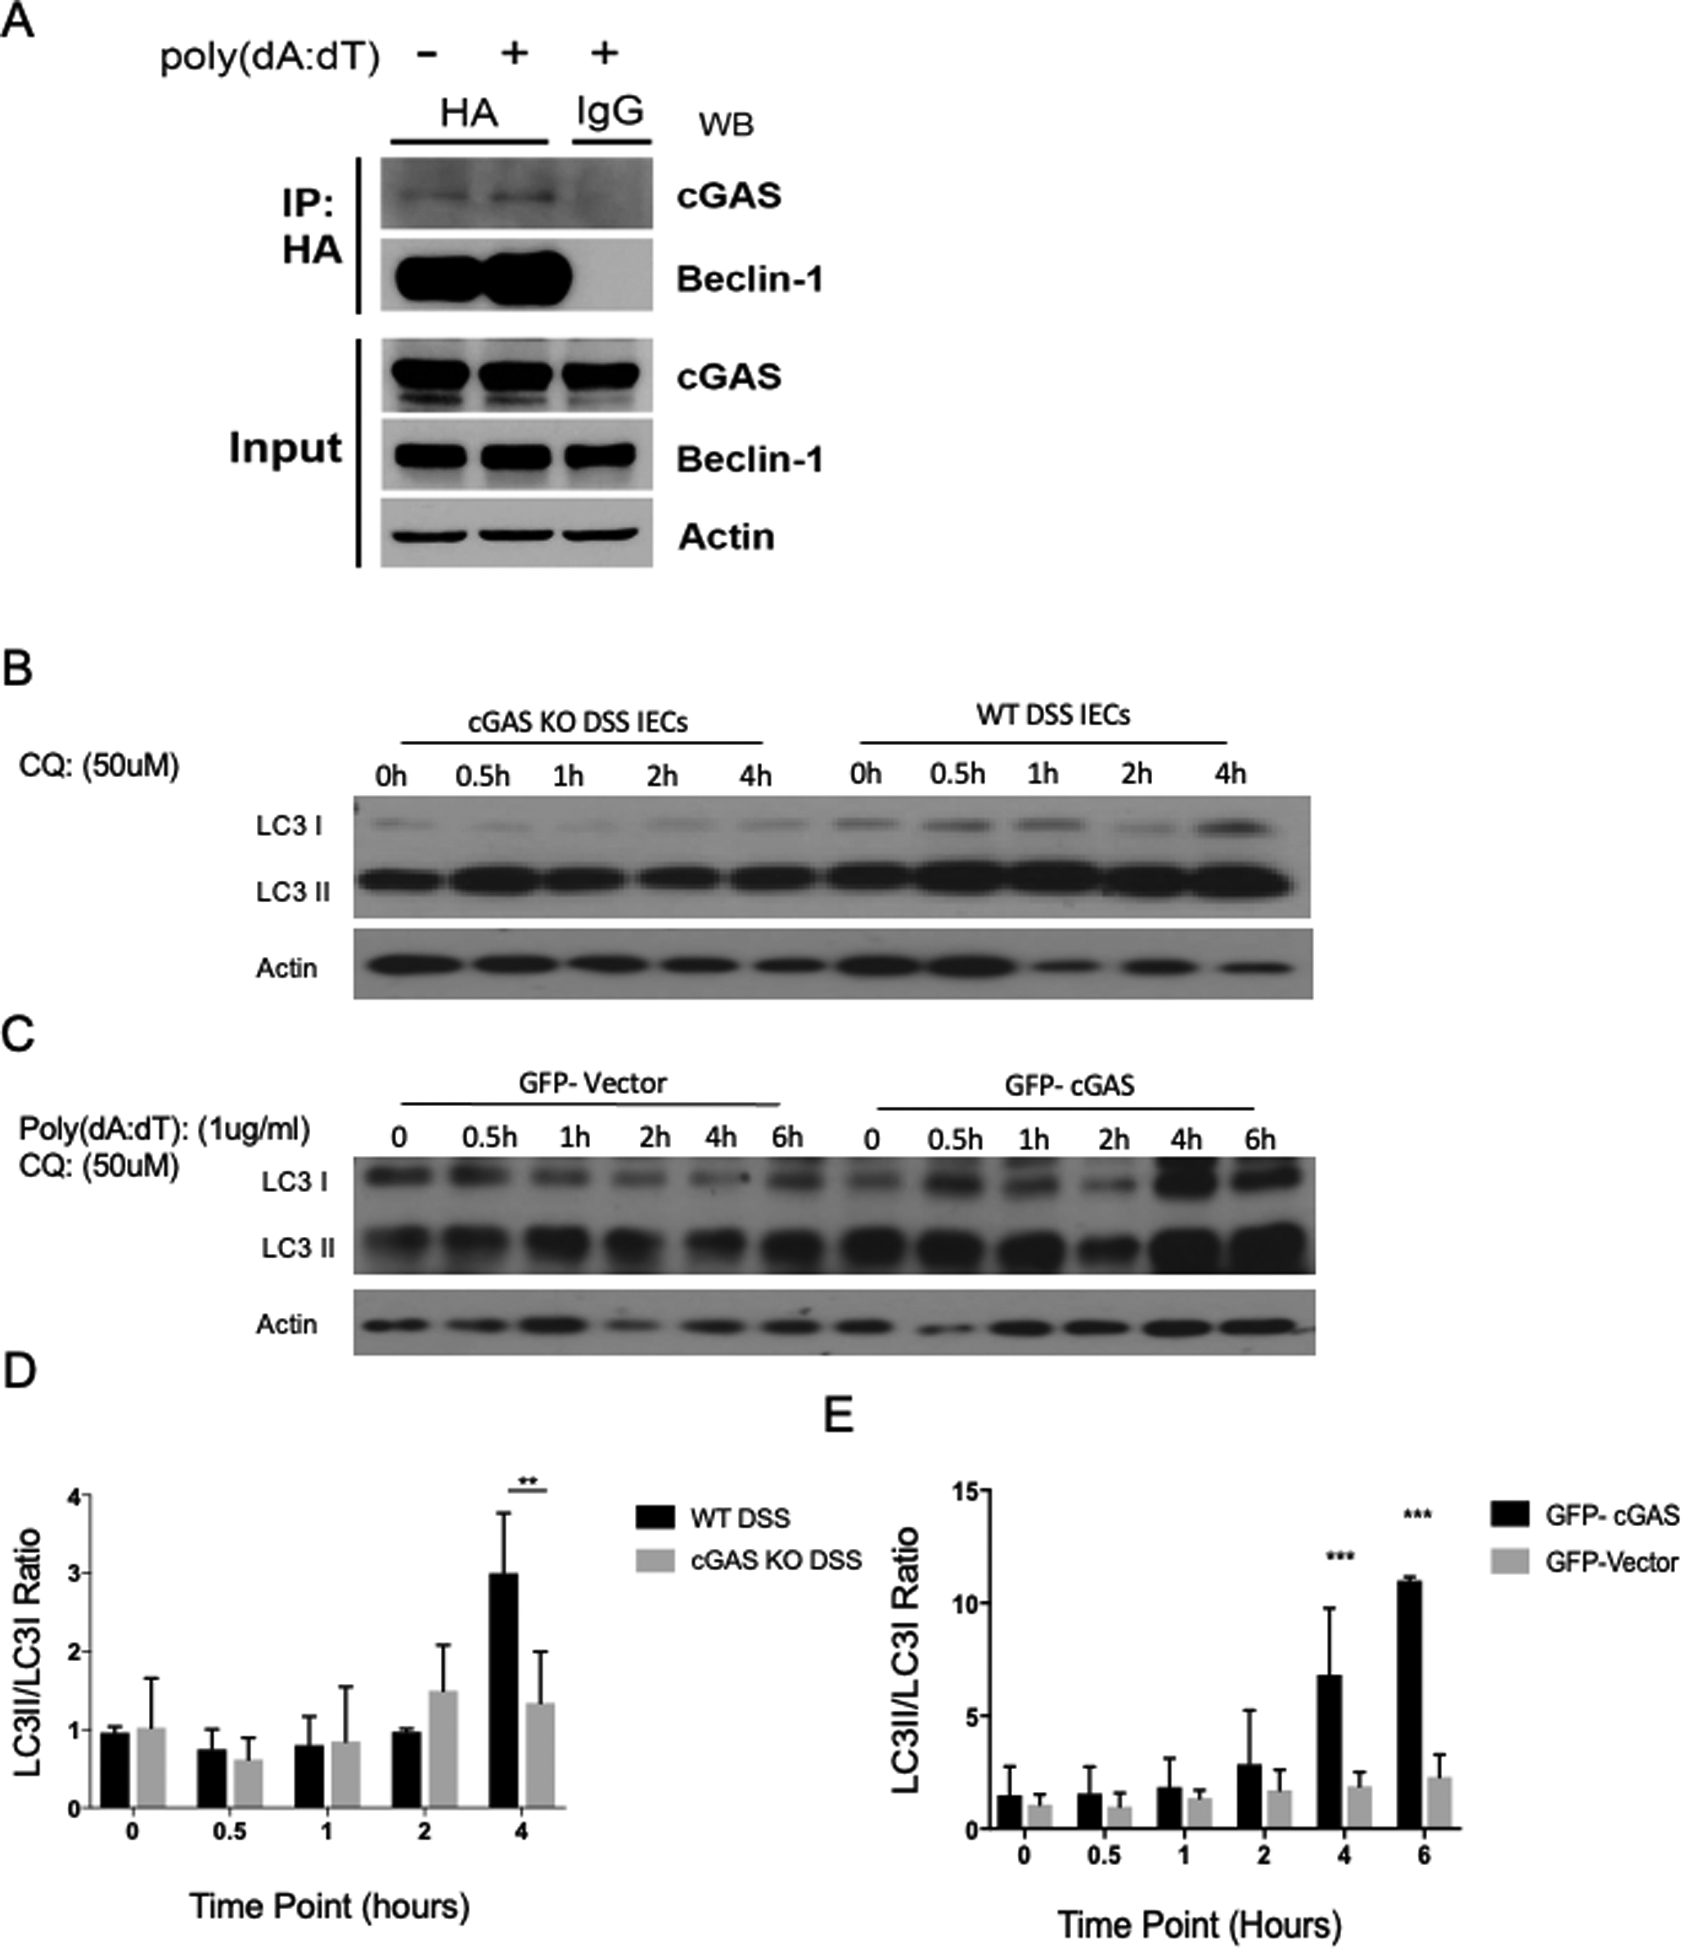
(A) HCT-116 cells were transfected with HA-tagged Beclin-1 and GFP-tagged cGAS plasmids and then stimulated with poly dA:dT. 24 hours after DNA stimulation, binding between cGAS and Beclin-1 was measured via co-IP (n=3). (B) Western blot (WB) analysis of LC3-I/II from intestinal epithelial cells (IECs) isolated from cGAS KO and WT mice subjected to a 4-day model of 2% DSS colitis. IECs were treated with chloroquine (CQ) 50mM and protein lysates were collected at time points 0, 0.5, 1, 2, 4 hours. (C) Western blot (WB) analysis of LC3-I/II from GFP-vector and GFP-cGAS transfected HCT-116 cells, stimulated with poly dA:dT, and treated with chloroquine (CQ) 50mM. Protein lysates were collected at time points 0, 0.5, 1, 2, 4, and 6 hours. (D) Quantification of LC3II/LC3I ratio of WB analysis of isolated IECs. (E) Quantification of LC3II/LC3I ratio of WB analysis of HCT-116 cells. The data are representative of three independent experiments. Data represent the mean ± SD. * P < 0.05, ** P < 0.01, *** P < 0.001, and **** P < 0.0001, by an one-way ANOVA followed by Tukey’s multiple-comparison test.
To evaluate the effect of cGAS on intestinal epithelial autophagy we performed western blot analysis of LC3 in IECs isolated from WT and cGAS KO mice subjected to a 2% DSS colitis model. These IECs were subsequently treated with the autophagy inhibitor, chloroquine. Chloroquine inhibits autophagic flux by decreasing autophagosome and lysosome fusion, allowing for the measurement of the LC3II/I ratio as a marker of autophagic dysfunction (34). We demonstrated no increase in the LC3II/I ratio in cGAS KO mice subjected to DSS colitis, whereas WT mice subjected to DSS colitis had a significant increase in the LC3 II/I ratio at 4 hours post treatment, signifying an increase in autophagy (Fig 6B, D). Similarly, we demonstrated a significant increase in LC3II/I ratio in HCT-116 cells transfected with GFP-cGAS compared to those transfected with a GFP-vector plasmid after stimulation w/ poly dA:dT and treatment w/ chloroquine (Fig. 6C, E). These data identify a novel and direct role for cGAS in the upregulation of Beclin-1-mediated autophagy within the inflamed intestinal epithelium.
cGAS deficiency is associated with increased intestinal epithelial cell death
Multiple studies have shown that defects in autophagy can increase cell death via apoptosis (35,36). To study the effects of cGAS deficiency on intestinal epithelial cell death, we performed a TUNEL assay. Our data demonstrate increased TUNEL staining in the cGAS KO mice subjected to DSS colitis as compared to WT mice similarly treated, signifying that cGAS deficiency increased intestinal epithelial cell death during inflammation (Fig. 7A, B). To determine if cell death was mediated via the apoptotic pathway, western blot analysis of cleaved caspase-3 was performed on tissues isolated from both cGAS KO and WT mice subjected to DSS colitis. Increased levels of cleaved-caspase-3 protein were observed in DSS-treated cGAS KO animals as compared to DSS-treated WT mice, consistent with our hypothesis (Fig. 7C, D). These results collectively highlight a cGAS-dependent link between autophagy and apoptosis in the inflamed intestinal epithelium of mice, and suggest that cGAS-dependent, Beclin-1-mediated autophagy helps to preserve intestinal epithelial homeostasis by limiting cell death.
Figure 7. cGAS Deficiency is Associated with Increased Cell Death.
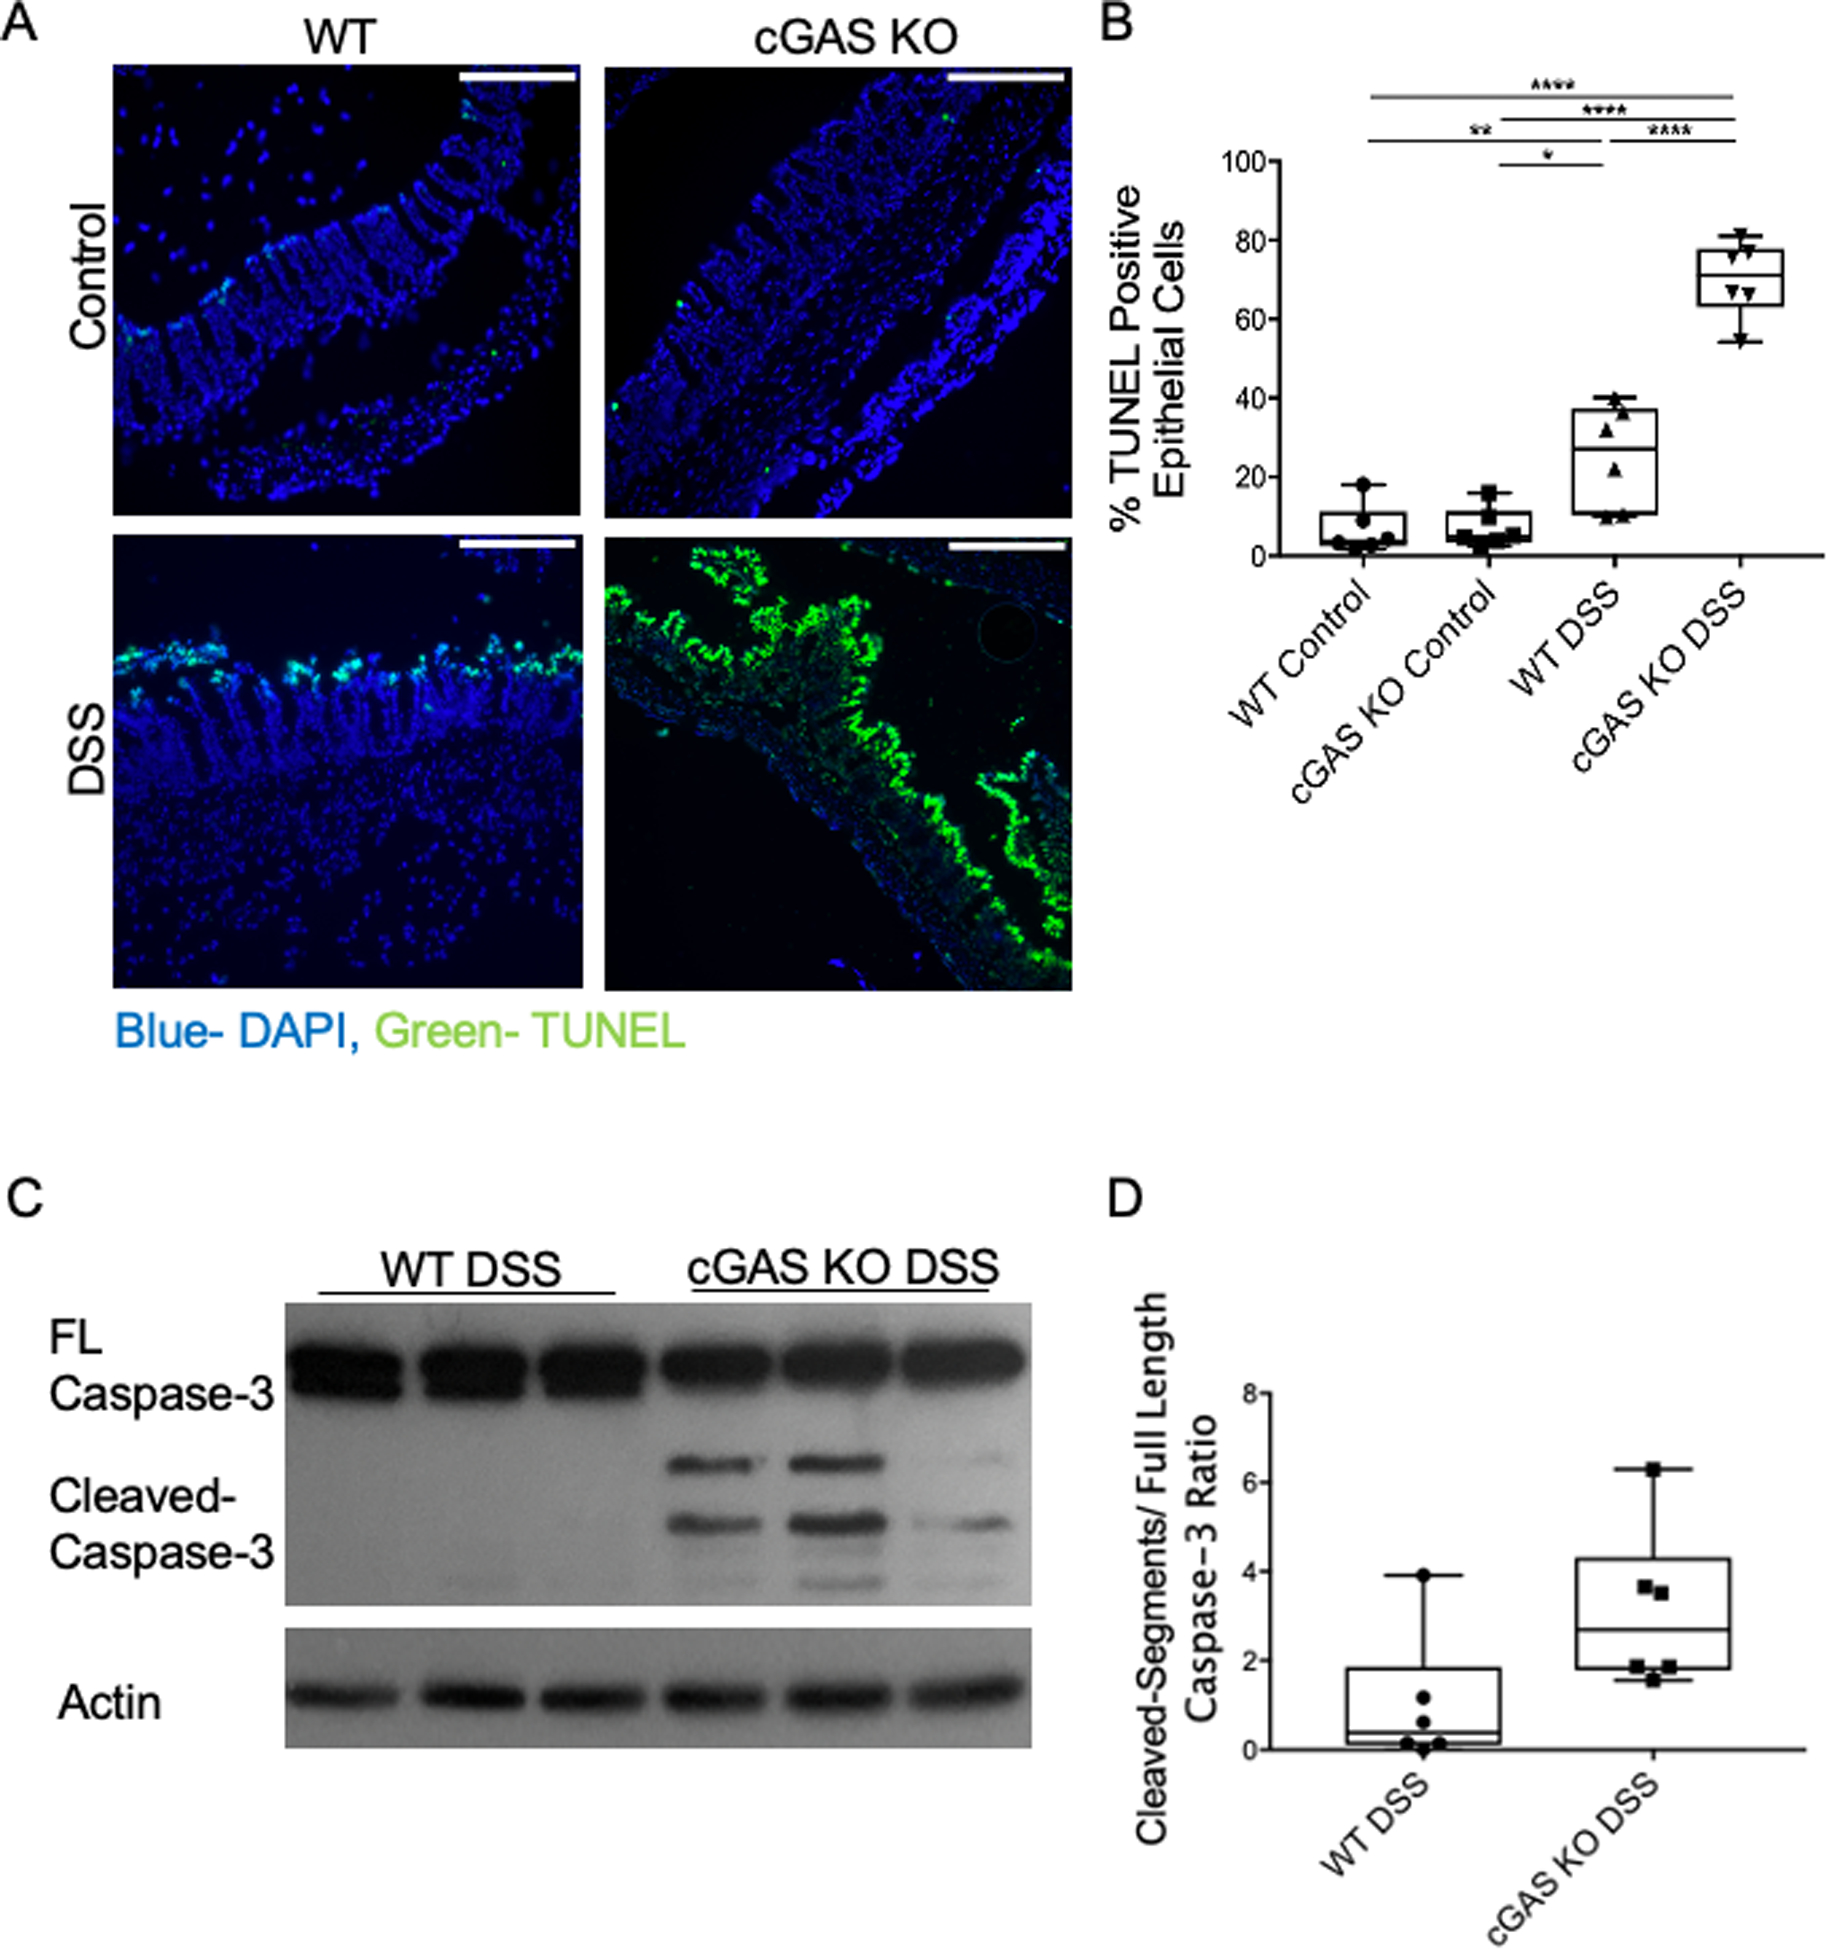
(A) Terminal deoxynucleotidyl transferase dUTP nick end labeling (TUNEL) staining of the intestinal epithelium of WT and cGAS KO mice subjected to DSS compared to their respective controls; TUNEL (green) and DAPI (blue); scale bars represent 500 μm (n=6/group). (B) Quantification was performed by calculating percentage of TUNEL positive epithelial cells compared to all epithelial cells. (K) WB analysis of cleaved caspase-3 in WT and cGAS KO mice subjected to DSS colitis (n=6). (C) WB quantification of cleaved caspase-3. (D) WB quantification for cleaved caspase-3. The data are representative of at least two independent experiments. Data represent the mean ± SD. * P < 0.05, ** P < 0.01, *** P < 0.001, and **** P < 0.0001, by an one-way ANOVA followed by Tukey’s multiple-comparison test.
cGAS deficiency does not diminish STING-mediated IFN signaling in the intestine of DSS-treated mice
Unlike cGAS, which is activated only by double-stranded DNA, STING is activated both by cyclic di-nucleotides (CDNs), such as cGAMP as well as DNA. Studies have demonstrated contradictory findings on the relationship between cGAS and STING during inflammation. One study reported a complete lack of a type I IFN response in cGAS-deficient mice, while another showed that cGAS plays an insignificant role in STING-mediated IFN activation (18,37). Our data demonstrate no difference in Sting, Irf-3, or IFN-β mRNA levels in WT mice subjected to DSS-induced colitis as compared to cGAS KO mice subjected to DSS-induced colitis (Fig. 8A–C). However, we do demonstrate increased levels of STING protein in cGAS KO mice subjected to DSS-induced colitis compared to WT mice similarly treated (Fig. 8D, E). Consistent with mRNA data, there were no significant differences in the ratio of phosphorylated IRF-3/Total-IRF-3 protein between cGAS KO and WT mice subjected to DSS-induced colitis (Fig. 8D, F). Finally, to study downstream IFN signaling, we performed qPCR analysis of CXCL10 and ISG15, two known interferon stimulated genes (ISGs) and found no significant differences in gene expression between cGAS KO and WT mice subjected to DSS colitis (38, 39). Despite DSS-treated cGAS KO animals having elevated levels of STING protein levels in the intestine, we do not observe differences in downstream protein levels of phosphorylated IRF-3 or gene expression of IFN-β or ISGs. These data suggest that the observed increase in disease severity and intestinal inflammation observed in the DSS-treated cGAS KO animals likely occurs independent of STING signaling.
Figure 8. cGAS deficiency does not impact STING-mediated IFN signaling in the intestine of DSS-treated mice.
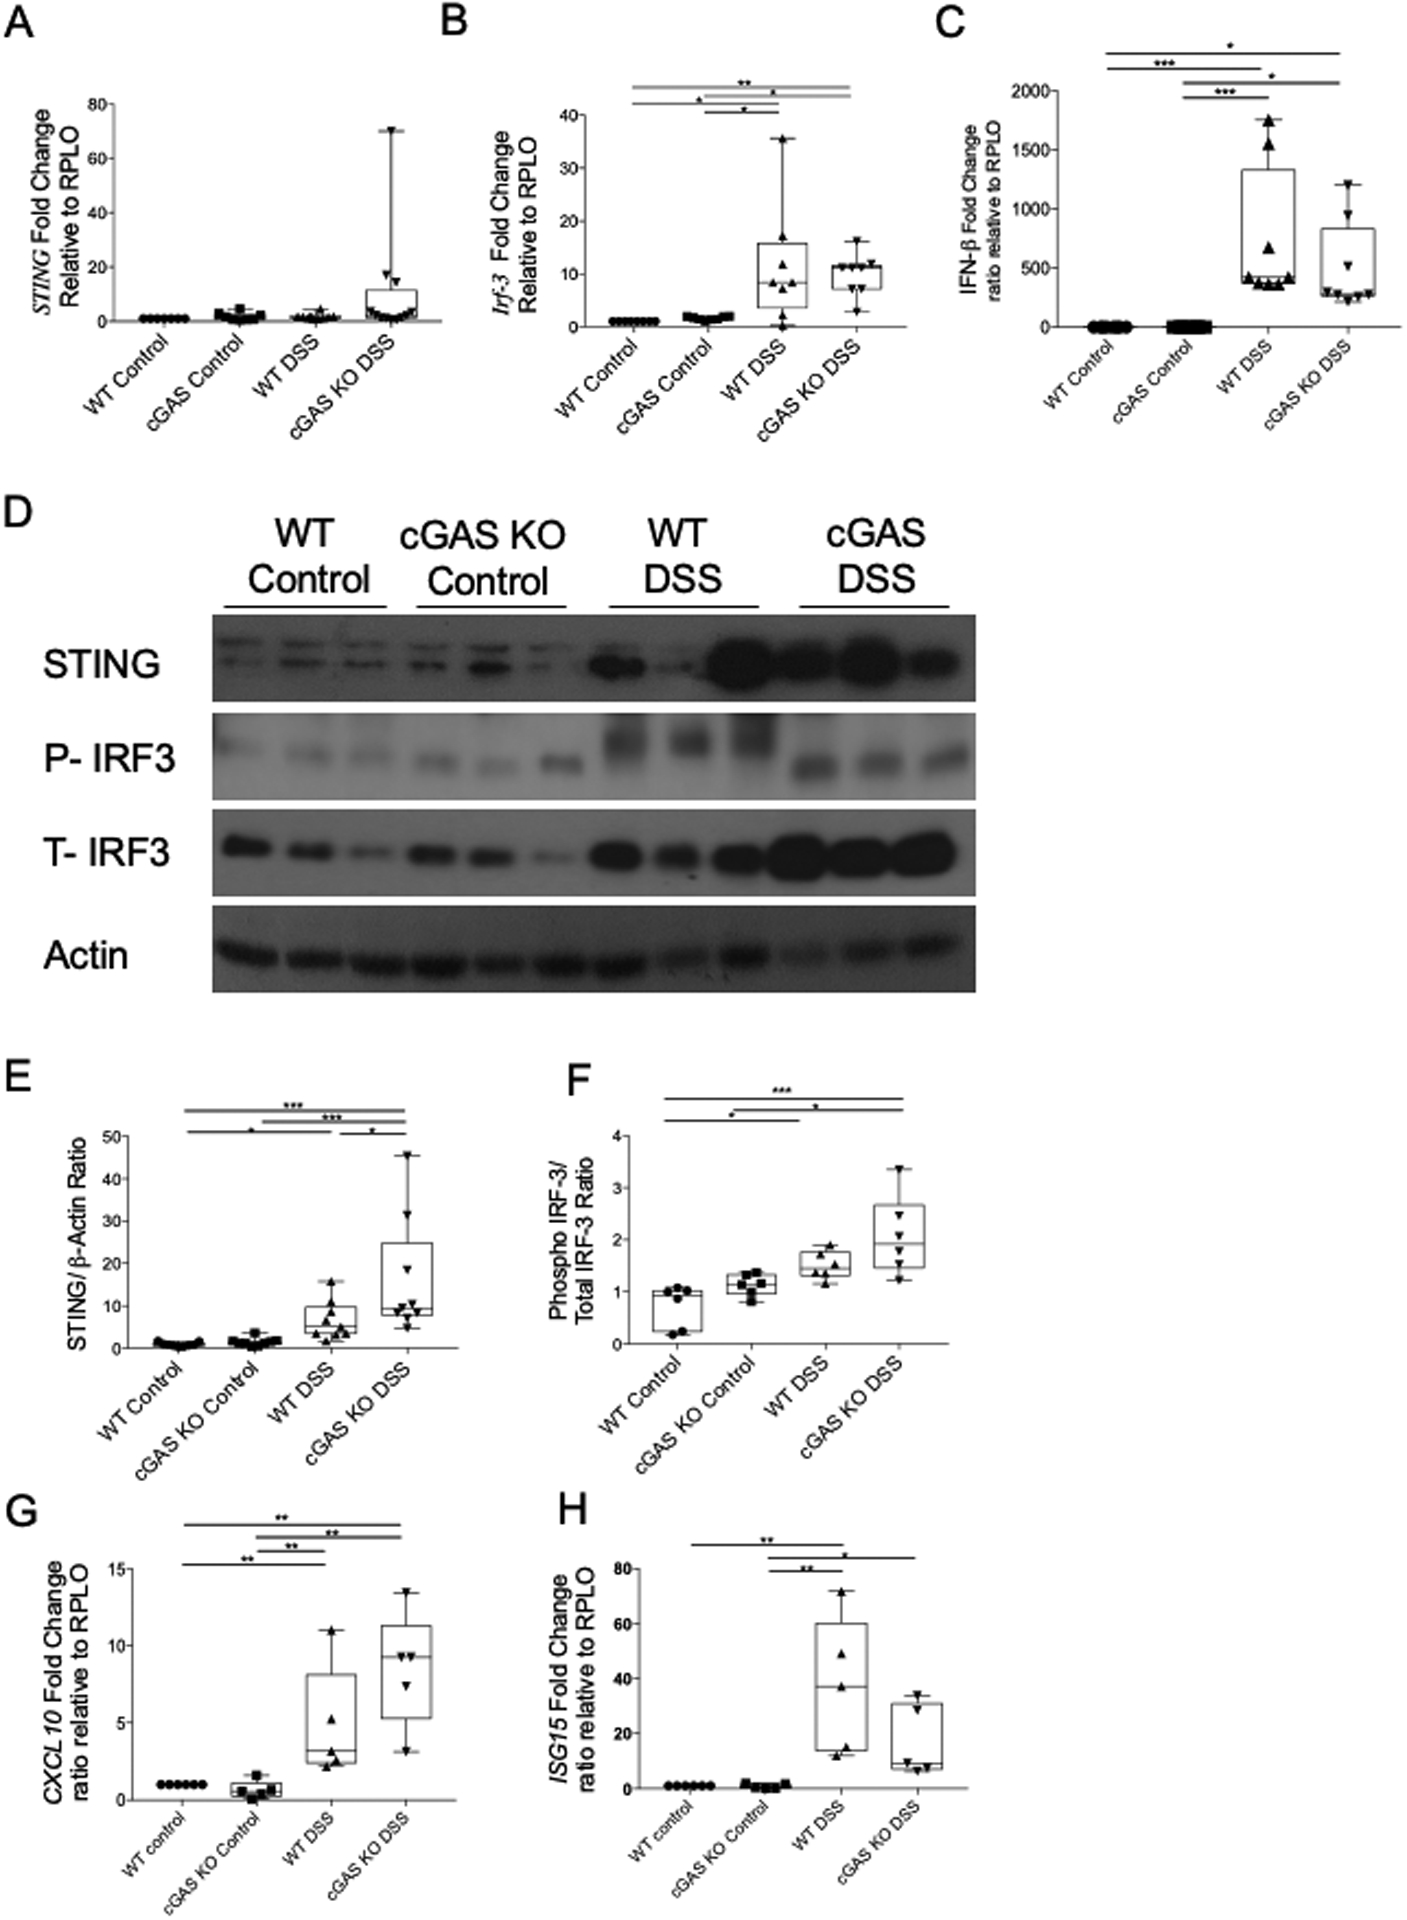
(A-C) RT-qPCR analysis of relative mRNA expression of Sting, IRF3, and IFN-β in colonic tissues of cGAS KO and WT mice subjected to a 7-day 2% DSS-induced colitis and their respective controls (n=8/group). (D) Western blot (WB) analysis of STING and P-IRF3/T-IRF3 in cGAS KO mice subjected to DSS induced colitis as compared to WT mice subjected to DSS induced colitis and their respective controls (n=9/group). (E, F) WB quantification for STING and P-IRF3/T-IRF3. These data are representative of at least three independent experiments. (G-H) RT-qPCR analysis of relative mRNA expression of CXCL10 and ISG15 in colonic tissues of cGAS KO and WT mice subjected to a 7-day 2% DSS-induced colitis and their respective controls (n=6/group). These data are representative of at least two independent experiments. Data represent the mean ± SD. * P < 0.05, ** P < 0.01, *** P < 0.001, and **** P < 0.0001 by an one-way ANOVA followed by Tukey’s multiple-comparison test.
Restoration of autophagy via rapamycin treatment dampens DSS-induced colitis severity in cGAS KO mice
Rapamycin, a known inducer of autophagy, is shown in clinical studies to be successful in treating a small cohort of patients with refractory IBD (40–44). Some studies investigated the use of rapamycin in patients with IBD and reported rapamycin to be an effective pharmacologic agent for patients with refractory IBD or IBD-related gastrointestinal strictures (45, 46). What is yet to be determined from these studies is the reason why certain patients benefit from rapamycin while others do not. The mechanism behind the perceived benefits of rapamycin in refractory IBD is unknown. Based on the published literature and our data demonstrating that cGAS deficiency is associated with diminished autophagy and an increased severity of colitis, we hypothesized that treatment with rapamycin would attenuate the severity of colitis in cGAS-deficient mice. Thus, we subjected both WT and cGAS KO mice to a 7-day, 2% DSS colitis model with an intraperitoneal injection of rapamycin (2 mg/kg dissolved in phosphate-buffered saline (PBS)) or PBS alone (vehicle) daily from days 0–6 (47). Body weights and DAI scores were calculated daily for all experimental groups. Our data demonstrated that rapamycin treatment significantly improved the colitis severity in DSS-treated cGAS KO mice (Fig. 9A, B). The average DAI score on day-seven for cGAS KO DSS + PBS group was 11.9 compared to 10.1 for cGAS KO DSS + rapamycin group (p=0.0086). In fact, rapamycin treatment improved the day-seven DAI score in DSS-treated cGAS KO animals to levels similar to that of WT mice subjected to DSS receiving either rapamycin (DAI score=9.64, p=0.963) or PBS treatment (DAI score=9.88, p=0.523) (Fig. 9A, B). Interestingly, rapamycin treatment did not significantly change the colitis severity in WT mice subjected to DSS-induced colitis (p=0.954). To measure the effects of rapamycin on the diminished autophagy associated with cGAS deficiency we performed WB analysis of LC3-II and SQSTM1/p-62 on colonic protein lysates isolated from all experimental groups. We demonstrate that treatment with rapamycin increased the levels of LC3II in both cGAS KO and WT mice subjected to DSS colitis (Fig 9C, D). As demonstrated earlier, there is an increase in protein levels of SQSTM1/p-62 in cGAS KO mice subjected to DSS colitis compared to WT mice. Treatment with rapamycin decreased protein levels of SQSTM1/p-62 in cGAS KO mice subjected to DSS colitis but did not significantly alter the protein levels in WT mice subjected to DSS colitis. To further delineate the effects of rapamycin on autophagy, GFP-cGAS transfected HCT-116 cells were stimulated with poly dA:dT and treated with chloroquine and rapamycin. WB analysis of LC3 I and II from protein lysates collected at various time points were performed and compared to protein lysates from GFP-vector plasmid transfected HCT-116 cells (Fig. 9E, F). Our data demonstrate that rapamycin increases the LC3II/I ratio in both GFP-cGAS transfected and GFP-vector plasmid transfected HCT-116 cells at 6 hours. Lastly, we assessed the effect of rapamycin treatment on the gene expression of pro-inflammatory cytokines, TNFα and IL6. As previously demonstrated, we show an upregulation of TNFα and IL6 in cGAS KO mice subjected to DSS compared to WT mice subjected to DSS colitis. Treatment with rapamycin significantly decreased levels of these pro-inflammatory cytokines in cGAS KO mice but not in WT mice subjected to DSS colitis. To assess for the effects of PBS or rapamycin treatment alone, we subjected cGAS KO and WT mice to normal drinking water with either PBS or rapamycin treatment alone. Our data demonstrates no significant differences in percent weight change, DAI scores, LC3II or SQSTM1/p-62 protein levels with PBS or rapamycin treatment alone (Supplementary Fig. 1). These data together show that although rapamycin upregulates autophagy despite the presence of cGAS, the clinical improvement in disease severity was only demonstrated in cGAS deficient mice, suggesting that the benefits of rapamycin in the amelioration of colitis severity may be limited to those with a deficiency in autophagy as seen in cGAS KO mice.
Figure 9. Treatment with Rapamycin Decreased DSS-induced Colitis in cGAS KO Mice.
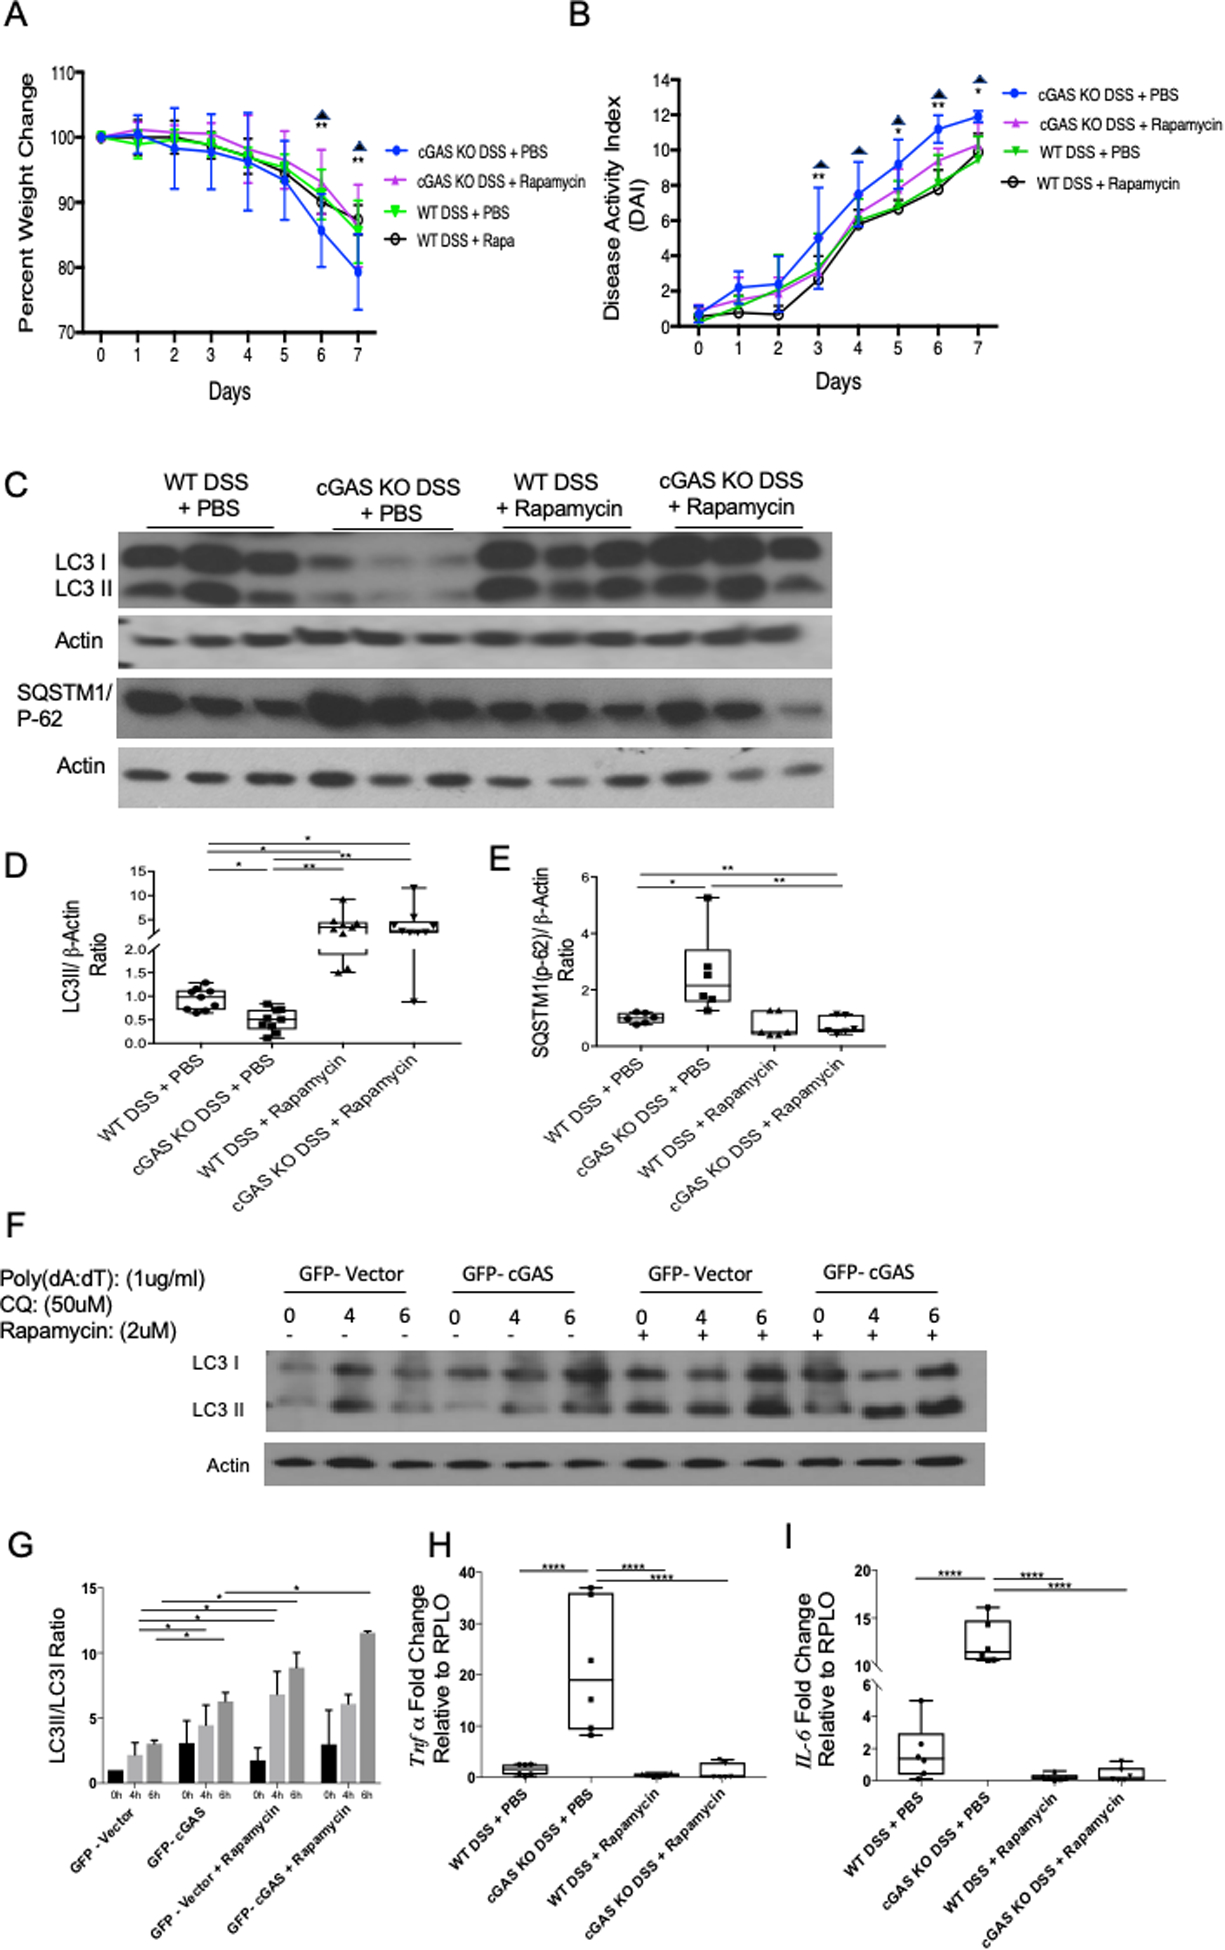
Age- and gender-matched WT and cGAS KO mice were subjected to a 2%, 7-day DSS colitis model. Mice were simultaneously treated with an intraperitoneal injection of rapamycin (2 mg/kg dissolved in PBS) or PBS alone days 1–6 (n=9/group). (A, B) Weight changes and DAI scores were measured daily. The data are representative of at least three independent experiments. Data represent the mean ± SD. * P < 0.05, ** P < 0.01, by two-way ANOVA followed by Tukey’s multiple-comparison test. Asterisks represent significant differences between cGAS KO DSS + PBS vs. cGAS KO DSS + Rapamycin. Triangles represent significant differences between cGAS KO DSS + PBS vs. WT DSS + PBS. (C) Western blot (WB) analysis of LC3II/LC3I, and SQSTM1/p-62 (n=9). (D, E) WB quantification for LC3 II and SQSTM1/p-62. (F) Western blot (WB) analysis of LC3-I/II from GFP-vector and GFP-cGAS transfected HCT-116 cells, stimulated with poly dA:dT, and treated with chloroquine (CQ) 50mM and rapamycin 2mM. Protein lysates were collected at time points 0, 4, and 6 hours. (G) Quantification of LC3II/LC3I ratio of WB analysis of HCT-116 cells. (H, I) RT-qPCR analysis of relative mRNA expression of Tnfα (n=6) and Il6 (n=6) from WT DSS + PBS, cGAS KO DSS + PBS, WT DSS + Rapamycin, and cGAS KO DSS + Rapamycin. The data are representative of at least three independent experiments. Data represent the mean ± SD. * P < 0.05, ** P < 0.01, *** P < 0.001, and **** P < 0.0001 by one-way ANOVA followed by Tukey’s multiple-comparison test.
Discussion:
In this study, we provide evidence that cGAS serves as an important homeostatic agent within the intestinal epithelium to mitigate inflammation. Here, we demonstrate an increase in cGAS protein in the intestinal epithelium during human IBD and murine DSS-induced colitis. We demonstrate that cGAS deficiency contributes to enhanced intestinal inflammation during experimental colitis. These data suggest that a physiologic increase in cGAS may protect the intestine from epithelial damage and serve to preserve the gut barrier (22). We demonstrate that cGAS directly binds to Beclin-1 in IECs, an interaction that has been shown to initiate autophagy in fibroblasts and BMDMs (16). We also demonstrate that transfection of cGAS into IECs leads to increased LC3II/I, a marker of autophagy. Furthermore, a lack of cGAS contributes to diminished Beclin-1 mediated autophagy and increased intestinal epithelial cell death during experimental colitis. We propose that cGAS upregulates Beclin-1-mediated autophagy and prevents intestinal epithelial cell death during intestinal inflammation (Fig. 10). Finally, we report that treatment with rapamycin can rescue intestinal epithelial autophagy but clinical improvement in colitis severity is limited to those with diminished autophagy as demonstrated in cGAS KO mice.
Figure 10: Proposed Paradigm. cGAS Upregulates Beclin-1 Mediated Autophagy and Prevents Intestinal Epithelial Cell Death.
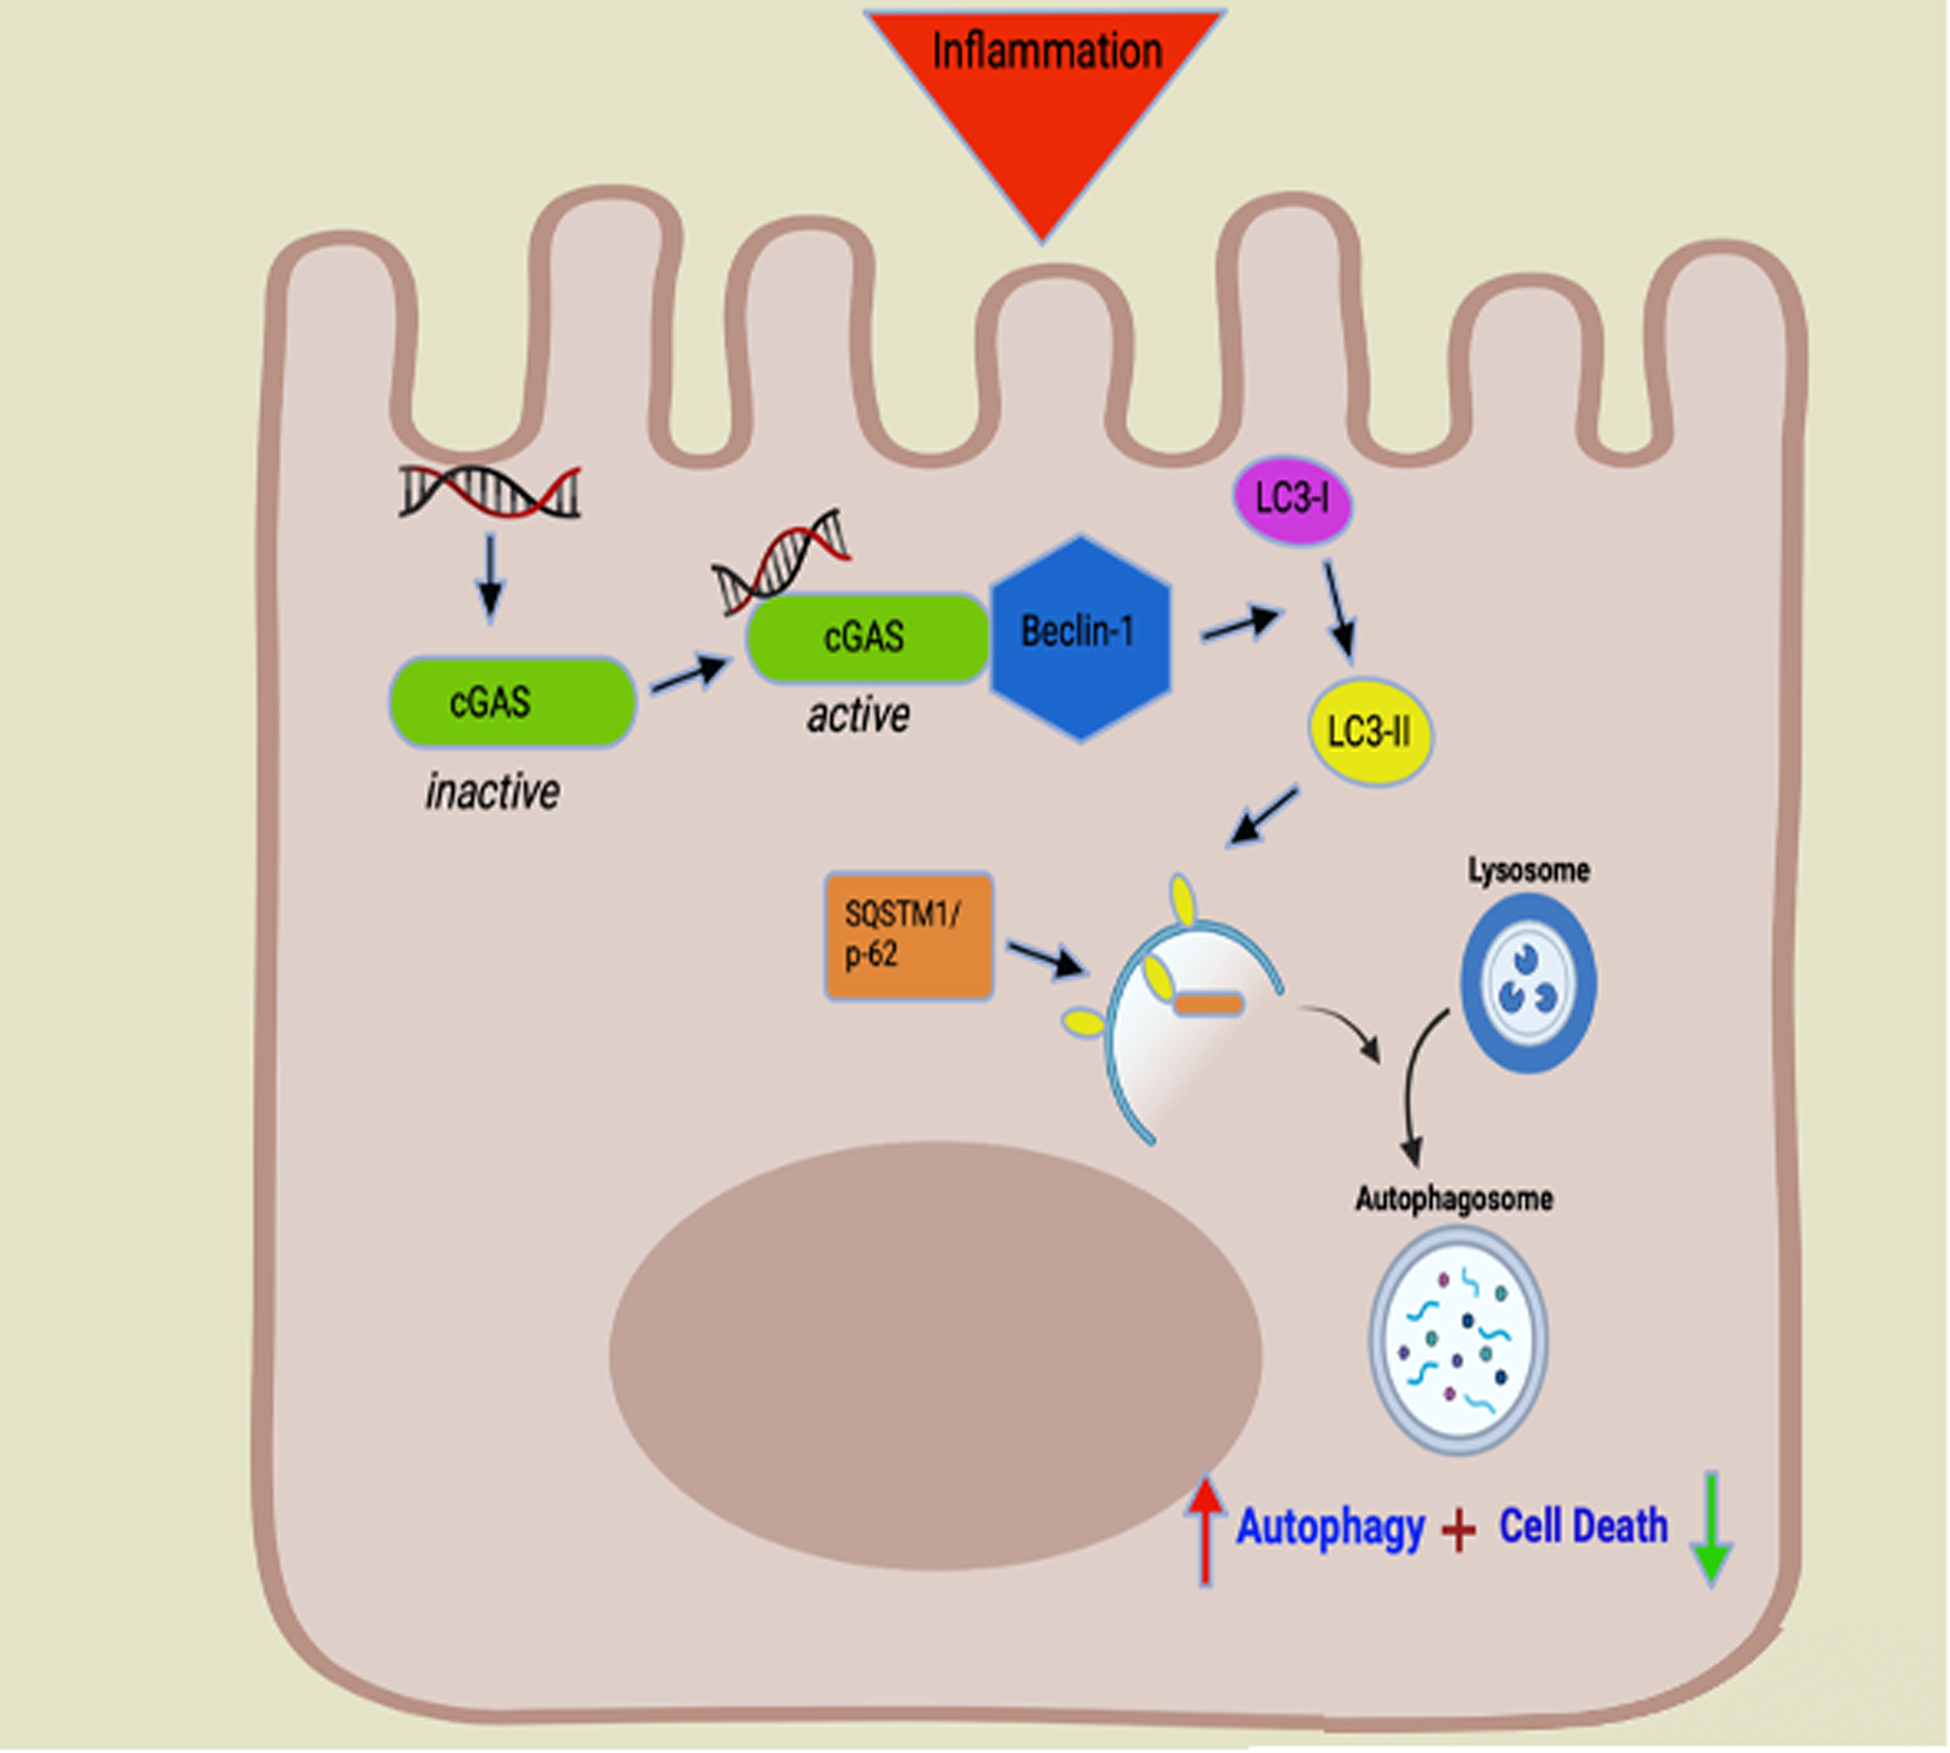
Cellular stress results in the release of double stranded DNA. Intracellular free DNA binds to cGAS (green symbol) allowing for activation via conformational change. Activated cGAS binds Beclin-1 (Blue symbol), a key initiator of autophagy. Beclin-1 allows for lipidation of microtubule associated light chain 3-I (LC3-I) (purple symbol) to LC3-II (yellow symbol). The ratio of LC3-II/LC3-I is used to detect the conversion of LC3-I into LC3-II and is widely used as a marker to monitor autophagy. LC3-II contributes to the closure of autophagosomes and marks the cargo and transport protein, SQSTM1/p-62 (orange symbol) for subsequent degradation. SQSTM1/p-62 directly binds to LC3-II to facilitate the degradation of pathogenic substances. Build-up of or increased levels of SQSTM1/p-62 is a marker for autophagic dysfunction. Binding of cGAS to Beclin-1 leads to increased autophagy (red arrow) and decreased intestinal epithelial apoptosis (green arrow). cGAS deficiency leads to diminished autophagy via decreased levels of Beclin-1, decrease lipidation of LC3-I to LC3-II, and buildup of p-62. Decreased autophagy leads to increased intestinal epithelial cell death.
The intestinal epithelium is a monolayer of cells that serves as a host defense against and protective barrier from harmful luminal contents (4). Inflammatory signaling within the intestinal epithelium can contribute to epithelial ulceration, progression of inflammation through the intestinal cell, fistulization, stricture formation, and loss of barrier integrity allowing for a progression of disease (43). cGAS has been demonstrated to be upregulated in patients with IBD (21). However, the role that increased cGAS plays in human IBD remains unknown.
Our data support the published literature by demonstrating an upregulation of cGAS mRNA and protein levels in the intestinal epithelium of humans with active UC (Fig. 1) (21). To further elucidate the significance of increased cGAS mRNA and protein in humans with UC, we first assessed the protein levels of cGAS in WT mice subjected to the DSS-induced colitis model. Consistent with published literature, we demonstrated that WT mice subjected to a 2% DSS-induced colitis model to have increased cGAS protein levels (Fig. 2) (22). To examine the functional role of cGAS in human and murine colitis, we subjected cGAS KO mice to a 7- day 2% DSS-induced colitis model. These mice exhibited higher DAI scores, shorter colon lengths, increased disruption of gross intestinal architecture, and increased levels of pro-inflammatory cytokines (Fig. 3). Published reports present conflicting results regarding the contribution of cGAS signaling to murine experimental colitis. One study reported data similar to ours, demonstrating that cGAS deficiency leads to increased intestinal inflammation and increased colitis-associated tumorigenesis (22). Another study that utilized a longer model of DSS colitis along with a higher percentage of DSS reported cGAS deficiency to be protective during the reparative phase of murine colitis (21). The reasons for this discrepancy are unclear, however differences in model design and/or facility microbiome profiles may play key roles (48).
Understanding the effects of the host microbiome on IBD pathogenesis is crucial to gaining insight into the pathogenesis of disease. One previous study demonstrated that cGAS KO mice have a baseline microbiome profile similar to WT mice, with a comparable breakdown of several known murine gut commensal and colitogenic bacteria including Bacteroides, Lactobacillus, Escherichia coli, and Enterococcus (22). Furthermore, when cohoused with WT mice, cGAS deficient mice continued to demonstrate increased colitis-associated tumor burden demonstrating that the role that cGAS plays in colitis severity continues to exist despite cohousing (22). To investigate a potential confounding effect of the microbiome on our cGAS KO mice, we performed a 4-week co-housing experiment. Unlike the study mentioned above, we demonstrated distinct clusters of bacteria on the PCOA analysis plot in WT and cGAS KO mice prior to cohousing (Fig. 4) (22). These distinct clusters were not appreciated after cohousing. Furthermore, our data shows that co-housing of cGAS KO mice with WT mice did not alter their respective phenotypes during DSS colitis when compared to the non-cohoused mice signifying that cGAS deficiency augments DSS-induced colitis despite cohousing with wild type mice.
Several genome-wide association studies have demonstrated that mutations in several autophagy-related genes are highly associated with IBD (49,50). Interestingly, several PRRs have been shown to regulate autophagy (51–53). Our data show that cGAS directly binds to Beclin-1 in intestinal epithelial cells (Fig. 6A). We further demonstrate that transient overexpression of GFP-cGAS in HCT-116 cells increases the conversion of LC3-I to LC3-II signifying upregulation of autophagy (Fig. 6B, D). These results correlate with published literature supporting a role for a cGAS-Beclin-1 complex in autophagy initiation (15, 54). One such study reported that cGAS deficiency decreased Beclin-1-mediated autophagy during liver ischemia reperfusion injury (54). Another study in fibroblasts and BMDMs demonstrated that cGAS directly bound to Beclin-1, that DNA stimulation markedly increased this interaction, and that autophagy was concurrently upregulated (16). Our data extend these findings by showing that cGAS mediates autophagy through a Beclin-1-dependent mechanism in the inflamed intestinal epithelium, and that the preservation of this process helps to limit colitis severity. Although we demonstrate a direct binding of cGAS to Beclin-1 in intestinal epithelial cells, we could not demonstrate a significant increase in interaction after stimulation with DNA. One possible explanation for this is our utilization of HCT-116 cells, a colon adenocarcinoma cell line. Colorectal cancer cell lines, including HCT-116 cells, demonstrate a higher basal level of autophagy compared to undifferentiated, normal human IECs, which could lead to the increased basal binding between cGAS and Beclin-1 and subsequently a less dramatic increase in the interaction with stimulation (55).
To further understand the effects of cGAS deficiency on intestinal epithelial autophagy, we subjected cGAS KO mice to DSS colitis model. Our data shows decreased levels of Beclin-1 and LC3-II protein levels, as well as increased SQSTM1/p-62 protein expression, suggesting that the loss of cGAS-induced autophagy likely exacerbates disease severity in DSS-treated cGAS-deficient mice (Fig. 5). Since protein levels were measured from whole tissue in global KO mice, to further study the effect of cGAS deficiency on intestinal epithelial autophagy, we isolated IECs from cGAS KO and WT mice subjected to DSS colitis, treated them with chloroquine, and subsequently measured autophagic flux. Our data demonstrated an increase in conversion of LC3-I to LC3-II in WT mice subjected to DSS colitis with no such increase seen in cGAS KO mice subjected to DSS. Overall, these findings are consistent with published literature demonstrating an upregulation of autophagy during DSS colitis that protects against ongoing intestinal inflammation (27,47). Our data specifically identify cGAS as a key activator of autophagy during intestinal inflammation, providing a novel mechanism for intestinal epithelial cell homeostasis.
Multiple studies have investigated the therapeutic effects of rapamycin in both human IBD and murine colitis (42,43). Rapamycin treatment in children with refractory IBD has been demonstrated to be an effective rescue therapy in select patients. Another group demonstrated that rapamycin treatment was associated with deceased stricture formation in patients with IBD (46). Rapamycin is a known inducer of autophagy, however its effects on autophagy during have provided variable results (43,47,56). Our data demonstrate that treatment with rapamycin decreases the severity of colitis in cGAS KO mice, giving them a disease phenotype similar to that of WT mice similarly treated. Interestingly, rapamycin treatment did not significantly alter the severity of colitis in WT mice (Fig 9 A, B). Treatment with rapamycin did, however, upregulate autophagy regardless of the presence of cGAS (Fig 9C, D). This would suggest that although rapamycin induces autophagy in WT mice, the clinical benefit of treatment is likely dependent upon pre-existing autophagic defects. It is possible that this is why certain humans with IBD benefit from treatment with rapamycin while others do not. This may be an important clinical parameter to consider in future IBD treatment. Although cGAS is generally elevated in patients with IBD, it is possible that a cohort of patients exist with cGAS deficiency or other autophagic constraints and may respond clinically to pharmacological activation of autophagy.
Suppression of autophagy in cGAS knockout mice is likely linked both to inflammation and epithelial cell death. Crosstalk between autophagy and apoptosis is a multifaceted process (57,58). Autophagy protects against inflammation by sequestering damage associated molecules such as nucleic acids and organelles (11). Apoptosis is known to play a key role in inflammatory changes associated with DSS colitis, contributing to epithelial loss, a breakdown of the gut barrier, and transmigration of luminal antigens (57–58). Published studies have demonstrated that autophagy can antagonize apoptosis by promoting cell survival (59). Autophagy allows for the removal of damaged organelles and cytotoxic molecules which then helps to inhibit the trigger for apoptosis (60). We demonstrated that cGAS-deficient mice subjected to DSS colitis show increased epithelial apoptosis when compared to WT mice subjected to DSS colitis (Fig. 7). We propose that in cGAS-deficient mice there is increased epithelial apoptosis due to dysfunctional autophagy. Our findings are similar to those noted in an AOM/DSS model of colitis-associated cancer (22).
Canonical cGAS signaling involves activation of STING-mediated type I IFN signaling. The published literature describes variability in the relationship between cGAS, STING, and IFN signaling. One study reported that cGAS KO mice lack an IFN response all together, while another demonstrated that STING-mediated IFN signaling can occur independent of cGAS stimulation (18,37). We evaluated the effect of cGAS deficiency on STING protein levels and activity during DSS-induced colitis. Our data demonstrated an increase in STING protein levels in the cGAS KO mice subjected to DSS colitis compared to WT mice subjected to DSS colitis but no difference in downstream phosphorylation of IRF-3, gene expression of IFN-β or downstream ISGs (Fig. 8). These data are comparable to published literature demonstrating that cGAS deficiency leads to a STING independent increase in CAC and suggest that STING signaling is not likely to contribute substantially to the observed DSS phenotype in cGAS KO mice (22).
In summary, our study identifies a novel protective role for cGAS in regulating intestinal epithelial homeostasis during inflammation via modulation of autophagy and cell death. We report that cGAS can upregulate intestinal epithelial autophagy by directly binding to and activating Beclin-1. cGAS deficiency leads to diminished Beclin-1-mediated autophagy and increased intestinal epithelial cell death (Fig. 10). Rescue of autophagy via rapamycin can attenuate the severity of colitis in cGAS-deficient mice. We demonstrate that the increased protein expression of cGAS in human IBD and murine colitis helps to protect the epithelium from ongoing inflammation. Our study lays the groundwork for utilizing cGAS as a biomarker for autophagic dysfunction in patients with IBD. Further, it is possible that the use of therapeutics directed at autophagic pathways may prove to be highly effective when used in a targeted manner in select patients.
Supplementary Material
Table 1.
qRT-PCR primer sequences
| Gene | Species | Forward: 5’-3’ | Reverse: 5’-3’ |
|---|---|---|---|
| Rplo | Mouse/Human | GGCGACCTGGAAGTCCAACT | CCATCAGCACCACAGCCTTC |
| Il1β, | Mouse | AGTGTGGATCCCAAGCAATACCCA | TGTCCTGACCACTGTTGTTTC CCA |
| Tnfα | Mouse | CATCTTCTCAAAATTCGAGTGACAA | TGGGAGTAGACAAGGTACAACCC |
| Il6 | Mouse | CCAATTTCCAATGCTCTCCT | ACCACAGTGAGGAATGTCCA |
| Il18 | Mouse | TGTTCACAGGTGACTGCTCC | AGCCCATAGTGGAGTGGGAT |
| cGAS | Mouse | GTTCAAAGGTGTGGAGCAGC | GACTCAGCGGATTTCCTCGT |
| cGAS | Human | AACGTGCTGTGAAAACAAAGAAGA | GTCCCACTGACTGTCTTGAGG |
| STING | Mouse | AGTCCTGCTAGGTGTCCACT | CTTCCTAGACCGGTGTTCC |
| Irf-3 | Mouse | AACCGTGGACTTGCACATCT | ATAACCACCAGCCTAGACGC |
| CXCL10 | Mouse | GCTGGGATTCACCTCAAGAA | TCTCCGTTACTTGGGGACAC |
| ISG15 | Mouse | GGTGTCCGTGACTAACTCCAT | CTGTACCACTAGCATCACTGTG |
CXCL10, chemokine ligand 10; cGAS, Cyclic GMP-AMP Synthase; Il6, interleukin-6; Il1β, interleukin-1β; Il18, interleukin-18; IRF-3, IFN regulatory factor 3; ISG10, interferon stimulated gene-10; RPLO, 50S ribosomal protein L15; STING, stimulator of IFN genes; Tnfα, tumor necrosis factor alpha.
Acknowledgements:
Visual aids created with BioRender.com.
Grant Support:
This work was supported by U.S. National Institutes of Health (NIH) Grant R01 DK120986 (to K.P.M) and the Burroughs Wellcome Fund (to S.K.). The University of Pittsburgh holds a Physician-Scientist Institutional Award from the Burroughs Wellcome Fund.
Abbreviations:
- BMDMs
bone marrow-derived macrophages
- CQ
Chloroquine
- CDNs
cyclic di-nucleotides
- cGAMP
2’-3’ cyclic GMP-AMP
- cGAS
Cyclic GMP-AMP Synthase
- CD
Crohn’s disease
- DAI
disease activity index
- DNA
deoxyribonucleic acid
- DSS
dextran sulfate sodium
- GFP
green fluorescent protein
- HCT-116
human colorectal carcinoma cell line
- HA
hemagglutinin
- H&E
hematoxylin and eosin
- IBD
inflammatory bowel disease
- IFN
interferon
- IRF-3
IFN regulatory factor 3
- IF
immunofluorescence
- Il6
interleukin-6
- Il1β
interleukin-1β
- Il18
interleukin-18
- KO
knock out
- LC3
microtubule associated light chain 3
- mRNA
messenger ribonucleic acid
- PBS
phosphate buffered saline
- poly dA:dT
poly(deoxyadenylic-deoxythymidylic) acid sodium salt
- PRR
pattern-recognition receptors
- RT-qPCR
real-time quantitative polymerase
- STING
stimulator of IFN genes
- SQSTM1/p-62
Sequestosome-1/p-62
- Tnfα
tumor necrosis factor alpha
- TUNEL
terminal deoxynucleotidyl transferase dUTP nick end labeling
- WT
wild type
- WB
western blot
Footnotes
Conflicts of Interest Statement: The authors have no conflict of interest to declare.
Data Availability Statement:
Data sharing not applicable to this article as no datasets were generated or analyzed during the current study.
References:
- 1.De Souza HSP, Fiocchi C. Immunopathogenesis of IBD: Current State of the Art. Nat Rev Gastroenterol Hepatol. 2016. January;13(1):13–27. [DOI] [PubMed] [Google Scholar]
- 2.Kaplan GG. The Global Gurden of IBD: from 2015 to 2025. Nat Rev Gastroenterol Hepatol. 2015. December;12(12):720–7. [DOI] [PubMed] [Google Scholar]
- 3.Rampton DS, Shanahan F. Fast Facts: Inflammatory Bowel Disease. Kargers Publication; Health Press, 2016. [Google Scholar]
- 4.Coskun M Intestinal Epithelium in Inflammatory Bowel Disease. Frontiers in Medicine. 2014. August 25;1:24. [DOI] [PMC free article] [PubMed] [Google Scholar]
- 5.Cavlar T, Ablasser A, Hornung V. Induction of Type I IFNs by Intracellular DNA-Sensing Pathways. Immunol Cell Biol. 2012. May;90(5):474–82. [DOI] [PubMed] [Google Scholar]
- 6.Hotte NSC, Salim SY, Tso RH, et al. Patients with Inflammatory Bowel Disease Exhibit Dysregulated Responses to Microbial DNA. PLOS One. 2012. May 23;7(5):e37932. [DOI] [PMC free article] [PubMed] [Google Scholar]
- 7.Ratsimandresy RA, Indramohan M, Dorfleutner A, et al. The AIM2 Inflammasome is a Central Regulator of Intestinal Homeostasis Through the IL-18/IL-22/STAT3 Pathway. Cell Mol Immunol. 2017. January;14(1):127–42. [DOI] [PMC free article] [PubMed] [Google Scholar]
- 8.Katakura K, Lee J, Rachmilewitz D, et al. Toll-Like Receptor 9-Induced Type I IFN Protects Mice from Experimental Colitis. Journal of Clinical Investigation 2005. March;115(3):695–702. [DOI] [PMC free article] [PubMed] [Google Scholar]
- 9.Wang Y, Zhang H-X, Sun Y-P, et al. Rig-I−/− Mice Develop Colitis Associated With Downregulation of G Alpha I2. Cell Res. 2007. October;17(10):858–68. [DOI] [PubMed] [Google Scholar]
- 10.Feng Y, He D, Yao Z, et al. The Machinery of Macroautophagy. Cell Res. 2014. January;24(1):24–41. [DOI] [PMC free article] [PubMed] [Google Scholar]
- 11.Yang Z, Klionsky DJ. Mammalian Autophagy: Core Molecular Machinery and Signaling Regulation. Curr Opin Cell Biol. 2010. April;22(2):124–31. [DOI] [PMC free article] [PubMed] [Google Scholar]
- 12.Gatica D, Lahiri V, Klionsky DJ. Cargo Recognition and Degradation by Selective Autophagy. Nat Cell Biol. 2018. March;20(3):233–42. [DOI] [PMC free article] [PubMed] [Google Scholar]
- 13.Gui X, Yang H, Li T, et al. Autophagy Induction via STING Trafficking is a Primordial Function of the cGAS Pathway. Nature. 2019. March 6;567(7747):262–6. [DOI] [PMC free article] [PubMed] [Google Scholar]
- 14.Benjamin JL, Sumpter R, Levine B, et al. Intestinal Epithelial Autophagy is Essential for Host Defense Against Invasive Bacteria. Cell Host Microbe. 2013. June 12;13(6):723–34. [DOI] [PMC free article] [PubMed] [Google Scholar]
- 15.Kato K, Omura H, Ishitani R, et al. Cyclic GMP-AMP as an Endogenous Second Messenger in Innate Immune Signaling by Cytosolic DNA. Annu Rev Biochem. 2017. June 20;86:541–66. [DOI] [PubMed] [Google Scholar]
- 16.Li X, Shu C, Yi G, et al. Cyclic GMP-AMP Synthase is Activated by Double-Stranded DNA-Induced Oligomerization. Immunity. 2013. December 12;39(6):1019–31. [DOI] [PMC free article] [PubMed] [Google Scholar]
- 17.Gray EE, Treuting PM, Woodward JJ, et al. Cutting Edge: cGAS Is Required for Lethal Autoimmune Disease in the Trex1-Deficient Mouse Model of Aicardi-Goutières Syndrome. J Immunol. 2015. September 1;195(5):1939–43. [DOI] [PMC free article] [PubMed] [Google Scholar]
- 18.Han Y, Chen L, Liu H, et al. Airway Epithelial cGAS Is Critical for Induction of Experimental Allergic Airway Inflammation. J Immunol. 2020. March 15;204(6):1437–47. [DOI] [PubMed] [Google Scholar]
- 19.Wang Y, Su G-H, Zhang F, et al. Cyclic GMP-AMP Synthase Is Required for Cell Proliferation and Inflammatory Responses in Rheumatoid Arthritis Synoviocytes. Mediators Inflamm. 2015. December 27;2015:192329. [DOI] [PMC free article] [PubMed] [Google Scholar]
- 20.Liang Q, Seo GJ, Choi YJ, et al. Crosstalk Between the cGAS DNA Sensor and Beclin-1 Autophagy Protein Shapes Innate Antimicrobial Immune Responses. Cell Host Microbe. 2014. February 12;15(2):228–38. [DOI] [PMC free article] [PubMed] [Google Scholar]
- 21.Wang Z, Guo K, Gao P, et al. Microbial and Genetic-Based Framework Identifies Drug Targets in Inflammatory Bowel Disease. Theranostics. 2021. June 1;11(15):7491–506. [DOI] [PMC free article] [PubMed] [Google Scholar]
- 22.Hu S, Fang Y, Chen X, et al. cGAS Restricts Colon Cancer Development by Protecting Intestinal Barrier Integrity. Proc Natl Acad Sci USA. 2021. June 8;118(23). [DOI] [PMC free article] [PubMed] [Google Scholar]
- 23.Vincent G, Novak EA, Siow VS, et al. Nix-Mediated Mitophagy Modulates Mitochondrial Damage During Intestinal Inflammation. Antioxid Redox Signal. 2020. July 1;33(1):1–19. [DOI] [PMC free article] [PubMed] [Google Scholar]
- 24.Neurath MF, Fuss I, Kelsall BL, et al. Antibodies to Interleukin 12 Abrogate Established Experimental Colitis in Mice. J Exp Med. 1995. November 1;182(5):1281–90. [DOI] [PMC free article] [PubMed] [Google Scholar]
- 25.Walters W, Hyde ER, Berg-Lyons D, et al. Improved Bacterial 16S rRNA Gene (V4 and V4–5) and Fungal Internal Transcribed Spacer Marker Gene Primers for Microbial Community Surveys. mSystems. 2016. Feb;1(1). [DOI] [PMC free article] [PubMed] [Google Scholar]
- 26.Cunningham KE, Vincent G, Sodhi CP, et al. Peroxisome Proliferator-activated Receptor-γ Coactivator 1-α (PGC1α) Protects against Experimental Murine Colitis. J Biol Chem. 2016. May 6;291(19):10184–200. [DOI] [PMC free article] [PubMed] [Google Scholar]
- 27.Elinav E, Strowig T, Kau AL, et al. NLRP6 Inflammasome Regulates Colonic Microbial Ecology and Risk for Colitis. Cell. 2011. May 27;145(5):745–57. [DOI] [PMC free article] [PubMed] [Google Scholar]
- 28.Tsuboi K, Nishitani M, Takakura A, et al. Autophagy Protects Against Colitis by the Maintenance of Normal Gut Microflora and Secretion of Mucus. J Biol Chem. 2015. August 14;290(33):20511–26. [DOI] [PMC free article] [PubMed] [Google Scholar]
- 29.Xavier RJ, Podolsky DK. Unravelling the Pathogenesis of Inflammatory Bowel Disease. Nature. 2007. July 26;448(7152):427–34. [DOI] [PubMed] [Google Scholar]
- 30.Haq S, Grondin J, Banskota S, et al. Autophagy: Roles in Intestinal Mucosal Homeostasis and Inflammation. J Biomed Sci. 2019. February 14;26(1):19. [DOI] [PMC free article] [PubMed] [Google Scholar]
- 31.Yoshii SR, Mizushima N. Monitoring and Measuring Autophagy. Int J Mol Sci. 2017. Aug 28;18(9) [DOI] [PMC free article] [PubMed] [Google Scholar]
- 32.Mizushima N, Yoshimori T. How to Interpret LC3 Immunoblotting. Autophagy. 2007. December;3(6):542–5. [DOI] [PubMed] [Google Scholar]
- 33.Choi AMK, Ryter SW, Levine B. Autophagy in Human Health and Disease. N Engl J Med. 2013. February 14;368(7):651–62. [DOI] [PubMed] [Google Scholar]
- 34.Mauthe M, Orhon I, Rocchi C, et al. Chloroquine inhibits autophagic flux by decreasing autophagosome-lysosome fusion. Autophagy. 2018;14(8):1435–1455. [DOI] [PMC free article] [PubMed] [Google Scholar]
- 35.Boya P, González-Polo R-A, Casares N, et al. Inhibition of macroautophagy triggers apoptosis. Mol Cell Biol. 2005. Feb;25(3):1025–40. [DOI] [PMC free article] [PubMed] [Google Scholar]
- 36.Yonekawa T, Thorburn A. Autophagy and cell death. Essays Biochem. 2013;55:105–17. [DOI] [PMC free article] [PubMed] [Google Scholar]
- 37.Ahn J, Son S, Oliveira SC, et al. STING-Dependent Signaling Underlies IL-10 Controlled Inflammatory Colitis. Cell Rep. 2017. December 26;21(13):3873–84. [DOI] [PMC free article] [PubMed] [Google Scholar]
- 38.Kelly-Scumpia KM, Scumpia PO, Delano MJ, et al. Type I interferon signaling in hematopoietic cells is required for survival in mouse polymicrobial sepsis by regulating CXCL10. J Exp Med. 2010. Feb 15;207(2):319–26. [DOI] [PMC free article] [PubMed] [Google Scholar]
- 39.Perng YC., Lenschow, D.J. ISG15 in antiviral immunity and beyond. Nat Rev Microbiol 16, 423–439 (2018). [DOI] [PMC free article] [PubMed] [Google Scholar]
- 40.Vakifahmetoglu-Norberg H, Xia H, Yuan J. Pharmacologic Agents Targeting Autophagy. J Clin Invest. 2015. January 2;125(1):5–13. [DOI] [PMC free article] [PubMed] [Google Scholar]
- 41.Li K-L, Wang Y-F, Qin J-R, et al. Rapamycin Enhances the Anti-Angiogenesis and Anti-Proliferation Ability of YM155 in Oral Squamous Cell Carcinoma. Tumour Biol. 2017. June;39(6):1010428317706213. [DOI] [PubMed] [Google Scholar]
- 42.Guan Y, Zhang L, Li X, et al. Repression of Mammalian Target of Rapamycin Complex 1 Inhibits Intestinal Regeneration in Acute Inflammatory Bowel Disease Models. J Immunol. 2015. July 1;195(1):339–46. [DOI] [PubMed] [Google Scholar]
- 43.Hu S, Chen M, Wang Y, et al. mTOR Inhibition Attenuates Dextran Sulfate Sodium-Induced Colitis by Suppressing T Cell Proliferation and Balancing TH1/TH17/Treg Profile. PLOS One. 2016. April 29;11(4):e0154564. [DOI] [PMC free article] [PubMed] [Google Scholar]
- 44.Massey DCO, Bredin F, Parkes M. Use of Sirolimus (Rapamycin) to Treat Refractory Crohn’s Disease. Gut. 2008. September;57(9):1294–6. [DOI] [PubMed] [Google Scholar]
- 45.Mutalib M, Borrelli O, Blackstock S, et al. The Use of Sirolimus (Rapamycin) in the Management of Refractory Inflammatory Bowel Disease in Children. J Crohns Colitis. 2014. December;8(12):1730–4. [DOI] [PubMed] [Google Scholar]
- 46.Zhong M, Cui B, Xiang J, et al. Rapamycin is Effective for Upper but not for Lower Gastrointestinal Crohn’s Disease-Related Stricture: A Pilot Study. Front Pharmacol. 2020;11:617535. [DOI] [PMC free article] [PubMed] [Google Scholar]
- 47.Macias-Ceja DC, Cosín-Roger J, Ortiz-Masiá D, et al. Stimulation of Autophagy Prevents Intestinal Mucosal Inflammation and Ameliorates Murine Colitis. Br J Pharmacol. 2017. June 21;174(15):2501–11. [DOI] [PMC free article] [PubMed] [Google Scholar]
- 48.Chassaing B, Aitken JD, Malleshappa M. Dextran Sulfate Sodium (DSS)-Induced Colitis in Mice. Curr Protoc Immunol. 2014. February 4;104:Unit 15.25. [DOI] [PMC free article] [PubMed] [Google Scholar]
- 49.Hampe J, Franke A, Rosenstiel P. A Genome-Wide Association Scan of Nonsynonymous SNPs Identifies a Susceptibility Variant for Crohn Disease in ATG16L1. Nat Genet. 2007. February;39(2):207–11. [DOI] [PubMed] [Google Scholar]
- 50.Tysk C, Lindberg E, Järnerot G, et al. Ulcerative Colitis and Crohn’s Disease in an Unselected Population of Monozygotic and Dizygotic Twins. A Study of Heritability and the Influence of Smoking. Gut. 1988. July;29(7):990–6. [DOI] [PMC free article] [PubMed] [Google Scholar]
- 51.Xu Y, Jagannath C, Liu X-D, et al. Toll-Like Receptor 4 is a Sensor for Autophagy Associated with Innate Immunity. Immunity. 2007. July 19;27(1):135–44. [DOI] [PMC free article] [PubMed] [Google Scholar]
- 52.Travassos LH, Carneiro LAM, Ramjeet M, et al. Nod1 and Nod2 Direct Autophagy by Recruiting ATG16L1 to the Plasma Membrane at the Site of Bacterial Entry. Nat Immunol. 2010. January;11(1):55–62. [DOI] [PubMed] [Google Scholar]
- 53.Cooney R, Baker J, Brain O, et al. NOD2 Stimulation Induces Autophagy in Dendritic Cells Influencing Bacterial Handling and Antigen Presentation. Nat Med. 2010. January;16(1):90–7. [DOI] [PubMed] [Google Scholar]
- 54.Lei Z, Deng M, Yi Z, et al. cGAS-Mediated Autophagy Protects the Liver from Ischemia-Reperfusion Injury Independently of STING. Am J Physiol Gastrointest Liver Physiol. 2018. June 1;314(6):G655–67. [DOI] [PMC free article] [PubMed] [Google Scholar]
- 55.Lauzier A, Normandeau-Guimond J, Vaillancourt-Lavigueur V, et al. Colorectal Cancer Cells Respond Rifferentially to Autophagy Inhibition In Vivo. Sci Rep. 2019. August 5;9(1):11316. [DOI] [PMC free article] [PubMed] [Google Scholar]
- 56.Lin X, Han L, Weng J, et al. Rapamycin Inhibits Proliferation and Induces Autophagy in Human Neuroblastoma Cells. Biosci Rep. 2018. December 21;38(6). [DOI] [PMC free article] [PubMed] [Google Scholar]
- 57.Renehan AG, Bach SP, Potten CS. The Relevance of Apoptosis for Cellular Homeostasis and Tumorigenesis in the Intestine. Can J Gastroenterol. 2001. March;15(3):166–76. [DOI] [PubMed] [Google Scholar]
- 58.Ramachandran A, Madesh M, Balasubramanian KA. Apoptosis in the Intestinal Epithelium: Its Relevance in Normal and Pathophysiological Conditions. J Gastroenterol Hepatol. 2000. February;15(2):109–20. [DOI] [PubMed] [Google Scholar]
- 59.Eisenberg-Lerner A, Bialik S, Simon HU, et al. Life and death partners: apoptosis, autophagy and the cross-talk between them. Cell Death Differ 16, 966–975 (2009). [DOI] [PubMed] [Google Scholar]
- 60.Araki Y, Mukaisyo K, Sugihara H, et al. Increased Apoptosis and Decreased Proliferation of Colonic Epithelium in Dextran Sulfate Sodium-Induced Colitis in Mice. Oncol Rep. 2010. October;24(4):869–74. [DOI] [PubMed] [Google Scholar]
Associated Data
This section collects any data citations, data availability statements, or supplementary materials included in this article.
Supplementary Materials
Data Availability Statement
Data sharing not applicable to this article as no datasets were generated or analyzed during the current study.