

Abstract
BACKGROUND:
Quantification of integrated proviral HIV DNA by repetitive-sampling Alu-HIV PCR is a candidate virological tool to monitor the HIV reservoir in patients. However, the experimental procedures and data analysis of the assay are complex and hinder its widespread use. Here, we provide an improved and simplified data analysis method by adopting binomial and Poisson statistics.
METHODS:
A modified analysis method on the basis of Poisson statistics was used to analyze the binomial data of positive and negative reactions from a 42-replicate Alu-HIV PCR by use of dilutions of an integration standard and on samples of 57 HIV-infected patients. Results were compared with the quantitative output of the previously described Alu-HIV PCR method.
RESULTS:
Poisson-based quantification of the Alu-HIV PCR was linearly correlated with the standard dilution series, indicating that absolute quantification with the Poisson method is a valid alternative for data analysis of repetitive-sampling Alu-HIV PCR data. Quantitative outputs of patient samples assessed by the Poisson method correlated with the previously described Alu-HIV PCR analysis, indicating that this method is a valid alternative for quantifying integrated HIV DNA.
CONCLUSIONS:
Poisson-based analysis of the Alu-HIV PCR data enables absolute quantification without the need of a standard dilution curve. Implementation of the CI estimation permits improved qualitative analysis of the data and provides a statistical basis for the required minimal number of technical replicates.
Combination antiretroviral therapy effectively suppresses HIV infection, but a stable reservoir of latently infected cells persists (1-3). To eradicate this reservoir, accurate, robust, and sensitive diagnostic tests are needed to monitor the response of the HIV reservoir to new therapeutics (4, 5). Both cell culture–based and PCR-based tests have been developed. Cell culture–based tests, such as the infectious units per million assay, are considered the only tests that can distinguish replication-competent HIV from defectively integrated HIV DNA. However, their application is laborious and mainly useful for experimental work (4, 6). PCR-based tests are fast, accurate, and relatively inexpensive and require small samples, facilitating implementation in a clinical setting.
A recent comparison of different tests revealed a strong correlation between the infectious units per million quantification and the amount of integrated HIV DNA as measured with the so-called Alu-HIV PCR (7, 8). The Alu-HIV PCR quantifies integrated HIV DNA by performing a nested PCR, in which the first PCR uses a specific primer for the endogenous human repeat element (the Alu element) in combination with an HIV primer oriented outward. This enables logarithmic amplification of integrated HIV DNA only (9). Alu elements are the most abundant short interspersed elements, occurring at a frequency of 1 Alu element every 2.5 kb in the human genome (10, 11). After the first amplification, a second quantitative real-time PCR (qPCR)4 quantifies the integrated HIV copies (12-15).
Because of the nested PCR setup, the Alu-HIV PCR comes with some inherent drawbacks that hamper accurate quantification, especially in samples with low copy numbers of proviral HIV DNA. Over several years, the assay was further optimized, enabling its use in patient samples (7, 8, 15-20).
One drawback originates from a bias of quantification due to variable amounts of unintegrated HIV DNA in different samples. Linearly amplified unintegrated HIV DNA will add to the fluorescent signal and bias the quantitative readout. To compensate for this, a background PCR is performed in parallel by use of a first PCR with the HIV-specific primer but excluding the Alu primer, allowing a linear amplification of HIV DNA only (initially termed “gag-only control,” herein referred to as “HIV-only”) (Fig. 1). This PCR is used to set the threshold quantification cycle (Cq) value above which integrated copies can no longer be discerned from unintegrated copies (14, 17). This solution only partially overcomes the problem, since very high concentrations of unintegrated HIV DNA may still lead to overestimation of proviral copies (17).
Fig. 1. Illustration of the Alu-HIV PCR strategy, showing primer positions of the Alu and HIV primers that exponentially amplify integrated HIV DNA (left).

The HIV-only PCR (right) linearly amplifies integrated and unintegrated HIV DNA. Both PCRs are run with multiple replicates. In the second quantitative PCR with nested primers and probes, for the LTR region, Cq values are obtained for each replicate reaction. The 95% CI is calculated from the HIV-only PCR (black bar delineated with the spheres). Cq values from the Alu-HIV PCR lower than this CI (dotted line) are considered positive replicates. ΔRn, the relative normalized fluorescence emission of each well.
A second drawback is encountered in samples with low abundant proviral copies. The distance between the Alu fragment and the integrated provirus is different in each unique integration site. Hence, each integration will have a specific PCR efficiency depending on its distance from an Alu element. The repetitive-sampling strategy, assessing multiple replicate reactions (>40) of the same sample, compensates for this integration specific bias (16).
In patients on prolonged therapy or elite controllers, the majority of replicate reactions is negative or indistinguishable from the background due to low abundant HIV DNA. An alternative method, called the percent positive method, was developed on the basis of the same repetitive sampling data, but by assessing the percentage of positive replicates rather than the Cq values. The percentage of positive reactions is compared to the mean percentage of positive reactions from a serial dilution of the standard curve run at an equal number of replicate reactions. This relation is nearly linear when <30% of the replicates are positive (17). If this threshold is surpassed, then the natural logarithm of the mean Cq values (lnCq) method is used. Notably, neither the lnCq nor the percent positive method performs well when between 30% and 60% of the wells are positive.
In the percent positive method, samples are scored positive or negative on the basis of the Cq values in comparison to those of the background signal (Fig. 1). Positive samples have Cq values lower than the 95% CI defined by multiple background replicates. Reactions with no detectable Cq values or with Cq values within the 95% CI are scored negative. Optimization of the standard curve for the percent positive method is cumbersome and costly, requiring multiple runs (n ≥ 3) of 40 replicate Alu-HIV PCRs per dilution, especially since revalidation of the standard is necessary with new batches of primers or PCR mixes.
Here, we provide an improvement on the Alu-HIV PCR assay by applying Poisson statistics to the percent positive method. Repetitive-sampling Alu-HIV PCR is analogous to a limiting dilution PCR. This is performed by repetitive sampling from an input of sufficiently diluted sample to ensure that not all replicate reactions turn out positive, a well-known principle in digital PCR (5, 21). In this case, the chance that there will be no proviral HIV (negative reactions) or 1 or more proviral HIV (positive reaction) in each replicate follows the Poisson distribution. The mean copies per replicate can be calculated from the frequency of positive replicates by Poisson statistics. This enables absolute quantification without the need for a standard dilution series. Furthermore, the described model includes a modified error calculation allowing assessment of the statistical error that can be expected by quantifying integrated copies.
Materials and Methods
MATERIALS
The integration standard was previously made by infection of CEM-ss cells with a single round virus generated by cotransfecting pVSVG and pNL4–3″env/GFP/HygR NL4–3 (14). Sorting of green fluorescent protein (GFP)-positive cells resulted in a population of cells with 1 proviral copy per cell (15-17). Peripheral blood mononuclear cells were isolated from 56 HIV-infected patients by density gradient centrifugation and frozen to −80 °C at a cooling rate of 1 °C/min in 90% fetal calf serum with 10% DMSO. Samples were stored at −150 °C until further analysis. DNA was isolated with the QIAamp DNA Micro Kit (Qiagen), eluted in 10 mmol/L Tris-HCl, and quantified by spectrophotometry. We recruited study participants from the Clinical Research Center, NIH (Bethesda, Maryland), the Center for Aids Research at the University of Pennsylvania, or the Observational Study of the Consequences of the Protease Inhibitor Era (SCOPE) cohort at the University of California, San Francisco (UCSF). Participants signed informed consent forms approved by institutional review boards of the National Institute of Allergy and Infectious Diseases (NIAID), the University of Pennsylvania, and UCSF. The University of Pennsylvania institutional review board approved the transfer of materials from NIH and UCSF. The samples were derived from patients on and off highly active antiretroviral therapy (HAART) as previously described (7, 18-20). We obtained peripheral blood mononuclear cells (PBMCs) from healthy donors through anonymous donation to the University of Pennsylvania’s Human Immunology Core.
Alu-HIV PCR
Alu-HIV PCR was performed as described earlier (15, 17) by use of 42 replicate reactions of a mix with gag-reverse HIV primer and Alu-forward primer as well as 42 replicates by use of only primers specific to HIV gag (HIV-only PCR). Samples were diluted to 2 or 10 μg DNA/mL and distributed in replicate PCR reactions containing 25 μL sample combined with 25 μL master mix, resulting in an equivalent of approximately 7500 cells (1 ng/μL PCR mix) or approximately 37 500 cells (5 ng/μL PCR mix) per 50 μL PCR replicate. All patient samples were run at 7500 cells/replicate PCR. We conducted the final nested qPCR in 20 μL with 10 μL of the first PCR product. This qPCR was optimized to enable robust amplification in a 1:1 dilution of PCR without PCR inhibition from pyrophosphates. We used master mixes and cycling conditions as previously described (15), and primer pairs are depicted in Supplemental Table 1, which accompanies the online version of this article at http://www.clinchem.org/content/vol60/issue6. Degenerate probes are no longer used for this assay, since they diminish robustness (unpublished data). PCR cycling was performed on an Applied Biosystems 7500 Real-Time PCR System, and Cq values were obtained by fit point analysis. Normalization to cell numbers was performed with a β-globin assay as described before (15).
CALCULATION OF INTEGRATED COPIES
lnCq method.
The lnCq method was performed on samples in which the mean Cq value of the Alu-HIV PCR replicates was significantly lower than that of the HIV-only PCR by t-test statistics (15). The lnCq of the Alu-HIV PCR is plotted against the lnCq value obtained by Alu-HIV PCRs on a dilution series of the integration standard.
Percent positive method.
For the percent positive method, individual Alu-HIV PCR replicates were termed positive or negative by comparing the Cq values to the distribution of Cq values from the background PCR replicates. We obtained the lower limit of the 95% CI by subtracting 2 SD from the mean of the HIV-only replicates. Preliminary analysis revealed that the distribution of the background Cq values follow the normal distribution, enabling use of this parametric method for CI estimation. Alu-HIV PCR replicates with lower Cq values compared to the HIV-only PCR were assigned positive. We used the percentage of positive vs negative replicates for calculation of integrated copies by comparison with the percentage of positive replicates of the standard curve.
The dilution curves prepared by spiking dilutions of the integration standard into uninfected genomic DNA were run at 7500 and 37 500 diploid genomic DNA equivalents per 50 μL total Alu-HIV PCR reaction volume. At least 3 replicate runs were performed per dilution, i.e., 3 plates, each containing 42 Alu-HIV PCR and HIV-only PCR replicates. We used the regression line of positive reactions and the expected amount of integrations to estimate the amount of integrations in samples.
Poisson method.
For the Poisson analysis, we used the frequency of positive to negative reactions as described in the percent positive method as probability in Eq. (1), which assesses the mean amount of integrated HIV DNA per replicate reaction (λ), akin to digital PCR (22, 23).
| (1) |
A theoretical 95% CI can be estimated to cover the theoretical error for the estimate . Because is a binomial estimate, the Wald method [given by Eq. (2)] is used for assessing the binomial error in most applications. Here, , and k is the z-score for the interval, being 1.96 for a 95% CI.
| (2) |
The Wald error is most widely used for binomial distributions, including digital PCR applications (22, 24). At low concentrations of replicates, however, this method underperforms (25). An alternative interval, termed the Wilson interval, was proposed for lower number of technical replicates (n ≥ 40) (25). This method is shown in Eq. (3), where Xis the total amount of positive replicates (25).
| (3) |
We compared the Wald and Wilson methods by simulating different numbers of replicate PCR reactions from 40 to 200 and in theoretical situations with different numbers of positive replicate reactions to assess the evolution of the error in these situations and to provide statistical evidence for optimal assay design.
STATISTICAL ANALYSIS
Statistical analysis was performed with SAS 9.3 software by use of the PROC REG procedure for regression analysis and PROC GLM for analysis of normal distribution of the HIV-only PCR data.
Results
ASSESSMENT OF THE POISSON METHOD BY USE OF THE STANDARD DILUTION SERIES
We used the Poisson method on two dilution series of the integration standard to assess the linearity and accuracy of the Poisson method. These dilution series had different amounts of cellular inputs, i.e., 7500 or 37 500 genomes per 50-μL reaction, to assess the possible influence of PCR inhibitors. Linear regression of the standard curves revealed similar slope coefficients and accuracies for both dilution series, i.e., a slope coefficient of the low-genomic-copy curve (7500 copies/reaction) of 0.09902 with an R2 of 0.75 (Fig. 2A) and a slope coefficient of the high-genomic-copy curve (37 500 copies/reaction) of 0.10287, with an R2 of 0.77 (Fig. 2B). The slope coefficients close to 0.1 revealed that the absolute number of integrated copies measured in the repetitive-sampling strategy is 10-fold lower than the expected number in the integration standard; this fold difference is stable at all dilution points assessed and is consistent with published data showing that 10% of integration events are detected (16, 17). A third standard curve with higher numbers of integrated copies was run to assess the upper limit of positive to negative wells in the 42-replicate setup. This analysis revealed that all estimates from samples with <0% positive wells in the 42-replicate setup were linearly correlated with the standard dilution series, but at higher percentages the estimates were not predictable (Fig. 2C).
Fig. 2. Serial dilutions of the integration standard assessed by repetitive-sampling Alu-HIV PCR and Poisson statistics.
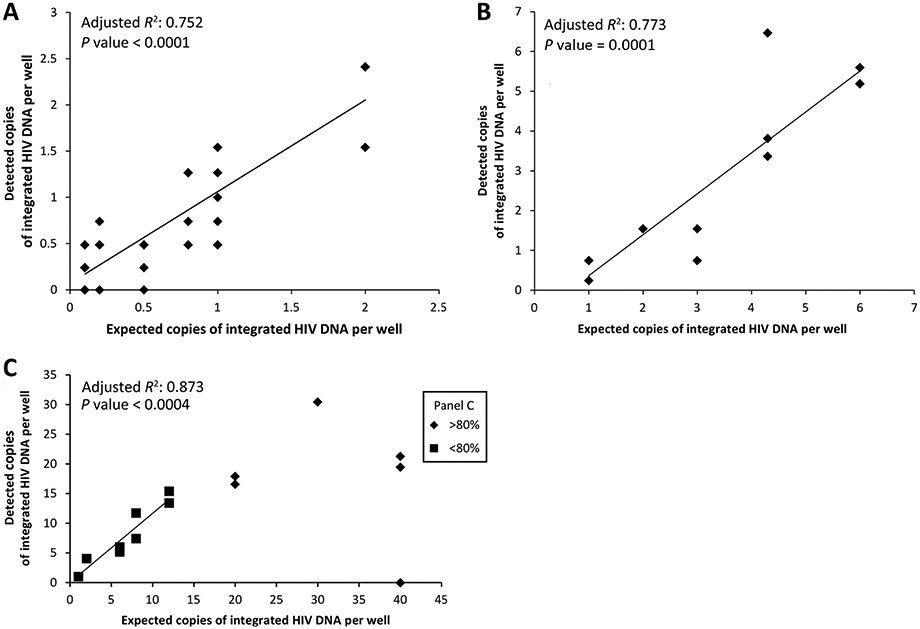
(A) and (B), Linear relation between the expected integrated copies and the measured amount on 7500 cells (2 μg/mL) (A) or 37 500 cells (10 μg/mL) (B) per 50 μL replicate PCR. (C), The relation between expected and measured amounts is linear as long as <80% of PCR replicates are positive. This estimate becomes unpredictable at higher percentages of positive reactions. The values of the Poisson distribution are corrected (10-fold) on the basis of the integration standard calibrator.
COMPARISON OF THE PERCENT POSITIVE METHOD AND THE lnCq METHOD WITH THE POISSON METHOD (FIG. 3)
Fig. 3. Assessment of patient samples by use of the 3 different quantification methods.
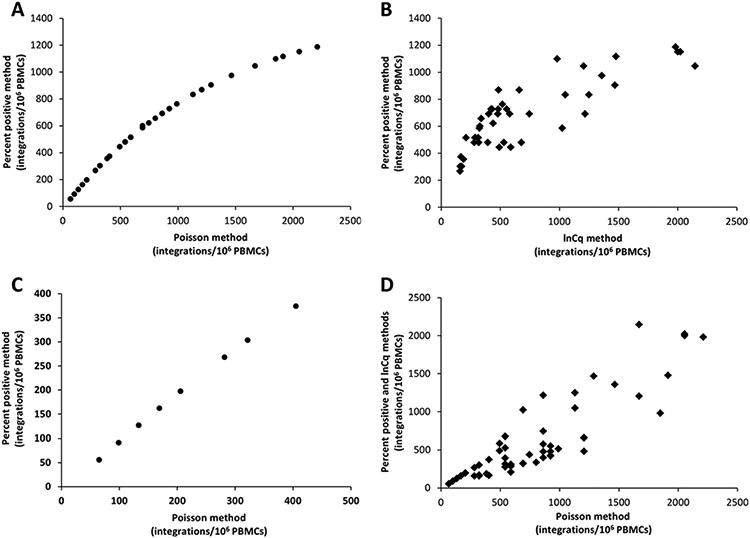
(A), Comparison of the Poisson method with the percent positive method across all patient samples, revealing the logarithmic relation between the 2 methods. (B), Comparison of the percent positive method with the lnCq method in patients with >30% positive replicate reactions. (C), Comparison of the Poisson method with the percent positive method in patients limited to 400 copies (<26% positive reactions) reveals a linear relationship between the 2 methods. (D), Comparison of the Poisson method with both the percent positive method (samples <30% positive replicates) and the lnCq method (samples >30% and >80% positive replicates). The values of the y- and x-axes differ by 10-fold, as normalization for the calibrator was not performed on these data.
To assess the dynamic range of the percent positive and the Poisson method, patient samples with variable amounts of integrated HIV DNA were assessed, regardless of their HAART status or viral load. This comparison revealed that the correlation of the 2 methods is logarithmic in nature (Fig. 3A). Consequently, a logarithmic trend should also be observed when either the Poisson or percent positive method is compared to the lnCq data. Indeed, a logarithmic trend was observed between the percent positive and the lnCq data in patients with higher percentages of positive replicates (>30%) (R2 = 0.744; P < 0.0001) (Fig. 3B). However, statistical analysis of this logarithmic trend could not confirm a significantly improved fit of a linear model vs a logarithmic model (unpublished data). A comparison on a subset of the patient samples with low abundant HIV DNA integrations in the range of 4% to 26% positive PCR replicates was performed, since the percent positive model was previously only used when <30% of the total replicate reactions were positive. This comparison revealed a linear correlation between the Poisson method and the percent positive method, which corresponds to patients with <450 integrated HIV DNA copies per million PBMCs (R2 = 0.787, P < 0.001) (Fig. 3C).
To confirm the higher dynamic range of the Poisson method, it was compared with the combined results of patients with <450 integrated copies per million PBMCs quantified by the percent positive method and patients with higher concentrations of integrated HIV DNA quantified by the lnCq method. A linear correlation was observed, confirming the quantitative accuracy of the Poisson method at higher amounts of integrated HIV DNA compared with the percent positive method (Fig. 3D).
ERROR PROPAGATION BY USE OF THE POISSON METHOD
The frequently used Wald method for estimating the error of binomial data is not an optimal estimator for the binomial error (22, 23). To show the inaccuracy of the Wald method and the better performance of the Wilson method for error estimation at low numbers of replicate PCR reactions, several simulations were performed of Alu-PCR reactions. At lower numbers of technical replicates in combination with low positive replicates, the upper limit of the Wald CI (CIWa) was lower than that of the Wilson CI (CIWi) (Fig. 4A and B). Interestingly, the lower limit of the CIWa was also lower than the lower limit of the CIWi and had values below zero in these low ranges. These values clearly show that the 95% CIWa cannot cover the actual 95% probability, as values below zero cannot exist in this setting. Both error estimates converged with higher amounts of technical replicate reactions.
Fig. 4. (A) and (B), Error propagation of the Wald error (▲) and the Wilson error (●) in the Poisson-based Alu-HIV PCR at different numbers of replicate reactions with a fixed percentage of positive reactions.
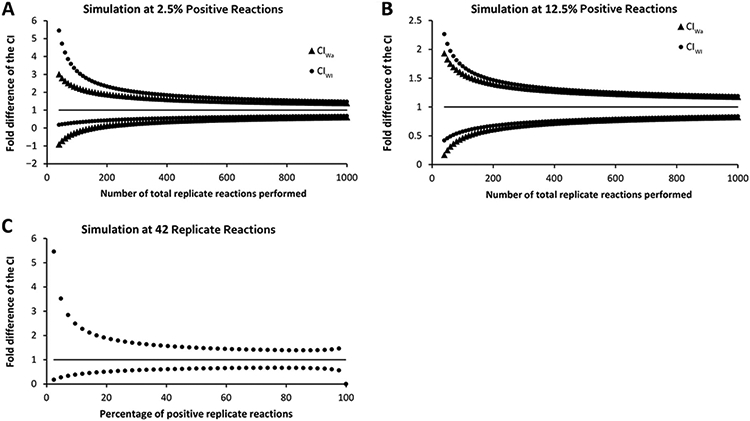
(A), 2.5% positive. (B), 12.5% positive. The black line represents the estimated amount of integrated HIV DNA normalized to 1 (black line) to visualize the error as fold change from the estimate. (C), Wilson error at different percent positive replicates by use of a fixed number of total replicates (n = 42).
Next, the CIWi was simulated in the framework with 42 replicates, but with different numbers of positive replicates to assess the error at different concentrations of integrated HIV DNA within the 42-replicate setup. This analysis allows assessment of the minimal number of positive replicates needed to get an acceptable 95% CI around the estimate. The upper limit of the CIWi is more than 6-fold higher compared to the estimate when only 1 replicate reaction is positive. A logarithmic drop is observed with higher numbers of positive reactions, becoming smaller than 2.5-fold when 4 or more replicates are positive, corresponding to 9.5% positive reactions in a setup with 42 replicate reactions (Fig. 4C).
Discussion
Digital PCR is the division of a sample into multiple replicate end-point PCR reactions that are termed positive or negative. These binary data are processed with Poisson statistics to obtain absolute quantification (21). Direct absolute quantification of end-point PCR increases quantitative accuracy, obviates the need for a standard dilution series, and increases flexibility in assay design (26-28). Most current digital PCR platforms provide the ability to make high numbers of technical replicates from a single sample (22, 26, 29). The nested nature of the Alu-HIV PCR prevents implementation of this assay on 1 of the existing platforms. Yet, the repetitive sampling Alu-HIV PCR can itself be viewed as a modified digital PCR assay with relatively low numbers of technical replicates (5).
The present article illustrates that the Poisson-based quantification method correlates well with both previously described methods. The linear correlation observed when the number of positive samples remains below the limit of 30% coincides with the Poisson distribution being nearly linear in this range. However, the dynamic range of the Poisson-based method is larger, as it is also linearly correlated with the lnCq standard curve method. The higher dynamic range allows the use of a single quantification methodology for all patient samples. Samples with extremely high amounts of integrated HIV DNA can be run with dilution. Patient samples with low amounts of HIV DNA can be assessed by increasing the number of replicate reactions or the amount of input DNA. For the latter strategy, however, PCR inhibition by overloading may impede quantification and should be evaluated in advance. Here we demonstrate that 10 μg DNA per milliliter of sample can be used when the DNA is of high purity (i.e., 5 ng/μL in the PCR mix). As described earlier, a DNA dilution of 40 μg/mL may be used, resulting in 50 μL replicate PCR reactions of approximately 150 000 diploid cellular genomes per reaction, but at this high concentration of genomes, PCR inhibitors must be excluded (19).
The 10-fold difference between absolute copies measured by the Poisson calculation and the expected amount of integrations within the integration standard indicates that with the Alu-HIV PCR, only 10% of the integrated copies are amplified, in agreement with previous studies (17, 20). The consistency of this amplification efficiency over a wide range of dilutions indicates that it does not hamper quantification but decreases the assay sensitivity. The underestimation of integrated copies is explained by the low efficiency of the first PCR reaction, related to the long sizes of some Alu-HIV amplicons and high PCR competition expected from Alu-Alu fragments (8, 16). Consequently, an integration standard is required as a calibrator to enable comparison of data between different setups, platforms, or laboratories. Yet, a dilution curve of this standard is no longer required.
A more important advantage of the Poisson statistics is the introduction of an error estimate comparable to most digital PCR quantification strategies. The frequently used Wald error method underperforms at low replicates (22, 23, 25). In the present Alu-HIV PCR setup with 42 replicate reactions, the Wilson error calculation outperforms the Wald error calculation (25, 30). Other methods for error calculation of binomial data have been suggested, e.g., the exact Clopper Pearson method or Bayesian methods, and some of these may be calculated with online tools on the basis of the raw Alu-PCR data or by specific software packages such as the “binom” or “dpcr” packages for R (25, 31). The linear correlation in Fig. 2C suggests that the Poisson calculation can be used when <80% of the wells are positive. However, further evaluation on clinical samples will be required in this range to determine if the actual errors with the Poisson and lnCq methods are comparable. Theoretically, the error will increase as the number of positive wells approaches 80% by use of the Poisson method, but will decrease with the lnCq method.
The error estimation in the Poisson model can also be used to assess the minimal required number of positive replicates vs total replicate reactions. As depicted in Fig. 4C, the frequency of positive replicates correlates with the range of the 95% CI. A comparison of multiple settings revealed that the fold change of the upper CIs dropped steeply when the number of positive replicates was increased from 1 to 5, independent of the total number of replicates. On the basis of the current data, if a 2.5-fold error is the maximally tolerated error; additional technical replicates should be performed until 4 positive reactions are achieved. To minimize technical variation, we consider 5 positives as a rule-of-thumb threshold for positive replicates to perform robust quantification.
In conclusion, the Poisson method presented simplifies Alu-HIV PCR analysis and facilitates a better implementation of the entire setup in different laboratories for 2 major reasons. First, this method removes the requirement of an extensively validated standard dilution series. However, comparison of results between platforms or laboratories will still require a standard sample as calibrator. Second, the analysis method and error estimate can be used to guide validation of the technique in different setups or on different platforms. A minimum of 40 replicates should be maintained, as the binominal error may become unpredictable with lower numbers when using the Wilson method for error estimation (25).
An Excel worksheet was designed with the Poisson method for absolute quantification and error estimation including the Wilson method (Fig. 5). It is freely available as online Supplemental File 1 and at https://www.integratedhivpcr.ugent.be. This file requires as input the Cq values obtained from the nested Alu-HIV PCR and HIV-only PCR along with the total amount of Alu-HIV PCR replicates and the ratio of detected vs actual integrated HIV in the calibrator.
Fig. 5. Screenshot of the Excel file that is composed for Alu-HIV PCR quantification.

The colored cells in the lower left quadrant require data input, i.e., the correction factor as measured on the standard for calibration to assess the fold difference between the observed and expected number of integrations per well, the total number of Alu-HIV replicates (required for accurate error estimation), the number of cells per replicate reaction (assessed by a qPCR on a reference gene, e.g., RPP30), and the raw Cq values of the Alu-HIV PCR and the HIV-only PCR. Note that negative reactions should be left empty to prevent interference with the analysis. After data input, the results are shown in the shaded areas of the lower right quadrant, i.e., the amount of proviral HIV per well, per cell, or per million cells along with the CIs of each estimate.
Supplementary Material
Acknowledgments:
The authors wish to thank Dr. Frederick Hecht (UCSF School of Medicine) and Mark Connors (NIAID) for contributing patient samples, Dr. Ering Graf, Dr. Matthew Pace, Dr. Jenny Yu, Dr. Stephen Migueles, and Dr. Angele Mexas for providing raw data for the analysis.
Research Funding:
amfAR (grant 108314-51-RGRL), the King Baudoin Foundation (KBS grant 2010-R20640-003), and the University of Pennsylvania. E. Malatinkova, the Agency for Innovation by Science and Technology in Flanders (IWT; grant 111286); U. O’Doherty, NIH NIAID R21 AI087461, NIH NIAID R21 AI 096993; L. Vandekerckhove, the Research Foundation–Flanders (FWO; grant 1.8.020.09.N.00).
Role of Sponsor:
The funding organizations played no role in the design of study, choice of enrolled patients, review and interpretation of data, or preparation or approval of manuscript.
Footnotes
Authors’ Disclosures or Potential Conflicts of Interest: Upon manuscript submission, all authors completed the author disclosure form. Disclosures and/or potential conflicts of interest:
Employment or Leadership: L. Lynch, University of Pennsylvania; U. O’Doherty, University of Pennsylvania.
Consultant or Advisory Role: None declared.
Stock Ownership: None declared.
Honoraria: U. O’Doherty, Gilead Sciences.
Expert Testimony: None declared.
Patents: None declared.
Nonstandard abbreviations: qPCR, quantitative real-time PCR; Cq, quantification cycle; GFP, green fluorescent protein; SCOPE, Observational Study of the Consequences of the Protease Inhibitor Era; UCSF, University of California, San Francisco; NIAID, National Institute of Allergy and Infectious Diseases; HAART, highly active antiretroviral therapy; PBMC, peripheral blood mononuclear cell.
References
- 1.Matreyek KA, Oztop I, Freed EO, Engelman A. Viral latency and potential eradication of HIV-1. Expert Rev Anti Infect Ther 2012;10:855–7. [DOI] [PMC free article] [PubMed] [Google Scholar]
- 2.Durand CM, Blankson JN, Siliciano RF. Developing strategies for HIV-1 eradication. Trends Immunol 2012. [DOI] [PMC free article] [PubMed] [Google Scholar]
- 3.Lewin SR, Evans VA, Elliott JH, Spire B, Chomont N. Finding a cure for HIV: will it ever be achievable? J Int AIDS Soc 2011;14:4. [DOI] [PMC free article] [PubMed] [Google Scholar]
- 4.Lewin SR, Rouzioux C. HIV cure and eradication: how will we get from the laboratory to effective clinical trials? Aids 2011;25:885–97. [DOI] [PubMed] [Google Scholar]
- 5.Strain MC, Richman DD. New assays for monitoring residual HIV burden in effectively treated individuals. Curr Opin HIV AIDS 2013;8:106–10. [DOI] [PMC free article] [PubMed] [Google Scholar]
- 6.Siliciano JD, Siliciano RF. Enhanced culture assay for detection and quantitation of latently infected, resting CD4+ T-cells carrying replication-competent virus in HIV-1-infected individuals. Methods Mol Biol 2005;304:3–15. [DOI] [PubMed] [Google Scholar]
- 7.Eriksson S, Graf EH, Dahl V, Strain MC, Yukl SA, Lysenko ES, et al. Comparative analysis of measures of viral reservoirs in HIV-1 eradication studies. PLoS Pathog 2013;9:e1003174. [DOI] [PMC free article] [PubMed] [Google Scholar]
- 8.Graf EH, O’Doherty U. Quantitation of integrated proviral DNA in viral reservoirs. Curr Opin HIV AIDS 2013;8:100–5. [DOI] [PubMed] [Google Scholar]
- 9.Benkirane M, Corbeau P, Housset V, Devaux C. An antibody that binds the immunoglobulin CDR3-like region of the CD4 molecule inhibits provirus transcription in HIV-infected T cells. EMBO J 1993;12:4909–21. [DOI] [PMC free article] [PubMed] [Google Scholar]
- 10.Rowold DJ, Herrera RJ. Alu elements and the human genome. Genetica 2000;108:57–72. [DOI] [PubMed] [Google Scholar]
- 11.Grover D, Mukerji M, Bhatnagar P, et al. Alu repeat analysis in the complete human genome: trends and variations with respect to genomic composition. Bioinformatics 2004;20:813–7. [DOI] [PubMed] [Google Scholar]
- 12.Butler SL, Hansen MST, Bushman FD, Kannan K, Brahmachari SK. A quantitative assay for HIV DNA integration in vivo. Nat Med 2001;7:631–4. [DOI] [PubMed] [Google Scholar]
- 13.Brussel A, Delelis O, Sonigo P. Alu-LTR real-time nested PCR assay for quantifying integrated HIV-1 DNA. Methods Mol Biol 2005;304:139–54. [DOI] [PubMed] [Google Scholar]
- 14.O’Doherty U, Swiggard WJ, Jeyakumar D, McGain D, Malim MH. A sensitive, quantitative assay for human immunodeficiency virus type 1 integration. J Virol 2002;76:10942–50. [DOI] [PMC free article] [PubMed] [Google Scholar]
- 15.Liszewski MK, Yu JJ, O’Doherty U. Detecting HIV-1 integration by repetitive-sampling Alu-gag PCR. Methods 2009;47:254–60. [DOI] [PMC free article] [PubMed] [Google Scholar]
- 16.Agosto LM, Yu JJ, Dai J, Kaletsky R, Monie D, O’Doherty U. HIV-1 integrates into resting CD4+ T cells even at low inoculums as demonstrated with an improved assay for HIV-1 integration. Virology 2007;368:60–72. [DOI] [PMC free article] [PubMed] [Google Scholar]
- 17.Yu JJ, Wu TL, Liszewski MK, Dai J, Swiggard WJ, Baytop C, et al. A more precise HIV integration assay designed to detect small differences finds lower levels of integrated DNA in HAART treated patients. Virology 2008;379:78–86. [DOI] [PMC free article] [PubMed] [Google Scholar]
- 18.Mexas AM, Graf EH, Pace MJ, Yu JJ, Papasavvas E, Azzoni L, et al. Concurrent measures of total and integrated HIV DNA monitor reservoirs and ongoing replication in eradication trials. Aids 2012;26:2295–306. [DOI] [PMC free article] [PubMed] [Google Scholar]
- 19.Graf EH, Mexas AM, Yu JJ, Shaheen F, Liszewski MK, Di Mascio M, et al. Elite suppressors harbor low levels of integrated HIV DNA and high levels of 2-LTR circular HIV DNA compared to HIV+ patients on and off HAART. PLoS Pathog 2011;7: e1001300. [DOI] [PMC free article] [PubMed] [Google Scholar]
- 20.Agosto LM, Liszewski MK, Mexas A, Graf E, Pace M, Yu JJ, et al. Patients on HAART often have an excess of unintegrated HIV DNA: implications for monitoring reservoirs. Virology 2011;409:46–53. [DOI] [PMC free article] [PubMed] [Google Scholar]
- 21.Vogelstein B, Kinzler KW. Digital PCR. Proc Natl Acad Sci U S A 1999;96:9236–41. [DOI] [PMC free article] [PubMed] [Google Scholar]
- 22.Dube S, Qin J, Ramakrishnan R. Mathematical analysis of copy number variation in a DNA sample using digital PCR on a nanofluidic device. PLoS One 2008;3:e2876. [DOI] [PMC free article] [PubMed] [Google Scholar]
- 23.Hindson BJ, Ness KD, Masquelier DA, et al. High-throughput droplet digital PCR system for absolute quantitation of DNA copy number. Anal Chem 2011;83:8604–10. [DOI] [PMC free article] [PubMed] [Google Scholar]
- 24.Pinheiro LB, Coleman VA, Hindson CM, Belgrader P, Heredia NJ, Makarewicz AJ, et al. Evaluation of a droplet digital polymerase chain reaction format for DNA copy number quantification. Anal Chem 2012;84:1003–11. [DOI] [PMC free article] [PubMed] [Google Scholar]
- 25.Brown LD, Cai TT, DasGupta A. Interval estimation for a binomial proportion. Stat Sci 2001;16: 101–33. [Google Scholar]
- 26.De Spiegelaere W, Malatinkova E, Kiselinova M, Bonczkowski P, Verhofstede C, Vogelaers D, Vandekerckhove L. Touchdown digital polymerase chain reaction for quantification of highly conserved sequences in the HIV-1 genome. Anal Biochem 2013;439:201–3. [DOI] [PubMed] [Google Scholar]
- 27.Strain MC, Lada SM, Luong T, Rought SE, Gianella S, Terry VH, et al. Highly precise measurement of HIV DNA by droplet digital PCR. PLoS One 2013;8:e55943. [DOI] [PMC free article] [PubMed] [Google Scholar]
- 28.Kiselinova M, Pasternak A, De spiegelaere W, Vogelaers D, Berkhout B, Vandekerckhove L. Comparison of droplet digital PCR and seminested real-time PCR for quantification of cell-associated HIV-1 RNA. PLoS One 2014;9: e85999. [DOI] [PMC free article] [PubMed] [Google Scholar]
- 29.Taly V, Pekin D, El Abed A, Laurent-Puig P, et al. Detecting biomarkers with microdroplet technology. Trends Mol Med 2012;18:405–16. [DOI] [PubMed] [Google Scholar]
- 30.Wallis S Binomial CIs and contingency tests: mathematical fundamentals and the evaluation of alternative methods. J Quant Linguist 2013;20: 178–208. [Google Scholar]
- 31.The Wittwerlab for DNA Analysis. uCount for Digital PCR. https://www.dna.utah.edu/ucount/uc.html (Accessed March 2014). [Google Scholar]
Associated Data
This section collects any data citations, data availability statements, or supplementary materials included in this article.