

Abstract
Objectives:
The aim of this study was to evaluate the most ideal inflammatory markers for treatment response and to determine a cutoff value that could predict response to treatment for culture negative neutrocytic ascite (CNNA) patients.
Methods:
This is a retrospective cross-sectional case-controlled study. Patients with CNNA were evaluated by taking ascites fluid sampling at the beginning and on the 5th day of treatment. Neutrophil-to-lymphocyte ratio (NLR), lymphocyte-to-monocyte ratio (LMR), and neutrophil-to-monocyte ratio were calculated.
Results:
Of the 123 cases with cirrhotic ascites disease, 59 were CCNA and 64 were the control group without ascite-fluid infection. There were statistically significant differences for blood monocyte count, NLR (p<0.01), LMR, and C-reactive protein (CRP) (p<0.001) between two groups. Patients in the CNNA group were compared before and after treatment among themselves for the treatment response. There was statistically significant difference in mean platelet volume, monocyte, LMR, and CRP (p<0.05) between two groups. After receiver operator characteristics curve analysis, the best cutoff value for monocyte was <0.64 × 10³/μL (sensitivity 49.2%, specificity 74.6%, positive predictive value [PPV] 65.9%, and negative predictive value [NPV] 59.5%) (p<0.01), for LMR was ≥1.7 (sensitivity 76.3%, specificity 78%, PPV 77.6%, and NPV 76.7%), and for CRP was ≤18 mg/L (sensitivity 91.5% specificity 57.6%, PPV 68.4%, and NPV 87.2%) (p<0.001). When LMR and CRP were used together, sensitivity (86.5%), specificity (83.1%), PPV (83.6%), and NPV (86%) were found to be statistically significantly higher (p<0.001).
Conclusion:
Our results showed that in cirrhotic patients with CNNA, combined LMR + CRP can be used as a novel, low cost and non-invasive test to predict treatment response.
Keywords: Ascitic fluid infection, cirrhosis, c-reactive protein, culture negative neutrocytic ascites, lymphocyte to monocyte ratio
Ascites is the most common complication and reason of the hospitalization in the cirrhotic patients. Almost 60% of patients with cirrhosis will develop ascites within 10 years after diagnosis of the disease.[1] Cirrhotic patients with ascites are generally prone to developing bacterial infection of ascitic fluid. The prevalence of spontaneous bacterial peritonitis (SBP) in outpatients is 1.5–3.5% and 10% in inpatients. Also incidence of SBP ranges from 10% to 30%.[2,3] Ascites fluid infection (AFI) can be lead to increase the mortality up to four hold in this patients.[4] The clinical presentation of SBP is quite variable. It can be asymptomatic or present with fever, abdominal pain, acute kidney injury, impaired liver function tests, and hepatic encephalopathy. Therefore, diagnostic paracentesis should be performed in all cirrhotic patients with ascites without delay at hospital admission to rule out AFI. Furthermore, it should be performed in patients with fever or other signs of systemic inflammation, gastrointestinal bleeding, shock, hepatic encephalopathy, and deterioration of the liver and/or renal function tests.[3,5] However, diagnostic paracentesis has very rare risks such as peritonitis, local infection at the site of paracentesis, hemoperitoneum, visceral perforation, abdominal wall hematoma, and permanent leakage from the paracentesis site.[6,7]
The diagnosis of SBP is based on neutrophil count in ascitic fluid of >250 cells/mm3 and positive bacterial culture results. Culture-negative neutrocytic ascites (CNNA) is defined by greater or equal count of polymorph nuclear neutrophil (PMN) to 250 cells/mm3 without a positive culture.[8] Current American Association for the Study of Liver Diseases and European Association for the Study of the Liver guidelines identify both conditions to have a similar high risk of mortality.[8,9] However, a prompt result of ascitic fluid cell count and culture result is not usually possible in clinical practice. Therefore, empirical antibiotics should be initiated in patients with PMN count >250 cells/mm3 without waiting for the ascite culture result. Antibiotic treatment can be revised if necessary according to the clinical follow-up and ascite culture results of the patient. Unfortunately, the results of ascite fluid culture mostly take several days to 1 week, which propose that they cannot be used as a screening tool. In addition, sometimes PMNs can be lysed during transport to the lab, which can lead to false negative results. For this reason, it is important to search biomarkers which are non-invasive, rapid, and easily applicable that help to predict ascites infection and response of the treatment.[10,11] There are so many alternative biomarkers were used in the literature for diagnosis of SBP such as procalcitonin, mean platelet volume (MPV), fecal calprotectin, tumor necrosis factor-α, interleukin-6, lactoferrin, homocysteine, ascitic fluid triggering receptors expressed on myeloid cells-1, macrophage inflammatory protein-1β, platelet indices, and inflammatory markers.[12-19] In spite of that, there is no study investigating the effectiveness of these inflammatory markers in terms of evaluating the treatment response in the literature.
Therefore, our objective was to compare and evaluate the inflammatory markers between cirrhotic ascitic patients and without ascitic fluid infection. Besides that we aimed to determine a cutoff value which could be able to predict the response of the treatment.
Methods
Study Design
This was a retrospective cross-sectional case-controlled study to evaluate and determine the inflammatory markers which could be able to predict response of the treatment.
Patients
Medical records of cirrhotic patients who received inpatient treatment at the Gastroenterology Department of “Gaziantep University Faculty of Medicine Hospital” between January 2014 and January 2016 were analyzed retrospectively. We included all patients with cirrhotic patients with ascites who did not meet the exclusion criteria. The diagnosis of cirrhosis was made on the basis of clinical, laboratory, radiological, endoscopic, and histopathological findings. We exclude patients with conditions that could affect the inflammatory markers such as immunocompromised patients, sepsis, other bacterial infections, history of antibiotic use within 1 month or under prophylactic antibiotics for SBP, detection of bacterial growth in ascites culture, neoplastic and hematological disorder, diabetes mellitus, hyperlipidemia, hypertension, cardiac failure, major cardiac problems, peripheral vascular disease, and malignant ascites. Furthermore, we exclude patients with secondary bacterial peritonitis due to any surgical cause. After retrospective evaluation, 239 cirrhosis patients with ascites were identified among 1924 cirrhosis patients. A total of 123 cirrhotic ascites patients were included in the study due to exclusion criteria. The study flow chart is given in Figure 1. The following data were obtained from the hospital medical records which include age, gender, hematological tests, biochemical tests, ascites fluid and culture results, Child-Pugh score, and model for end-stage liver disease (MELD) score. The study was performed in accordance with good clinical practice and the Declaration of Helsinki and was approved by the local ethical committee (Ethical Committee of Gaziantep University Clinical Research, 2020/215).
Figure 1.
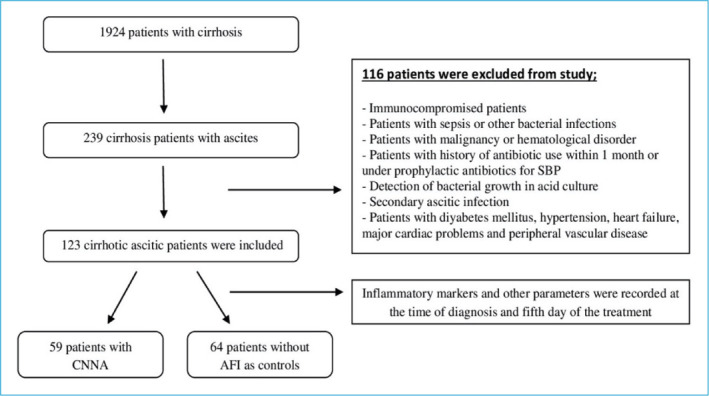
Flow chart of the study.
SBP: Spontaneous bacterial peritonitis; CNNA: Culture negative neutrocytic ascites; AFI: Ascitic fluid infection.
Paracentesis and Ascitic Fluid Culture
Twenty ml of ascitic fluid was taken under complete aseptic technique by paracentesis. The remaining 10 ml of ascites fluid was sent for biochemical and cytological examination in tubes containing ethylenediaminetetraacetic ascites (EDTA) for analysis within 2 h after aspiration. Ascites fluid cultures were done at the bedside. Inoculated blood cultures were incubated with blood, chocolate, and MacConkey agars at 37°C for 3 sequential days.
Diagnostic Criteria of AFI and CNNA
According to international guidelines, AFI was diagnosed if the PMN cell counts in the ascitic fluid ≥250 cells/mm3. Besides that CNNA diagnosis was based on the presence of PMN cell count in the ascitic fluid ≥250 cells/mm3 in the absence of other causes of peritonitis, but without a positive culture in the appropriate setting, which includes; the fluid must be cultured in blood culture bottles, no previous antibiotic therapy, and no other explanation for an elevated PMN count.
Assessments of Blood Biochemistry and Ascite Fluid
In the assessment of ascite fluid; leukocyte, PMN count, albumin, total protein, glucose, and lactate dehydrogenase (LDH) levels were evaluated. However, simultaneously with paracentesis; leukocyte, platelet, neutrophil, lymphocyte, monocyte, MPV, platelet distribution width, liver function tests, albumin, bilirubin, and creatinine blood levels were evaluated. C-reactive protein (CRP) was assessed by particle-enhanced immunoturbidimetric assay. The normal value for CRP was accepted to be <5 mg/dl. All complete blood count (CBC) analysis was performed in hematology laboratory of Gaziantep University Hospital. Neutrophil-to-lymphocyte ratio (NLR), lymphocyte-to-monocyte ratio (LMR), and neutrophil-to-monocyte ratio (NMR) were calculated using routine laboratory tests. MPV increases over time as platelet swell in EDTA; therefore, optimal MPV measurement should be within 2 h of blood sampling.[20] Our CBC analysis was performed within 2 h after blood samples were taken with the Sysmex XN 9000 automated hematology analyzer. All patients who have AFI received the same antibiotic treatment. Control paracentesis were performed after 48 h of initial treatment to evaluate response to treatment and to determine if there was any need to modify antibiotic therapy or to initiate investigations to rule out secondary peritonitis. Response to antibiotic treatment is defined as a 25% reduction in PMN count. At the 5th day of treatment, ascites sampling was performed again. Furthermore, CBC and inflammatory markers were re-evaluated.
Statistical Analysis
The data used in this study were analyzed using the “Statistical Package for the Social Sciences (SPSS) version 22.0 for Windows” (IBM Corp., Armonk, New York, USA). The normality of distribution of continuous variables was tested by Shapiro–Wilk test. Mann–Whitney U test (for non-normal data) was used for comparison of two independent groups and Wilcoxon test (for non-normal data) was used for before-after comparisons. Receiver operator characteristics (ROC) curve analysis was performed to determinate best cutoff and estimate area under curve (AUC) for numerical clinical variables. Furthermore, multivariate binary logistic regression analysis was used to evaluate summed diagnostic ability of LMR and CRP. Sensitivities, specificities, AUCs, and 95% confidence intervals were calculated. ROC curve analysis was performed using MedCalc package 18.11.3 and SPSS was used for univariate analysis and multivariate binary logistic regression analysis. P<0.05 was accepted as statistically significant.
Results
Medical records of 1924 cirrhosis patients were evaluated. Following the inclusion and exclusion criteria, 123 cirrhotic ascitic patients were included in the study. Fifty-nine (48%) of the patients included in the study were evaluated as CNNA and 64 (52%) as the control group without ascites-fluid infection. There were no significant differences in mean age between the CNNA group and in the control group (respectively, 58.1±15.4 years vs. 56.4±14.7 years, p=0.165). Sex distribution was similar in both groups. Sixty-six (53.7%) of the patients included in the study were male, and this rate was 55.9% in the CNNA group and 51.5% in the control group. According to the Child-Pugh classification, 2 (3.3%) of the patients in the CNNA group were Child A, and 31 (52.5%) patients were Child B, 26 (44.2%) patients were Child C. Besides that 5 (7.8%) of the patients in the control group were Child A, 32 (50%) patients were Child B, and 27 (42.2%) patients were Child C. Both groups were compared for age, sex, MELD, ascites and blood biochemical parameters, inflammatory markers, NLR, NMR, LMR, and aspartate transaminase to alanine transaminase ratio (AAR). Clinical, laboratory, and demographic details are shown in Table 1. There were a significant differences between ascite albumin, ascite leukocyte count, and ascite neutrophil count as expected (p<0.05). In addition to this, there were statistically significant differences for blood monocyte count, NLR (p<0.01), LMR, ascite LDH, and CRP (p<0.001) between two groups. No significant differences were found on the other parameters. After that, patients in the CNNA group were compared before and after treatment among themselves in terms of evaluating the treatment response with non-invasive markers. There was a statistically significant difference between the two groups in terms of MPV, monocyte, LMR, and CRP (p<0.05), but no significant difference was found in other parameters (p>0.05) (Table 2). ROC curve analysis was applied to determine the best non-invasive marker that could evaluate the treatment response and to determine the cutoff value for them. After ROC curve analysis, the best cutoff value for monocyte was found to be <0.64 × 10³/μL in the evaluation of treatment response (sensitivity 49.2%, specificity 74.6%, positive predictive value [PPV] 65.9%, and negative predictive value [NPV] 59.5%) (p<0.01). However, the best cutoff value for LMR was ≥1.7 (sensitivity 76.3%, specificity 78%, PPV 77.6%, and NPV 76.7%) and CRP was ≤18 mg/L (sensitivity 91.5% specificity 57.6%, PPV 68.4%, and NPV 87.2%) (p<0.001). No statistically significant cutoff value could be determined for MPV (Fig. 2 and Table 3). Furthermore, multivariate binary logistic regression analysis was used to evaluate summed diagnostic ability of LMR and CRP. When LMR and CRP were combined together, the sensitivity (86.5%), specificity (83.1%), PPV (83.6%), and NPV (86%) were found to be statistically significantly higher (p<0.001).
Figure 2.
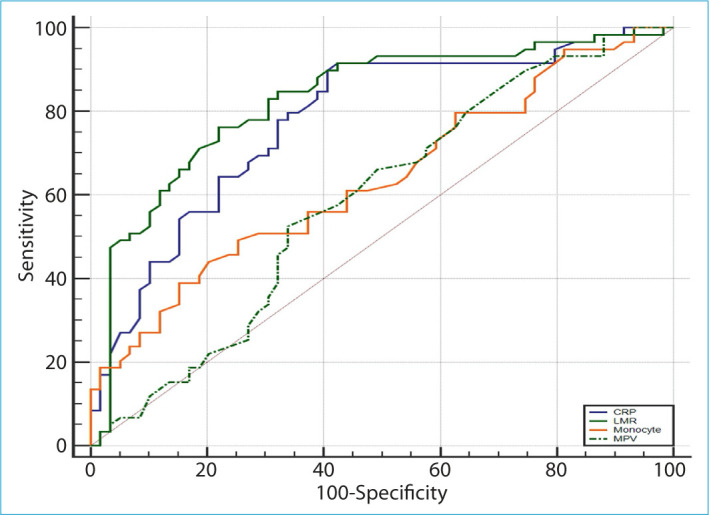
Receiver operator characteristics curves for C-reactive protein (blue line), lymphocyte to monocyte ratio (green solid line), monocyte (orange line), and mean platelet volume (green dashed line).
Table 1.
Clinical and biochemical characteristic of patients with CNNA and control group
| Parameters |
CNNA
n=59 |
Control group
n=64 |
p |
|---|---|---|---|
| Age | 60.1±15.4 | 56.4±14.7 | 0.165 |
| Sex (male/female) | 33/26 | 33/31 | 0.124 |
| MELD | 12.3±7 | 13.1±5.8 | 0.490 |
| Ascite albumin (g/dl) | 0.81±0.6 | 0.61±0.5 | 0.046 |
| Ascite protein (g/dl) | 1.75±1.1 | 1.4±1.07 | 0.086 |
| Ascite LDH (U/L) | 152.4±137.6 | 68.5±42.1 | <0.001 |
| Hemoglobine (g/dl) | 10.2±1.9 | 9.9±2 | 0.542 |
| Leukocyte (103/μL) | 8.6±5.7 | 6.8±3.6 | 0.048 |
| Platelets (103/μL) | 141.3±109.7 | 152.1±157.1 | 0.661 |
| Neutrophil (103/μL) | 6.56±5.43 | 4.88±3.12 | 0.036 |
| Lymphocyte (103/μL) | 0.96±0.53 | 1.02±0.64 | 0.617 |
| Monocyte (103/μL) | 0.67±0.38 | 0.48±0.32 | 0.004 |
| NLR | 8.7±7.18 | 5.88±4.47 | 0.010 |
| NMR | 12.72±11.25 | 13.29±11.71 | 0.787 |
| LMR | 1.50±0.43 | 2.22±0.47 | <0.001 |
| MPV (fL) | 10.01±1.20 | 10.3±1.36 | 0.217 |
| PDW (fL) | 12.1±0.6 | 10.7±0.7 | 0.478 |
| CRP (mg/L) | 72.01±58.45 | 5.72±7.05 | <0.001 |
| Albumin (g/dl) | 2.81±0.61 | 2.92±0.46 | 0.247 |
| Bilirubin (mg/dl) | 6.01±7.94 | 5.54±7.23 | 0.247 |
| AAR | 2.29±1.60 | 1.96±1.17 | 0.193 |
MELD: Model for end stage liver disease; LDH: Lactate dehydrogenase; NLR: Neutrophil to lymphocyte ratio; NMR: Neutrophil to monocyte ratio; LMR: Lymphocyte to monocyte ratio; MPV: Mean platelet volume; PDW: Platelet distribution width; CRP: C-reactive protein; AAR: Aspartate transaminase to alanine transaminase ratio; CNNA: Culture negative neutrocytic ascites.
Table 2.
Clinical and biochemical characteristic of patients with CNNA before treatment and after treatment
| Parameters | Before treatment | After treatment | p |
|---|---|---|---|
| Ascite albumin (g/dl) | 0.81±0.6 | 0.74±0.4 | 0.236 |
| Ascite protein (g/dl) | 1.75±1.1 | 1.67±0.9 | 0.135 |
| Ascite LDH (U/L) | 152.4±137.6 | 123.6±48.3 | 0.089 |
| Hemoglobin (g/dl) | 10.2±1.9 | 10.2±1.8 | 0.644 |
| Leukocyte (103/μL) | 8.6±5.7 | 7.9±5.4 | 0.327 |
| Platelets (103/μL) | 141.3±109.7 | 133.6±92.4 | 0.274 |
| Neutrophil (103/μL) | 6.6±5.4 | 5.9±4.5 | 0.304 |
| Lymphocyte (103/μL) | 0.96±0.53 | 0.98±0.54 | 0.760 |
| Monocyte (103/μL) | 0.67±0.38 | 0.48±0.25 | <0.001 |
| NLR | 8.7±7.2 | 7.6±6.1 | 0.130 |
| NMR | 12.7±11.2 | 14.9±11.7 | 0.180 |
| LMR | 1.5±0.4 | 2.1±0.5 | <0.001 |
| MPV (fL) | 10.1±1.2 | 9.6±1.4 | 0.004 |
| PDW (fL) | 12.1±0.6 | 11.5±0.4 | 0.614 |
| CRP (mg/L) | 72.1±58.4 | 5.72±7.1 | <0.001 |
MELD: Model for end stage liver disease; LDH: Lactate dehydrogenase; NLR: Neutrophil to lymphocyte ratio; NMR: Neutrophil to monocyte ratio; LMR: Lymphocyte to monocyte ratio; MPV: Mean platelet volume; PDW: Platelet distribution width; CRP: C-reactive protein; AAR: Aspartate transaminase to alanine transaminase ratio; CNNA: Culture negative neutrocytic ascites.
Table 3.
Area under the curve (AUC), cut off values, sensitivity, specificity, positive predictive value (PPV), and negative predictive value (NPV) for statistically significant parameters
| Parameter | AUC | p | Cut-Off | Sensitivity (%) | Specifity (%) | PPV (%) | NPV (%) |
|---|---|---|---|---|---|---|---|
| Monocyte | 0.64 (0.54–0.72) | 0.007 | <0.64 | 49.2 | 74.6 | 65.9 | 59.5 |
| LMR | 0.83 (0.75–0.89) | <0.001 | ≥1.7 | 76.3 | 78 | 77.6 | 76.7 |
| CRP | 0.78 (0.69–0.85) | <0.001 | ≤18 | 91.5 | 57.6 | 68.4 | 87.2 |
| MPV | 0.59 (0.49–0.68) | 0.095 | <9.8 | 52.5 | 66.1 | 60.8 | 58.2 |
| LMR+CRP | 0.85 (0.77–0.91) | <0.001 | ≥1.7–≤18 | 86.5 | 83.1 | 83.6 | 86 |
LMR: Lymphocyte to monocyte ratio; MPV: Mean platelet volume; CRP: C-reactive protein; CNNA: Culture negative neutrocytic ascites.
Discussion
AFI is a common bacterial infection in patients with cirrhotic ascite. It is associated with an approximately 20% mortality rate if not diagnosed and treated immediately. Therefore, diagnostic paracentesis should be performed in all cirrhotic patients with ascites without delay at hospital admission to rule out SBP.[21] AFI is divided into four groups according to the neutrophil count in ascites fluid analysis, culture result, and surgical requirement. SBP and CNNA types are the most common. The morbidity and mortality of both are similar. Treatment of AFI patients may be delayed due to the time-consuming ascite culture result and problems with bacterial growth in the culture. Therefore, treatment should be started immediately in patients with AFI.[22,23] However, it has been observed that 33–75% nosocomial SBP patients can be fail to respond to first line empirical antibiotic treatment.[24,25] Many studies have stated that failure of first-line empirical antibiotic treatment is associated with poor survival.[25-27] Therefore, it has become necessary to investigate non-invasive laboratory markers that predict treatment response.
Wehmeyer et al. suggested that the combination of age, CRP, and platelet count in a simple scoring system helps in the rapid diagnosis or exclusion of SBP.[28] Besides that Galvez-Martinez et al. reported that MPV can be used as a predictor of systemic inflammatory response in cirrhotic patients with CNNA.[29] Furthermore, NLR and LMR are an important index of systemic inflammatory responses. They are an important marker for the balance of inflammatory and immune systems. Mousa et al. suggested that NLR and CRP are both easy, simple, and effective markers that can be used in the diagnosis of SBP. They reported that NLR has a 80.3% sensitivity and 88.9% specificity, CRP has a 88.8% sensitivity, and 92.6% specificity. On the other hand, they determined that when they combined NLR and CRP, sensitivity (95.1%) and specificity (98.4%) were better against using alone in diagnosis of SBP.[30] Otherwise, Piotrowski et al. showed that LMR as the best simple predictor of bacterial infection in cirrhotic patients. They proposed that LMR was statistically significantly lower in patients with infection than in those without infection.[31] In our study, we found that ascites LDH, blood neutrophil count, blood monocyte count, NLR, and CRP levels were significantly higher in patients with CNNA than in patients without AFI. On the contrary, LMR was statistically significantly lower in patients with CNNA than in patients without AFI. These results were similar to the studies in the literature.
In the past CNNA has been considered as a less severe variant of SBP. The previous studies showed that patients with SBP had a higher hospital mortality as compared to patients with CNNA, but on follow-up, they had a similar clinical course.[32] The efficacy of antibiotic treatment should be evaluated with a second paracentesis at 48 h from initiating treatment in SBP patients. Response to antibiotic treatment is defined as a 25% reduction in PMN count.[33] Bhatt et al. proposed that the response rate to first-line antibiotic therapy was 48% in SBP patients and 72.5% in CNNA patients. They also reported that patients who did not respond to the initial empirical antibiotic treatment had a poor outcome.[34]
Although there are some studies for non-invasive markers in predicting infection in CNNA patients in the literature, there are no studies for non-invasive markers that can be used to evaluate treatment response. This is the first study in the literature for non-invasive markers in predicting treatment response in CNNA patients. We found that monocyte count, MPV, and CRP levels were statistically significantly lower after antibiotic treatment in CNNA patients. Furthermore, LMR was statistically significantly higher after treatment. We determine statistically significant cutoff value for monocyte count, CRP level, and LMR but no significant cutoff value could be determined for MPV. Based on a serum CRP cutoff value of ≤18 mg/L for the response of the treatment, the sensitivity was 91.5% and specificity was 57.6%. In addition, when using a cutoff value of ≥1.7 for the LMR, the sensitivity and specificity were 76.3% and 78%, respectively. When markers were used together, it was observed that the highest sensitivity (86.5%) and specificity (83.1%) were obtained in the combination of LMR + CRP.
Conclusion
Although there are no studies on non-invasive markers that can be used to evaluate treatment response in CNNA patients, this study is the first study in the literature to predict treatment response. LMR was found to be statistically significantly lower in CNNA patients after antibiotic treatment. Our results showed that in cirrhotic patients with CNNA, monocyte count, MPV, and CRP levels were statistically significantly lower after antibiotic treatment. Furthermore, LMR was statistically significantly higher after treatment. Although the LMR + CRP combination is a non-invasive marker with the highest sensitivity and specificity in evaluating treatment response in our study, it can be used as a new, low-cost, and non-invasive test to predict treatment response.
Disclosures
Ethics Committee Approval: Gaziantep University Faculty of Medicine 2020/215.
Peer-review: Externally peer-reviewed.
Conflict of Interest: None declared.
Authorship Contributions: Concept – S.B., A.E.Y.; Design – S.B., A.E.Y., A.S.; Supervision – S.B., A.E.Y., M.T.G.; Materials – S.B., A.S.; Data collection &/or processing – A.S., A.E.Y; Analysis and/or interpretation – S.B., A.E.Y., M.T.G.; Literature search – S.B., A.S.; Writing –S.B.; Critical review – A.E.Y., M.T.G.
References
- 1.Ginés P, Quintero E, Arroyo V, Terés J, Bruguera M, Rimola A, et al. Compensated cirrhosis: natural history and prognostic factors. Hepatology. 1987;7:122–8. doi: 10.1002/hep.1840070124. [DOI] [PubMed] [Google Scholar]
- 2.Ngamruengphong S, Nugent K, Rakvit A, Parupudi S. Potential preventability of spontaneous bacterial peritonitis. Dig Dis Sci. 2011;56:2728–34. doi: 10.1007/s10620-011-1647-5. [DOI] [PubMed] [Google Scholar]
- 3.Sudulagunta SR, Sodalagunta MB, Bangalore Raja SK, Khorram H, Sepehrar M, Noroozpour Z. Clinical profile and complications of paracentesis in refractory ascites patients with cirrhosis. Gastroenterology Res. 2015;8:228–33. doi: 10.14740/gr661w. [DOI] [PMC free article] [PubMed] [Google Scholar]
- 4.Arvaniti V, D'Amico G, Fede G, Manousou P, Tsochatzis E, Pleguezuelo M, et al. Infections in patients with cirrhosis increase mortality four-fold and should be used in determining prognosis. Gastroenterology. 2010;139:1246–56. doi: 10.1053/j.gastro.2010.06.019. [DOI] [PubMed] [Google Scholar]
- 5.Fernández J, Gustot T. Management of bacterial infections in cirrhosis. J Hepatol. 2012;56(Suppl 1):S1–12. doi: 10.1016/S0168-8278(12)60002-6. [DOI] [PubMed] [Google Scholar]
- 6.Pache I, Bilodeau M. Severe haemorrhage following abdominal paracentesis for ascites in patients with liver disease. Aliment Pharmacol Ther. 2005;21:525–9. doi: 10.1111/j.1365-2036.2005.02387.x. [DOI] [PubMed] [Google Scholar]
- 7.Grabau CM, Crago SF, Hoff LK, Simon JA, Melton CA, Ott BJ, et al. Performance standards for therapeutic abdominal paracentesis. Hepatology. 2004;40:484–8. doi: 10.1002/hep.20317. [DOI] [PubMed] [Google Scholar]
- 8.European Association for the Study of the Liver. EASL Clinical Practice Guidelines for the management of patients with decompensated cirrhosis. J Hepatol. 2018;69:406–60. doi: 10.1016/j.jhep.2018.03.024. [DOI] [PubMed] [Google Scholar]
- 9.Runyon BA; AASLD Practice Guidelines Committee. Management of adult patients with ascites due to cirrhosis: an update. Hepatology. 2009;49:2087–107. doi: 10.1002/hep.22853. [DOI] [PubMed] [Google Scholar]
- 10.Papp M, Vitalis Z, Altorjay I, Tornai I, Udvardy M, Harsfalvi J, et al. Acute phase proteins in the diagnosis and prediction of cirrhosis associated bacterial infections. Liver Int. 2012;32:603–11. doi: 10.1111/j.1478-3231.2011.02689.x. [DOI] [PubMed] [Google Scholar]
- 11.Suvak B, Torun S, Yildiz H, Sayilir A, Yesil Y, Tas A, et al. Mean platelet volume is a useful indicator of systemic inflammation in cirrhotic patients with ascitic fluid infection. Ann Hepatol. 2013;12:294–300. [PubMed] [Google Scholar]
- 12.Abdel-Razik A, Mousa N, Elhammady D, Elhelaly R, Elzehery R, Elbaz S, et al. Ascitic fluid calprotectin and serum procalcitonin as accurate diagnostic markers for spontaneous bacterial peritonitis. Gut Liver. 2016;10:624–31. doi: 10.5009/gnl15120. [DOI] [PMC free article] [PubMed] [Google Scholar]
- 13.Gundling F, Schmidtler F, Hapfelmeier A, Schulte B, Schmidt T, Pehl C, et al. Fecal calprotectin is a useful screening parameter for hepatic encephalopathy and spontaneous bacterial peritonitis in cirrhosis. Liver Int. 2011;31:1406–15. doi: 10.1111/j.1478-3231.2011.02577.x. [DOI] [PubMed] [Google Scholar]
- 14.Abdel-Razik A, Mousa N, Elbaz S, Eissa M, Elhelaly R, Eldars W. Diagnostic utility of interferon gamma-induced protein 10 kDa in spontaneous bacterial peritonitis: single-center study. Eur J Gastroenterol Hepatol. 2015;27:1087–93. doi: 10.1097/MEG.0000000000000400. [DOI] [PubMed] [Google Scholar]
- 15.Parsi MA, Saadeh SN, Zein NN, Davis GL, Lopez R, Boone J, et al. Ascitic fluid lactoferrin for diagnosis of spontaneous bacterial peritonitis. Gastroenterology. 2008;135:803–7. doi: 10.1053/j.gastro.2008.05.045. [DOI] [PubMed] [Google Scholar]
- 16.Abdel-Razik A, Eldars W, Elhelaly R, Eldeeb AA, Abdelsalam M, El-Wakeel N, et al. Homocysteine: a new diagnostic marker in spontaneous bacterial peritonitis. Eur J Gastroenterol Hepatol. 2018;30:779–85. doi: 10.1097/MEG.0000000000001109. [DOI] [PubMed] [Google Scholar]
- 17.Ichou L, Carbonell N, Rautou PE, Laurans L, Bourcier S, Pichereau C, et al. Ascitic fluid TREM-1 for the diagnosis of spontaneous bacterial peritonitis. Gut. 2016;65:536–8. doi: 10.1136/gutjnl-2015-310160. [DOI] [PubMed] [Google Scholar]
- 18.Lesińska M, Hartleb M, Gutkowski K, Nowakowska-Duława E. Procalcitonin and macrophage inflammatory protein-1 beta (MIP-1β) in serum and peritoneal fluid of patients with decompensated cirrhosis and spontaneous bacterial peritonitis. Adv Med Sci. 2014;59:52–6. doi: 10.1016/j.advms.2013.07.006. [DOI] [PubMed] [Google Scholar]
- 19.Abdel-Razik A, Eldars W, Rizk E. Platelet indices and inflammatory markers as diagnostic predictors for ascitic fluid infection. Eur J Gastroenterol Hepatol. 2014;26:1342–7. doi: 10.1097/MEG.0000000000000202. [DOI] [PubMed] [Google Scholar]
- 20.Lancé MD, van Oerle R, Henskens YM, Marcus MA. Do we need time adjusted mean platelet volume measurements? Lab Hematol. 2010;16:28–31. [PubMed] [Google Scholar]
- 21.Solà E, Solé C, Ginès P. Management of uninfected and infected ascites in cirrhosis. Liver Int. 2016;36(Suppl 1):109–15. doi: 10.1111/liv.13015. [DOI] [PubMed] [Google Scholar]
- 22.European Association for the Study of the Liver. EASL clinical practice guidelines on the management of ascites, spontaneous bacterial peritonitis, and hepatorenal syndrome in cirrhosis. J Hepatol. 2010;53:397–417. doi: 10.1016/j.jhep.2010.05.004. [DOI] [PubMed] [Google Scholar]
- 23.Dever JB, Sheikh MY. Review article: spontaneous bacterial peritonitis--bacteriology, diagnosis, treatment, risk factors and prevention. Aliment Pharmacol Ther. 2015;41:1116–31. doi: 10.1111/apt.13172. [DOI] [PubMed] [Google Scholar]
- 24.Fernández J, Acevedo J, Castro M, Garcia O, de Lope CR, Roca D, et al. Prevalence and risk factors of infections by multiresistant bacteria in cirrhosis: a prospective study. Hepatology. 2012;55:1551–61. doi: 10.1002/hep.25532. [DOI] [PubMed] [Google Scholar]
- 25.Ariza X, Castellote J, Lora-Tamayo J, Girbau A, Salord S, Rota R, et al. Risk factors for resistance to ceftriaxone and its impact on mortality in community, healthcare and nosocomial spontaneous bacterial peritonitis. J Hepatol. 2012;56:825–32. doi: 10.1016/j.jhep.2011.11.010. [DOI] [PubMed] [Google Scholar]
- 26.Cheong HS, Kang CI, Lee JA, Moon SY, Joung MK, Chung DR, et al. Clinical significance and outcome of nosocomial acquisition of spontaneous bacterial peritonitis in patients with liver cirrhosis. Clin Infect Dis. 2009;48:1230–6. doi: 10.1086/597585. [DOI] [PubMed] [Google Scholar]
- 27.Song KH, Jeon JH, Park WB, Park SW, Kim HB, Oh MD, et al. Clinical outcomes of spontaneous bacterial peritonitis due to extended-spectrum beta-lactamase-producing Escherichia coli and Klebsiella species: a retrospective matched case-control study. BMC Infect Dis. 2009;9:41. doi: 10.1186/1471-2334-9-41. [DOI] [PMC free article] [PubMed] [Google Scholar]
- 28.Wehmeyer MH, Krohm S, Kastein F, Lohse AW, Lüth S. Prediction of spontaneous bacterial peritonitis in cirrhotic ascites by a simple scoring system. Scand J Gastroenterol. 2014;49:595–603. doi: 10.3109/00365521.2013.848471. [DOI] [PubMed] [Google Scholar]
- 29.Gálvez-Martínez M, Servín-Caamaño AI, Pérez-Torres E, Salas-Gordillo F, Rivera-Gutiérrez X, Higuera-de la Tijera F. Mean platelet volume as a novel predictor of systemic inflammatory response in cirrhotic patients with culture-negative neutrocytic ascites. World J Hepatol. 2015;7:1001–6. doi: 10.4254/wjh.v7.i7.1001. [DOI] [PMC free article] [PubMed] [Google Scholar]
- 30.Mousa N, Besheer T, Abdel-Razik A, Hamed M, Deiab AG, Sheta T, et al. Can combined blood neutrophil to lymphocyte ratio and C-reactive protein be used for diagnosis of spontaneous bacterial peritonitis? Br J Biomed Sci. 2018;75:71–5. doi: 10.1080/09674845.2017.1396706. [DOI] [PubMed] [Google Scholar]
- 31.Piotrowski D, Sączewska-Piotrowska A, Jaroszewicz J, Boroń-Kaczmarska A. Lymphocyte-to-monocyte ratio as the best simple predictor of bacterial infection in patients with liver cirrhosis. Int J Environ Res Public Health. 2020;17:1727. doi: 10.3390/ijerph17051727. [DOI] [PMC free article] [PubMed] [Google Scholar]
- 32.Kim SU, Kim DY, Lee CK, Park JY, Kim SH, Kim HM, et al. Ascitic fluid infection in patients with hepatitis B virus-related liver cirrhosis: culture-negative neutrocytic ascites versus spontaneous bacterial peritonitis. J Gastroenterol Hepatol. 2010;25:122–8. doi: 10.1111/j.1440-1746.2009.05970.x. [DOI] [PubMed] [Google Scholar]
- 33.Marciano S, Díaz JM, Dirchwolf M, Gadano A. Spontaneous bacterial peritonitis in patients with cirrhosis: incidence, outcomes, and treatment strategies. Hepat Med. 2019;11:13–22. doi: 10.2147/HMER.S164250. [DOI] [PMC free article] [PubMed] [Google Scholar]
- 34.Bhat G, Vandana KE, Bhatia S, Suvarna D, Pai CG. Spontaneous ascitic fluid infection in liver cirrhosis: bacteriological profile and response to antibiotic therapy. Indian J Gastroenterol. 2013;32:297–301. doi: 10.1007/s12664-013-0329-y. [DOI] [PubMed] [Google Scholar]