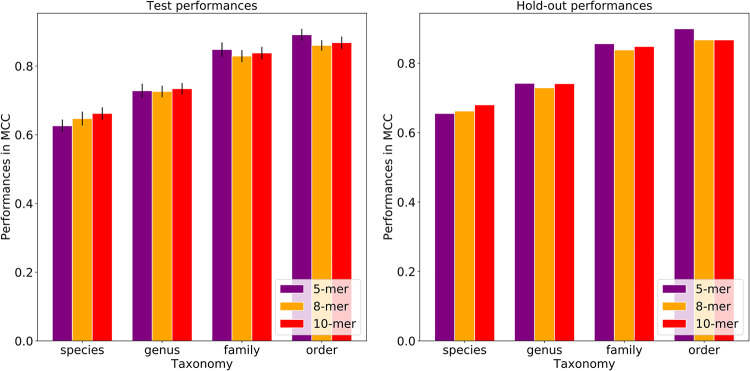
FIG 2.
Host prediction performances by k-mer size for the test and hold-out data sets. Each bar represents the model performance per taxonomic level. While the test performances were reported with standard deviations, the hold-out performances do not have standard deviations as the five models were combined and a single performance was calculated. The plots show that the prediction performances vary when using different k-mer sizes. 5-mers yield the highest MCC at higher taxonomies, while 10-mers yield the highest MCC at lower taxonomies. The model performances generally increased from the species to order level for all the k-mer sizes.

