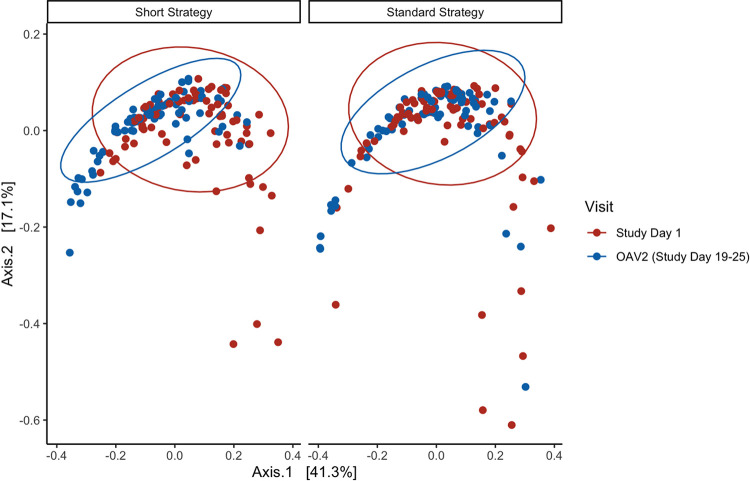
FIG 4.
Principal-coordinate analysis (PCoA) plot of Bray-Curtis dissimilarity of the resistome at enrollment and OAV2 by treatment strategy (n = 158). Principal-coordinate analysis (PCoA) plot of Bray-Curtis dissimilarity of all type-level resistance genes per prokaryotic cell (RGPC) (i.e., the resistome) at enrollment (study day 1) and end of the study (outcome assessment visit 2 [OAV2]) stratified by treatment strategy. Study day 1 is shown in red, and OAV2 is shown in blue.

