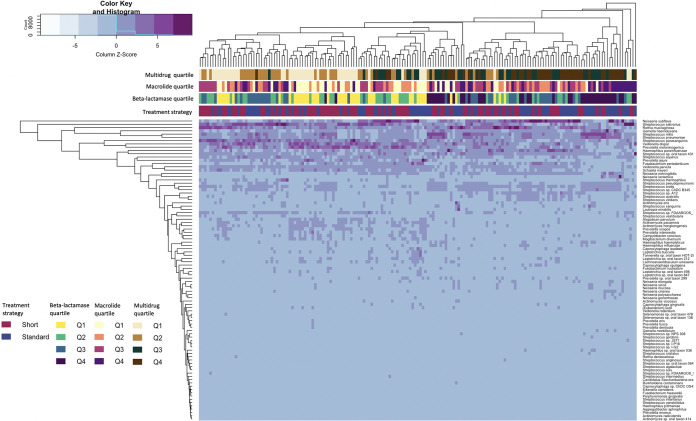
FIG 5.
Heatmap comparing the abundances of 92 bacterial species in 171 children at outcome assessment visit 2 (OAV2). Column-scaled heatmap of log2 transformed relative abundance of the 92 prevalence-filtered bacterial taxa identified in throat samples of 171 children at OAV2 (color key is indicated in the upper left corner). Complete linkage clustering of samples was based on the species and abundance. Bars represent treatment strategy assignment and quartiles of beta-lactamase, macrolide, and multidrug resistance gene types; the color key is indicated in the lower left corner.

