Abstract
At present, phosphate removal and recovery from wastewater is gaining wide attention due to the dual issues of eutrophication, caused by the increased production of algae, and universal phosphorus scarcity. In this study, a layered zinc hydroxide (LZH) was synthesized by a simple precipitation method and characterized via various techniques. Experiments investigating the effect of contact time, pH, LZH dose, initial phosphate concentration, and co-existing ions on phosphate adsorption were conducted. LZH exhibited a high phosphate adsorption capacity (135.4 mg g−1) at a neutral pH. More than 50% of phosphate was removed within the first 60 s of contact time at an initial phosphate concentration of 5 mg L−1. Phosphate removal using the as-prepared LZH adsorbent was also tested in real treated sewage effluent reducing the residual phosphate amount to levels inhibiting to the growth of algae. Furthermore, phosphate desorption from LZH was investigated using acetic acid and sodium hydroxide regenerants which showed to be very effective for phosphate recovery.
This study demonstrates a novel LZH adsorbent synthesized, characterized and applied for high phosphate removal and recovery from wastewater. 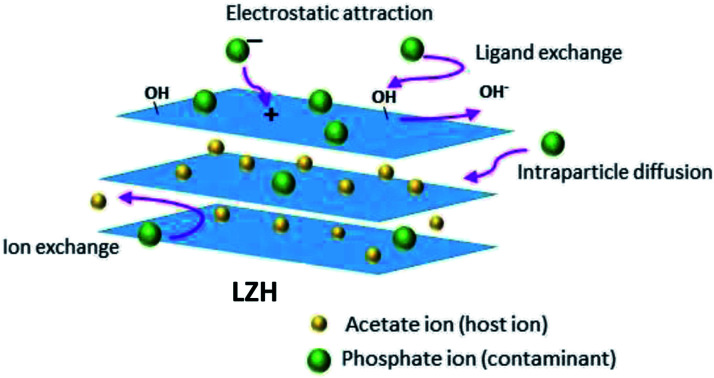
1. Introduction
Phosphate and nutrient pollution of water is a leading cause of water quality degradation.1 At present, eutrophication is one of the most significant surface water quality problems, distinguished by the development of algal blooms, hypoxia, and shortfall in biodiversity.2 High amounts of algae in water have been known to disrupt desalination plant operations in the past, fisheries and groundwater wells.3 As our planet's resources are under increasing pressure, the reuse of treated wastewater in industrial, municipal and agricultural activities has been deemed as a reliable sustainable approach towards water management. However, the reuse of treated wastewater with phosphate amounts higher than the recommended levels could contribute towards biofouling in circulating water or corrosion on some metal surfaces in cooling systems.4 To regulate eutrophication, the United States Environmental Protection Agency (US EPA) provided a recommended limit of 0.05 mg L−1 for total phosphorus in streams entering lakes and 0.1 mg L−1 for total phosphorus in flowing water.5 Furthermore, phosphorus amounts at below 0.5 mg L−1 have been found to be the limiting value for algal growth.6 Therefore, it is essential to ensure phosphate amounts lie below these stringent levels in treated wastewater prior to its reuse.
On the other hand, phosphate is a major nutrient required for plants. As the population surges, so does the requirement for more crop growth, which entails higher phosphate demands. Phosphate is obtained through rock mining, which is a non-renewable source and is depleting.7 Therefore, in order to tackle the dual issues of phosphate-algal growth and a depleting phosphate supplies, the adsorption and recovery of phosphate from used adsorbents is essential.
Sorption is one of the most attractive options for phosphorus removal due to its high efficiency, simplicity, and cost effectiveness.8 Numerous sorbents have been explored for the removal of phosphate and nutrients from water which include modified ion exchange resins,9 waste biomass,10 clay,11 iron and aluminum (hydr)oxides,12 lanthanum hydroxide,13 zirconium oxide14 and layered double hydroxides.15
Layered metal hydroxides are an important family of layered sheet-like materials that include layered single metal hydroxides (LSHs) and layered double hydroxides (LDHs) which comprise a dual metal cations in the host layer. LMHs are characterized by having a structure similar to the natural mineral brucite, consisting of metal hydroxyl layers and interlayer charge balancing anions. Over the past decade, LMHs have gained reputable success in terms of their convenient synthesis, structure, and modification.16 Their ease of tailoring has enabled them to meet the requirements of practical applications in various fields such as catalysis, energy conversion and storage, magnetism, thin film gadgets, adsorption/ion exchange materials, and additives in fire-retardants.16,17
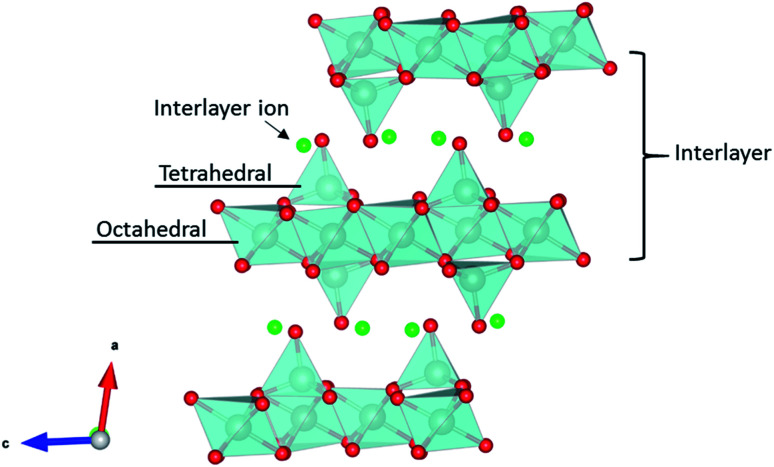
Layered zinc hydroxides (LZHs) fall into the category of LSHs, and typically carry the formula of Zn5(OH)8(A)2·nH2O, where A is an intercalated anion (i.e. carbonate, hydroxyl, nitrate, carboxylate, sulfate).18 The general layered structure as shown in Fig. 1 is based on zinc hydroxide layers comprising octahedrally and tetrahedrally coordinated zinc ions.19 The interlayer anions act as exchangeable anions that neutralize the positive charge of the zinc hydroxide laminates, hence, they provide LZHs with high anion-exchange capacity.19a,20 The appealing feature of LZHs is their easy synthesis, high anion-exchange capacity relative to LDH, and the ability of mixing Zn with other metals to convert LZH to an LDH salt.21
Fig. 1. Schematic diagram of the general crystal structure of layered zinc hydroxide (LZH); zinc ion (shaded grey), oxygen ion (red), interlayer ion (green) (generated using the software VESTA version 3.4.0).19a,22.
In this study, a layered zinc hydroxide (LZH) with acetate interlayer anions was synthesized using a facile synthesis procedure. This adsorbent was then tested for phosphate removal from synthetic and real wastewater solutions. While there are several published material on LDHs and their use as adsorbents,23 to date, limited studies exist on LZHs as adsorbent materials for water treatment.24 In addition, to the knowledge of the authors, no study was found in literature on LZH regeneration and phosphate recovery from contaminated waters using this material.25 Thus, the main objectives of this work are to: (1) prepare an LZH adsorbent and conduct a thorough characterization of the adsorbent using various characterization techniques; (2) investigate phosphate adsorption performance from synthetic water (i.e. adsorption kinetics, effect of pH, adsorption isotherms, effect of co-existing ions) and real treated sewage effluent; (3) study the phosphate desorption behavior of LZH using several regenerants to recover phosphate; (4) propose the possible phosphate removal mechanisms.
2. Materials and methods
2.1. Materials and chemicals
All solutions were prepared with reagent grade chemicals and deionized water (Milli-Q system). Zinc acetate (Zn(OAc)2) and sodium hydroxide (NaOH) were obtained from Sigma-Aldrich and VWR Chemicals (Leuven, Belgium), respectively. Monopotassium phosphate (KH2PO4) was procured from Sigma-Aldrich.
2.2. Synthesis of LZH
Layered zinc hydroxides (LZHs) were prepared from zinc acetate via precipitation process requiring only two chemicals, zinc acetate and NaOH. Zinc acetate (20 g) was dissolved in 600 mL of deionized water. Approximately 5 g of NaOH was dissolved in 100 mL deionized water. The NaOH solution was added dropwise to the zinc acetate solution until the pH reached 7 (±0.2) or until the pH was stable and was unaffected after the addition of the base. The mixing was carried out at 45 °C at a rate of 400 rpm for 24 h. The resulting slurry was filtered in a 0.45 μm mixed cellulose filter (Whatman), washed with deionized water and dried at 90 °C to obtain the LZH solids.
2.3. Characterization
The surface morphology of LZH was studied with a JEOL JSM-7610F field emission SEM at an accelerating voltage of 5 kV. The specific surface area of LZH was measured with a Micromeritics ASAP 2020 BET N2 (Norcross, GA, U.S.A.) surface area analyzer at 77 K. The crystallinity was analyzed with a Rigaku Miniflex-600 XRD (Chapel Hill, NC-U.S.A.), equipped with Cu-Kα lamp (λ = 0.154 nm). The high-resolution XPS measurement was carried out on a ThermoFisher 250 ESCALAB XPS platform. A monochromatic Al Kα X-ray source with a beam energy of 1486 eV and a 180° hemisphere electron analyzer was utilized with an overall energy resolution of better than 500 meV. All of the core level spectra were taken with a normal emission and a pass energy of 20 eV. The binding energy positions were calibrated with respect to the adventitious C–C signal at 284.8 eV. Zeta potential analysis of the LZH material was conducted on a Malvern Zetasizer Ultra equipment. The analysis of phosphate and other anions were conducted on a Dionex Ion Chromatography System (ICS-5000).
2.4. Adsorption experiments
Batch adsorption experiments were carried out to investigate the performance of LZH for phosphate removal in 40 mL polyethylene tubes and a total sample volume of 20 mL. Unless indicated otherwise, 0.5 g L−1 of the adsorbent was added to a 5 mg L−1 phosphate solution. Preliminary experiments showed this dosage mount to be the most efficient in the removal of phosphate as shown in Fig. S1.† Solution pH was adjusted with 0.1–1 mg L−1 HCl or NaOH solutions. All samples were placed in polyethylene centrifuge tubes and shaken at a rate of 350 rpm using a mechanical shaker table. The effect of contact time, solution pH, initial phosphate concentration, and co-existing ions were examined. All experiments were conducted in duplicates and at room temperature. The pH of the experiments was adjusted to a pH of 7 in order to resemble the pH of real treated wastewater. LZH dosage experiments were conducted at different adsorbent amounts ranging between 0.5 and 200 g L−1. The sorbent dose of 0.5 g L−1 was found to be the most efficient and economic dose from preliminary experiments and was used for the subsequent experiments. Kinetics experiments were carried out at time intervals ranging between 0.5 and 120 min to establish the equilibrium contact time and optimum adsorption capacity. Experiments studying the effect of pH on the adsorption capacity of LZH were conducted at a pH range of 3 to 10. Initial phosphate concentration experiments were conducted after the pH experiments at initial concentrations ranging between 0.5 mg L−1 and 1000 mg L−1 at a fixed pH of 7. Initial and final phosphate concentrations were analyzed using a Dionex ion chromatography unit (ICS-5000+).
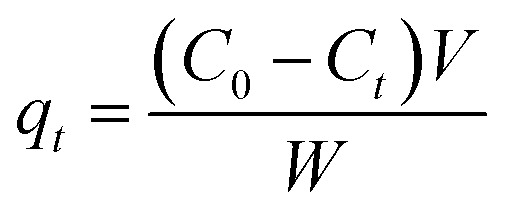
The adsorption capacity, qt, at a specific time t and the percent removal of phosphate were calculated using the equations presented below:
 |
1 |
 |
2 |
where, C0 (mg L−1), and Ct (mg L−1) denote the initial and equilibrium phosphate concentrations, respectively, V (L) is the volume of the solution, and W (g) is the mass of the adsorbent used.
2.5. Kinetics and equilibrium models
In order to identify the equilibrium phosphate adsorption and possible rate-controlling steps, two kinetic models (pseudo-first order, pseudo-second order models) and a diffusion model (intra-particle diffusion model) were used to depict the adsorption process on LZH. The pseudo first order and pseudo-second order kinetics models are generally applied to gain insights on the equilibrium adsorption capacity of adsorbents. The model that delivers the best fit and correlation coefficient is typically utilized to calculate the adsorption capacity.26 In addition, the Weber and Morris intraparticle diffusion model was employed to determine the underlying stages happening during the adsorption process and to determine if intra-particle diffusion is the rate-limiting factor.
Well-established adsorption isotherm models (i.e. Langmuir and Freundlich) were used to fit the experimental results of LZH towards PO4 removal. These equilibrium models provide an insight on the sorbate–sorbent binding interaction and the possible mechanisms of adsorption occurring.27 The Langmuir isotherm works on the assumption that there exists maximum coverage based on monolayer adsorption on the active sites of the adsorption surface.28 A vital feature of the Langmuir model is the dimensionless constant (RL), typically known as the separation factor. The value of RL specifies whether adsorption is irreversible (RL = 0), favorable (0 < RL < 1), linear (RL = 1), or unfavorable (RL > 1). The Freundlich isotherm represents a non-ideal and reversible adsorption system not limited to monolayer adsorption.29 This empirical model is based on a heterogeneous surface and that the concentration of pollutant adsorbed increases with pollutant concentration.30
The models and their parameter details are presented in the ESI.† For the sake of uniformity, phosphate in the manuscript is signified as orthophosphate (PO4).
3. Results and discussion
3.1. X-ray and morphological characterization
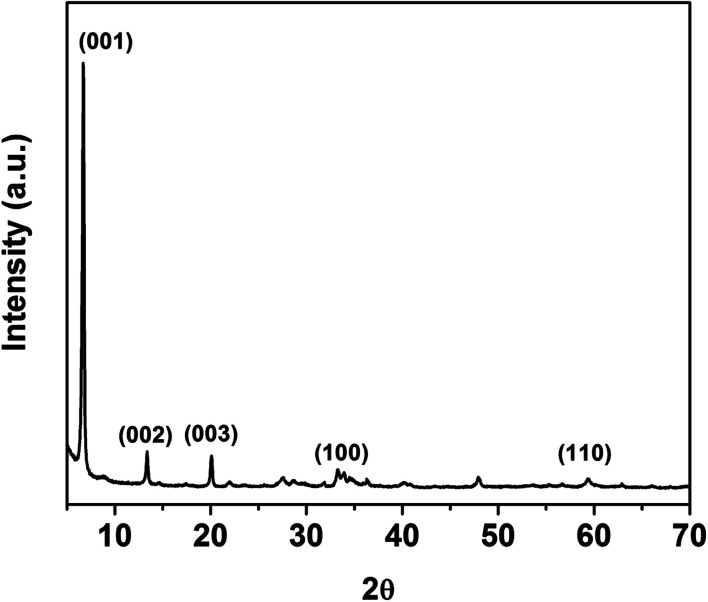
The PXRD pattern shown in Fig. 2 is typical of lamellar compounds related to the brucite structure where sharp and symmetric reflections exist at low angles and broad and asymmetric reflections at high angles. The sharp (00l) reflections at low angles are attributed to continuous orders of basal spacing.31 The peaks at 6.70, 13.35, and 20.0° correspond to the (001), (002), and (003) basal reflections of LZH which are in good agreement with previously published data of a similar structure.19b,32
Fig. 2. Powder X-ray diffraction pattern of LZH.
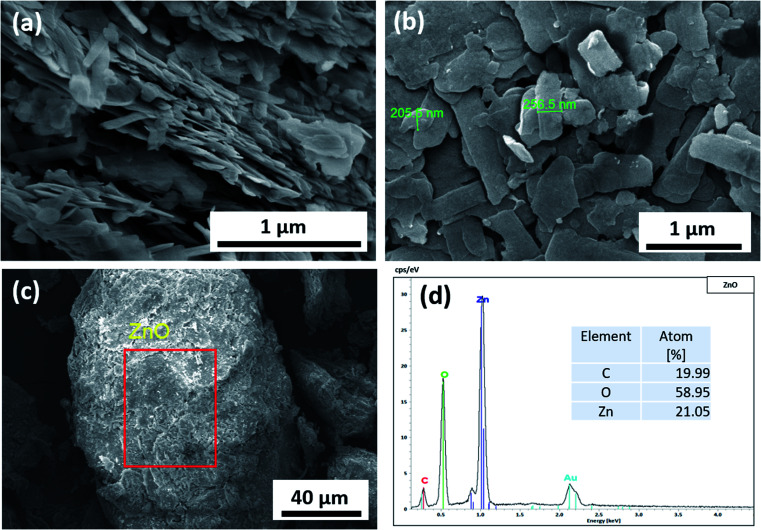
The representative morphology of LZH is shown in Fig. 3a and b. The SEM image in Fig. 3a shows the stacking of the LZH sheets. Fig. 3b depicts the irregularly shaped plate-like structure of the layered hydroxides particles. The elemental analysis of LZH confirms the presence of Zn in the LZH sample. Fig. 3c and the corresponding EDS elemental analysis data in Fig. 3d depict elemental content of LZH, consisting of Zn, O, and C. This EDS characterization was conducted to mainly provide proof of the presence of Zn in our sample, as EDS analysis may not be very reliable in quantifying oxygen and carbon due to atmospheric contamination.
Fig. 3. SEM images of LZH at different magnifications (a and b) and EDS elemental analysis of LZH (c and d).
3.2. Surface area analysis
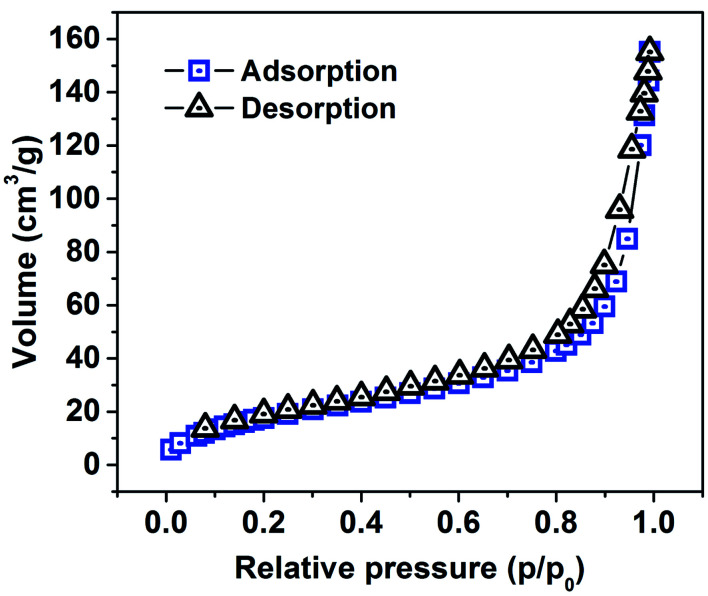
The surface area of the synthesized LZHs was found to be approximately 71.1 m2 g−1. The N2 adsorption–desorption curves are shown in Fig. 4. The features of the isotherm resemble type IV adsorption with an H3-type hysteresis loop according to the classification of Brunauer, Deming, Deming and Teller (BDDT) and IUPAC, respectively.33 This is a characteristic feature of mesoporous solids and the H3 hysteresis loop also suggests the formation of slit-shaped pores by non-rigid aggregation of plate-like particles. The adsorption isotherm does not form a plateau at high P/P0 values and does not show a limited uptake at a relatively high range.34
Fig. 4. N2 adsorption–desorption isotherm of LZH.
3.3. FT-IR analysis
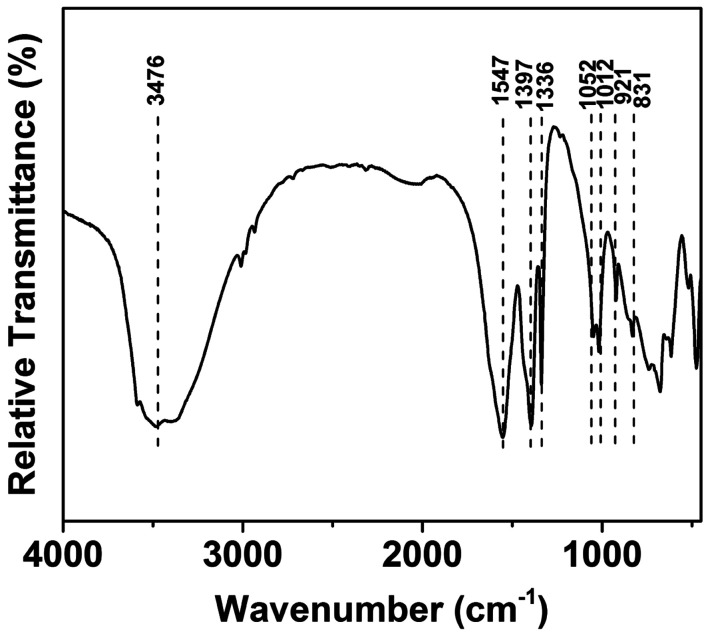
The FTIR spectra of the as-prepared LZH is presented in Fig. 5. The broad band at 3476 cm−1 may be assigned to H2O.32,35 The strong peaks at 1547 and 1397 cm−1 may be attributed to the asymmetric and symmetric stretching vibrations of the carboxylate group from the acetate anion. The absorption bands at 1336 and 1012 cm−1 are characteristic to CH3 from the acetate anion.19b The bending vibration of the interlayer water, typically expected to appear at 1600 cm−1, can be seen to be masked by the strong band of the carboxylate asymmetric stretch.32 The strong peak at 1052 cm−1 in the sample may be assigned to OH bending vibrations.32
Fig. 5. FTIR spectra of the synthesized LZH.
3.4. Effect of contact time and adsorption kinetics
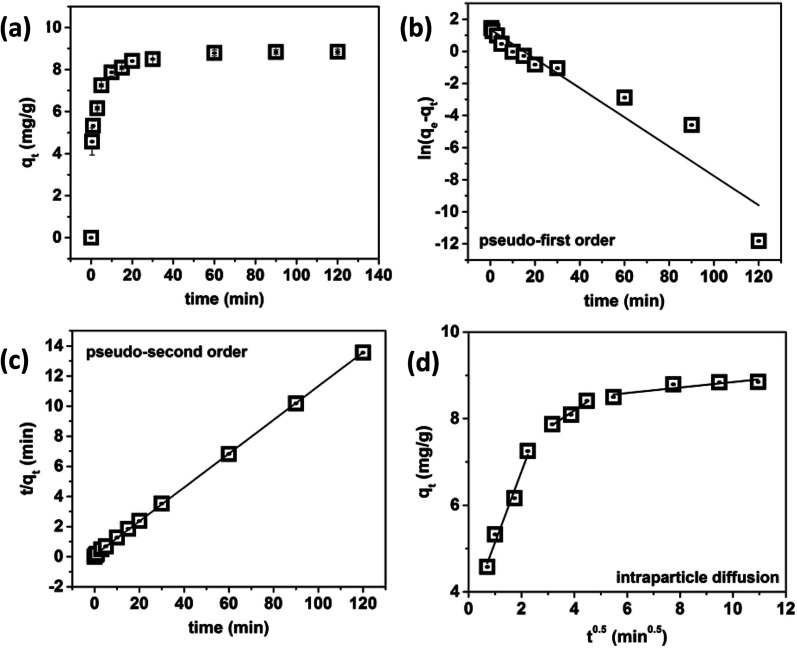
Very fast phosphate adsorption kinetics can be observed in Fig. 6a. More than 50% of phosphate was removed within the first 60 s and more than 70% was removed within the first 5 min of contact time, after which gradual phosphate adsorption was observed. In order to ensure equilibrium was met, an equilibrium contact time of 60 min was used for the remaining experiments. The kinetics data for the adsorption of phosphate using LZH was fit using the pseudo-first order and pseudo-second order kinetics models and intraparticle diffusion model. The pseudo first order kinetics model (Fig. 6b) gave a low correlation coefficient (R2 < 0.917). The pseudo-second order model (Fig. 6c) fit the data very well, and gave an R2 value of 0.999. The calculated value of qe from the pseudo-second order model was 8.92 mg g−1 for the 5 ppm solution. This is quite close to the equilibrium adsorption capacity of 8.85 mg g−1, which confirms the validity of the pseudo-second order kinetics model.
Fig. 6. Effect of contact time on phosphate removal from water (a), pseudo-first order kinetics (b), pseudo-second order kinetics (c) and intraparticle diffusion (d) model plots for the kinetic data.
In order to gain more insight on the rate-controlling step involved in phosphate adsorption on LZH, the intra-particle diffusion model was used to fit the kinetic data. As shown in Fig. 6d, the qtversus t0.5 plot exhibited multilinearity which indicates that the adsorption process is not dominated by intraparticle diffusion.36 In Table 1, the rate constant kp1 was the greatest in the first linear stage. This first linear regime can be attributed to the diffusion in bulk to the external surface of LZH driven by the initial phosphate concentration. In this stage, phosphate ions are adsorbed onto the active sites on the surface and edges of LZH before being transported via intraparticle diffusion. The second linear regime denotes phosphate ions diffusing into the mesopores, or layers of the adsorbent, signifying that intraparticle diffusion is the rate-limiting step of this phase. The last regime denotes the slowest adsorption rate which is typically ascribed to the adsorption of the low phosphate ions in the solution to the less available adsorption sites on LZH, reaching a saturation steady state.37
Kinetic parameters for phosphate adsorption onto LZH.
| Kinetic model | |
|---|---|
| q e,exp (mg g−1) | 8.85 |
| Pseudo-first order | |
| q e,calc (mg g−1) | 3.94 |
| k 1 (min−1) | 0.092 |
| R 2 | 0.908 |
| Pseudo-second order | |
| q e,calc (mg g−1) | 8.92 |
| k 2 (g mg−1 min−1) | 0.115 |
| R 2 | 0.999 |
| Intra-particle diffusion | |
| k p1 (mg g min0.5) | 1.64 |
| C 1 | 3.51 |
| R 2 | 0.969 |
| k p2 (mg g min0.5) | 0.409 |
| C 2 | 6.55 |
| R 2 | 0.952 |
| k p3 (mg g min0.5) | 0.063 |
| C 3 | 8.21 |
| R 2 | 0.715 |
The boundary layer thickness, Ci, offers an insight into the tendency of the phosphate ions to adsorb onto the adsorbent or remain in the solution. Typically, a higher Ci value indicates higher adsorption amounts.38 The higher Ci values for the second and third regime suggest that intraparticle diffusion and phosphate anion exchange with the host anions play a major role in the overall adsorption process.39
3.5. Effect of solution pH
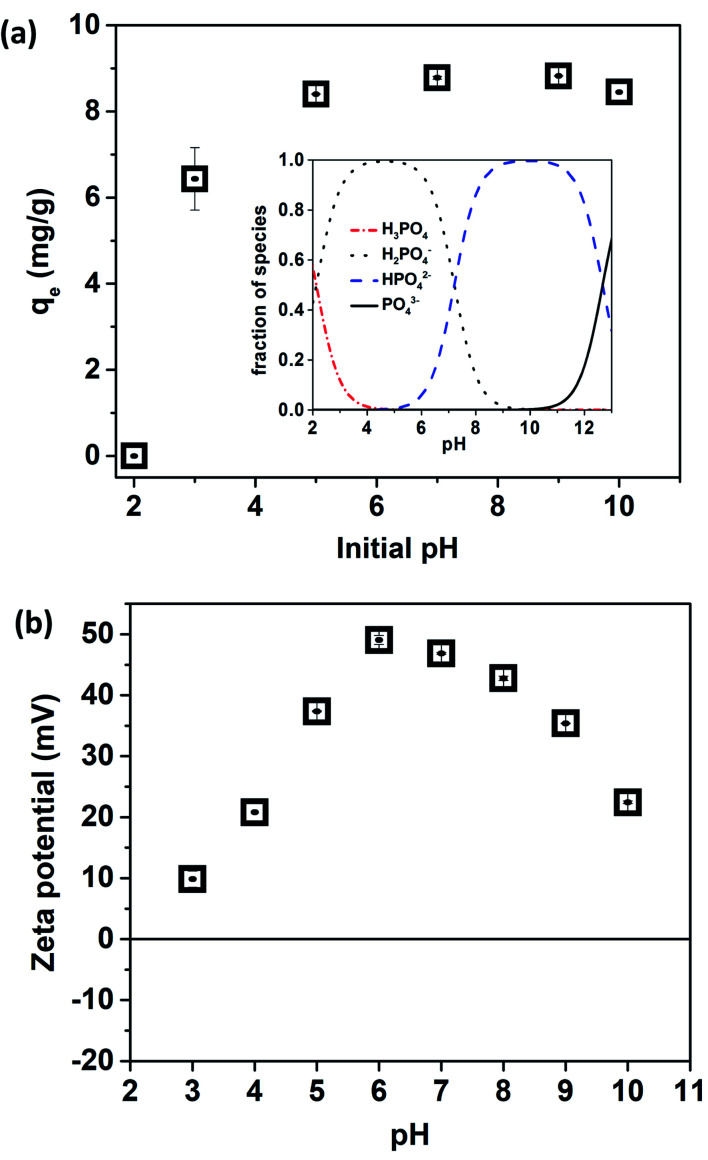
The pH is an important variable affecting physicochemical reactions at the solid–liquid interface in adsorption systems. The phosphate adsorption capacity of LZH at pH values ranging from 2.09 to 9.90 was studied and the results are presented in Fig. 7a. At the low pH of 2.09, complete dissolution of the LZH adsorbent was observed after the adsorption experiments were conducted. This incident is also reflected in the data in Fig. 7a where a negligible amount of phosphate was adsorbed at pH 2.
Fig. 7. Influence of pH on phosphate adsorption by LZH (inset: phosphate speciation diagram) (a) and zeta potential of LZH (b).
The pH of a solution plays a significant role in the speciation of phosphate in water. Phosphate exists in aqueous solutions as H3PO4, H2PO4−, HPO42−, and PO43−, at different ratios depending on the solution pH.40Table 2 represents the equilibrium reactions and dissociation constants for phosphate in water. The speciation diagram for phosphate is depicted in Fig. 7a (inset).
Equilibrium equations and dissociation constants for phosphate in water40.
| Phosphate species | |
|---|---|
| H3PO4 ↔ H+ + H2PO4− | pKa = 2.15 |
| H2PO4− ↔ H+ + HPO42− | pKa = 7.20 |
| HPO42− ↔ H+ + PO43− | pKa = 12.33 |
At pH 3, a considerable amount of phosphate is present in the solution as H3PO4 as illustrated in Fig. 7a (inset), which explains the lower phosphate uptake at that pH value. Phosphate adsorption was found to be the highest over a wide range of pH (4.98 to 9.01). At pH 4 to 6, phosphate mainly exists in the monovalent form, H2PO4− (95 to 98%), while at pH values 7 to 9, phosphate exists as both H2PO4− and HPO42− species. A very low adsorption capacity at pH 2 could be attributed to the dissolution of LZH as zinc hydroxide is soluble in acidic media.
It is specifically important to note the zeta potential of the material in order to observe when the surface of LZH carries a positive and a negative charge. In general, when the zeta potential is positive, phosphate adsorption is favored, and, when it is negative, phosphate repulsion occurs. From the zeta potential plot (Fig. 7b), LZH was found to carry a positive charge throughout the pH range 3 to 10. The lower zeta potential or positive surface charge of LZH at pH 3 could further explain why a lower adsorption capacity was observed at pH 3.
3.6. Adsorption isotherms
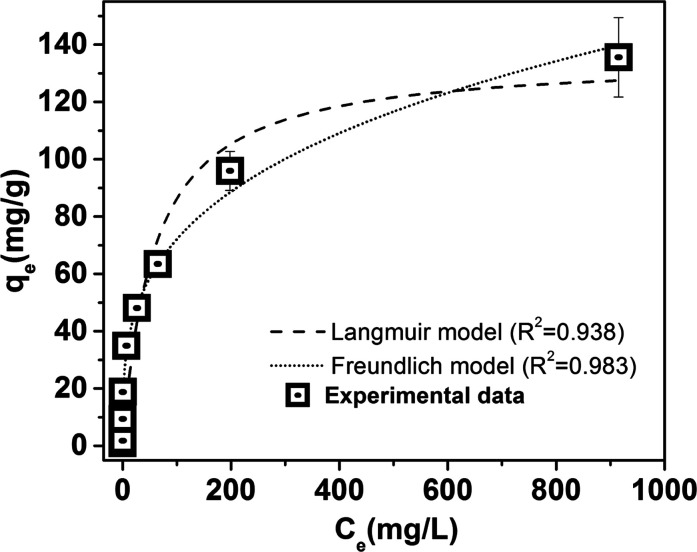
Adsorption isotherms of phosphate on LZH are shown in Fig. 8. The adsorption isotherm model constants and correlation coefficients derived from the fitting of the experimental data with the Langmuir and Freundlich, models are presented in Table 3. The Freundlich model (R2 = 0.983) provided a better description of the isotherm data relative to the Langmuir model (R2 = 0.938) in terms of the higher correlation coefficient. These findings suggest that the adsorption of phosphate on LZH tends towards multilayer adsorption on heterogenous active sites rather than monolayer adsorption.41 Comparable results were obtained by ref. 25 and 42. This provides further evidence that electrostatic interaction between the LZH surface and the negatively charged phosphate species did not play a dominant role in the adsorption process as it becomes less effective after monolayer adsorption.43 It could be said here that the adsorption of phosphate species was likely not limited to the external surface but the intercalation of the phosphate into the interlayer of the layered structure as well.25,44 This is further supported by the intra-particle diffusion studies shown in the previous section.
Fig. 8. Phosphate adsorption isotherms on LZH.
Langmuir and Freundlich isotherm parameters for phosphate adsorption on LZH.
| Equilibrium adsorption models | LZH |
|---|---|
| Langmuir | |
| X m (mg g−1) | 135.4 |
| b | 0.0175 |
| R 2 | 0.938 |
| Freundlich | |
| K F (mg g−1 (dm3 g−1)n) | 18.19 |
| 1/n | 0.299 |
| R 2 | 0.983 |
Table 4 summarizes some recent adsorbent materials used for phosphate removal, including the material prepared in this work. The parameter qmax in the paper represents the adsorption capacity at the highest C0 concentration shown in the paper. The synthesized LZH in this study exhibited a significantly higher adsorption capacity for phosphate relative to the other reported adsorbents. Furthermore, LZH presented other advantages such as higher adsorption at a neutral pH, room temperature, and at a lower adsorbent dosage.
Comparison of various published adsorbents for phosphate removal.
| Adsorbent | q max (mg g−1) | C 0 (mg L−1) | pH/T (°C) | Dosage (g L−1) | Reference |
|---|---|---|---|---|---|
| Thermally treated natural palygorskite at 700 °C | 42 | 5–1000 | 25 °C | 5 | 45 |
| Zerovalent iron | 35 | 3–200 | pH 7 ± 1/20 ± 3 °C | 2.5 | 46 |
| Polyaniline/TiO2 composite | 12.11 | 0–150 | 25 °C | 2 | 47 |
| Metal organic framework (MOFs)-Al-based | 79.4 | 5–100 | pH 5.5/25 °C | 1 | 48 |
| MOFs-Fe-based | 87.6 | ||||
| Polymeric anion exchanger | 61.38 | pH 6.6/30 °C | 1 | 49 | |
| NaLa(CO3)2 | 120.2 | 0–50 | pH 6.8 ± 0.1, 25 ± 1 °C | 0.1 | 50 |
| Fe-zeolite A | 18.15 | 2–20 | pH 5 | 4 | 51 |
| RHB/MgAl-CLDHs | 63.99 | 25–100 | pH 7.4 ± 0.2/25 °C | 1.25 | 25 |
| CuAl/CF-LDH | 98.04 | 25–1000 | pH 8 | 2 | 52 |
| Humic acid coated magnetite nanoparticles | 28.9 | 5–100 | pH 6.6, 25 °C | 1 | 53 |
| Ferric oxide doped halloysite nanotubes | 4.69 | 0.5–100 | pH 7, 25 °C | 3 | 11 |
| Carbide derived carbon (CDC) | 16.14 | 1–100 | pH 6, 25 °C | 1 | 54 |
| LZH | 135.4 | 0.5–1000 | pH 7, 25 °C | 0.5 | This study |
3.7. Effect of competing ions
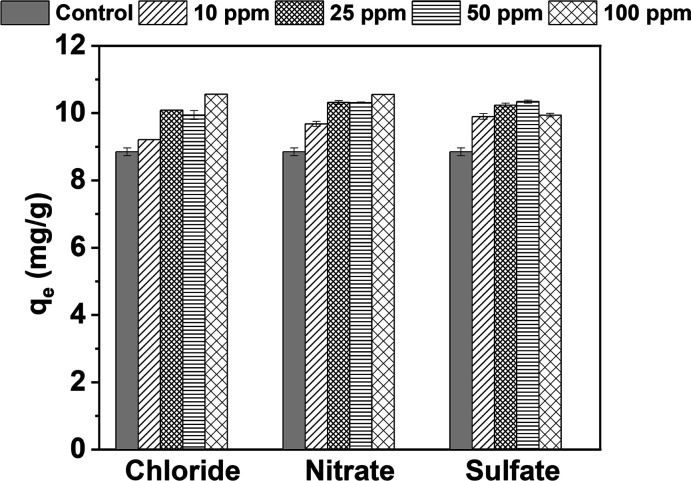
To study the selectivity of the LZH adsorbent for phosphate removal, the effects of the presence of other anions such as Cl−, NO3−, and SO42− were evaluated and the results are shown in Fig. 9. The concentrations of co-existing ions varied from 10 to 100 mg L−1, which is 2 to 50 times the initial phosphate concentration. No significant interference on phosphate adsorption was observed with the presence of these co-existing ions, on the contrary, phosphate adsorption was found to be enhanced. Similar results were observe in a previous study by the authors.11 Comparable results were also reported by Lee and co-workers25 for RHB/MgAl-CLDH and other researchers.55 Lee et al. attributed the adsorbent's high selectivity for phosphate ions to the superior partial negative charges associated with the oxygen atoms on phosphate relative to the other co-existing ions; allowing for a greater electrostatic attraction between the adsorbent and phosphate.
Fig. 9. Effect of co-existing ions on the adsorption of phosphate. Initial phosphate concentration: 5 mg L−1; adsorbent dosage: 0.5 g L−1; pH: 7.0; contact time: 60 min. The control is phosphate uptake without co-existing ions.
3.8. Wastewater treatment
Real treated sewage effluent (TSE) wastewater was treated with the LZH adsorbent in a batch scale setup similar to the previous experiments. Prior to being treated, the TSE was filtered using a 0.45 μm filter and characterized as shown in Table 5 before and after adsorption. The treatment of TSE was conducted under optimized conditions (0.5 g L−1 adsorbent, 60 min contact time) and the pH was not adjusted from the as-received pH of 7.2. The residual phosphate was found to be 0.41 mg L−1 and a negligible amount of the other co-existing anions was removed. As mentioned before, residual phosphorus amounts below 0.5 mg L−1 were reported to be the limiting value for algal growth.6 Therefore, our adsorbent has been found to remove phosphate to safe levels considering inhibition of the growth of algae. This is very important for the reuse of TSE in industrial applications such as in cooling towers, boilers, etc.
Phosphate removal from TSE.
| Parameter | TSE | After adsorption |
|---|---|---|
| pH | 7.2 | 7.04 |
| Chloride (mg L−1) | 533.8 | 544 |
| Nitrate (mg L−1) | 34.7 | 34.6 |
| Sulfate (mg L−1) | 379.5 | 375.3 |
| Phosphate (mg L−1) | 1.2 | 0.41 |
3.9. Regeneration studies
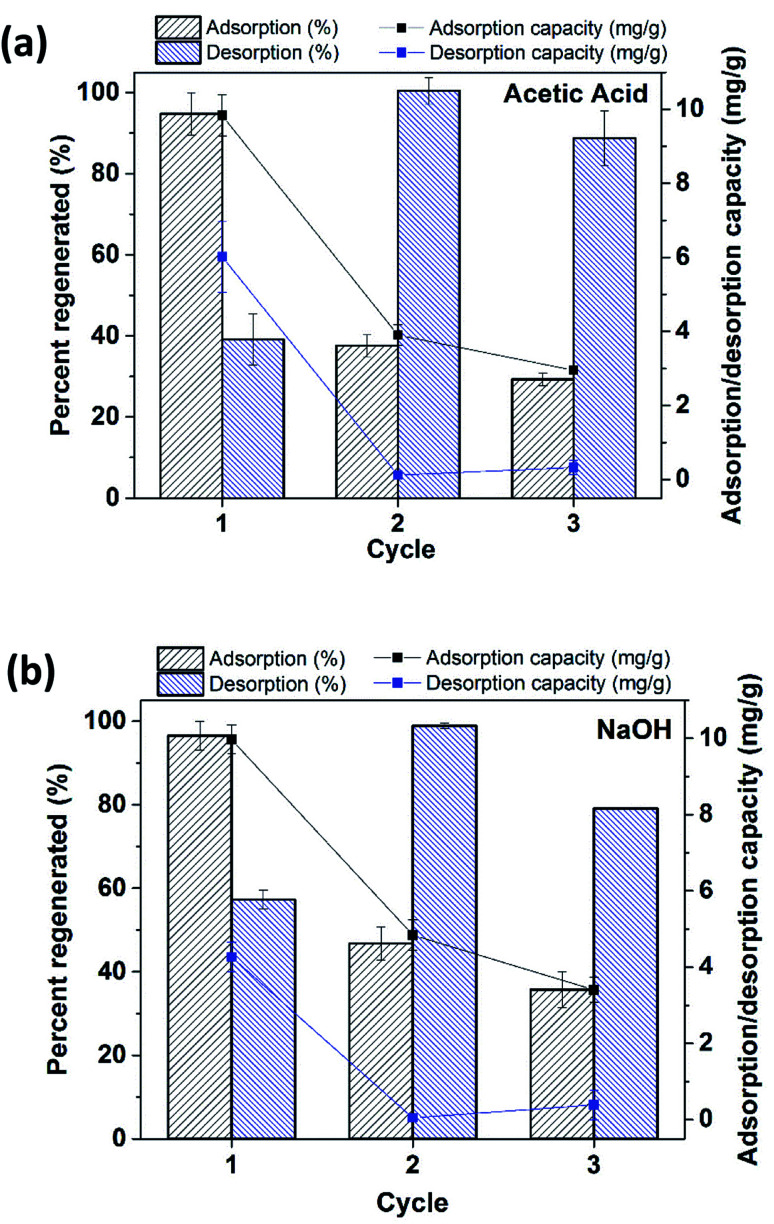
Regeneration experiments were conducted on the LZH material using a 0.00025 M acetic acid solution as well as a 0.01 M NaOH solution and the results are shown in Fig. 10a and b. About 40% and 60% of phosphate was desorbed in Cycle 1 for acetic acid and NaOH regenerants, respectively. Afterwards more than 80% of phosphate was recovered for both regenerants. It is worth noting that phosphate adsorption decreased with each cycle. It was observed that after Cycle 1, nearly 2 ppm phosphate (of the initial 5 ppm phosphate solution) remained in the LZH material and did not desorb, while the rest was removed via ion exchange with the regenerants, acetic acid and NaOH.
Fig. 10. Regeneration behavior LZH with (a) acetic acid and (b) NaOH regenerants. Initial phosphate concentration: 5 mg L−1; adsorbent dosage: 0.5 g L−1; pH: 7.0 (for adsorption); adsorption/desorption time: 60 min. The left scale is for the columns (adsorption/desorption in percent (%)) and the right scale is for the line + symbol (adsorption capacity in mg g−1).
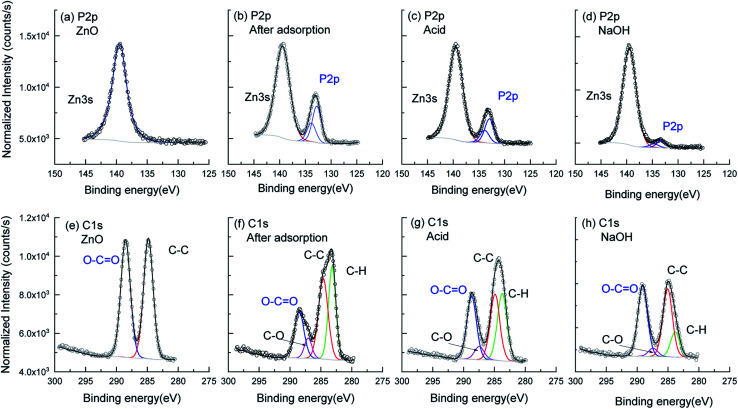
XPS characterization was conducted on LZH before phosphate adsorption, after phosphate adsorption, and after LZH regeneration with both acetic acid and sodium hydroxide solutions. The P 2p and C 1s core level spectra were compared. As indicated in Fig. 11a the pristine LZH (red line) showed a Zn 3s signal at 140 eV and no P-related signal was observed in 128–133 eV binding energy range. In the C 1s spectrum of the pristine sample in Fig. 11e, the C–C components at 284.8 eV and the O–C O related structure at 288 eV can be observed. Such spectra resemble the results in other LZH systems,56 where the second component above 288 eV was assigned to contribution occurring from the acetate interlayer anions. Such assignment enables us to utilize its variation in intensity to predict the corresponding ion substitution.
Fig. 11. High resolution XPS core level spectra of P 2p (top) and C 1s (bottom) taken on the (a and e) pristine LZH, (b and f) after adsorption of phosphate ions, and regeneration with (c and g) acetic acid and (d and h) NaOH solutions. The spectral intensities are normalized to the Zn 3s reference. The corresponding deconvolution are given with a Voigt GL(30) profile after a proper Shirley background subtraction. Due to the small yield, samples are mounted on conducting tape and compared to the LZH (e) where only two components are observed, some more tape-related components are induced in the spectra (f–h).
The mounting of the latter materials on the conducting tape inevitably induced some tape-related components in the C 1s spectra at the lower binding energy end (mainly C–H at 283 eV and C–O at 286 eV). Consequently, we will focus on the O–C O component as the spirit of the work is about the CH3COO− related substitution and we will not elaborate on the extra peaks.
The success of substitution can be approved by the appearance of the P 2p signal after the adsorption process, as indicated in Fig. 11b. Its deconvolution showed a typical P 2p1/2 and P 2p3/2 doublet (in blue) with a spin orbital splitting of 0.9 eV and an intensity ratio of 0.5. The binding energy 132.7 eV of the P 2p3/2 is ascribed to the P–O bond in the (PO4)3− group.48 The substitution process was also accompanied by a significant decrease in the acetate O–C O structure in the C 1s spectrum in Fig. 11f. Table 6 concludes the relative atomic ratio of the samples at different stages. When comparing LZH before and after adsorption of PO4, the Zn atomic percentage remained nearly constant around 26.9%, while the atomic ratio of carbon attenuated from 19% (before adsorption) to 9.6% (after adsorption). One can notice that the majority contribution came from the substitution of acetate ions with phosphate.
Global atomic percentage for the raw, phosphate adsorbed, and regenerated LZH samples.
| Element | Binding energy (eV) | Atomic ratio (%) | |
|---|---|---|---|
| Pristine LZH | C 1s (C–C) | 284.8 | 19.46 |
| O 1s | 531.1 | 53.58 | |
| Zn 2p | 1021.3 | 26.96 | |
| After adsorption | P 2p | 132.7 | 4.92 |
| C 1s (C–C) | 284.8 | 9.67 | |
| O 1s | 530.4 | 58.49 | |
| Zn 2p | 1021.3 | 26.92 | |
| Regeneration in acetic acid | P 2p | 132.5 | 3.52 |
| C 1s (C–C) | 284.8 | 11.67 | |
| O 1s | 530.6 | 58.49 | |
| Zn 2p | 1021.3 | 26.32 | |
| Regeneration in NaOH | P 2p | 132.7 | 0.40 |
| C 1s (C–C) | 284.8 | 11.53 | |
| O 1s | 530.9 | 58.04 | |
| Zn 2p | 1021.3 | 30.02 |
The regeneration of phosphate adsorbed LZH under acetic acid and NaOH treatment and the variations in the phosphate spectrum (Fig. 11c and d) and O–C O spectrum (Fig. 11g and h) were given together with their deconvolution, respectively. As can be observed, in both cases, the P 2p signal decreased and, simultaneously, the relative intensity of the O–C O component increased. Quantitatively, in the first case, a portion of phosphate was replaced by the acetate ions, where the P signal decreased from 4.92% to 3.52%; while, with the NaOH treatment, a significant amount of phosphate ions seemed to be repulsed away by the hydroxyl ions, leaving only 0.4% of P 2p signal in the material after the treatment.
3.10. Mechanism of phosphate adsorption
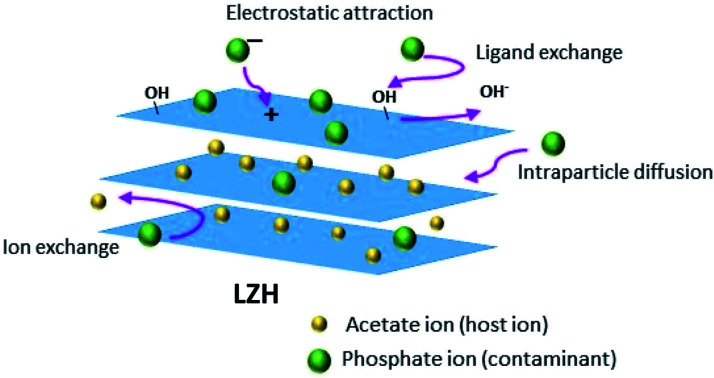
Typically, oxygen-containing functional groups enhance adsorbent–adsorbate interactions by developing surface complexes, electrostatic attraction, and/or ion exchange, ensuing a faster adsorption rate as well as a higher adsorption capacity.57 Phosphate adsorption on LZH is likely to occur via several mechanisms which vary according to the pH of the solution (Fig. 12). At pH 3 to 10, adsorption of phosphate is likely to occur via electrostatic attraction and ion exchange mechanisms between the monovalent phosphate species (H2PO4− at pH 4 to 6) and both monovalent and divalent species (H2PO4− and HPO42− at pH 7 to 10) in the solution and acetate or hydroxide ions on the surface and in between the sheet layers. Table S1† shows the change in the solution pH after the adsorption experiments. The increase in pH after phosphate adsorption at low initial pH values (2.09 to 4.98) and the persisting phosphate removal at higher initial pH supports the ion exchange mechanism.58 Therefore, ion exchange and electrostatic interactions could be considered as the major mechanisms for phosphate adsorption on LZH.59 This information is also supported by the intraparticle diffusion model results which indicate the diffusion of phosphate in between the layers of LZH. Based on the pH and zeta potential results, it can be said that LZH can be used at a wide pH range whilst maintaining a high adsorption capacity, making it very attractive for practical purposes.
Fig. 12. Proposed mechanisms of phosphate adsorption on LZH.
4. Conclusion
In this study, LZH was synthesized via a simple co-precipitation process that could be easily scaled up. LZH exhibited high phosphate adsorption in a synthetic solution as well as in real treated sewage effluent. Phosphate adsorption was not found to be affected significantly by changes in pH or in the presence of co-existing ions at various concentrations. In addition, phosphate regenerations studies on LZH were conducted using both acetic acid and NaOH regenerants. Characterization of LZH before phosphate adsorption, after phosphate adsorption, and after phosphate regeneration revealed the successful adsorption and regeneration of phosphate on LZH whilst maintaining its structural integrity. Results from this study reveal that LZH is a promising adsorbent for the adsorption and recovery of phosphate from water as well as for the treatment of treated wastewater effluent.
Conflicts of interest
The authors declare no competing financial interest.
Supplementary Material
Acknowledgments
The authors would like to acknowledge the support of the Qatar Environment and Energy Research Institute (QEERI) at Hamad Bin Khalifa University (HBKU). The authors are grateful to the director of QEERI's Core Laboratories, Dr Said Mansour, as well as the following Core Laboratory members: Dr Akshath Raghu Shetty (XRD) and Mr Mujaheed Pasha (SEM and EDS) for their characterization support. The authors would also like to thank Oak Ridge National Laboratory, managed by UT Battelle, LLC (DE-AC05-00OR22725) where part of this research study was performed.
Electronic supplementary information (ESI) available. See DOI: 10.1039/d1ra04279c
References
- (a) EPA, in Case Studies on Implementing Low-Cost Modifications to Improve Nutrient Reduction at Wastewater Treatment Plants, United States Environmental Protection Agency, 2015 [Google Scholar]; (b) Li X. Kuang Y. Chen J. Wu D. J. Colloid Interface Sci. 2020;574:197–206. doi: 10.1016/j.jcis.2020.04.050. [DOI] [PubMed] [Google Scholar]
- van Dael T. De Cooman T. Verbeeck M. Smolders E. Water Res. 2020;168:115168. doi: 10.1016/j.watres.2019.115168. [DOI] [PubMed] [Google Scholar]
- (a) Darwish M. A. Mohtar R. Desalin. Water Treat. 2013;51:75–86. doi: 10.1080/19443994.2012.693582. [DOI] [Google Scholar]; (b) Al Jaberi M. Mallet M. Greenwell H. C. Abdelmoula M. Ruby C. Appl. Clay Sci. 2019;182:105281. doi: 10.1016/j.clay.2019.105281. [DOI] [Google Scholar]
- Veil J. A., in Use of reclaimed water for power plant cooling, Argonne National Lab. (ANL), Argonne, IL (United States), 2007 [Google Scholar]
- U.S. Environmental Protection Agency, in Quality criteria for water 1986, Report 440/5-86-001 (ed. Office of Water), U.S. Environmental Protection Agency, Washington, DC, 1986 [Google Scholar]
- Goronszy M. Water Sci. Technol. 1992;26:2253–2256. doi: 10.2166/wst.1992.0709. [DOI] [Google Scholar]
- Zhang X. Shen J. Ma Y. Liu L. Meng R. Yao J. J. Colloid Interface Sci. 2020;562:578–588. doi: 10.1016/j.jcis.2019.11.076. [DOI] [PubMed] [Google Scholar]
- Xi H. Li Q. Yang Y. Zhang J. Guo F. Wang X. Xu S. Ruan S. Appl. Clay Sci. 2021;201:105919. doi: 10.1016/j.clay.2020.105919. [DOI] [Google Scholar]
- Wiriyathamcharoen S. Sarkar S. Jiemvarangkul P. Nguyen T. T. Klysubun W. Padungthon S. Chem. Eng. J. 2020;381:122671. doi: 10.1016/j.cej.2019.122671. [DOI] [Google Scholar]
- Wendling L. A. Blomberg P. Sarlin T. Priha O. Arnold M. Appl. Geochem. 2013;37:157–169. doi: 10.1016/j.apgeochem.2013.07.016. [DOI] [Google Scholar]
- Almasri D. A. Saleh N. B. Atieh M. A. McKay G. Ahzi S. Sci. Rep. 2019;9:3232. doi: 10.1038/s41598-019-39035-2. [DOI] [PMC free article] [PubMed] [Google Scholar]
- (a) Ajmal Z. Muhmood A. Usman M. Kizito S. Lu J. Dong R. Wu S. J. Colloid Interface Sci. 2018;528:145–155. doi: 10.1016/j.jcis.2018.05.084. [DOI] [PubMed] [Google Scholar]; (b) Tian S. Jiang P. Ning P. Su Y. Chem. Eng. J. 2009;151:141–148. doi: 10.1016/j.cej.2009.02.006. [DOI] [Google Scholar]
- Kong L. Tian Y. Li N. Liu Y. Zhang J. Zhang J. Zuo W. Appl. Clay Sci. 2018;162:507–517. doi: 10.1016/j.clay.2018.07.005. [DOI] [Google Scholar]
- Bui T. H. Hong S. P. Kim C. Yoon J. J. Colloid Interface Sci. 2020;586:741–747. doi: 10.1016/j.jcis.2020.10.143. [DOI] [PubMed] [Google Scholar]
- (a) Kong L. Tian Y. Wang Y. Li N. Liu Y. Pang Z. Huang X. Li M. Zhang J. Zuo W. Chem. Eng. J. 2019;359:902–913. doi: 10.1016/j.cej.2018.11.007. [DOI] [Google Scholar]; (b) Kim T.-H. Lundehøj L. Nielsen U. G. Appl. Clay Sci. 2020;189:105521. doi: 10.1016/j.clay.2020.105521. [DOI] [Google Scholar]
- Yin H. Tang Z. Chem. Soc. Rev. 2016;45:4873–4891. doi: 10.1039/C6CS00343E. [DOI] [PubMed] [Google Scholar]
- Rogez G. Massobrio C. Rabu P. Drillon M. Chem. Soc. Rev. 2011;40:1031–1058. doi: 10.1039/C0CS00159G. [DOI] [PubMed] [Google Scholar]
- Leung A. H. Pike S. D. Clancy A. J. Yau H. C. Lee W. J. Orchard K. L. Shaffer M. S. Williams C. K. Chem. Sci. 2018;9:2135–2146. doi: 10.1039/C7SC04256F. [DOI] [PMC free article] [PubMed] [Google Scholar]
- (a) Gordeeva A. Hsu Y.-J. Jenei I. Z. Brant Carvalho P. H. Simak S. I. Andersson O. Häussermann U. ACS Omega. 2020;5:17617–17627. doi: 10.1021/acsomega.0c02075. [DOI] [PMC free article] [PubMed] [Google Scholar]; (b) Shinagawa T. Watanabe M. Mori T. Tani J.-i. Chigane M. Izaki M. Inorg. Chem. 2018;57:13137–13149. doi: 10.1021/acs.inorgchem.8b01242. [DOI] [PubMed] [Google Scholar]
- (a) Tran H. N. Lin C.-C. Chao H.-P. Sep. Purif. Technol. 2018;192:36–45. doi: 10.1016/j.seppur.2017.09.060. [DOI] [Google Scholar]; (b) Miao J. Xue M. Itoh H. Feng Q. J. Mater. Chem. 2006;16:474–480. doi: 10.1039/B511110B. [DOI] [Google Scholar]
- Demel J. Pleštil J. Bezdička P. Janda P. Klementová M. Lang K. J. Colloid Interface Sci. 2011;360:532–539. doi: 10.1016/j.jcis.2011.04.024. [DOI] [PubMed] [Google Scholar]
- Momma K. Izumi F. J. Appl. Crystallogr. 2011;44:1272–1276. doi: 10.1107/S0021889811038970. [DOI] [Google Scholar]
- Yang Z.-z. Zhang C. Zeng G.-m. Tan X.-f. Wang H. Huang D.-l. Yang K.-h. Wei J.-j. Ma C. Nie K. J. Mater. Chem. A. 2020;8:4141–4173. doi: 10.1039/C9TA13522G. [DOI] [Google Scholar]
- Ma W. Ma R. Liang J. Wang C. Liu X. Zhou K. Sasaki T. Nanoscale. 2014;6:13870–13875. doi: 10.1039/C4NR04166F. [DOI] [PubMed] [Google Scholar]
- Lee S. Y. Choi J.-W. Song K. G. Choi K. Lee Y. J. Jung K.-W. Composites, Part B. 2019;176:107209. doi: 10.1016/j.compositesb.2019.107209. [DOI] [Google Scholar]
- Ho Y.-S. J. Hazard. Mater. 2006;136:681–689. doi: 10.1016/j.jhazmat.2005.12.043. [DOI] [PubMed] [Google Scholar]
- Foo K. Y. Hameed B. H. Chem. Eng. J. 2010;156:2–10. doi: 10.1016/j.cej.2009.09.013. [DOI] [Google Scholar]
- Borgnino L. Avena M. J. De Pauli C. P. Colloids Surf., A. 2009;341:46–52. doi: 10.1016/j.colsurfa.2009.03.037. [DOI] [Google Scholar]
- Chen G. Han B. Yan H. J. Colloid Interface Sci. 1998;201:158–163. doi: 10.1006/jcis.1998.5408. [DOI] [Google Scholar]
- Luengo C. Puccia V. Avena M. J. Hazard. Mater. 2011;186:1713–1719. doi: 10.1016/j.jhazmat.2010.12.074. [DOI] [PubMed] [Google Scholar]
- Goh K.-H. Lim T.-T. Dong Z. Water Res. 2008;42:1343–1368. doi: 10.1016/j.watres.2007.10.043. [DOI] [PubMed] [Google Scholar]
- Biswick T. Jones W. Pacuła A. Serwicka E. Podobinski J. Solid State Sci. 2009;11:330–335. doi: 10.1016/j.solidstatesciences.2008.06.018. [DOI] [Google Scholar]
- Brunauer S. Deming L. S. Deming W. E. Teller E. J. Am. Chem. Soc. 1940;62:1723–1732. doi: 10.1021/ja01864a025. [DOI] [Google Scholar]
- Jun H. Zhiliang Z. Hongtao L. Yanling Q. RSC Adv. 2014;4:5156–5164. doi: 10.1039/C3RA46680A. [DOI] [Google Scholar]
- de Oliveira H. B. Wypych F. J. Solid State Chem. 2016;243:136–145. doi: 10.1016/j.jssc.2016.08.019. [DOI] [Google Scholar]
- (a) Iftekhar S. Küçük M. E. Srivastava V. Repo E. Sillanpää M. Chemosphere. 2018;209:470–479. doi: 10.1016/j.chemosphere.2018.06.115. [DOI] [PubMed] [Google Scholar]; (b) Seftel E. Ciocarlan R. Michielsen B. Meynen V. Mullens S. Cool P. Appl. Clay Sci. 2018;165:234–246. doi: 10.1016/j.clay.2018.08.018. [DOI] [Google Scholar]
- Cui Q. Jiao G. Zheng J. Wang T. Wu G. Li G. RSC Adv. 2019;9:18641–18651. doi: 10.1039/C9RA02052G. [DOI] [PMC free article] [PubMed] [Google Scholar]
- Salifu A., Fluoride Removal from Groundwater by Adsorption Technology, CRC Press, 2017 [Google Scholar]
- Li W. Zhu A. Stewart A. Liu Z. Cheng Y.-B. Zhao Z. He H. RSC Adv. 2016;6:114037–114045. doi: 10.1039/C6RA23650B. [DOI] [Google Scholar]
- Li M. Liu J. Xu Y. Qian G. Environ. Rev. 2016;24:319–332. doi: 10.1139/er-2015-0080. [DOI] [Google Scholar]
- Zhang P. Ouyang S. Li P. Huang Y. Frost R. L. Chem. Eng. J. 2019;360:1137–1149. doi: 10.1016/j.cej.2018.10.179. [DOI] [Google Scholar]
- Gupta N. K. Saifuddin M. Kim S. Kim K. S. J. Mol. Liq. 2020;297:111935. doi: 10.1016/j.molliq.2019.111935. [DOI] [Google Scholar]
- Suh M.-J. Shen Y. Chan C. K. Kim J.-H. Langmuir. 2019;35:8699–8708. doi: 10.1021/acs.langmuir.9b00539. [DOI] [PubMed] [Google Scholar]
- Halajnia A. Oustan S. Najafi N. Khataee A. Lakzian A. Appl. Clay Sci. 2013;80:305–312. doi: 10.1016/j.clay.2013.05.002. [DOI] [Google Scholar]
- Gan F. Zhou J. Wang H. Du C. Chen X. Water Res. 2009;43:2907–2915. doi: 10.1016/j.watres.2009.03.051. [DOI] [PubMed] [Google Scholar]
- Sleiman N. Deluchat V. Wazne M. Mallet M. Courtin-Nomade A. Kazpard V. Baudu M. Colloids Surf., A. 2017;514:1–10. doi: 10.1016/j.colsurfa.2016.11.014. [DOI] [PubMed] [Google Scholar]
- Wang N. Feng J. Chen J. Wang J. Yan W. Chem. Eng. J. 2017;316:33–40. doi: 10.1016/j.cej.2017.01.066. [DOI] [Google Scholar]
- Liu R. Chi L. Wang X. Wang Y. Sui Y. Xie T. Arandiyan H. Chem. Eng. J. 2019;357:159–168. doi: 10.1016/j.cej.2018.09.122. [DOI] [Google Scholar]
- Awual M. R. Jyo A. Desalination. 2011;281:111–117. doi: 10.1016/j.desal.2011.07.047. [DOI] [Google Scholar]
- Hao H. Wang Y. Shi B. Water Res. 2019;155:1–11. doi: 10.1016/j.watres.2019.01.049. [DOI] [PubMed] [Google Scholar]
- Saifuddin M. Bae J. Kim K. S. Water Res. 2019;158:246–256. doi: 10.1016/j.watres.2019.03.045. [DOI] [PubMed] [Google Scholar]
- Hu F. Wang M. Peng X. Qiu F. Zhang T. Dai H. Liu Z. Cao Z. Colloids Surf., A. 2018;555:314–323. doi: 10.1016/j.colsurfa.2018.07.010. [DOI] [Google Scholar]
- Rashid M. Price N. T. Pinilla M. Á. G. O'Shea K. E. Water Res. 2017;123:353–360. doi: 10.1016/j.watres.2017.06.085. [DOI] [PubMed] [Google Scholar]
- Almanassra I. W. Kochkodan V. Subeh M. Mckay G. Atieh M. Al-Ansari T. J. Water Process. Eng. 2020;36:101323. doi: 10.1016/j.jwpe.2020.101323. [DOI] [Google Scholar]
- (a) Liu T. Zheng S. Yang L. J. Colloid Interface Sci. 2019;552:134–141. doi: 10.1016/j.jcis.2019.05.022. [DOI] [PubMed] [Google Scholar]; (b) Fu H. Yang Y. Zhu R. Liu J. Usman M. Chen Q. He H. J. Colloid Interface Sci. 2018;530:704–713. doi: 10.1016/j.jcis.2018.07.025. [DOI] [PubMed] [Google Scholar]
- Chubar N. Gerda V. Megantari O. Mičušík M. Omastova M. Heister K. Man P. Fraissard J. Chem. Eng. J. 2013;234:284–299. doi: 10.1016/j.cej.2013.08.097. [DOI] [Google Scholar]
- Zhang S. Yang H. Huang H. Gao H. Wang X. Cao R. Li J. Xu X. Wang X. J. Mater. Chem. A. 2017;5:15913–15922. doi: 10.1039/C7TA04377E. [DOI] [Google Scholar]
- Mitrogiannis D. Psychoyou M. Baziotis I. Inglezakis V. J. Koukouzas N. Tsoukalas N. Palles D. Kamitsos E. Oikonomou G. Markou G. Chem. Eng. J. 2017;320:510–522. doi: 10.1016/j.cej.2017.03.063. [DOI] [Google Scholar]
- Yang K. Yan L.-g. Yang Y.-m. Yu S.-j. Shan R.-r. Yu H.-q. Zhu B.-c. Du B. Sep. Purif. Technol. 2014;124:36–42. doi: 10.1016/j.seppur.2013.12.042. [DOI] [Google Scholar]
Associated Data
This section collects any data citations, data availability statements, or supplementary materials included in this article.


