Graphical abstract

Keywords: 3D printing; Autosampler; Android, Arduino; Field sampling; Liquid handling; OpenSCAD; Macrodroid, Marlin; Stable isotopes; Syringe; Water sampling
Abstract
Automated water sampling can be very useful, but open-source choices are limited. Here I present an autosampler which consists of a gantry robot that delivers water from a syringe pump to 24 capped 40 ml vials. The autosampler is controlled using an Android tablet automatized using Macrodroid. Three rinsing cycles ensure negligible carryover between consecutive samples. Hourly sampling from a creek under rainy conditions suggested that total organic carbon in water was diluted by the rain. Some important limitations: 1) the autosampler must be on a steady, flat, horizontal surface; 2) unattended sampling can only last as long as the batteries powering the tablet and the motors; 3) distance from the syringe pump to water cannot exceed ~2 m in height and ~4 m in length for 3 mm tubing; 4) sampling frequency does not exceed one sample every eleven minutes. However, because of its open design, the autosampler can be modified and improved to not only overcome these limitations, but also potentially expand its scope to more demanding sampling if necessary.
Specifications table
| Hardware name | Iara |
| Subject area |
|
| Hardware type |
|
| Open Source License | GNU General Public License (GPL) 3.0 |
| Cost of Hardware | AU$850 |
| Source File Repository | https://osf.io/2c6t5/ or https://doi.org/10.17605/OSF.IO/2C6T5 |
1. Hardware in context
Understanding the natural environment is a combination of measurements and modelling. Although modelling provides invaluable insights for this purpose [1], it will only be useful as long as good data underlying the rationales are available [2]. Data are gathered through samples, and thus samples are at the core of good environmental research.
Collecting data can be time-consuming, tiresome, tedious, and even dangerous, depending on the kind of sample. Therefore, it is no wonder that automated data collection has been made available through sensors attached to loggers [3], [4], [5], [6], [7], [8], [9], [10], [11]. However, there are still many kinds of measurements that cannot be performed in situ, and that demand that the samples are collected and brought to a laboratory for further analysis. This is very common for water samples, for example.
Automated water sampling for further analysis is commercially available [12], [13], [14] but, as most commercial scientific equipment, these autosamplers are rather costly and difficult to customize due to their closed, patented designs. As an alternative, an open-source autosampler has been presented [15]. It allows the collection of two water aliquots, and can be deployed under water. If more than two water aliquots are necessary, more units of the autosampler can be deployed. Here I present a different kind of autosampler that allows the collection of a larger number (in the example provided here, 24) of samples. It stays outside of the water, and can be particularly useful for shallow waters. It is inspired on open-source autosamplers for laboratory use [16], [17], with modifications to allow portability.
2. Hardware description
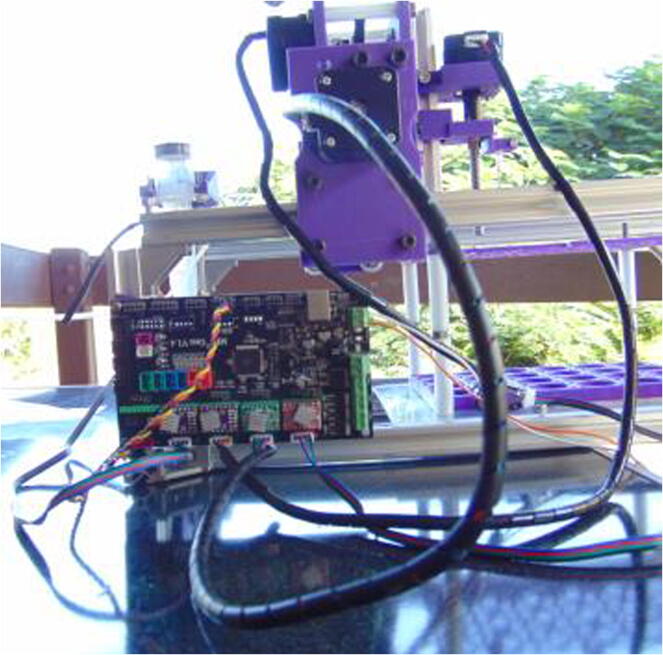
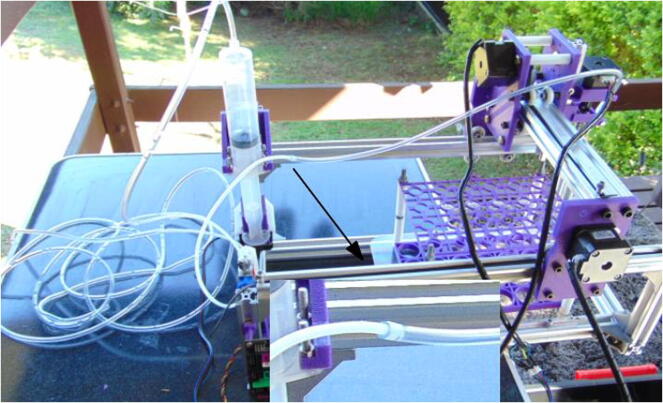
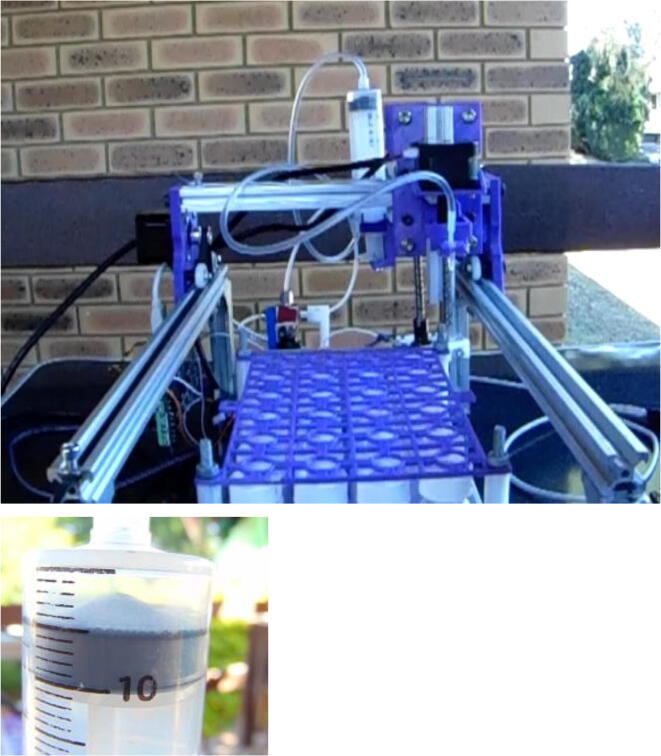
The autosampler consists of a gantry robot using a thick (18 gauge) syringe needle as an end effector (Fig. 1). This needle is moved on straight lines on three axes: X (horizontal), Y (horizontal) and Z (vertical).
Fig. 1.
Portable autosampler for discrete surface water samples.
The needle is connected to a large (50 ml) syringe pump using 1/8″ Teflon and 3 mm vinyl tubing, in a design similar to previous ones [18], [19], [20]. The pump is filled and emptied by the movement of the syringe plunger on a fourth (vertical) axis, E.
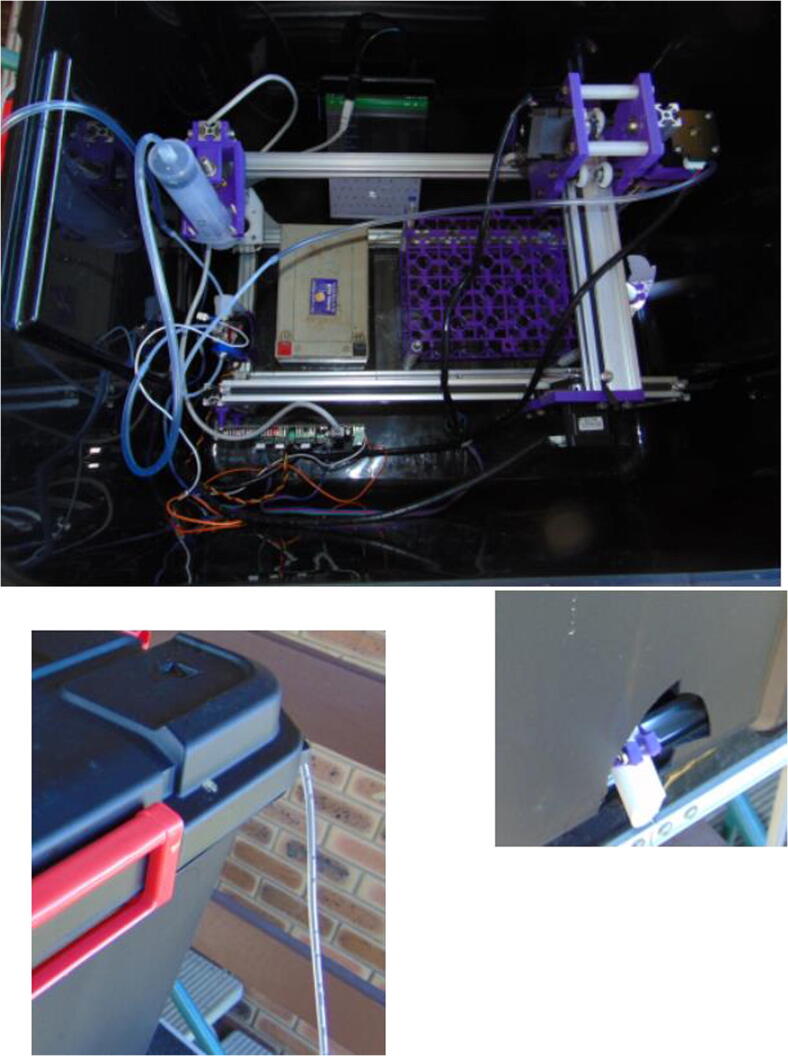
In between the pump and the needle, there is a three-way valve, which diverts the flow allowing for sampling and rinsing. The pump delivers the water to the needle, which can be moved to the sample vials placed inside a tray fixed to the autosampler body, or the drain (a simple pipe, in this case). The whole setup can be placed inside a large storage box.
The gantry robot and the syringe pump are actuated by stepper motors, while the valve by a servo motor. A rechargeable and portable 12 V battery powers the motors. The motors are controlled using an MKS Gen 1.4 control board, which has the Marlin firmware installed [16], [17], [21], [22]. The board is connected to a tablet running on the Android operating system, on which Macrodroid [23], [24], [25], a scripting interface, is used to program the motor movements. This is a similar approach to the use of AutoIt to integrate analytical instruments [26], [27]. A communication software, Serial USB Terminal [28], [29], is used to send the commands, while allowing manual input if needed.
Videos of the autosampler working are shown in Supplementary Information 1, 2 and 3.
3. Design files
Although the autosampler is built using mostly off-the-shelf parts, others need to be 3D-printed. All parts were printed using 1.75 mm PLA filament, with layer height of 0.3 mm, shell thickness of 0.8 mm, fill density of 90% (important to ensure part’s strength), nozzle temperature of 195 °C, bed temperature of 50 °C, support everywhere and raft as a platform for adhesion. All files can also be accessed on https://doi.org/10.17605/OSF.IO/2C6T5.
3.1. Design files summary
| Design file name | File type | Open source license | Location of the file |
|---|---|---|---|
| Stepper-motor plate (horizontal X axis) | OpenSCAD | GNU General Public License (GPL) 3.0 | https://osf.io/2c6t5/ |
| Stabilizer plate (X axis) | OpenSCAD | GNU General Public License (GPL) 3.0 | https://osf.io/2c6t5/ |
| Plate spacer (X axis) | OpenSCAD | GNU General Public License (GPL) 3.0 | https://osf.io/2c6t5/ |
| Wheel spacer (horizontal X, Y axes) | OpenSCAD | GNU General Public License (GPL) 3.0 | https://osf.io/2c6t5/ |
| Stepper-motor plate (Y axis) | OpenSCAD | GNU General Public License (GPL) 3.0 | https://osf.io/2c6t5/ |
| Stepper-motor mount (vertical Z and E axes) | OpenSCAD | GNU General Public License (GPL) 3.0 | https://osf.io/2c6t5/ |
| Linear carrier (Z axis) | OpenSCAD | GNU General Public License (GPL) 3.0 | https://osf.io/2c6t5/ |
| Syringe holder (E axis) | OpenSCAD | GNU General Public License (GPL) 3.0 | https://osf.io/2c6t5/ |
| Plunger holder (E axis) | OpenSCAD | GNU General Public License (GPL) 3.0 | https://osf.io/2c6t5/ |
| Servo motor mount | OpenSCAD | GNU General Public License (GPL) 3.0 | https://osf.io/2c6t5/ |
| Servo-valve connector 1 | OpenSCAD | GNU General Public License (GPL) 3.0 | https://osf.io/2c6t5/ |
| Servo-valve connector 2 | OpenSCAD | GNU General Public License (GPL) 3.0 | https://osf.io/2c6t5/ |
| Sample tray | OpenSCAD | GNU General Public License (GPL) 3.0 | https://osf.io/2c6t5/ |
| Sample tray cover | OpenSCAD | GNU General Public License (GPL) 3.0 | https://osf.io/2c6t5/ |
| Sample tray spacer | OpenSCAD | GNU General Public License (GPL) 3.0 | https://osf.io/2c6t5/ |
| Spacer for control board | OpenSCAD | GNU General Public License (GPL) 3.0 | https://osf.io/2c6t5/ |
| 45° Pipe holder | OpenSCAD | GNU General Public License (GPL) 3.0 | https://osf.io/2c6t5/ |
4. Bill of materials
Notes:
-
1)
Many items are listed in excess
-
2)
The aluminum extrusion profiles can be bought in different sizes and with the M6 thread already made, depending on the supplier. Alternatively, they can be cut and threaded after purchase.
-
3)
Prices for 3D-printed items were calculated using a price of AU$20 for a 1 kg roll, and the estimate of material used by each item done by the 3D-printing software.
5. Build instructions
5.1. Assembling the frame
Connect the 400 mm × 20 mm × 20 mm extrusion profiles to the 250 mm ones using the corner brackets (Fig. 2). Use 10 mm M5 screws and hammer nuts to fix the 2028 brackets to the profiles. It is necessary that the structure sits along a plane, that is, it is flat. The brackets used here are useful for this purpose.
Fig. 2.
Horizontal base of the frame.
Connect the 150 mm lead screw to a stepper motor using the shaft coupler, and attach the motor to the motor mount (Fig. 3; motor mount for two vertical axes, Z and E).
Fig. 3.

E axis motor with its lead screw connected using a shaft coupler.
Connect the motor mount to a 200 mm × 20 mm × 20 mm extrusion profile (Fig. 4) using 10 mm M5 screws.
Fig. 4.
Motor mount attached to 200 mm extrusion profile.
Connect the vertical profiles (120 and 200 mm ones, this last one already with the motor mount) using corner brackets (Fig. 5).
Fig. 5.
Assembled frame, including the E axis with its motor.
5.2. Assembling the Y axis
Arrange wheels, spacers, 30 mm M5 screws and nuts (Fig. 6; a hammer nut can substitute the one shown in the figure).
Fig. 6.
Wheel set to make the sliding motor carriers on axes X and Y.
Attach the wheels and one motor to the Y axis motor mounts (Fig. 7). Attach one pulley to the motor shaft, aligning it to the wheels (misalignment here leads to poor performance of the mechanism; see also Fig. 8 for an example of good alignment).
Fig. 7.
Motor mounts for Y axis.
Fig. 8.
Frame including the Y axis.
Slide 400 mm extrusion profiles through the wheels on each plate and attach them to the frame (Fig. 8). On the one that has the motor, wrap the timing belt around the pulley and beneath the wheels, then fix it to the profile using 10 mm M5 screws and hammer nuts. Notice the orientation of the plates, with the three upper holes further from the E axis motor.
5.3. Assembling the syringe driver (E axis)
Make holes in the syringe plunger to match those in the linear carriage and fix the syringe plunger to the linear carriage (Fig. 9) using 15 mm M5 screws. Depending on the syringe model, the plunger can be fragile, so it may be better to drill the holes initially with a rotary tool equipped with a thin drill bit, and then increase hole diameter with wider bits manually. Attach a leadscrew nut to the plunger holder using M3 screws.
Fig. 9.
Plunger attached to its holder.
Slide the linear the plunger holder around the leadscrew (Fig. 10).
Fig. 10.
Plunger holder on the E axis.
Make 3 mm holes on the syringe body matching those in the leadscrew support (Fig. 11). Fix the syringe to the support (Fig. 11) using M3 screws.
Fig. 11.
Syringe attached to E axis syringe holder.
Fix the E axis syringe holder to the extrusion profile (Fig. 12) using 10 mm M5 screws. Add a bearing around the leadscrew in the appropriate slot in the support.
Fig. 12.

Syringe attached to the E axis.
5.4. Assembling the Z axis
Attach a leadscrew nut to the Z axis linear carrier using M3 screws, and fix the luer – 3 mm connector also using a M3 screw. Attach the syringe needle to the luer connector (Fig. 13).
Fig. 13.
Linear carrier for the Z axis, including the needle connector and the needle.
Attach the 100 mm leadscrew to the stepper motor shaft (Fig. 14). Attach a stepper motor to the Z axis motor mount and the motor mount to the 150 mm profile (Fig. 14).
Fig. 14.
Z axis extrusion profile, motor, and leadscrew.
Slide the carrier around the leadscrew (Fig. 15).
Fig. 15.
Complete Z axis, including the linear carrier.
5.5. Making the X axis
Attach wheels and motor to the X axis motor mount and support plate (Fig. 16). The procedure is the same as that for the Y axis (Fig. 7).
Fig. 16.
Motor mount and support plates for the X axis.
Connect the X axis plates using the 70 mm M6 screws and appropriate spacers (Fig. 17).
Fig. 17.
X axis plates connected.
Slide the connected plates on the 20 × 40 mm extrusion profile and attach the timing belt in the same way as done for the X axis (Fig. 18).
Fig. 18.
X axis fully assembled. Notice that the extrusion profile must have threaded holes for M6 screws.
Connect the X axis to the Y axis plates using 12 mm M6 screws (Fig. 19). Use the two holes further from the syringe (Fig. 19).
Fig. 19.
X axis connected to the Y axis plates.
Connect the Z axis to the X axis plate using T nuts and 15 mm M5 screws (Fig. 20).
Fig. 20.
Z axis connected to X axis.
5.6. Making and placing the sample tray
Cut the clipboard to make it 190 mm long, so that it becomes a rectangle measuring 190 × 225 mm. Eight holes will be needed, four with 5 mm in diameter, and the other 4 with 6 mm in diameter (Fig. 21, subfigure 1). The 6 mm holes should be positioned 143 mm from each other on the width, and 185 mm on the length. The 5 mm holes should be positioned 175 mm from each other on the width, and can be positioned 100 mm from each other on the length, although this distance is not crucial.
Fig. 21.
Assembling the sample tray.
Attach 10 mm M5 screws, nuts, and M6 120 mm screws, nuts, and spacers (Fig. 21). After that, place the tray and the tray lid, and connect the whole assemble to the frame base. If assembled like that, the tray will become locked by the spacers and screws.
5.7. Drain pipe
Cut the 20 mm PVC pipe to a suitable size (from 120 to 140 mm long, 45° cuts; use a miter box and a saw to do the cuts) and attach it to its holder (Fig. 22). Attach the holder to the front of the frame (Fig. 22).
Fig. 22.
Drain pipe.
5.8. Preparing the control board
The first step is to upload the firmware to the board using a computer. Download the Arduino IDE (https://www.arduino.cc/en/Main/Software) and the Marlin package with the appropriate version of the firmware (https://osf.io/2c6t5/). This is an updated version of Marlin used for previous autosamplers [16], [17], [22], with minor modifications, including the ability to control servo motors. More details about this Marlin package are provided elsewhere [16], [22]. Upload it to the board.
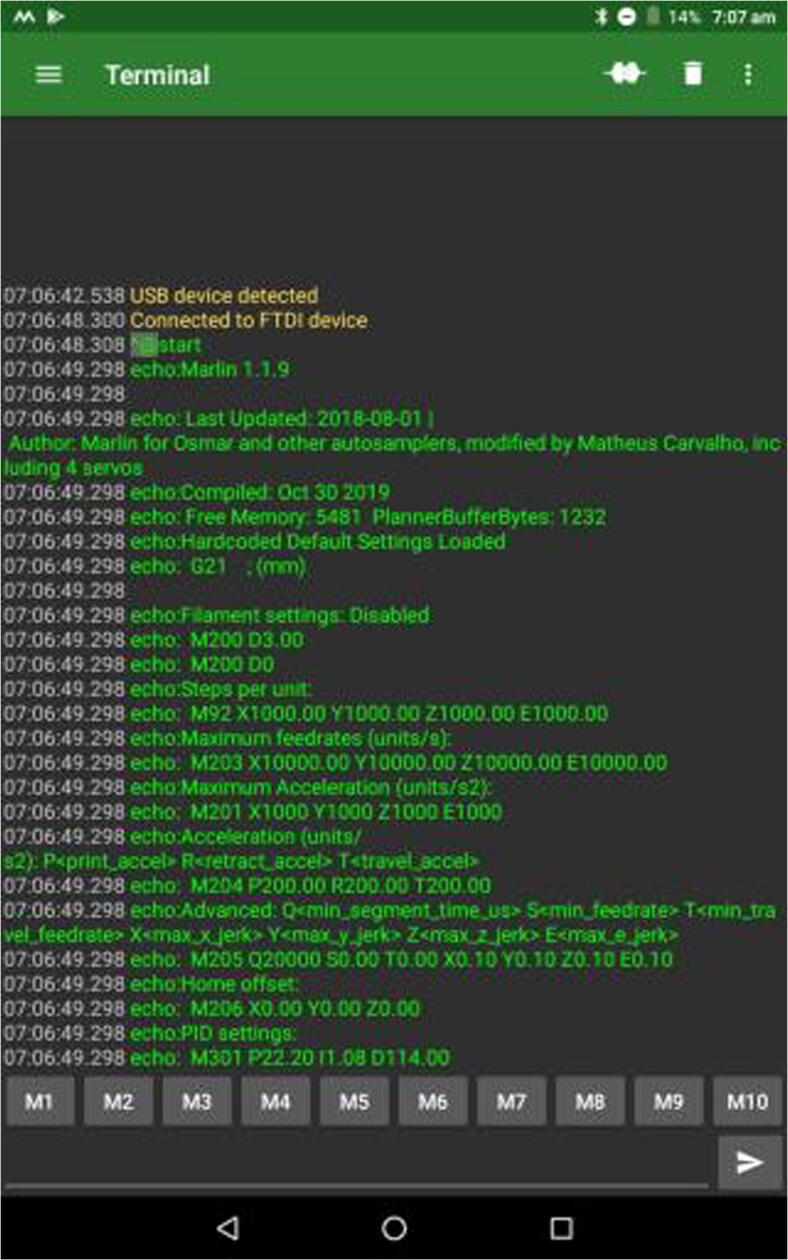
The second step is to make sure the board can be accessed by the tablet. Use an OTG USB adapter and a USB cable to connect the board to the tablet. The app for Android (version 7.0) that was used here was Serial USB Terminal (https://play.google.com/store/apps/details?id = de.kai_morich.serial_usb_terminal&hl = en). It automatically recognizes FTDI, the driver controlling the MKS Gen 1.4 board. Serial USB Terminal will tell immediately if the connection was successful (Fig. 23). Change the BAUD rate to 115,200 to ensure proper connection.
Fig. 23.
Serial USB Terminal showing successful connection with control board.
5.9. Assembling the valve
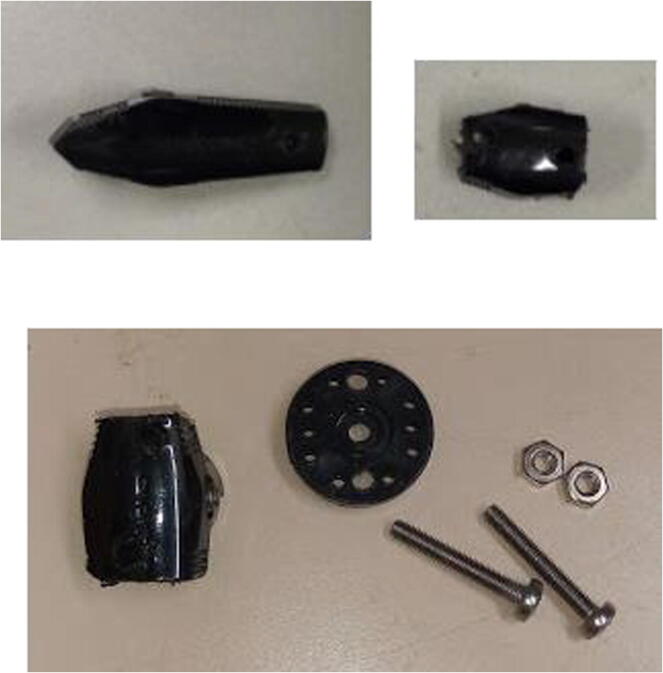
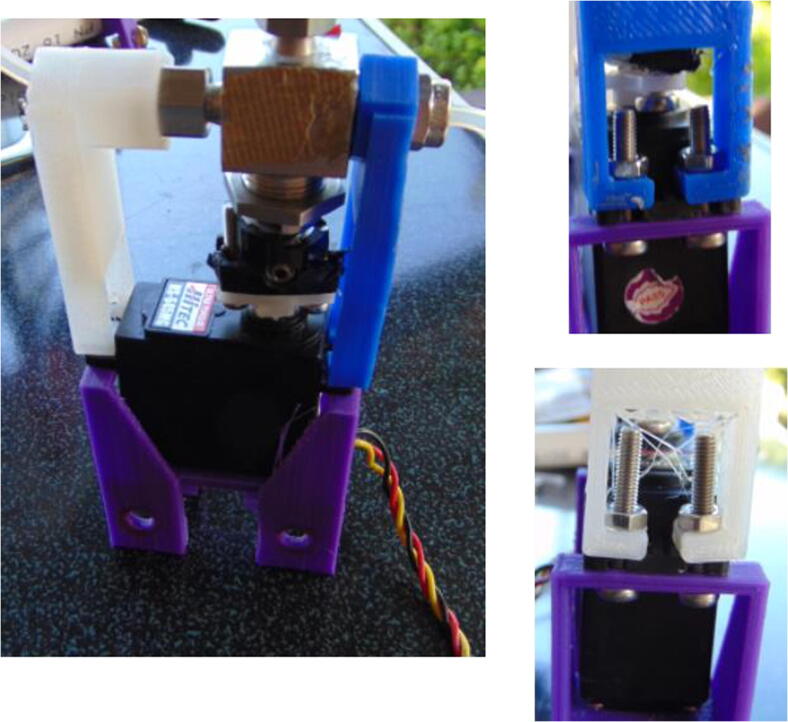
Cut the valve lever on both sides and drill 3 mm holes matching those on the servo lever (Fig. 24). It may be necessary to drill bigger holes on the servo lever.
Fig. 24.
Modifying the valve and servo levers.
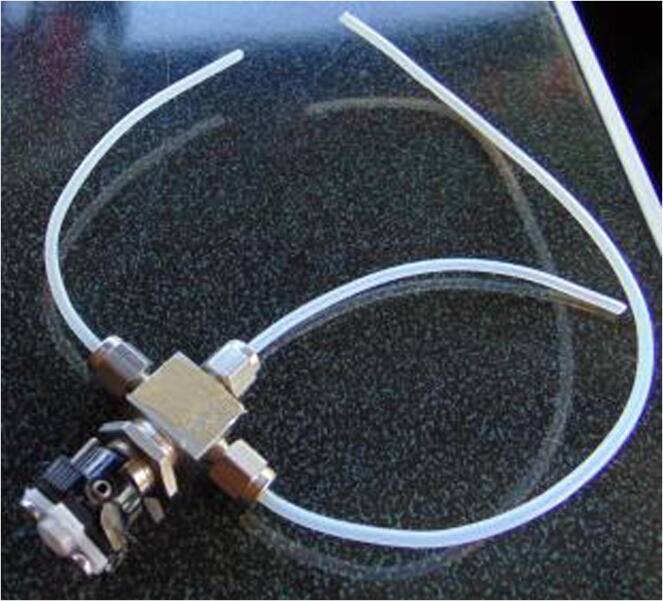
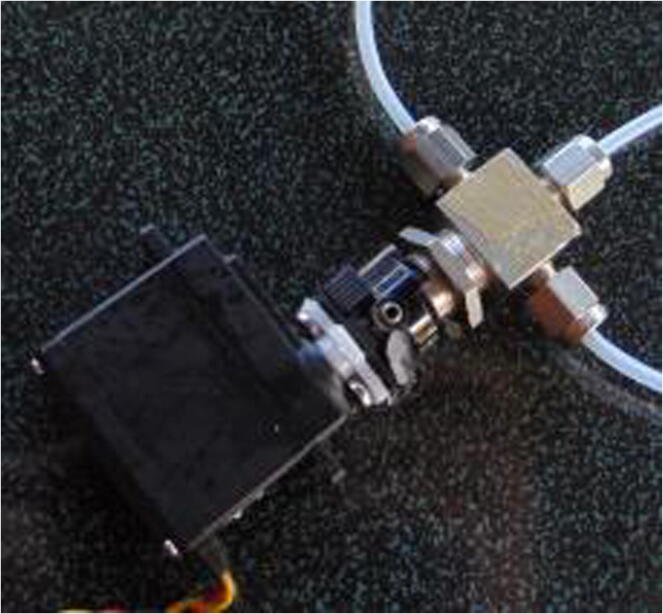
Attach the valve lever and the servo lever to each other using M3 screws and nuts. Connect both to the valve, and also connect the 1/8 in. connectors and tubes (Fig. 25). The connectors must be firmly attached to the valve to avoid leaks.
Fig. 25.
Valve connected to levers and tubes.
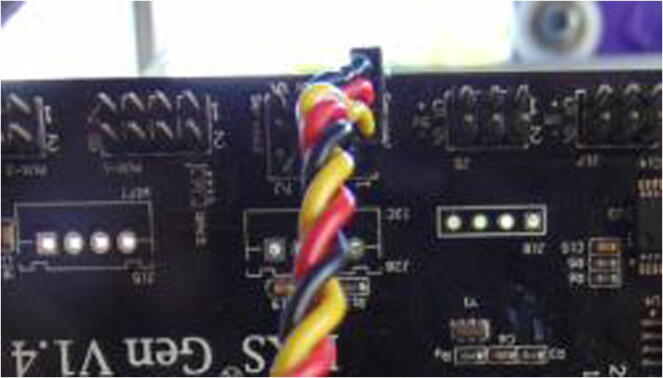
Connect the servo to the control board (Fig. 26), and stablish a connection using Serial USB Terminal. Then, type M280P0S0 and send the command. This should turn the servo to position 0.
Fig. 26.
Servo cable connected to the control board.
Disconnect the servo from the board. Now that the position is known, attach the servo to the valve (Fig. 27).
Fig. 27.
Servo connected to the valve.
Wrap the servo with the servo motor mount and the connectors with the valve servo connectors (Fig. 28). Attach all parts using M3 screws.
Fig. 28.
Attaching servo to valve.
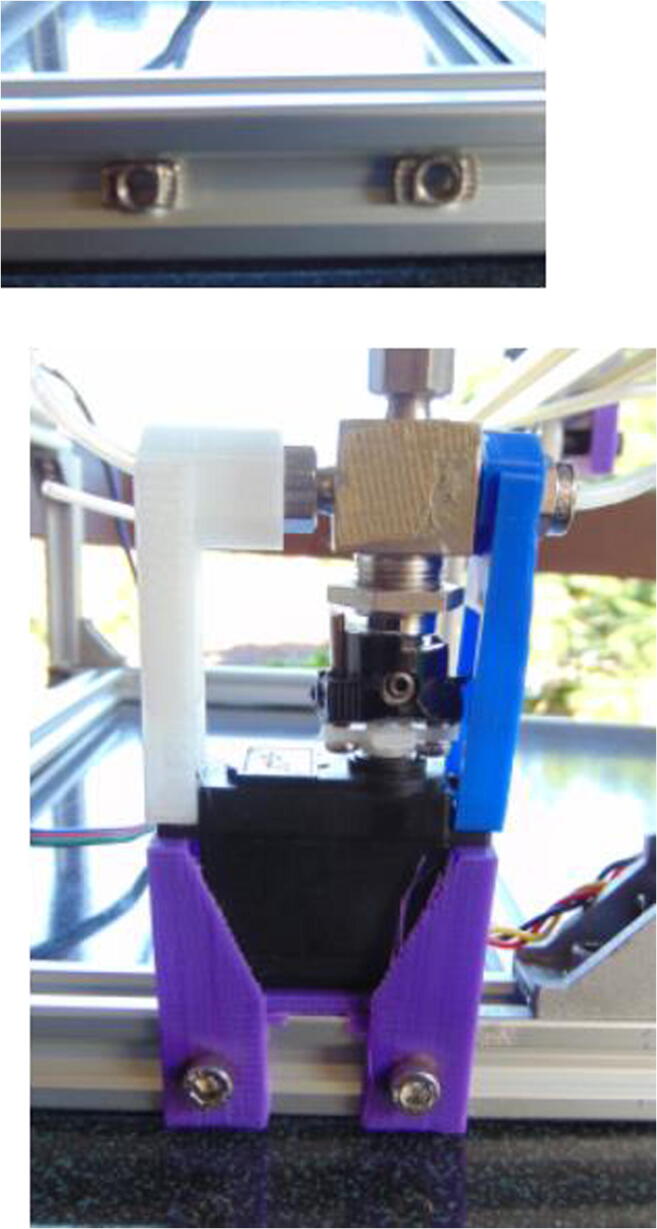
Using 10 mm M5 screws, attach the servo-valve to the back of the frame (Fig. 29).
Fig. 29.
Servo attached to the frame.
5.10. Attaching the control board
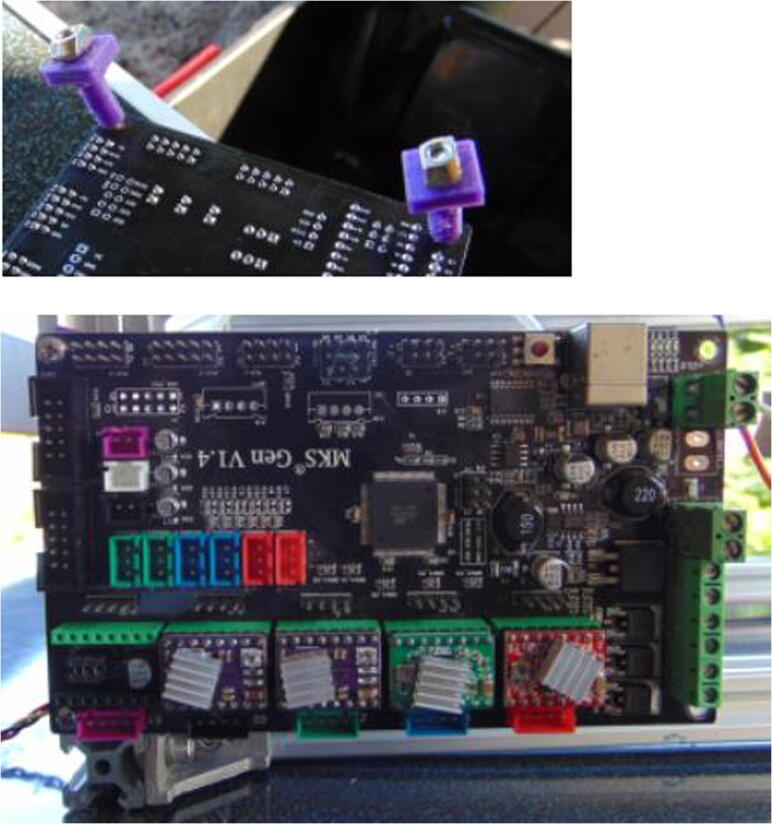
Attach the control board spacers to the control board using M3 screws and hammer nuts. Then, attach the board to the left-back leg of the frame (Fig. 30). The USB port should point upwards.
Fig. 30.
Board attached to the back of the frame.
Connect the stepper motor drivers to the control board (Fig. 30). Notice their proper orientation, and that for axes X and Y, the drivers are A4988, and for Z and E are Drv8825.
5.11. Connecting cables and tubes
Connect the 4-wire cables between stepper motors and proper control sockets in the board (Fig. 31). Connect the servo motor to its proper controller (Fig. 26).
Fig. 31.
Cables between board and motors.
Connect the 1/8 in. tubes to the 3 mm tubes (Fig. 32). This connection is straightforward for the tubes used here, without need for connectors. This may not be the case for tubes from different brands. The top connector on the valve is connected to the syringe. The one at position 0 (determined at step 5.9) is connected to the needle, and the one at position 180 is connected to the sampling tube.
Fig. 32.
Tubes connected to valve. Detail shows the connection between 1/8″ and 3 mm tubes.
To power the board, connect positive to positive and negative to negative between battery and board power input.
5.12. Placing inside a container
It is possible to place the setup inside a large enough box, so that the system can be left reasonably protected from the elements. A hole is necessary for the drain, but the sampling tube may be thin enough to go between the lid and the box (Fig. 33).
Fig. 33.
Autosampler inside a box.
6. Operation instructions
6.1. Motor control
Make sure the board is connected to all motors and the battery. Connect it to the tablet, and use Serial USB Terminal to control it. All commands sent to the board are a variation of G-code [30] for the Marlin firmware, as in previous autosamplers [22], [16], [17]. The first command must be M121, to allow for negative coordinates. Stepper motors are controlled using the command G1. For example, to move the syringe on the X axis, you can type G1X2F500. The parameter F is the feed rate, that is, the speed of the movement. For the X axis, this is speed can be 500 units, while for the Y axis it should be 250 units. For the Z axis, 1000 units work well. For the E axis, 150 is a safe value (higher values mean higher speeds; for the E axis, slow speeds are needed because of the force needed to push water). F values can change depending on how the machine is built. A signal that the value is too high is when the motor skip steps. If this happens, F values should be reduced until no skipping happens anymore.
The command M280 controls the servos, which actuate the valves. M280P0S180 turns the first valve to the 180° position. M280P0S0 turns the valve to the 0° position.
6.2. Determining important positions
It is possible to adjust the needle and plunger positions either manually or using the procedures explained in Section 6.1. Before using the autosampler, it is important that the needle and the plunger are at known positions, because the hardware configuration presented here does not have limit switches. One way to do this is to determine the origins, or “zero”, positions.
For the needle, the zero position chosen here was at the right / back corner, and top of the Z axis (Fig. 34). For the plunger, it was the topmost position on the E axis (Fig. 34). Notice that at this position the tip of the plunger does not touch the body of the syringe, but it is at about the 5 ml mark. It is important that the plunger does not go all the way up to the top, because if so a vacuum will be created and when pulling the plunger down, the movement will be inaccurate. There is no mechanism in place to prevent this to happen, so the user is responsible for ensuring that.
Fig. 34.
Initial positions for X, Y, Z and E axes. Below: detail of the plunger at its top position.
Once the needle and plunger are at the zero positions, the command G92X0Y0Z0E0 should be sent to the board, so that the software will adopt these positions as zero. In this configuration, X, Y and E axes should use only positive numbers for the movements, and Z only negative ones. If a different control board is used, it is possible that the values will be inverted.
Test motor movement with small increments (for example, G1X1F500). It is possible to reset positions by using the G92 command. For example, if you need to restart the X axis movement, you can manually push the needle back to zero position for the X axis, and type G92X0.
Once the zero positions are determined, the coordinates for important positions for automated operation (Table 1) can be found by using the G1 commands. It is always good idea to return the needle and plunger to zero positions once the procedure is finished. Notice that all coordinates are relative to the zero positions, and that their units are arbitrary. Also, the coordinates are for the machine built following the instructions presented here. If the machine is built differently, even only slightly, coordinates will differ. In other words, the coordinates presented here should be only seen as examples of a possible configuration, and not as parameters to be achieved when building the machine.
Table 1.
Important positions for automated control. Notice that coordinates will differ from the values shown here if the machine is built with different dimensions and if different boards or stepper motor drivers than those employed here are used.
| Position description | Coordinates |
|---|---|
| Safe vertical position for needle | Z = 0 |
| Start vial (right/back corner) | X = 2.6; Y = 1.3 |
| End vial (left/front corner) | X = 10.2; Y = 14.3 |
| Needle inside vial | Z = −100 |
| Drain pipe | X = 6.0; Y = 18.0 |
| Needle inside drain pipe | Z = −100 |
| Plunger at empty position | E = 0 |
| Plunger at full position | E = 95 |
| Plunger at sampling position (that is, with the syringe holding the volume of water to be delivered to a vial, in this case, 30 ml) | E = 95 |
| Valve at sucking position | 180° |
| Valve at delivering position | 0° |
6.3. Automated control
Once the important positions for sampling have been determined, a script can be prepared to automate the sampling procedure, which will include a sequence of actions performed by the autosampler (Fig. 35).
Fig. 35.

Sequence of actions for water sampling.
This sequence of actions (Fig. 35) must become autosampler movements, which happens in the following sequence: 1) the actions are translated into a Macrodroid script; 2) the actions in the Macrodroid script are sent to Serial USB Terminal; 3) Serial USB Terminal sends the actions to the control board; 4) the control board sends the actions to the motors; 5) the motors actuate the syringe, plunger, or valve, and the movements happen in the real world.
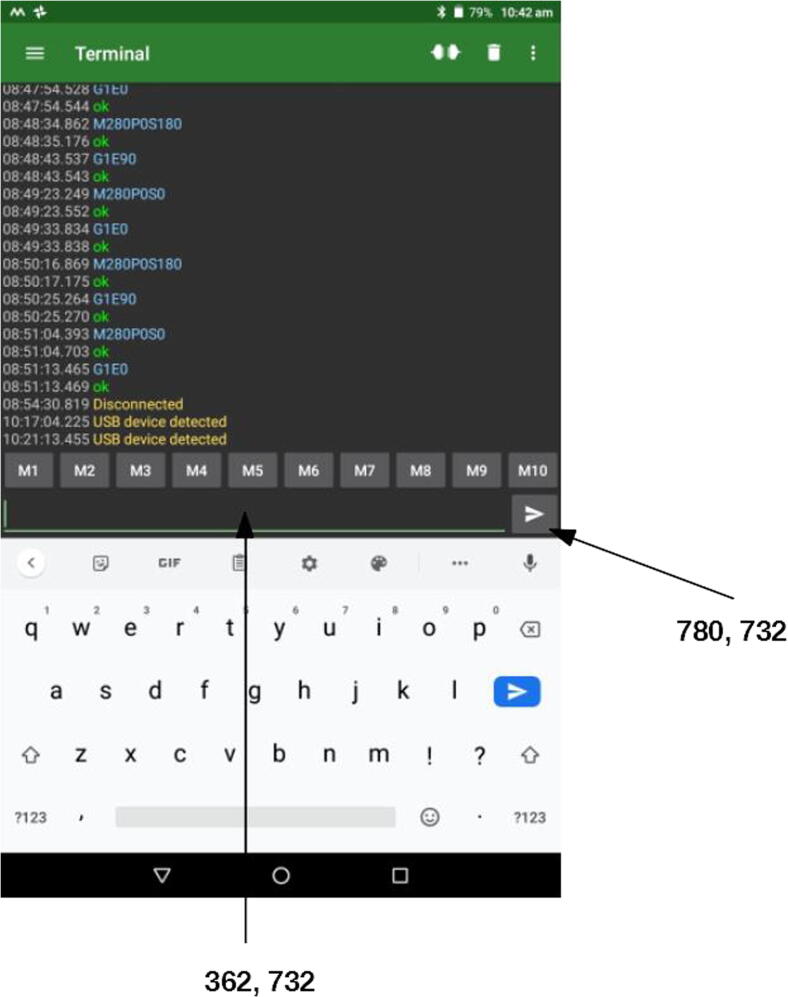
For example, the first action (Fig. 35) is “Move needle to drain”. In the real world, this means that the needle will move to coordinates X = 6.0 and Y = 18.0, and after that to Z = −100 (values in Table 1; notice that horizontal movements must always precede vertical ones). The respective G-code commands are G1X6.0F500, G1Y18.0F250, and G1Z100F1000. These are sent from Macrodroid to USB Serial Terminal through a combination of clicks and character inputs, which are some of the actions that can be automated using Macrodroid. For example, to send the first command, G1X6.0F500, Macrodroid performs the following sequence of actions (see Fig. 36 for reference): 1) click on the writing field at the pixel at position 362, 372; 2) paste the value G1X6.0F500; 3) click on the send button (pixel 780, 732).
Fig. 36.
Serial USB Terminal interface with the click positions highlighted.
In addition to the sampling procedures, in order to save power, the tablet – control board connection is cut off and re-stablished after each sample collection. Also, with the same purpose, the tablet display is turned off after all procedures, and kept off for most of the time. It turns back on automatically when the sampling sequence re-starts for the next sample.
The full Macrodroid code, with a detailed explanation, is available in Supplementary Information 4. When editing the code, it is not necessary that the tablet is connected to the control board.
6.4. Placement
The autosampler as presented here demands that the following conditions are satisfied:
-
1.
It cannot be placed more than 2.5 m above water surface.
-
2.
The sampling tube should not exceed 4 m.
-
3.
The autosampler should be placed on a flat, stable, horizontal surface. This is necessary to ensure that the stepper motors performing the horizontal movements (X and Y axes) will reach the correct positions without trouble.
-
4.
As explained in Section 6.2, the plunger of the syringe should not touch the top of the syringe to avoid generating extra forces for the stepper motor actuating the syringe.
-
5.
Depending on the sampling procedure, the waste should be contained, and disposed of in accordance to local environmental regulations.
7. Validation and characterization
7.1. Carryover
One of the main concerns for an autosampler using a syringe pump is the carryover between samples. This carryover was evaluated by measuring the dissolved organic carbon (DOC, measured using a Shimadzu TOC-L CSH/CSN analyser) content of pure (milli-Q, or MQ) water alternately with concentrated glucose solutions, both sampled using the syringe pump-tube-needle apparatus in the autosampler. DOC was chosen to test the autosampler for two main reasons: 1) it can be reliably sampled using the autosampler if samples are preserved with acid, which precludes the need for refrigeration; 2) DOC is an important parameter in environmental and ecological investigations [31], [32], being widely measured for a number of different purposes, ranging from understanding the metabolism of unicellular organisms like bacteria and phytoplankton [33], [34], [35], to understanding the carbon cycle at the ecosystem scale [36], [37], [38].
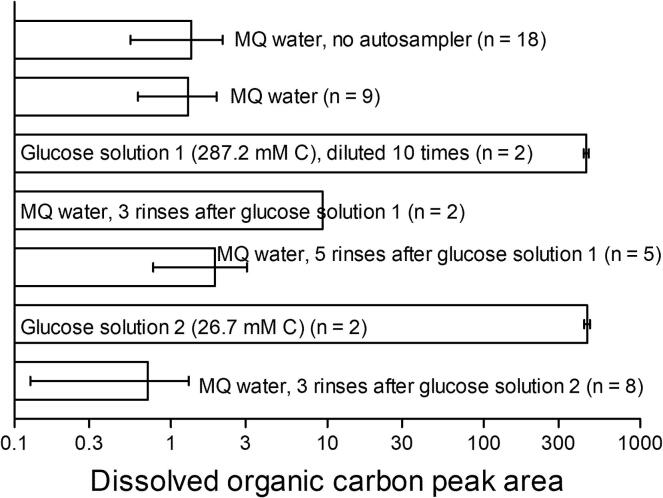
Several different kinds of samples were measured for DOC (Fig. 37). Five types of MQ water were measured: 1) no contact with the autosampler; 2) passed through the autosampler before other solutions were measured; 3) passed through the autosampler after 3 rinses following the most concentrated glucose solution; 4) same as 3, but after 5 rinses; 5) 3 rinses following the less concentrated glucose solution. There was no statistical difference (One-way ANOVA, F = 0.65, p = 0.59, significance level p = 0.05) between the DOC in these MQ waters, but the MQ water sampled after 3 rinses following the most concentrated glucose solution clearly contained more DOC than these other MQ solutions.
Fig. 37.
Carryover test for the autosampler. Samples were measured using a TOC analyser. MQ stands for milli Q, which is very pure filtered water. Notice that the most concentrated glucose solution was diluted 10 times for DOC measurement because the undiluted solution would generate significant carryover in the TOC analyser. This solution was not diluted when going through the autosampler. Rinses were done using MQ water. The number of replications per measurement is indicated by n. Notice that the X axis is on logarithmic scale.
These experiments demonstrated that, although there is carryover between samples (as indicated by the larger DOC in MQ water sampled after 3 rinses following the most concentrated glucose solution), this carryover is insignificant if a sufficient number of rinses is performed. The glucose concentrations used here, immediately followed by MQ, simulate an extreme change in DOC that would be unlikely in nature. For example, DOC concentrations in rivers range typically between 0.15 and 1.3 mM, which are up to 170 times smaller than that of the most diluted solution used here, and, more importantly, do not change abruptly between these extremes [38]. Therefore, it seems safe to limit the number of rinses to three to avoid carryover between two consecutive samples. If the syringe or sampling line is modified, a different number of rinses may be necessary. For 3 rinsing cycles, each sampling cycle takes 11 min. For faster sampling frequency, less rinses would be necessary, at the risk of carryover. As explained here, the three rinses recommended here prevent even extreme carryover. For systems that are enough known to not vary their conditions widely, a single rinse may be enough, thus enabling faster sampling frequency.
7.2. Field test
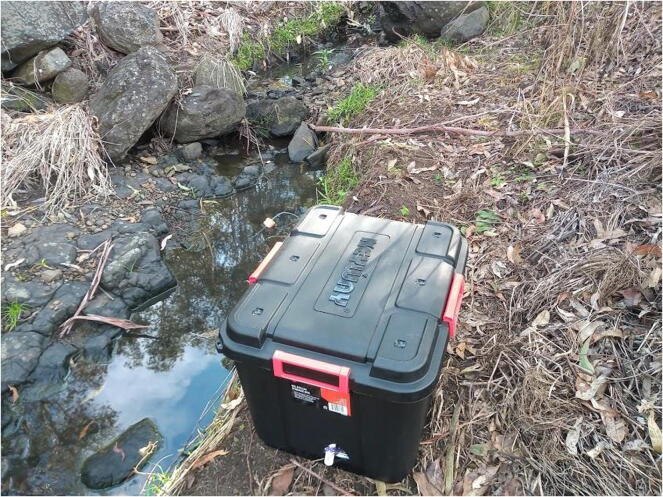
The autosampler was deployed close to a creek inside the Southern Cross University, Lismore, NSW, Australia, on a rainy day (1.4 mm, according to the Bureau of Meteorology), sampling hourly from 8:00 AM to 7:00 AM (Fig. 38).
Fig. 38.
Autosampler close to a small creek in the Southern Cross University campus.
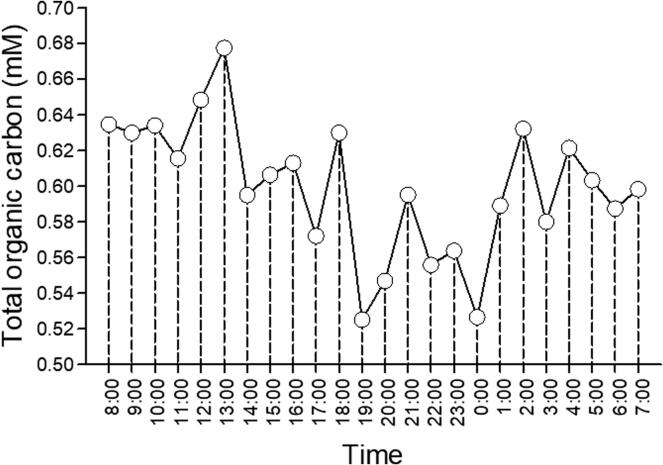
A drop of concentrated (85%) phosphoric acid was added to each vial prior deployment in order to preserve samples for total organic carbon (TOC; that is, DOC plus particulate carbon) measurements, which were done with the same equipment used for the carryover test (Section 7.1). It was observed that TOC decreased through the day, to increase again early morning next day (Fig. 39). It is possible that the decrease in TOC was due to dilution by the increased water volume brought by the rain, which was then subdued after the rain was over (most of the rain fell between 11:00 am and 11:00 pm that day).
Fig. 39.
Total organic carbon (TOC) from a creek collected using the autosampler presented in this paper during a 23 h cycle.
This test is preliminary and precludes firm conclusions about TOC dynamics in the creek. However, it serves to illustrate how the autosampler could be used in a field sampling campaign. In particular, it was satisfactory that the protective box allowed the system to work under rain.
7.3. Battery life
The field test (Section 7.3) also allowed the evaluation of the batteries supplying power to the autosampler. The 12 V battery powering the motors started at 13.20 V, and was at 11.65 V at the end of the sampling. The tablet battery started at 100% and finished at 54%. In order to save power, the tablet was configured to turn off its screen when not in use. It is necessary that the waiting time before the screen is turned off is set to at least 2 min, because some instructions take longer than a minute to complete. Also, the brightness of the tablet display was reduced to its minimum level.
Using similar conditions (same number of rinses, dimmed tablet display, etc), uniformly timed sampling at 15 min, 3 h, and 1 day were attempted. It was found that all 24 samples were collected for 15 min (totalling almost 12 h of activity). For 3 h intervals, only 17 samples were collected, and then the Tablet battery was flat. Accordingly, for samples spaced by 1 day, only 4 samples were collected, and then the tablet battery was flat before the next sample. These tests indicate that the tablet battery is a limiting factor for sampling, and a different power supply arrangement is necessary if longer sampling campaigns are desired.
7.4. Possible modifications
The system presented here is about as simple as one can get for the task of water sampling in the field. Many improvements are possible if more demanding sampling is necessary.
An obvious modification is to increase the size of the sampler, so that more samples, or larger volumes in larger bottles, can be collected. If so, probably a second stepper motor for the Y axis would be necessary.
Faster sampling could probably be achieved if a stronger stepper motor were used to power the syringe.
The current system employs timing belts for the X and Y axes. This is a low-cost option, but it is vulnerable to mispositioning if the machine is moved around (for example, on a boat). Leadscrews would eliminate this problem. Also, limit switches could be useful to minimize sampling errors.
All modifications listed above would increase the power consumption by the autosampler. As such, a larger battery, or maybe a portable powering system using solar cells, for example, would be necessary.
Finally, a significant limitation of the autosampler presented here is that it cannot keep samples refrigerated, which is a requirement for some water analyses. For these cases, a more complex, costly and energy-demanding system would be necessary, possibly involving the use of a portable fridge.
Human and animal rights
The work did not involve human or animal subjects.
Declaration of Competing Interest
The authors declare that they have no known competing financial interests or personal relationships that could have appeared to influence the work reported in this paper.
Acknowledgements
I am grateful to Prof. Bradley Eyre, Southern Cross University, for allowing access to analytical equipment.
Footnotes
Supplementary data to this article can be found online at https://doi.org/10.1016/j.ohx.2020.e00142.
Appendix A. Supplementary data
The following are the Supplementary data to this article:
References
- 1.Chapra S.C. McGraw-Hill; New York: 1997. Surface Water-quality Modeling. [Google Scholar]
- 2.Wetzel R.G., Likens G.E. second ed. Springer-Verlag; New York: 1991. Limnological Analyses. [Google Scholar]
- 3.Jo W., Hoashi Y., Aguilar L.L.P., Postigo-Malaga M., Garcia-Bravo J.M., Min B.C. A low-cost and small USV platform for water quality monitoring. HardwareX. 2019;6 doi: 10.1016/j.ohx.2019.e00076. [DOI] [Google Scholar]
- 4.Carlson D.F., Fürsteling A., Vesterled L., Skovby M., Pedersen S.S., Melvad C., Rysgaard S. An affordable and portable autonomous surface vehicle with obstacle avoidance for coastal ocean monitoring. HardwareX. 2019;5 doi: 10.1016/j.ohx.2019.e00059. [DOI] [Google Scholar]
- 5.Green A., Forsman Z., Toonen R.J., Donahue M.J. CoralCam: a flexible, low-cost ecological monitoring platform. HardwareX. 2020;7 doi: 10.1016/j.ohx.2019.e00089. [DOI] [PMC free article] [PubMed] [Google Scholar]
- 6.Purser A., Hoge U., Lemburg J., Bodur Y., Schiller E., Ludszuweit J., Greinert J., Dreutter S., Dorschel B., Wenzhöfer F. PlasPI marine cameras: open-source, affordable camera systems for time series marine studies. HardwareX. 2020;7 doi: 10.1016/j.ohx.2020.e00102. [DOI] [PMC free article] [PubMed] [Google Scholar]
- 7.Spinelli G.M., Gottesman Z.L., Deenik J. A low-cost Arduino-based datalogger with cellular modem and FTP communication for irrigation water use monitoring to enable access to CropManage. HardwareX. 2019;6 doi: 10.1016/j.ohx.2019.e00066. [DOI] [Google Scholar]
- 8.Hill A.P., Price P., Snaddon J.L., Doncaster P., Rogers A. AudioMoth: a low-cost acoustic device for monitoring biodiversity and the environment. HardwareX. 2019;6 doi: 10.1016/j.ohx.2019.e00073. [DOI] [Google Scholar]
- 9.A. Price, An apparatus for personalized atmospheric and flight data collection aboard high altitude weather balloons. HardwareX 6 (2019) e00077. doi:0.1016/j.ohx.2019.e00077.
- 10.Matheny A.M., Marchetto P., Powell J., Rechner A., Chuah J.-Y., McCormick E., Pierce S.A. LEAF: logger for ecological and atmospheric factors. HardwareX. 2019;6 [Google Scholar]
- 11.Mouy X., Black M., Cox K., Qualley J., Mireault C., Dosso S., Juanes F. FishCam: a low-cost open source autonomous camera for aquatic research. HardwareX. 2020;8 doi: 10.1016/j.ohx.2020.e00110. [DOI] [PMC free article] [PubMed] [Google Scholar]
- 12.ISY, ProSample Portable Samplers. https://www.ysi.com/prosample, (2020).
- 13.Thermo-Fisher, MAXX Automatic Water Samplers. https://www.thermofisher.com.au/show.aspx?page=/ContentAUS/Environmental-Industrial/Environmental-Monitoring-Safety/Water-Monitoring-Treatment/Surface-Water-Sampling-And-Monitoring/Automatic-Samplers.html, (2020).
- 14.ISY, Wastewater-Stormwater Sampler. https://www.ysi.com/WS755, (2020).
- 15.NOAA, Sub-surface automated sampler. https://www.coral.noaa.gov/accrete/sas/, (2019).
- 16.Carvalho M.C., Murray R.H. Osmar, the open source microsyringe autosampler. HardwareX. 2018;3:10–38. doi: 10.1016/j.ohx.2018.01.001. [DOI] [Google Scholar]
- 17.Carvalho M.C., Sanders C.J., Holloway C. Auto-HPGe, an autosampler for gamma-ray spectroscopy using high-purity germanium (HPGe) detectors and heavy shields. HardwareX. 2018;4 doi: 10.1016/j.ohx.2018.e00040. [DOI] [Google Scholar]
- 18.Garcia V.E., Liu J., DeRisi J.L. Low-cost touchscreen driven programmable dual syringe pump for life science applications. HardwareX. 2018;4 doi: 10.1016/j.ohx.2018.e00027. [DOI] [Google Scholar]
- 19.Klar V., Pearce J.M., Karki P., Kuosmanen P. Ystruder: open source multifunction extruder with sensing and monitoring capabilities. HardwareX. 2019;6 doi: 10.1016/j.ohx.2019.e00080. [DOI] [Google Scholar]
- 20.B. Wijnen, E.J. Hunt, G.C. Anzalone, J.M. Pearce, Open-source syringe pump library. PLoS_One (2014), 10.1371/journal.pone.0107216. doi:10.1371/journal.pone.0107216. [DOI] [PMC free article] [PubMed]
- 21.Campbell T., Jones J.F.X. Design and implementation of a low cost, modular, adaptable and open-source XYZ positioning system for neurophysiology. HardwareX. 2020;7 doi: 10.1016/j.ohx.2020.e00098. [DOI] [PMC free article] [PubMed] [Google Scholar]
- 22.Carvalho M.C., Eickhoff W., Drexl M. Open-source autosampler for elemental and isotopic analyses of solids. HardwareX. 2020;8 doi: 10.1016/j.ohx.2020.e00123. [DOI] [PMC free article] [PubMed] [Google Scholar]
- 23.Lancioni G.E., Singh N.N., O'Reilly M.F., Sigafoos J., Alberti G., Perilli V., Chiarello V., Grillo G., Turi C. A tablet-based program to enable people with intellectual and other disabilities to access leisure activities and video calls. Disability Rehabil.: Assistive Technol. 2020;15:14–20. doi: 10.1080/17483107.2018.1508515. [DOI] [PubMed] [Google Scholar]
- 24.Pache M.C.B., Costa A.B., Souza S.R., Negri L.H. Speakcode: uma ferramenta de acessibilidade para pessoas com deficiencia visual. Rev. Bras. Educacao Profissional tecnol. 2020;1 doi: 10.15628/rbept.2020.7934. [DOI] [Google Scholar]
- 25.Lancioni G.E., O'Reilly M.F., Sigafoos J., Alberti G., Campodonico F., Chiarello V. Promoting occupational engagement and personal satisfaction in people with neurodevelopmental disorders via a smartphone-based intervention. Adv. Neurodev. Disorders. 2019;3:259–266. doi: 10.1007/s41252-019-00102-4. [DOI] [Google Scholar]
- 26.Carvalho M.C. Integration of analytical instruments with computer sripting. J. Lab. Autom. 2013;18:328–333. doi: 10.1177/2211068213476288. [DOI] [PubMed] [Google Scholar]
- 27.Carvalho M.C. Practical Laboratory Automation made easy with AutoIt. Wiley VCH. 2016 [Google Scholar]
- 28.Miyajima H. A study on measuring street slopes with Arduino for barrier free travel. Eco-Engineering. 2018;30:111–114. doi: 10.11450/seitaikogaku.30.111. [DOI] [Google Scholar]
- 29.A.I. Ali, S.Z. Partal, S. Kepke, H.P. Partal, ZigBee and LoRa based wireless sensors for smart environment and IoT applications, in: 2019 1st Global Power, Energy and Communication Conference (GPECOM), 2019, pp. 19–23. doi:10.1109/GPECOM.2019.8778505.
- 30.Smid P. Industrial Press Inc; New York: 2003. CNC Programming Handbook. [Google Scholar]
- 31.J.I. Hedges, Why dissolved organics matter, in: D.A. Hansell, C.A. Carlson (Eds.) Biogeochemistry of Marine Dissolved Organic Matter, Academic Press, San Diego, 2002, pp. 1–33.
- 32.S.E.G. Findlay, R.L. Sinsabaugh, Aquatic Ecosystems: Interactivity of Dissolved Organic Matter, Academic Press, Amsterdan, 2003.
- 33.Cherrier J., Bauer J.E. Bacterial utilization of transient plankton-derived dissolved organic carbon and nitrogen inputs in surface ocean waters. Aquat. Microb. Ecol. 2004;35:229–241. [Google Scholar]
- 34.Cherrier J., Valentine S., Hamil B., Jeffrey W.H., Marra J. Light-mediated release of dissolved organic carbon by phytoplankton. J. Mar. Syst. 2015;147:45–51. [Google Scholar]
- 35.González N., Gattuso J.-P., Middelburg J.J. Oxygen production and carbon fixation in oligotrophic coastal bays and the relationship with gross and net primary production. Aquat. Microb. Ecol. 2008;52:119–130. [Google Scholar]
- 36.Maher D.T., Eyre B.D. Carbon budgets for three autotrophic Australian estuaries: Implications for global estimates of the coastal air-water CO2 flux. Global Biogeochem. Cycles. 2012;26:GB1032. [Google Scholar]
- 37.Carvalho M.C., Schulz K.G., Eyre B.D. Respiration of new and old carbon in the surface ocean: implications for estimates of global oceanic gross primary productivity. Global Biogeochem. Cycles. 2017;31 [Google Scholar]
- 38.Wells N.S., Maher D., Huang P., Erler D.V., Maxwell P., Hipsey M.R., Eyre B.D. Land-use intensity alters both the source and fate of CO2 within eight sub-tropical estuaries. Geochim. Cosmochim. Acta. 2020;268:107–122. doi: 10.1016/j.gca.2019.09.042. [DOI] [Google Scholar]
Associated Data
This section collects any data citations, data availability statements, or supplementary materials included in this article.


