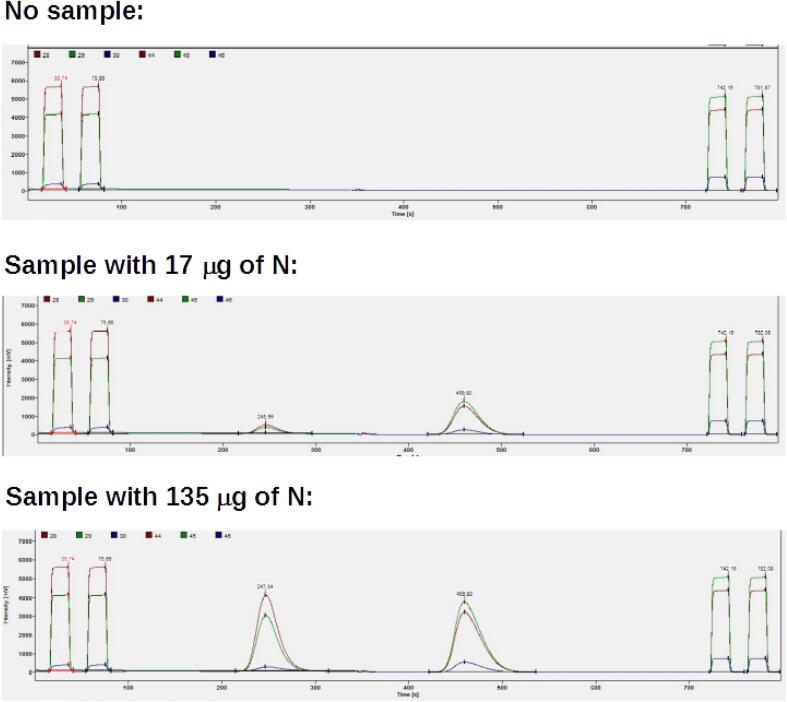
Fig. 23.
Comparison of chromatograms when the autosampler delivers no sample, and when samples with small and larger amounts of material are delivered. The first and last two peaks (the four rectangles) are reference gas peaks, the first two for N2, and the last two for CO2. The gaussian peaks are for the analyzed samples, the first one for N2, and the second one for CO2.

