

Graphical abstract

Keywords: Human gait, Programming system on chip, Motion capture, Time-of-flight camera, Step width, POMA test
Abstract
This paper proposes a low-cost portable electronic system for estimating step width during the human gait cycle. This device, intended to support the Walking Stance item of the fall risk assessment test Performance Oriented Mobility Assessment (POMA), contains three electronic boards, comprising two sensing nodes and a concentrator. Each sensing node contains a force sensitive resistor (FSR) and time-of-flight camera (TOF). Each FSR is placed inside the subject’s shoe, while each TOF camera is located at the back of their foot. The FSR detects contact between heel and ground, and the TOF measures the distance to a barrier located on the right side of the walking path. Step width is calculated as the difference between the TOF measurements. After the walk is complete, the information obtained by the FSRs and TOFs is sent via a 433 MHz wireless communication to the concentrator board, which is connected to the USB port of a personal computer (PC). The proposed step width measurement system was validated with an infrared based motion capture (Vicon Corp.), giving an error equal to 11.4% 5.5%.
Specifications table
| Hardware name | SWMS (Step Width Measurement System) |
| Subject area | Medical |
| Hardware type | System for measurement of biomechanical variables |
| Open Source License | CERN OHL |
| Cost of Hardware | Measurement Nodes $40USD, Concentrator $30USD. |
| Source File Repository | https://doi.org/10.17632/dgyhpm7h2k.3 |
1. Hardware in context
The POMA test [1] evaluates balance and gait on an integer scale ranging from 0 to 28, with values lower than 19 indicating high fall risk. POMA includes step width (item 16) to assess fall risk, since requiring a larger support area is usually indicative of balance problems [2]. In POMA, this aspect of the test is referred to as walking stance and is evaluated as zero when heels remain apart during walking, and as one when the heels almost touch each other. The zero or one score is selected by the test administrator according to their perception, which can be influenced by experience and level of concentration. In similar tests to POMA, such as Timed Up and Go and Sit to Stand, inertial motion capture systems have been proposed to support objective assessment [3], [4].
Step width is defined as the lateral distance between the heels when the feet touch the ground [5] (Fig. 1).
Fig. 1.

Step width definition.
In [6], the authors presented a system consisting of an inertial measurement unit (IMU) and an optical infrared distance sensor. This device was placed in the upper part of the left shank, with the optical sensor pointing toward a white curved plastic cover located on the right shank. The maximum angular velocity of the IMU axis perpendicular to the sagittal plane was used for step detection. The optical sensor measured the inner distance between the shanks, and the lowest value was used as a surrogate for step width. Although the system in [6] was validated using a 3D optical motion capture system, the authors did not report how representative the minimal distance between shanks is of actual step width. The system described in [7] comprised a treadmill, cellphone, and high-definition webcam. Peaks in the acceleration data from the cell phone indicated heel strike events, and the images provided by the webcam, located on the left side of the treadmill, were processed to calculate step length and width. In [7], when the left foot was in front, step width was calculated as the lateral distance between the left heel and the internal metatarsal of the right foot, but when the right foot led, step width was calculated with respect to the external metatarsal of the left foot. This asymmetric definition was required because the camera was located on one side of the treadmill (left side). Additionally, as observed in [8], treadmills significantly modify gait patterns. Commercial motion capture systems, such as force platforms and optical systems have been used to measure step width previously [9], [10], but they are very expensive.
2. Hardware description
The Step Width Measurement System (SWMS), proposed in the current paper, is based on a modular architecture containing three electronic boards: two identical sensing nodes located at the top of the ankle, and a concentrator, for communicating between the sensing nodes and a personal computer running data acquisition software. The sensing nodes and the concentrator exchange information bidirectionally through a 433 MHz radio frequency (RF) network. Fig. 2 summarizes the system architecture.
Fig. 2.

System architecture.
Each measurement node contains two sensors: an FSR and a TOF. The FSR [11] (FSR-420 Interlink Electronics) detects when the heel touches the ground and the TOF [12], [13] (VL53L1X STMicroelectronics) measures the distance of the heel from a barrier parallel to the walking direction. The VL53L1X measures distances between 0.02 and 2 m with an accuracy of ± 0.002 m. Each node also incorporates a PIC 18F25K22 microcontroller and a programmable system on chip (PSoC) (5LP of Cypress Semiconductor). The PIC reads the TOF at 50 Hz through an Inter-Integrated Circuit (I2C) communication bus and sends the samples to the PSoC via a Universal Asynchronous Receiver-Transmitter interface. The PSoC is devoted to: (1) reading the FSR sensor at 50 Hz, (2) storing the samples acquired by the FSR and the TOF, and (3) exchanging information with the concentrator node. Two processing units were included because we were unable to read both sensors simultaneously at 50 Hz. In the next version of the SWMS, we will use a multitasking approach to check whether it is possible to read both sensors using the PSoC processor.
The step width is calculated as the difference between the distance read by the left and right TOF cameras (distance in Fig. 3).
Fig. 3.
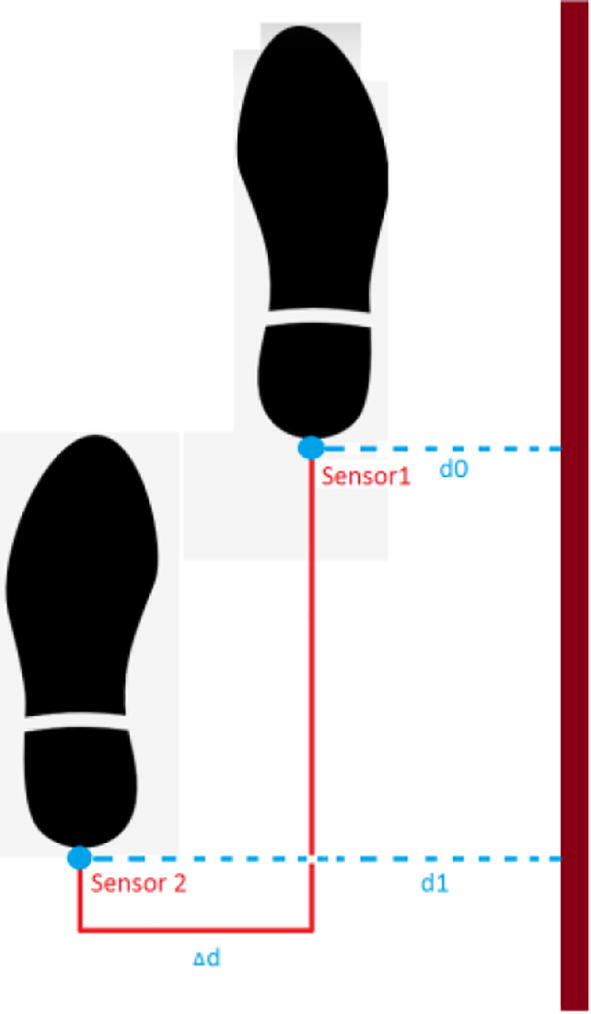
Working principle used to estimate step width.
For simplicity, the print circuit board (PCB) presented in Fig. 4 can be used to locate either the sensing nodes or the concentrator. When used for the concentrator, the sockets for the microcontroller, the TOF, and the FSR remain empty.
Fig. 4.
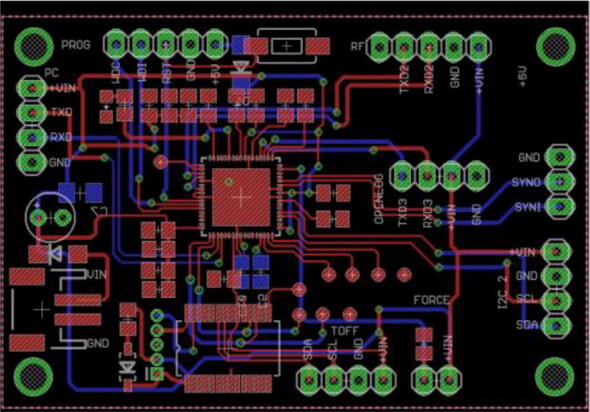
PCB layout of 6 cm × 4 cm. Image generated with Autodesk Eagle Freeware Version.
The function of each port in Fig. 5 is as follows: JP1 is used to program the PSoC, JP2 to program the PIC 18F25K22, JP3 to connect the RF module (HC-11), JP4 to connect the lithium 3.7 v battery; JP5 to connect the serial-to-USB converter (only for the concentrator); JP7 is an analog-to-digital converter to read the FSR, and JP8 is an I2C communication bus to read the TOF.
Fig. 5.

Schematic for sensor node device.
The main characteristics of the proposed system are:
-
•
It measures distance using TOF cameras, which are more accurate and less noise-sensitive than ultrasonic sensors.
-
•
It stores the data captured by the TOFs and FSRs sensors in comma-separated values (CSV) format, for later analysis.
-
•
It is low-power and low-cost.
-
•
It is portable and easy to use.
-
•
It can be integrated into inertial or optical motion capture systems thanks to a TTL synchronization port.
3. Design files
The repository https://doi.org/10.17632/dgyhpm7h2k.3 contains the files necessary to implement the SWMS, located in the following folders:
-
•
Folder Board_Production_Files contains the Gerber and bill-of-materials (BOM) files required for manufacture of the three electronic PCBs.
-
•
Folder Matlab_Script contains a MATLAB script for calculating the step width from the data generated by the SWMS.
-
•
Folder Parts_For_Enclosure_CAD_Files contains the Solid Edge files for manufacturing the sensing node protection cases.
-
•
Folder Poma16Tester_Source contains source files to be compiled with Visual C++ for generating the executable file Poma16Tester.exe.
-
•
Folder PsoC_Concentrator_Firmware contains the source code developed in PSoC creator, used to program the concentrator.
-
•
Folder PsoC_Sensors_Firmware contains the source code developed in PSoC creator, used to program the sensing nodes.
-
•
Folder TOF_Sensor_PIC_Fw contains the source code developed in the MPLAB (Microchip), used to program the sensing nodes’ microcontrollers.
4. Bill of materials
The folder Board_Production_Files, located in the repository presented in the previous section, contains the BOM for the concentrator (Concentrator_BOM.xls) and the sensing nodes (Sensor_Node_BOM.xls).
5. Build instructions
The three circuit boards, (the concentrator and the two sensing nodes), should be fabricated by a service specializing in electronic system design and manufacture. These companies use the BOM and the Gerber files describing the PCB (Board_Production_Files/Gerber.zip) to build and populate an electronic prototype such as the blue board presented in Fig. 6.
-
•
Once the concentrator and the sensing nodes have been implemented, the first step is to upload the firmware files for the concentrator (FwPSoC_Master.rar) and sensing nodes (FwPSoC_Slave.rar). This task requires the applications PSoC programmer and KitProg.
-
•
The second step is to upload the firmware file for the sensing nodes microcontrollers (FW_Toff.rar). This step requires the Microchip Programming Kit for the PIC18F microcontroller.
-
•
The final step is to build the acrylic cases for the sensing nodes using the Solid Edge files Node_Slide_Case1.par and Node_Slide_Case2.par. The cases facilitate placement of each sensing node above the participant’s ankle using elastic bands (Fig. 8).
Fig. 6.

Components of the sensing node.
Fig. 8.

Location of the sensing nodes and the TOF cameras.
6. Operating instructions
The SWMS is intended for indoor use and requires a free area 2 m wide and 8 m long. The participant should take six steps while walking parallel to a side barrier used to reflect the infrared light emitted by the TOF cameras (Fig. 11). The following is the protocol for using the system:
-
1.
Install the side barrier. In our case, it was made of five pieces of chipboard, each 1.2 m long and 0.20 m high (Fig. 7), and guide laser was used to adjust the barrier placement.
-
2.
Attach an FSR sensor to the insole of each shoe using double-sided tape. The sensor should be located just below where the participant places their heel (Fig. 8, part A).
-
3.
Fix the sensing nodes above the participant’s ankles using elastic bands (Fig. 8, part B).
-
4.
Attach a TOF camera to the back of each shoe, ensuring that each camera’s front surface will remain parallel to the side barrier (Fig. 8, part C).
-
5.
Connect the concentrator to a PC through a USB-to-serial converter, (we used a CP2102 module (Fig. 9)), leaving it ready to be controlled from the software application Poma16Tester.exe.
-
6.
Run the application Poma16Tester.exe, whose graphical user interface is presented in Fig. 10, and select the correct port for communication between the concentrator and the PC. The other parameters required for serial port communication should be set to their default values (Baud Rate: 19,200 bps; Parity: none; Number of bits per character: 8 bits), as shown in Fig. 10.
-
7.
Press the Clear Screen button to delete the messages displayed in the right-hand side of the user interface.
-
8.
Instruct the participant to remain at the start of the side barrier and to maintain a lateral distance of between 20 and 30 cm.
-
9.
Press the Start Acquisition button to acquire data simultaneously from all sensors (TOFs and FSRs), and to send a pulse through the concentrator TTL’s port (Fig. 6), which can be used to synchronize data acquisition with another motion capture system. This functionality was used to synchronize the SWMS with the Vicon during the validation phase.
-
10.
Instruct the participant to walk parallel to the side barrier.
-
11.
Press the Stop Acquisition button when the participant reaches the end of the side barrier.
-
12.
Press the Save File button to generate a CSV file containing the data captured by the TOFs and the FSRs.
-
13.
The CSV data will be processed in MATLAB to estimate step width. Fig. 12, Fig. 13 show the distances measured by the left and right sensors, when the FSRs are at their maximum values.
Fig. 11.

The proposed system in operation.
Fig. 7.
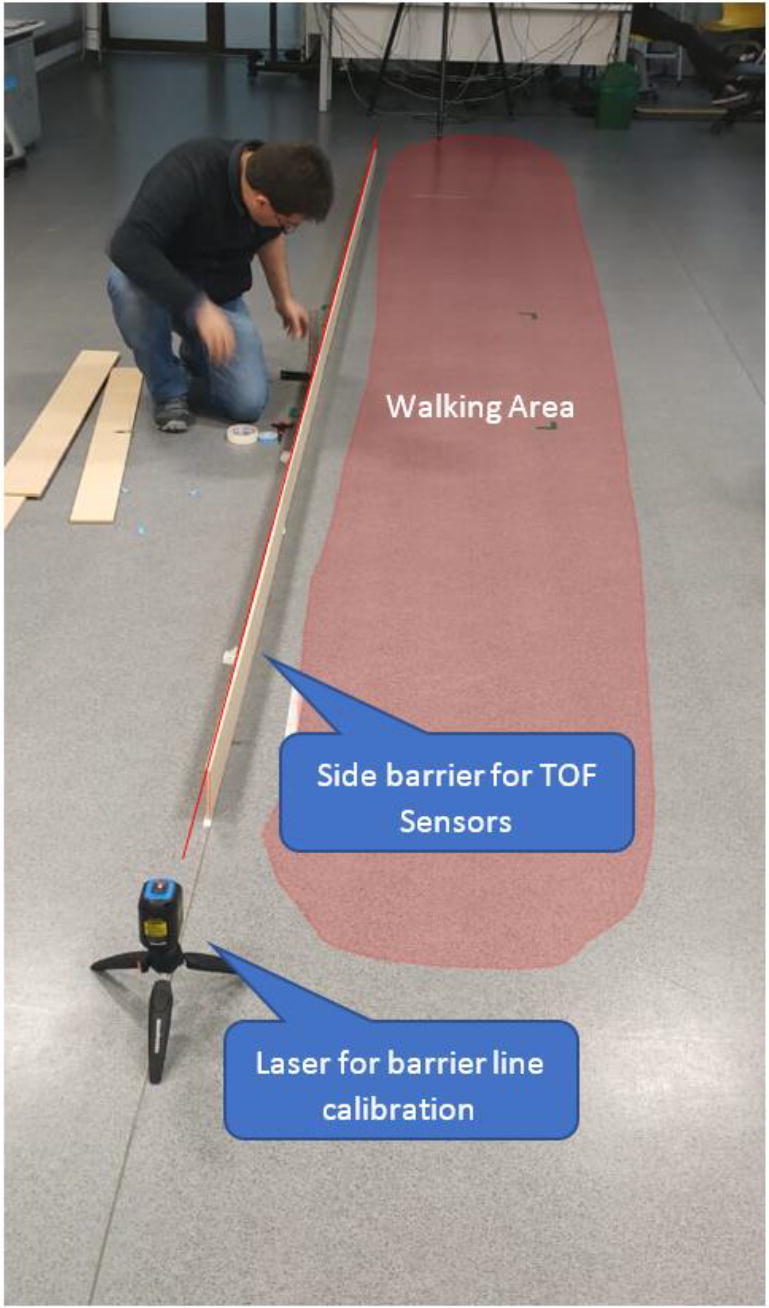
Side barrier installation.
Fig. 9.

Concentrator node and connections to PC.
Fig. 10.

User interface developed in Visual C++.
Fig. 12.
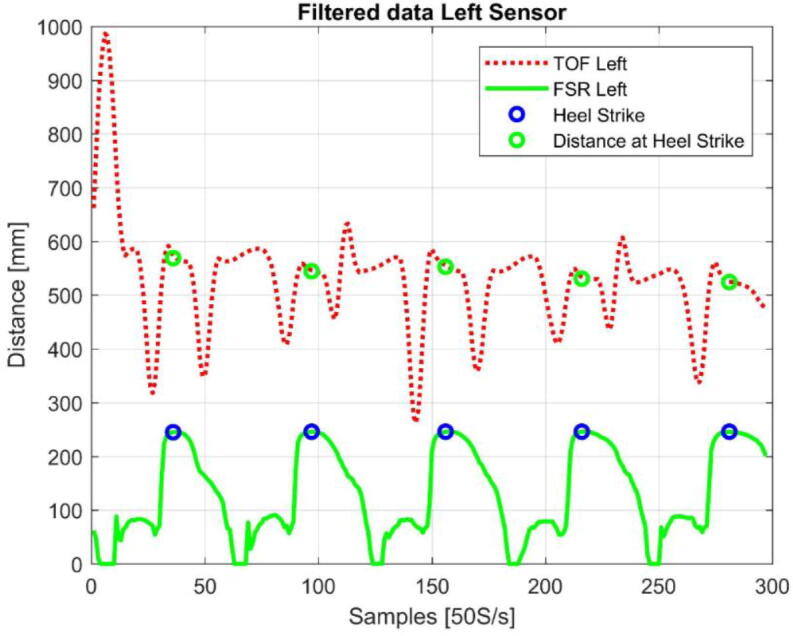
Green circles indicate the distance measured by the left TOF camera. These measurements correspond to the local maxima of the FSR (blue circles).
Fig. 13.
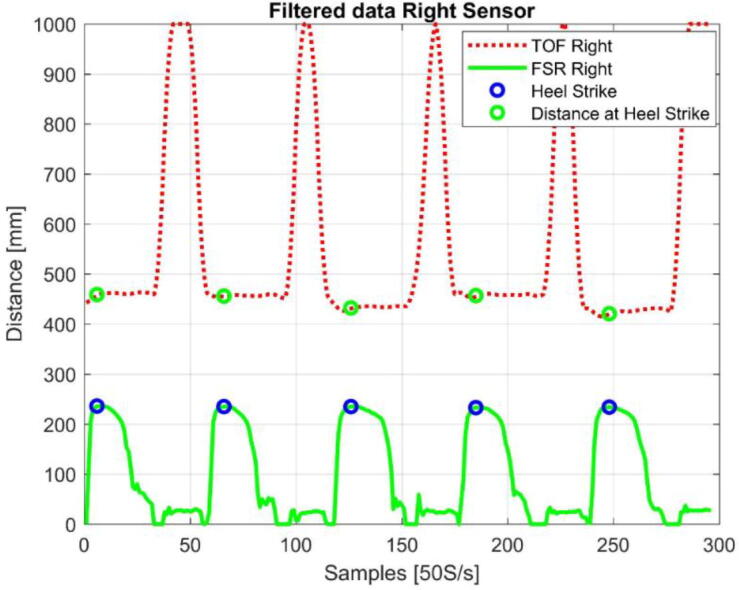
Green circles indicate the distance measured by the right TOF camera. The measurements correspond to the local maxima of the FSR (blue circles).
The following are the recommendations for using the system:
Keep the sensor node batteries charged.
Turn on the sensing nodes after placing them above the participant’s ankle.
Use double-sided tape to attach the force sensors to the shoe insole, precisely where the participant places their heel.
Avoid locating the concentrator where obstacles could interfere with the RF signal.
7. Validation and characterization
The SWMS was validated by comparing it with a Vicon (Oxford, UK) optical motion capture system composed of seven cameras (Vantage V5) sampled at 100 Hz and distributed around a rectangular area 7 m long and 3 m wide. Each camera was mounted on a tripod 1.90 m above the floor. Step width was calculated using NEXUS movement analysis software version 2.9.3. During the system calibration, the Vicon software reported an accuracy better than 0.3 mm. The procedure was developed inside a laboratory, where both, the Vicon’s reflective markers and the SWMS system were placed on the same participant. The comparison of five trials is presented in Table 1.
Table 1.
Comparison between the step width measured with Vicon and SWMS.
| Trial 1 [cm] | Trial 2 [cm] | Trial 3 [cm] | Trial 4 [cm] | Trial 5 [cm] | |
|---|---|---|---|---|---|
| Vicon | 11.01 | 13.92 | 12.31 | 11.56 | 11.75 |
| SWMS | 11.31 | 11.53 | 10.58 | 10.53 | 10.1 |
| Error | 3% | 17% | 14% | 9% | 14% |
The proposed SWMS has the following limitations:
-
•
Each TOF camera must be placed carefully to ensure that its front surface remains parallel to the side barrier. If misalignment occurs during walking, step width will be overestimated and the trial must be repeated. In the current prototype, the test administrator makes this decision based on the data displayed by the desktop application.
-
•
The SWMS has a maximum sampling rate of 50 Hz, which is fast enough for POMA, but modest compared to the standard sampling frequency of 100 Hz used for biomechanical analysis.
8. Human and animal rights
The experiments described in this work have been carried out in accordance with The Code of Ethics of the World Medical Association (Declaration of Helsinki) for experiments involving humans. In addition, the participants gave their informed consent approved by the Ethics Committee of the Escuela Colombiana de Ingeniería.
Declaration of Competing Interest
The authors declare that they have no known competing financial interests or personal relationships that could have appeared to influence the work reported in this paper.
Acknowledgments
The authors would like to recognize and express their sincere gratitude to Universidad del Cauca [ISNI: 0000 0001 2158 6862] (Colombia), Escuela Colombiana de Ingeniería [ISNI: 0000 0001 2323 9370] (Colombia), and to Corporación Universitaria Autónoma del Cauca [ISNI: 0000 0004 0483 8740] (Colombia) for the financial support granted during this project. The authors also would like to thank Enago (www.enago.com) for the English language review.
Contributor Information
Yamir H. Bolaños, Email: yamir.bolanos.m@uniautonoma.edu.co.
Carlos F. Rengifo, Email: caferen@unicauca.edu.co.
Pablo E. Caicedo, Email: pablo.caicedo.r@uniautonoma.edu.co.
Luis E. Rodriguez, Email: luis.rodriguez@escuelaing.edu.co.
Wilson A. Sierra, Email: wilson.sierra@escuelaing.edu.co.
Appendix A. Supplementary data
Supplementary data to this article can be found online at http://dx.doi.org/10.17632/dgyhpm7h2k.3.
References
- 1.Tinetti M.E. Performance-Oriented Assessment of Mobility Problems in Elderly Patients. J. Am. Geriatr. Soc. 1986;34(2):119–126. doi: 10.1111/j.1532-5415.1986.tb05480.x. [DOI] [PubMed] [Google Scholar]
- 2.Nordin E., Moe-Nilssen R., Ramnemark A., Lundin-Olsson L. Changes in step-width during dual-task walking predicts falls. Gait Posture. 2010;32(1):92–97. doi: 10.1016/j.gaitpost.2010.03.012. [DOI] [PubMed] [Google Scholar]
- 3.Silva J., Sousa I. IEEE International Symposium on Medical Measurements and Applications (MeMeA) 2016. Instrumented Timed Up and Go : Fall Risk Assessment based on Inertial Wearable Sensors; pp. 1–6. [Google Scholar]
- 4.Doheny E.P., Fan C.W., Foran T., Greene B.R., Cunningham C., Kenny R.A. Proceedings of the Annual International Conference of the IEEE Engineering in Medicine and Biology Society. 2011. “An instrumented sit-to-stand test used to examine differences between older fallers and non-fallers”, in; pp. 3063–3066. [DOI] [PubMed] [Google Scholar]
- 5.Hollman J.H., McDade E.M., Petersen R.C. Normative spatiotemporal gait parameters in older adults. Gait Posture. 2011;34(1):111–118. doi: 10.1016/j.gaitpost.2011.03.024. [DOI] [PMC free article] [PubMed] [Google Scholar]
- 6.Bäcklund T., Öhberg F., Johansson G., Grip H., Sundström N. Novel, clinically applicable, method to measure step-width during the swing phase of gait. Physiol. Meas. 2020 doi: 10.1088/1361-6579/ab95ed. [DOI] [PubMed] [Google Scholar]
- 7.Barone V., Verdini F., Burattini L., Di Nardo F., Fioretti S. A markerless system based on smartphones and webcam for the measure of step length, width and duration on treadmill. Comput. Methods Programs Biomed. 2016 doi: 10.1016/j.cmpb.2015.12.003. [DOI] [PubMed] [Google Scholar]
- 8.Dingwell J.B., Cusumano J.P., Cavanagh P.R., Sternad D. Local dynamic stability versus kinematic variability of continuous overground and treadmill walking. J. Biomech. Eng. 2000;123(1):27–32. doi: 10.1115/1.1336798. [DOI] [PubMed] [Google Scholar]
- 9.Brach J.S., Berlin J.E., VanSwearingen J.M., Newman A.B., Studenski S.A. Too much or too little step width variability is associated with a fall history in older persons who walk at or near normal gait speed. J. NeuroEng. Rehabil. 2005;2(1):21. doi: 10.1186/1743-0003-2-21. [DOI] [PMC free article] [PubMed] [Google Scholar]
- 10.Perry J.A., Srinivasan M. Walking with wider steps changes foot placement control, increases kinematic variability and does not improve linear stability. R. Soc. Open Sci. Sep. 2017;4(28989728) doi: 10.1098/rsos.160627. [DOI] [PMC free article] [PubMed] [Google Scholar]
- 11.Aggarwal A., Gupta R., Agarwal R. 2018 Eleventh International Conference on Contemporary Computing ({IC3}) 2018. Design and Development of Integrated Insole System for Gait Analysis; pp. 1–5. [Google Scholar]
- 12.Hansard M., Lee S., Ouk C., Horaud R.P. Springer; 2013. Time of Flight Cameras: Principles, Methods, and Applications. [Google Scholar]
- 13.Jensen R.R., Paulsen R.R., Rasmus L. Proceedings of the DAGM Workshop on Dynamic 3D Imaging. 2009. “Analysis of Gait Using a Treadmill and a Time-of-Flight Camera”, in. [Google Scholar]