Abstract
The signaling network of the unfolded protein response (UPR) adjusts the protein-folding capacity of the endoplasmic reticulum (ER) according to need. The most conserved UPR sensor, IRE1α, spans the ER membrane and activates through oligomerization. IRE1α oligomers accumulate in dynamic foci. We determined the in situ structure of IRE1α foci by cryogenic correlated light and electron microscopy combined with electron cryo-tomography and complementary immuno–electron microscopy in mammalian cell lines. IRE1α foci localized to a network of narrow anastomosing ER tubes (diameter, ~28 nm) with complex branching. The lumen of the tubes contained protein filaments, which were likely composed of arrays of IRE1α lumenal domain dimers that were arranged in two intertwined, left-handed helices. This specialized ER subdomain may play a role in modulating IRE1α signaling.
Most secreted and transmembrane proteins mature in the endoplasmic reticulum (ER), which is a specialized protein-folding compartment (1). To ensure proper folding, a network of quality-control pathways, termed the unfolded protein response (UPR), monitors the ER’s protein-folding status and adjusts its capacity (2). The three metazoan ER-resident UPR sensors [IRE1 (3, 4), PERK, and ATF6] activate in response to ER stress. UPR activation triggers corrective measures or, if the defect cannot be corrected, apoptosis (5). IRE1 activation initially provides cytoprotective outputs but then attenuates even under conditions of unmitigated ER stress (6). IRE1 attenuation predisposes the cell to apoptosis as a consequence of unopposed PERK signaling (7,8). Maladaptive UPR signaling is a hallmark of many diseases, including cancer, diabetes, and neurodegeneration (9).
Mammalian IRE1 has two paralogs (10), IRE1α and IRE1β. IRE1α is the major isoform expressed in most cell types. It is an ER-transmembrane protein bearing an ER stress–sensing domain on the ER lumenal side and kinase and ribonuclease (RNase) effector domains on the cytosolic side (3, 4, 11). IRE1α’s lumenal domain (LD) is bound by the ER-lumenal chaperone BiP, which dissociates upon ER stress (12). IRE1α-LD then binds directly to accumulated unfolded proteins, which triggers its oligomerization (13, 14). Oligomerization of the LD drives the juxtaposition of IRE1α’s cytosolic kinase and RNase domains, which activate alter trans-autophosphorylation (15). IRE1α’s activated RNase domain initiates the nonconventional splicing of its substrate XBP1 mRNA (16). Spliced XBP1 mRNA encodes the transcription factor XBP1s, which up-regulates hundreds of genes to restore ER homeostasis. A second consequence of IRE1α RNase activation, termed regulated IRE1-dependent mRNA decay (RIDD), is the selective degradation of mRNAs that reduces ER protein-folding burden and synergizes with XBP1s to alleviate ER stress (17).
Upon UPR induction, a fraction of IRE1 molecules oligomerize into large foci that are visible by fluorescence microscopy, which is consistent with IRE1’s LD and cytosolic kinase and RNase domain dimers and higher-order oligomers that are observed in solution and crystal structures (18–22). Extensive mutagenesis of the interfaces predicted from the structural analyses validates their functional importance (14, 18, 19), and both oligomerization of the kinase and RNase domains in vitro and foci formation correlate with high enzymatic activity (22). IRE1α foci have complex morphology and dynamic behaviors (23, 24) and comprise two distinct populations of IRE1α (24). A small fraction of clustered molecules rapidly exchanges with the pool of dispersed IRE1α in the ER membrane, whereas most are diffusionally constrained in the cluster core until eventual foci dissolution. The molecular principles of IRE1α’s different assembly states remain a mystery.
IRE1α oligomers localize to specialized ER subdomains
We applied cryogenic correlated light and electron microscopy combined with electron cryo-tomography (cryo-CLEM-ET) to determine the ultrastructure of IRE1α foci in mammalian cells (N = 4; independent replicates). We used characterized stable cell lines that inducibly expressed fluorescently tagged human IRE1α (14, 24), which faithfully recapitulated IRE1α function. We grew cells directly on electron microscopy grids, induced IRE1α expression and ER stress, and plunge-froze the samples with added nanospheres positional markers at 77 K (25).
To localize IRE1α foci, we imaged the frozen grids on a fluorescence light microscope fitted with a liquid nitrogen sample chamber (26). In initial studies with stressed cells expressing IRE1α-green fluorescent protein (GFP), we observed strong autofluorescence at 77 K (27) that hindered IRE1α foci identification (fig. Sl). To overcome this obstacle, we fused IRE1α to the brighter fluorescent protein mNeonGreen (mNG). This refinement revealed spots that emitted much higher fluorescence in the green relative to red and blue channels (Fig. 1A), which were absent in control cells that expressed IRE1α not fused to mNG (fig. Sl). We used the ratio of green-to-red and green-to-blue fluorescence intensity to identify IRE1α-mNG foci reliably.
Fig. 1. IRE1α oligomers localized to specialized ER regions with complex topology.
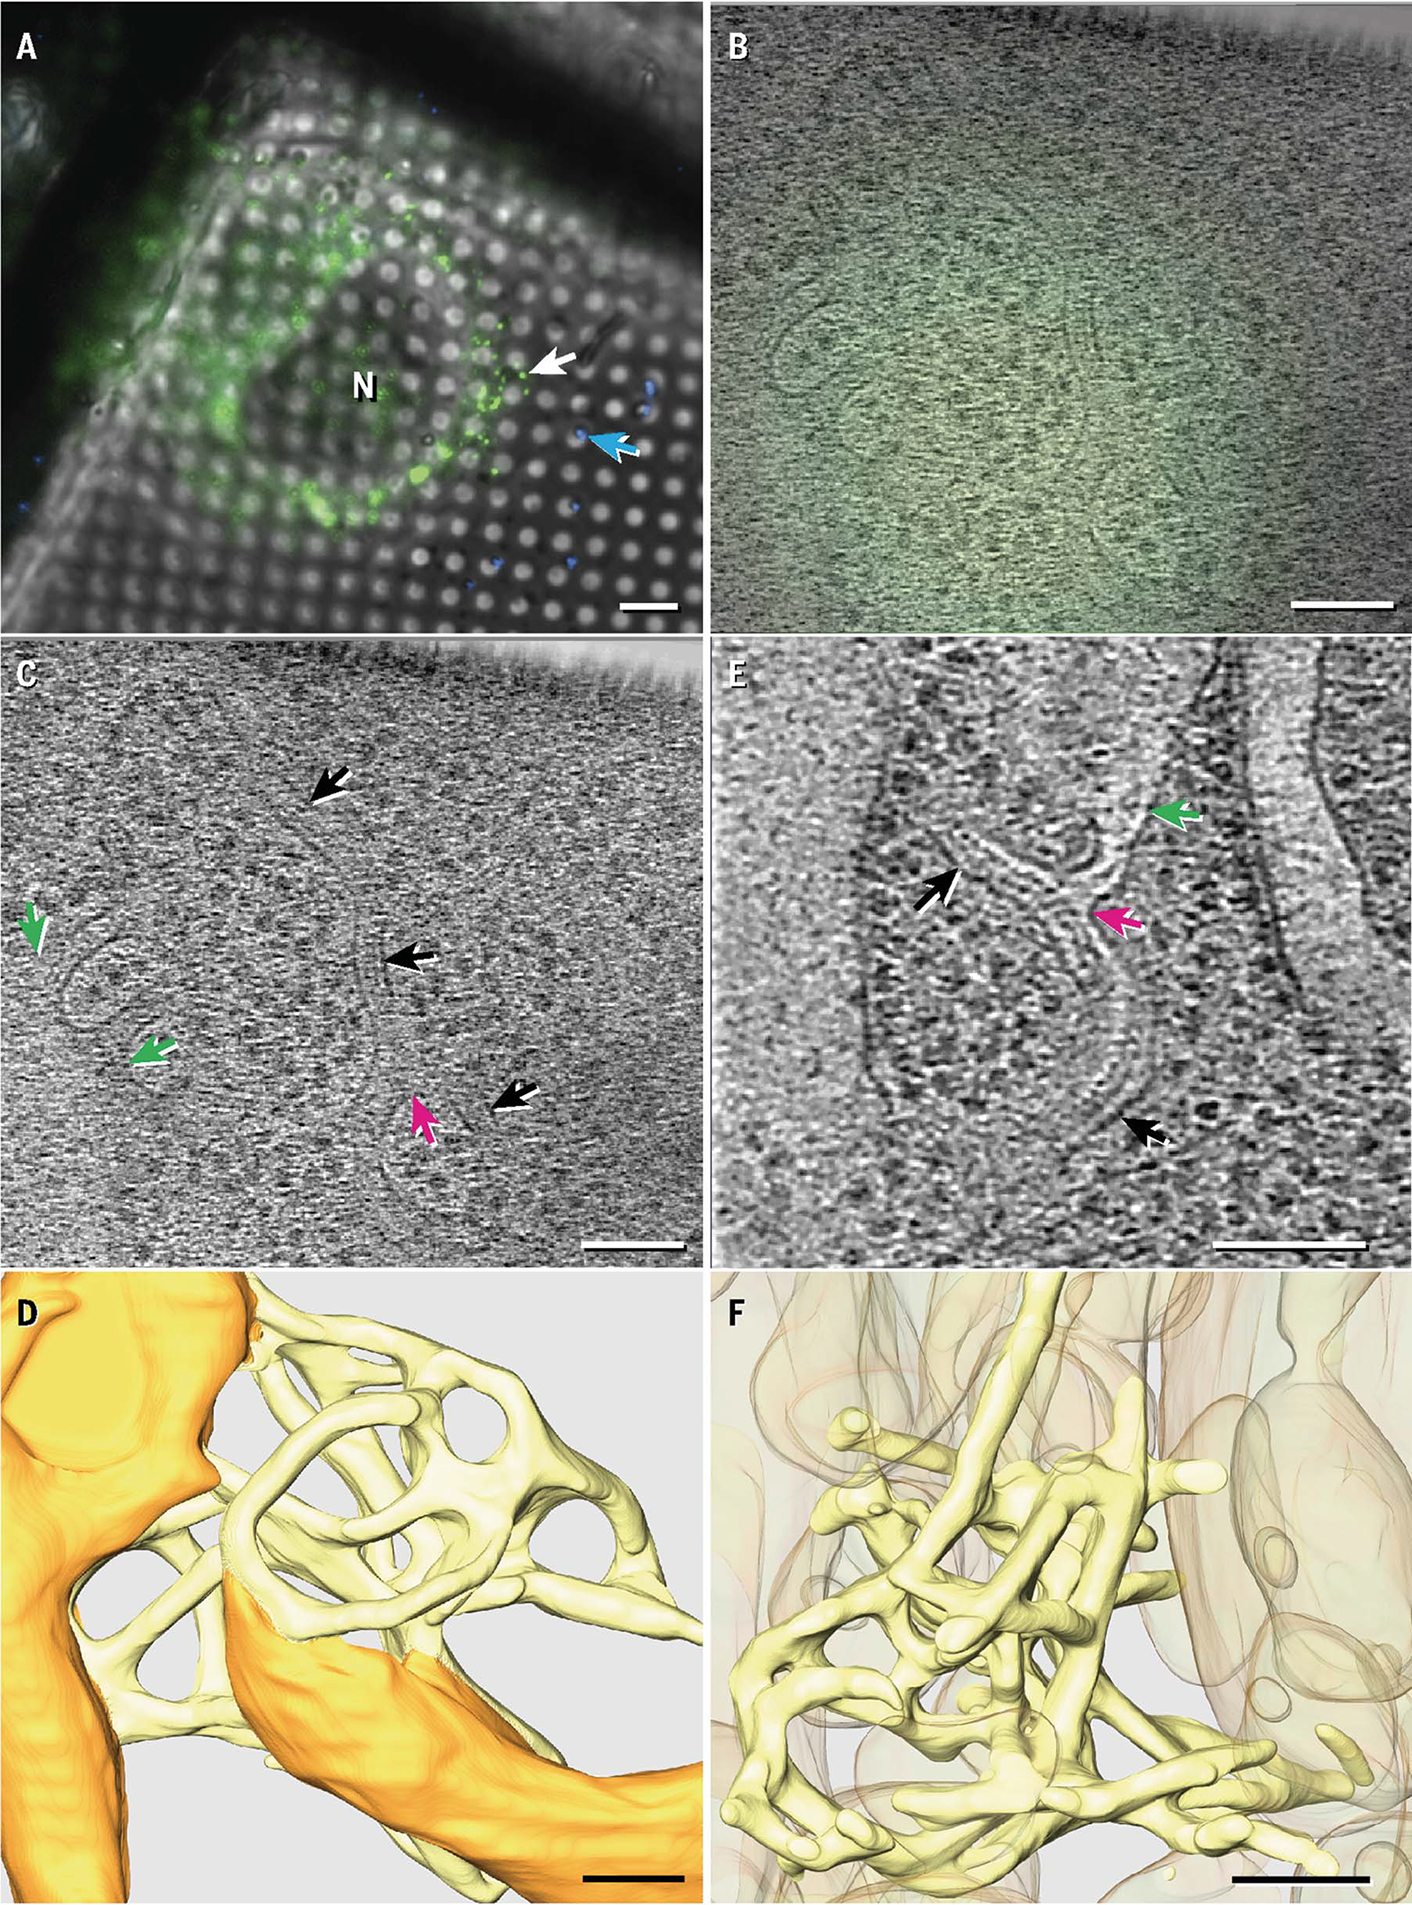
(A) Fluorescent profiles imaged at 77 K for ER-stressed MEF-IRE1α-mNG cells grown on electron microscopy grids. The white arrow indicates the fluorescent target depicted in (B) to (D); the blue arrow indicates a 500-nm fluorescent nanosphere. N, nucleus. (B and C) Fluorescence image (B) correlated with a representative tomogram z slice (C) showing examples of narrow membrane tubes (black arrows) connected to the general ER network (green arrows) and to each other at three-way junctions (magenta arrows). (D) Manual tomogram segmentation with normal ER membranes in orange and constricted membranes colocalizing with IRE1α-mNG in yellow. (E) Representative tomogram z slice obtained in ER-stressed U2OS-IRE1α-mNG cells. Arrows are color coded the same as in (C). (F) Manual segmentation of the region shown in (E) with narrow membrane tubes in yellow and other membranes in orange at 50% transparency. Ribosomes and cytoplasmic densities in (D) and (F) are omitted for clarity and are instead shown in fig. S4. Scale bars are 6 μm for (A) and 100 nm for (B) to (F).
We next imaged IRE1α foci by cryo-CLEM-ET. We used nanospheres, grid features, and cell boundaries to locate the same IRE1α foci with the electron microscope that we had identified by light microscopy and then recorded tilt series. Across nine tomograms obtained from mouse embryonic fibroblasts (MEFs), IRE1α-mNG foci consistently localized to specialized regions of the ER that displayed a network of notably narrow, anastomosing tubes (Fig. 1, B to D, and figs. S2 and S3) with an average (±SD) diameter of 28 ± 3 nm. The tubes frequently connect with each other by three-way junctions and to surrounding ER structures, forming a topologically complex, continuous membrane surface (Fig. 1D). Unlike the surrounding ER, the tubes were devoid of bound ribosomes (fig. S4).
To obtain higher cryo-ET resolution, we used human osteosarcoma U2OS cells that expressed inducible IRE1α-mNG (24), which contained more-expansive thin regions compared with MEFs. We imaged tilt series from eight IRE1α-mNG foci and again observed thin anastomosing tubes with characteristics that closely matched those in MEF-IRE1α-mNG (Fig. 1, E and F, and figs. S4 to S6). Thus, IRE1α foci localize to a highly specialized ER region, henceforth termed the “IRE1α subdomain.”
Orthogonal methods reveal IRE1α subdomains
To further explore the IRE1α subdomains, we performed conventional and immuno–electron microscopy on human embryonic kidney (HEK) 293 cell–IRE1α-GFP (19). Electron micrographs of Epon-embedded thin sections of stressed cells—but not unstressed controls—exhibited membrane tube networks with topology that was comparable to that seen by cryo-CLEM-ET (fig. S7). These tubes stained more strongly in their lumenal space than in the surrounding ER, which suggested a high protein density.
We next performed immunogold labeling of ultrathin HEK293-IRE1α-GFP cryosections. In nonstressed cells, gold particles that were specific to IRE1α-GFP sparsely labeled large regions of the cell with visible ER (Fig. 2, A and A′, and fig. S8). In stressed cells, clusters of gold particles labeled regions of much higher membrane complexity, which showed longitudinal and transverse cross sections of ~28-nm membrane tubes (Fig. 2, B, B′, and E to F′; and fig. S8). Quantification of interparticle distances revealed a population of clustered gold particles in stressed cells that was absent in nonstressed cells (Fig. 2, C and D). Notably, in transverse cross sections, we observed a distinct circular lumenal density inside the membrane tubes (Fig. 2, F and F′).
Fig. 2. Orthogonal immuno–electron microscopy revealed IRE1α subdomains.
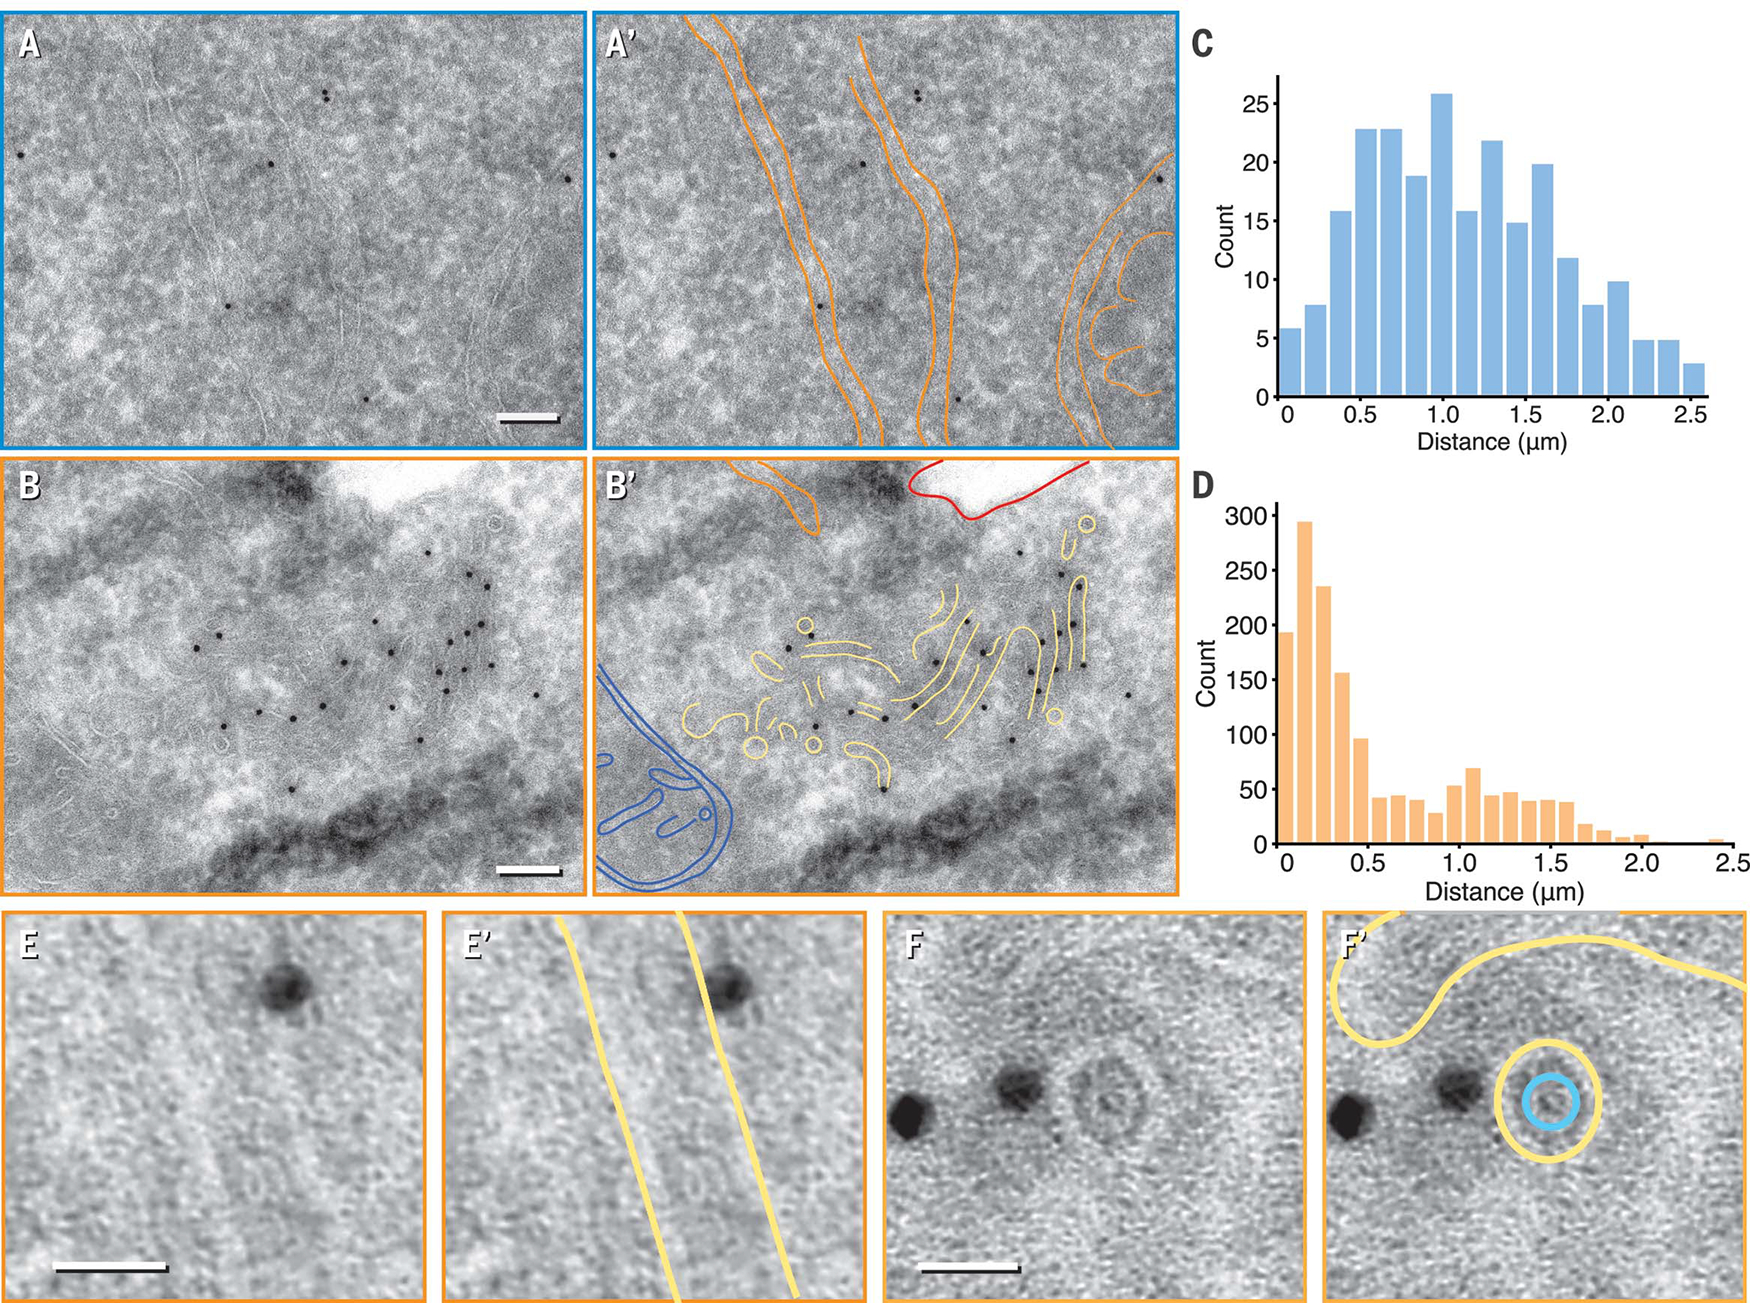
(A and B) Representative micrograph of nonstressed (A) and stressed (B) HEK293-IRE1α-GFP. Gold particles recognizing the IRE1α-GFP epitope sparsely labeled general ER structures in nonstressed cells but localized to a region enriched in narrow membranes of 26 ± 2 nm in diameter (±SD) with stress. Orange, ER sheet and tubule membranes; blue, mitochondrion; red, plasma membrane; yellow, narrow membrane tubes. Scale bars are 100nm. (C and D) Histograms of inter–gold particle distances measured in micrographs from nonstressed (C) and stressed samples (D) revealed densely clustered gold particles enriched with ER-stress induction. (E to F) Enlarged longitudinal [(E) and (E′)] and end-on [(F) and (F′)] cross sections of ~28-nm diameter tubes that are close to gold particles. A ring-like density within the lumenal space was visible in (F′) (segmented in teal). Scale bars are 20 nm. Yellow, membrane.
IRE1α subdomains contain lumenal helical filaments
We likewise observed regular densities in the lumen of the IRE1α subdomain tubes in cryotomograms, which we interpret as oligomers of IRE1α-LD. In longitudinal sections of MEF-derived tomograms, the lumenal densities resembled train tracks parallel to the membranes (Fig. 3, A and A′). Closed rings approximately concentric with the enclosing tube membrane were clearly visible where IRE1α subdomain tubes were imaged parallel to the beam (Fig. 3, B and B′, and fig. S9). The inner rings measured ~9 ± 0.5 nm in diameter (±SD) and were enclosed by membrane tubes ~28 ± 1 nm in diameter (±SD) (Fig. 3C). In U2OS-IRE1α-mNG tomograms, the lumenal densities showed sufficient substructure to reveal two intertwined helices (Fig. 3, D to F′): Top and bottom cross sections showed equidistant parallel angled lines of opposite directionalities, whereas the middle cross section showed helical features (Fig. 3, D to G).
Fig. 3. IRE1α subdomain membrane tubes contained lumenal protein densities.
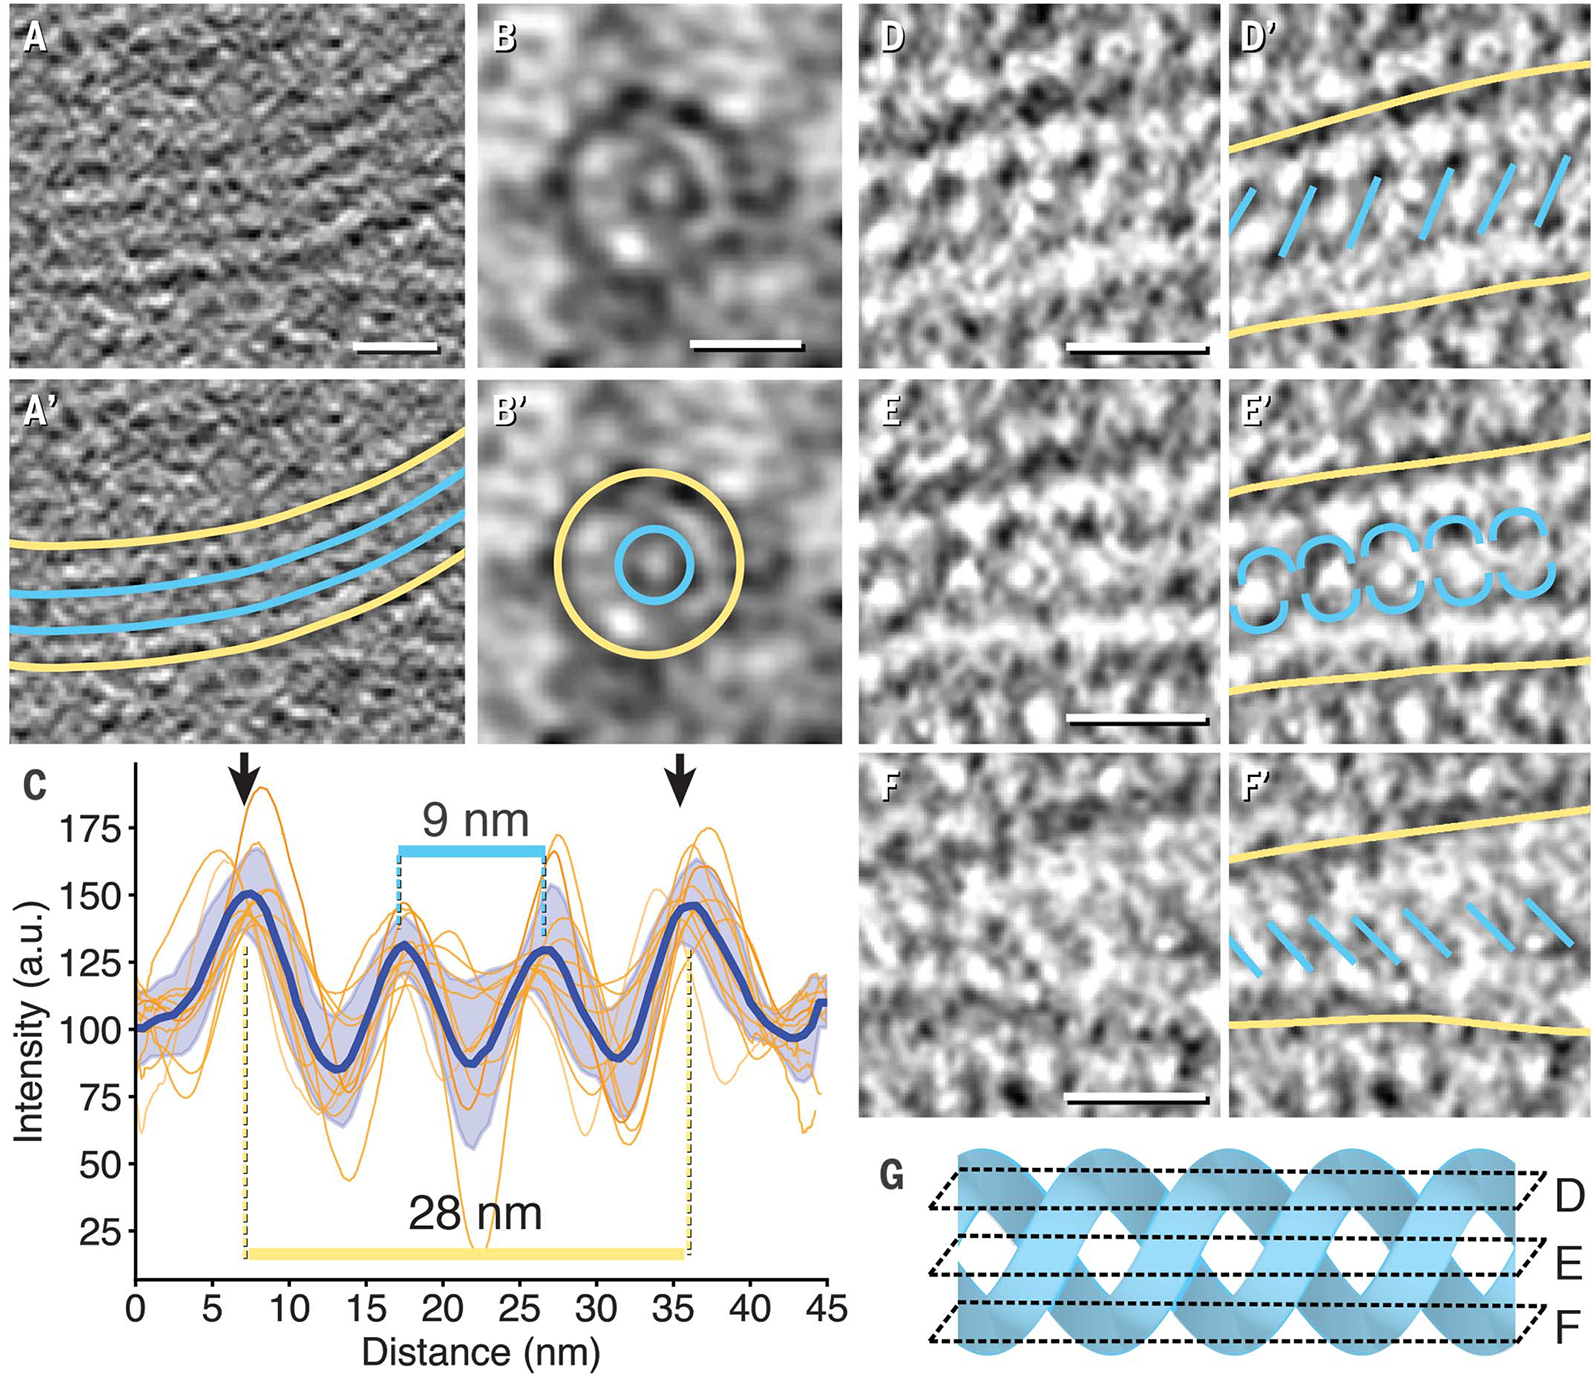
(A to C) Representative examples of longitudinal [(A) and (A′)] and end-on [(B) and (B′)] cross sections in MEF-IRE1α-mNG tomograms revealed membrane densities (yellow) surrounding lumenal protein densities (teal). Intensity line plots across subdomain tubes were aligned and averaged for nine cross sections and plotted as a function of distance in (C). The blue line with shaded error of the mean was the averaged trace for all plots. Distances separating peak maxima are indicated for membrane densities (yellow) and lumenal protein densities (teal). a.u., arbitrary units. (D to F) Example of lumenal protein densities with helical features obtained in U2OS-IRE1α-mNG cells viewed as top [(D) and (D′)], middle [(E) and (E′)], and bottom [(F) and (F′)] sections. Color coding is the same as in (A′) and (B′). (G) Idealized double helix illustrating how intercepting planes of slices in (D), (E), and (F) could yield the densities segmented in (D′), (E′), and (F′). All scale bars are 20 nm.
Subtomogram averaging resolves flexible IRE1α-LD double helices
To determine the three-dimensional structure of this density, we extracted 653 subvolumes for subtomogram averaging (fig. S10). The resulting map of averaged electron density portrayed a left-handed double helix composed of two equidistant, intertwined strands with a pitch of 17 nm in each strand (Fig. 4, A and B, and fig. S10). This double-helical structure is reminiscent of the unit cell of the Saccharomyces cerevisiae core IRE1-LD (cLD) crystal structure [Protein Data Bank ID 2BE1 (20)], in which twofold symmetrical IRE1-cLD dimers arrange into left-handed double-helical filaments.
Fig. 4. Subtomogram averaging resolved flexible IRE1α-LD double helices.
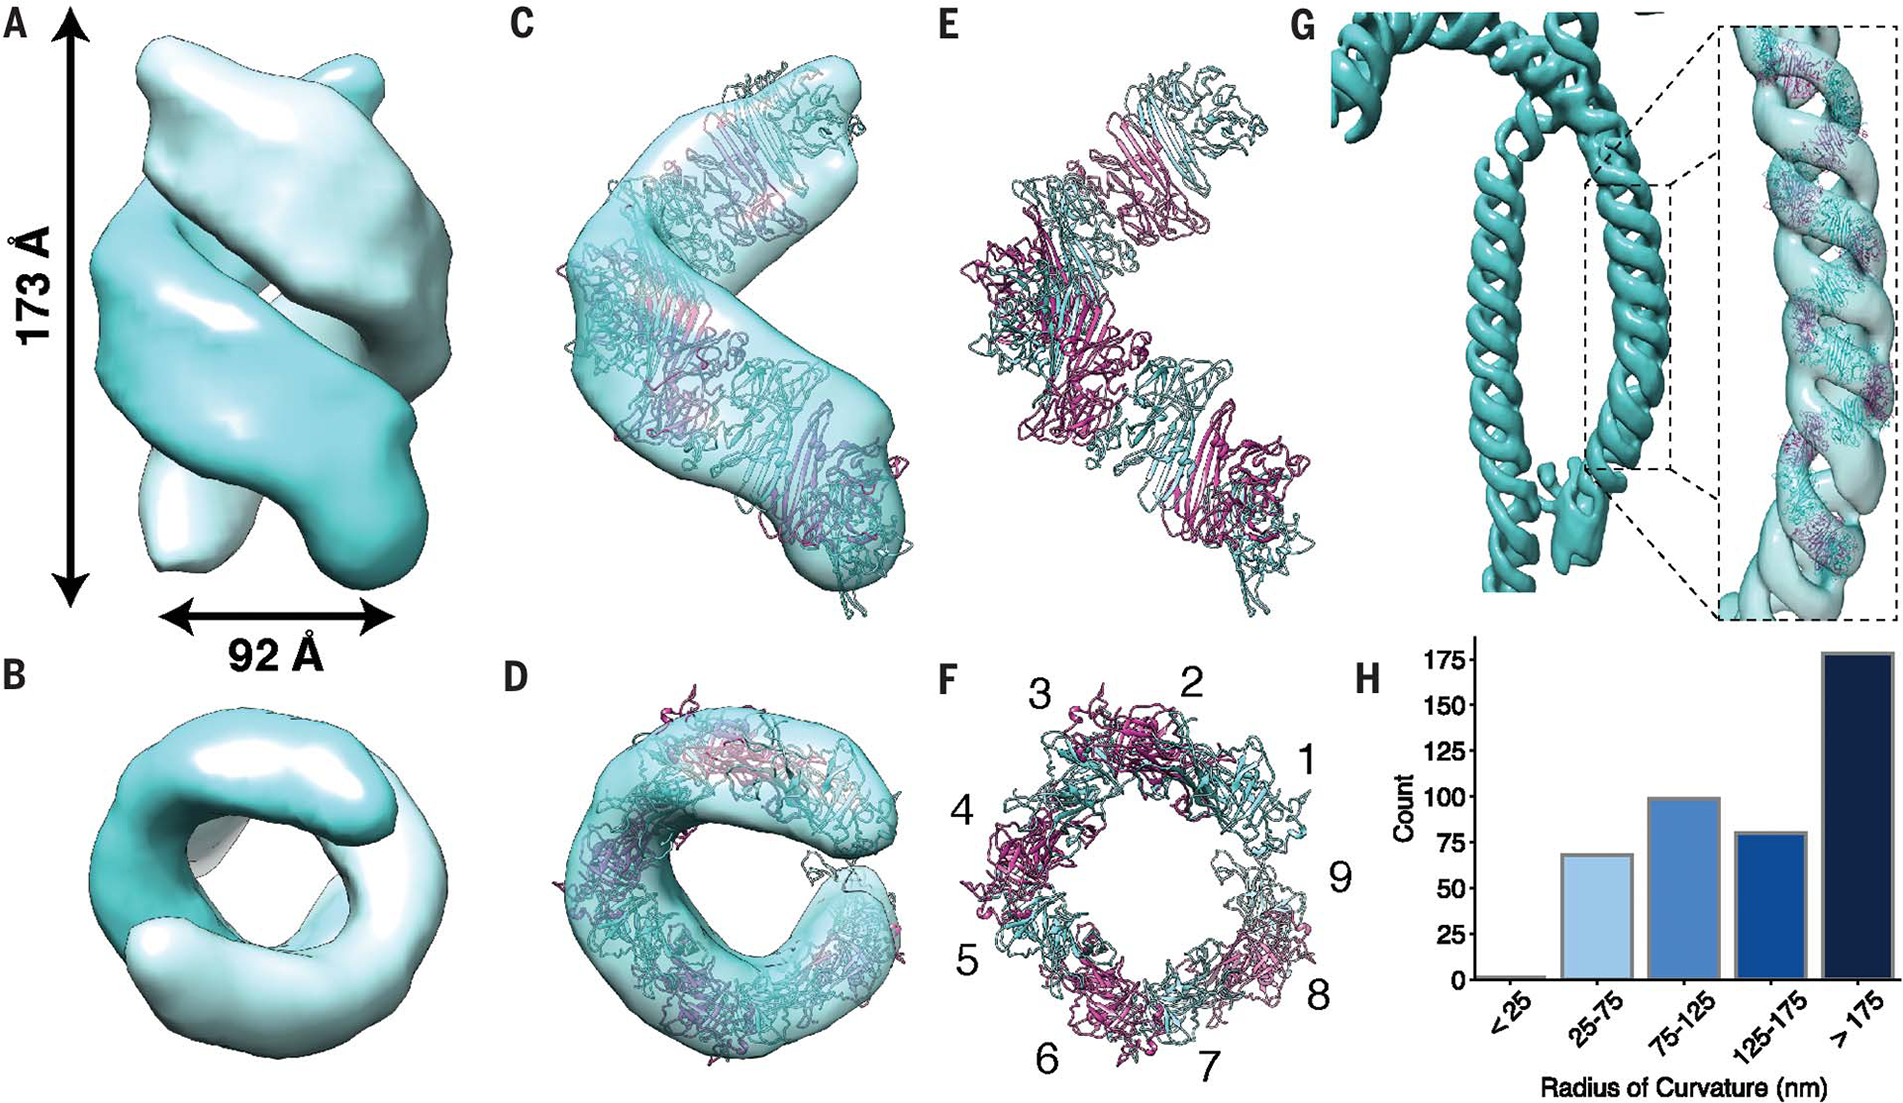
(A and B) Averaged electron density map obtained from 653 subvolumes in U2OS-IRE1α-mNG tomograms with indicated helical pitch and peak-to-peak width. (C to E) Semitransparent masked single-strand map fitted with modeled IRE1α-cLD oligomer [(E) and (F)] with 84% of the atoms fitting within the map. Panels (B), (D), and (F) are 90° x-axis rotations of (A), (C), and (E), respectively. (F) Nine monomers of IRE1α-cLD complete one turn per strand. (G) Isosurface of the averaged density mapped back onto the cryo-tomogram at a highly curved region and fitted with a modeled IRE1α-cLD helix. (H) Histogram of 274 radii of curvature measured in 25-nm segments along IRE1α subdomains.
To compare the shape of the known IRE1α-cLD structures with the averaged map, we next endeavored to interpret the double helix in light of the yeast IRE1-cLD crystal structure in its active conformation, which forms double helices with a pitch of 38 nm, instead of the inactive dimeric human IRE1α-cLD structure. We built a human IRE1-cLD tetramer model by threading the human IRE1α-cLD sequence into the crystal structure of active yeast IRE1-cLD, as previously described (14, 28). We next fit this tetramer into our double-helical map and modified the dimer:dimer interface to accommodate the helical pitch observed (Fig. 4, C and D, and fig. S11). We propagated the interface to occupy each filament of the double helix with approximately nine monomers per turn (Fig. 4, E and F). This model is consistent with the yeast cLD crystal structure but has a compressed pitch of 17 nm, and interface residues whose mutation disrupted human IRE1α foci formation and RNase activity mapped to the helical interfaces (fig. S12) (14, 19). The modeled IRE1α-cLD helix accounts well for the averaged map, including its ribbon-like shape.
We mapped the averaged subvolumes back onto the cryo-tomograms and generated a volumetric distribution for IRE1α-LD filaments within an IRE1α subdomain (Fig. 4G). The membrane tubes and helices display a range of straight (radius of curvature >175 nm) and curved segments with radii approaching 25 nm (Fig. 4H and fig. S13). This bending indicates that IRE1α-LDs and/or their oligomerization interfaces are flexible.
Infrequently, the lumenal double helices were irregularly spaced relative to tube membranes (fig. S14). In one case, we observed helices that were not completely enclosed by membrane tubes but instead were positioned on the lumenal face of a flat ER membrane (Fig. 5, A to B′). The distance constraints that this conformation imposes can be readily accommodated by the 52–amino acid linker connecting the IRE1α-cLD to IRE1α’s transmembrane domain (Fig. 5, C to G).
Fig. 5. IRE1α -LD helices accommodate a range of distances from membrane.
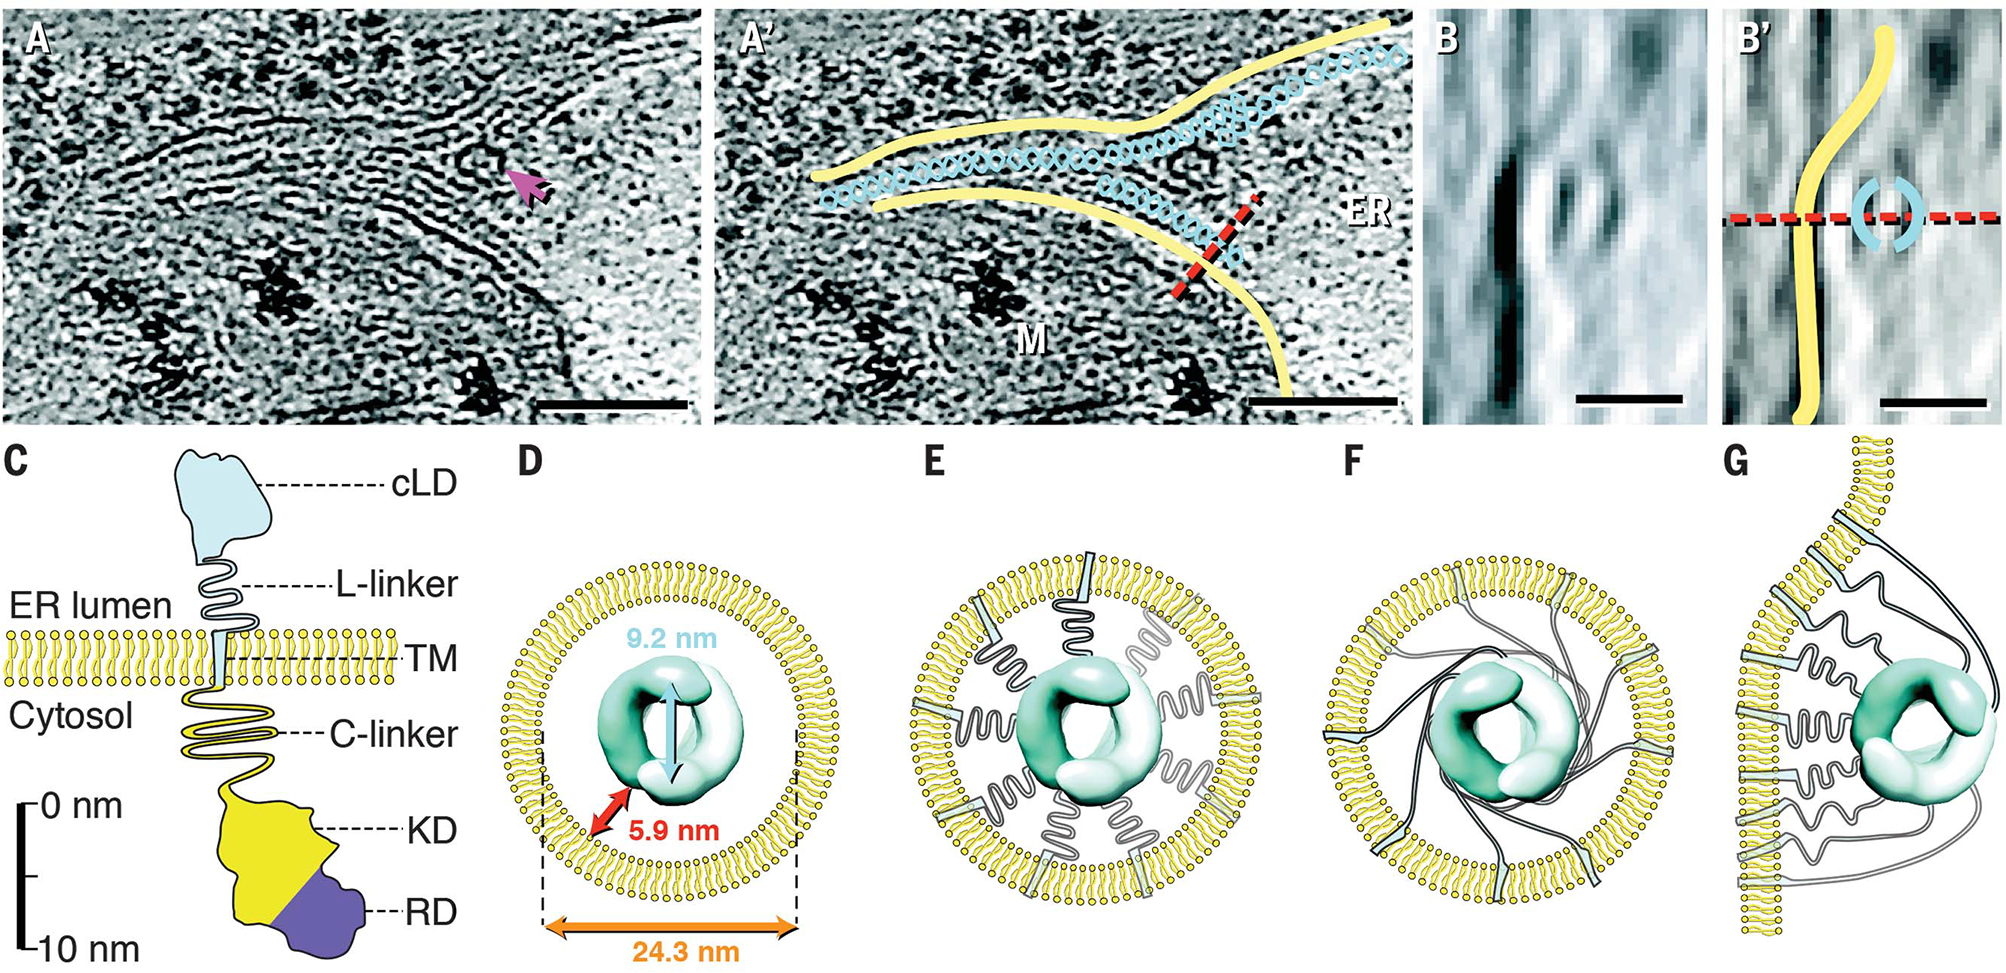
(A and A′) Instance of IRE1α-LD helices not enclosed by membrane tubes. The magenta arrow in (A) indicates a membrane fenestration. Yellow, membrane; teal, helical filaments; red dashed line, plane of rotation; ER, lumenal space; M, mitochondrion. Scale bars are 100 nm. (B and B′) Side view with 90° x-axis rotation along the indicated plane. Color coding is the same as in (A′). Scale bars are 20 nm. (C) Diagram of IRE1α domains drawn to approximate scale. cLD, core LD (amino acids 19 to 390); L-linker, lumenal linker (amino acids 391 to 443); TM, transmembrane helix (amino acids 444 to 464); C-linker, cytoplasmic linker (amino acids 465 to 570); KD, kinase domain (amino acids 571 to 832); RD, RNase domain (amino acids 835 to 964). (D) Dimensions of IRE1α-LD helices within IRE1α subdomain lumenal space. (E and F) Schematics for alternative TM and L-linker arrangements. There were 18 monomers per turn per double helix but only nine TMs and L-linkers were shown for clarity. (G) Model for TM and L-linker arrangement for helices as seen in (B).
Discussion
The ER is formed from a single continuous membrane that is dynamically differentiated into a plethora of pleiomorphic subdomains (29–32). We found that UPR activation leads to the formation of “IRE1α subdomains,” which are composed of labyrinthine networks of anastomosing ~28-nm membrane tubes that contain ordered IRE1α-LD double-helical filaments. Our use of cryo-CLEM-ET to determine the supramolecular arrangements of IRE1α oligomers in their native environment demonstrates the power of in situ structural biology (33).
Several independent lines of evidence support our conclusion that the observed helical densities correspond to oligomerized IRE1α-LDs: (i) We observed narrow membrane tubes in 20 out of 20 fluorescent foci analyzed, 18 of which showed protein density inside tubes of ~28-nm diameter, which is consistent with the averaged helical maps. No such structures were observed in adjacent and random regions of the cell, including those emitting high autofluorescence; (ii) orthogonal immunogold staining revealed IRE1α localization to regions enriched with similarly narrow tubes; (iii) the double-helical architecture closely resembles the crystal structure of yeast IRE1-cLD (20); and (iv) the reconstructed volume has the same ribbon-like shape and dimensions as IRE1α-cLD oligomers.
The existence of IRE1α subdomains explains why IRE1α foci contain a mobile periphery and a nonexchangeable core (24). We surmise that the two populations represent (i) IRE1α molecules located where tubes merge with the main ER and (ii) those located deeper in the interior of the tubes. IRE1α molecules at helix ends can readily dissociate, and new IRE1α molecules can associate; they represent a mobile pool. IRE1α molecules at the foci’s core that are physically trapped in arrayed helices represent a nonexchangeable pool.
The functional importance of IRE1 oligomerization is supported by mutational disruption of interfaces that affect foci formation, RNase function, and cell survival under stress (14, 18–22). The confinement of IRE1α in the specialized IRE1α subdomains suggests further functional consequences for the regulation of IRE1α signaling. A single unfolded protein molecule trapped inside a 100-nm-long subdomain segment has an effective concentration of ~40 μM (materials and methods), which is well within the range of the affinity measured for IRE1α–unfolded protein binding in vitro (13, 14). Thus, once IRE1α subdomains form under ER stress, a few activating ligand molecules would be sufficient to saturate IRE1α-LD, effectively locking IRE1α into its activated state. This effect is due to the enormous concentration IRE1α experiences upon foci formation. Without UPR activation, IRE1α-mNG is distributed over the ER surface at ~10 molecules/μm2 (24). Inside IRE1α subdomains, it is enriched to >10,000 molecules/μm2 of subdomain membrane (materials and methods). Moreover, the complex subdomain membrane topology (34) and IRE1α-LD’s helical assembly both reduce IRE1α diffusional freedom and stabilize the oligomeric state. We estimate that the local concentrations of IRE1α-cLD inside subdomain tubes and IRE1α cytosolic domains on the tubes’ surface approach 4 to 5 mM and 170 to 220 μM, respectively, well exceeding the measured oligomerization affinities for purified IRE1 domains (22, 35). IRE1α subdomains may also function as a diffusion barrier, in which large molecules may be excluded or diffusionally constrained (materials and methods).
The averaged human IRE1α-LD map and yeast IRE1-cLD crystal structure both revealed equidistant double left-handed helices, albeit with a 2.2-fold difference in pitch. The differences could be species specific or result from crystallization conditions. IRE1α helices are observed, although rarely, on flat ER membranes, which indicates that the IRE1α lumenal linker domains can compact to varying degrees to bridge IRE1α-cLD with the nearest membrane.
IRE1α-LD oligomers may form on flat ER membranes and subsequently deform and constrict membranes (36), perhaps using preexisting regions of high curvature (37), to form the tubes of regular diameter. Alternatively, in 2 out of 20 tomograms, IRE1α-mNG foci localized to irregular, thin membrane tubes without ordered lumenal filaments (fig. S14), which possibly reflects an intermediate assembly state that captured IRE1α’s localization preceding LD helix formation.
Our discovery of the IRE1α subdomain suggests intriguing possibilities for how these specialized ER structures could serve regulatory functions in the UPR. IRE1α recruitment into long-lived, topologically distinct structures may scaffold proposed downstream effectors (9) and/or affect the switch in IRE1α RNase output between XBP1 mRNA splicing and RIDD activities (17). Such regulation may profoundly affect the UPR’s life/death decision and hence be of crucial importance in designing UPR-centered therapies in disorders characterized by a breakdown of proteostasis.
Supplementary Material
ACKNOWLEDGMENTS
We thank E. Karagoz, S. Niekamp, V. Belyy, M. Elvekrog, D. Acosta-Alvear, R. Fetter, and S. van Dijk for their advice and technical assistance and G. Huber, R. Ernst, A. Frost, and J. Nunnari for insightful discussions.
Funding:
This work was supported in part by NWO NEMI (grant 184.034.014 to J.K.) and the NIH (grants P50 AI150464 and R35 GM122588 to G.J.J. and R01-GM032384 to P.W.). N.-H.T. is supported by the NSF GRFP. P.W. is an Investigator of the Howard Hughes Medical Institute.
Footnotes
Competing interests: A.D.M. received a salary from Genentech, Inc. The authors declare no other competing interests.
Data and materials availability:
The codes used for analyses are available through Zenodo (38). The subtomogram-averaged maps can be accessed at EMDB (EMD-23058). Raw and processed data, cell lines, and reagents are available upon request.
REFERENCES AND NOTES
- 1.Helenius A, Marquardt T, Braakman I, Trends Cell Biol. 2, 227–231 (1992). [DOI] [PubMed] [Google Scholar]
- 2.Karagöz GE, Acosta-Alvear D, Walter P, Cold Spring Harb. Perspect. Biol. 11, a033886 (2019). [DOI] [PMC free article] [PubMed] [Google Scholar]
- 3.Mori K, Ma W, Gething MJ, Sambrook J, Cell 74, 743–756 (1993). [DOI] [PubMed] [Google Scholar]
- 4.Cox JS, Shamu CE, Walter P, Cell 73, 1197–1206 (1993). [DOI] [PubMed] [Google Scholar]
- 5.Tabas I, Ron D, Nat. Cell Biol. 13, 184–190 (2011). [DOI] [PMC free article] [PubMed] [Google Scholar]
- 6.Lin JH et al. , Science 318, 944–949 (2007). [DOI] [PMC free article] [PubMed] [Google Scholar]
- 7.Lu M et al. , Science 345, 98–101 (2014). [DOI] [PMC free article] [PubMed] [Google Scholar]
- 8.Chang T-K et al. , Mol. Cell 71, 629–636.e5 (2018). [DOI] [PubMed] [Google Scholar]
- 9.Hetz C, Zhang K, Kaufman RJ, Nat. Rev. Mol. Cell Biol. 21, 421–438 (2020). [DOI] [PMC free article] [PubMed] [Google Scholar]
- 10.Wang XZ et al. , EMBO J. 17, 5708–5717 (1998). [DOI] [PMC free article] [PubMed] [Google Scholar]
- 11.Sidrauski C, Walter P, Cell 90, 1031–1039 (1997). [DOI] [PubMed] [Google Scholar]
- 12.Bertolotti A, Zhang Y, Hendershot LM, Harding HP, Ron D, Nat. Cell Biol. 2, 326–332 (2000). [DOI] [PubMed] [Google Scholar]
- 13.Gardner BM, Walter P, Science 333, 1891–1894 (2011). [DOI] [PMC free article] [PubMed] [Google Scholar]
- 14.Karagöz GE et al. , eLife 6, e30700 (2017). [DOI] [PMC free article] [PubMed] [Google Scholar]
- 15.Ali MMU et al. , EMBO J. 30, 894–905 (2011). [DOI] [PMC free article] [PubMed] [Google Scholar]
- 16.Calfon M et al. , Nature 415, 92–96 (2002). [DOI] [PubMed] [Google Scholar]
- 17.Hollien J, Weissman JS, Science 313, 104–107 (2006). [DOI] [PubMed] [Google Scholar]
- 18.Aragón T et al. , Nature 457, 736–740 (2009). [DOI] [PMC free article] [PubMed] [Google Scholar]
- 19.Li H, Korennykh AV, Behrman SL, Walter P, Proc. Natl. Acad. Sci. U.S.A. 107, 16113–16118 (2010). [DOI] [PMC free article] [PubMed] [Google Scholar]
- 20.Credle JJ, Finer-Moore JS, Papa FR, Stroud RM, Walter P, Proc. Natl. Acad. Sci. U.S.A. 102, 18773–18784 (2005). [DOI] [PMC free article] [PubMed] [Google Scholar]
- 21.Zhou J et al. , Proc. Natl. Acad. Sci. U.S.A. 103, 14343–14348 (2006). [DOI] [PMC free article] [PubMed] [Google Scholar]
- 22.Korennykh AV et al. , Nature 457, 687–693 (2009). [DOI] [PMC free article] [PubMed] [Google Scholar]
- 23.Ricci D et al. , FASEB J. 33, 9811–9827 (2019). [DOI] [PMC free article] [PubMed] [Google Scholar]
- 24.Belyy V, Tran N-H, Walter P, Proc. Natl. Acad. Sci. U.S.A. 117, 1533–1542 (2020). [DOI] [PMC free article] [PubMed] [Google Scholar]
- 25.Tivol WF, Briegel A, Jensen GJ, Microsc. Microanal. 14, 375–379 (2008). [DOI] [PMC free article] [PubMed] [Google Scholar]
- 26.Briegel A et al. , Methods Enzymol. 481, 317–341 (2010). [DOI] [PubMed] [Google Scholar]
- 27.Carter SD et al. , J. Struct. Biol. 201, 15–25 (2018). [DOI] [PMC free article] [PubMed] [Google Scholar]
- 28.Yang J, Zhang Y, Nucleic Acids Res. 43, W174–W181 (2015). [DOI] [PMC free article] [PubMed] [Google Scholar]
- 29.Borgese N, Francolini M, Snapp E, Curr. Opin. Cell Biol. 18, 358–364 (2006). [DOI] [PMC free article] [PubMed] [Google Scholar]
- 30.Nixon-Abell J et al. , Science 354, eaaf3928 (2016). [Google Scholar]
- 31.Phillips MJ, Voeltz GK, Nat. Rev. Mol. Cell Biol. 17, 69–82 (2016). [DOI] [PMC free article] [PubMed] [Google Scholar]
- 32.Schuck S, Prinz WA, Thorn KS, Voss C, Walter P, J. Cell Biol. 187, 525–536 (2009). [DOI] [PMC free article] [PubMed] [Google Scholar]
- 33.Asano S, Engel BD, Baumeister W, J. Mol. Biol. 428, 332–343 (2016). [DOI] [PubMed] [Google Scholar]
- 34.Cui-Wang T et al. , Cell 148, 309–321 (2012). [DOI] [PMC free article] [PubMed] [Google Scholar]
- 35.Sanches M et al. , Nat. Commun. 5, 4202 (2014). [DOI] [PMC free article] [PubMed] [Google Scholar]
- 36.Puhka M, Joensuu M, Vihinen H, Belevich I, Jokitalo E, MBoC 23, 2424–2432 (2012). [DOI] [PMC free article] [PubMed] [Google Scholar]
- 37.Shemesh T et al. , Proc. Natl. Acad. Sci. U.S.A. 111, E5243–E5251 (2014). [DOI] [PMC free article] [PubMed] [Google Scholar]
- 38.Tran N-H et al. , Analysis code and quantification for publication “The stress-sensing domain of activated IRE1α forms helical filaments in narrow ER membrane tubes.” Zenodo (2021); 10.5281/zenodo.5030935. [DOI] [PMC free article] [PubMed] [Google Scholar]
Associated Data
This section collects any data citations, data availability statements, or supplementary materials included in this article.
Supplementary Materials
Data Availability Statement
The codes used for analyses are available through Zenodo (38). The subtomogram-averaged maps can be accessed at EMDB (EMD-23058). Raw and processed data, cell lines, and reagents are available upon request.


