

Abstract
To investigate the role of IGF-I signaling in osterix (OSX)-expressing cells in the skeleton, we generated IGF-I receptor (IGF-IR) knockout mice (OSXIGF-IRKO) (floxed-IGF-IR mice × OSX promoter-driven GFP-labeled cre-recombinase [OSXGFPcre]), and monitored postnatal bone development. At day 2 after birth (P2), OSXGFP-cre was highly expressed in the osteoblasts in the bone surface of the metaphysis and in the prehypertrophic chondrocytes (PHCs) and inner layer of perichondral cells (IPCs). From P7, OSXGFP-cre was highly expressed in PHCs, IPCs, cartilage canals (CCs), and osteoblasts (OBs) in the epiphyseal secondary ossification center (SOC), but was only slightly expressed in the OBs in the metaphysis. Compared with the control mice, the IPC proliferation was decreased in the OSXIGF-IRKOs. In these mice, fewer IPCs invaded into the cartilage, resulting in delayed formation of the CC and SOC. Immunohistochemistry indicated a reduction of vessel number and lower expression of VEGF and ephrin B2 in the IPCs and SOC of OSXIGF-IRKOs. Quantitative real-time PCR revealed that the mRNA levels of the matrix degradation markers, MMP-9, 13 and 14, were decreased in the OSXIGF-IRKOs compared with the controls. The OSXIGF-IRKO also showed irregular morphology of the growth plate and less trabecular bone in the tibia and femur from P7 to 7 weeks, accompanied by decreased chondrocyte proliferation, altered chondrocyte differentiation, and decreased osteoblast differentiation. Our data indicate that during postnatal bone development, IGF-I signaling in OSX-expressing IPCs promotes IPC proliferation and cartilage matrix degradation and increases ephrin B2 production to stimulate vascular endothelial growth factor (VEGF) expression and vascularization. These processes are required for normal CC formation in the establishment of the SOC. Moreover, IGF-I signaling in the OSX-expressing PHC is required for growth plate maturation and osteoblast differentiation in the development of the metaphysis.
Keywords: IGF-I RECEPTOR, ENDOCHONDRAL BONE FORMATION, SECONDARY OSSIFICATION CENTER, PERICHONDRIUM, OSTERIX-EXPRESSING CELLS
Introduction
In mammals, almost all bones form by the process of endochondral bone formation, in which a cartilage template is replaced by bone and bone marrow. This process involves the formation of two ossification centers: the primary ossification center (POC) develops within the diaphysis, and the secondary ossification center (SOC) establishes the epiphysis.(1) The POC forms during embryonic bone development (around embryonic day 14 to 15.5 in mice). Hypertrophic chondrocytes at the junction of the growth plate and primary spongiosa direct the mineralization of their surrounding matrix, attract blood vessels through the production of vascular endothelial growth factor (VEGF) and other factors, direct adjacent inner perichondrial cells to become osteoblasts, and form the bone collar.(1) These osteoblasts express osterix.(2) Blood vessels then invade through the bone collar into the hypertrophic cartilage, bringing in osterix-expressing osteoblast progenitors from the perichondrium, which lay down bone matrix to form the POC.(3,4) The SOC forms shortly after birth (around murine postnatal days 5 to 7). The first event in SOC formation is the generation of cartilage canals, beginning as invaginations of the perichondrium. These canals erode the uncalcified hyaline cartilage of the epiphysis, constituting a path for bringing blood vessels and osteoprogenitors to the center of the epiphyseal cartilage.(5) Once in the middle, osteoprogenitors differentiate into osteoblasts, enabling the formation of the SOC that expands centrifugally and progressively replaces epiphyseal cartilage with osseous tissue.(6) Development of the POC and SOC results in the establishment of the growth plate, which is critical for longitudinal bone growth.(7) The formation of the POC and SOC is quite similar, but SOC formation is not preceded by the formation of a bony collar or hypertrophy and mineralization of cartilage as in the formation of the POC.(7,8) The events leading to POC formation during embryonic development have been well investigated, whereas those leading to postnatal SOC formation are not as clearly understood. SOC formation has been suggested to be heavily dependent on matrix metalloproteinase (MMP)-mediated cartilage degradation and VEGF-induced vascularization. These processes are thought to be regulated by multiple signaling pathways like beta-catenin,(9) thyroid hormone,(10) and epidermal growth factor receptor(11) signaling. However, these signaling pathways as well as the systemic and local factors regulating the establishment of the SOC are not clearly identified.
Insulin-like growth factor-I (IGF-I) signaling plays a fundamental role during endochondral bone formation.(12–14) Our previous studies demonstrate that global IGF-1 deletion or inactivation of IGF-I receptor (IGF-IR) in type II collagen (Col.II)-expressing cells (proliferating chondrocytes) delays primary ossification center formation in the axial skeleton in the embryos (E18.5)(15) and neonates (P0)(14) and delayed SOC formation postnatally at 3 weeks.(16) However, the mechanisms responsible for these phenotypes remain imperfectly understood. Because osterix is widely expressed in the cells contributing to endochondral ossification, we used the osterix promoter-driven cre-recombinase to inactive IGF-IR signaling in these cells to analyze the mechanism by which IGF-IR signaling regulates postnatal endochondral bone formation with particular attention on the SOC formation.
Materials and Methods
Animals
The OSXIGF-IRKO mice were developed by breeding floxed-IGF-IR (IGF-IRflox/flox) mice that carry loxP sequences flanking exon 3 of the gene(17) with transgenic mice expressing the GFP-labeled cre recombinase under the control of a osterix (OSX) promoter (OSXGFP-cre) (gift from Dr Andrew McMahon).(18) Littermates not expressing OSXGFP-cre were used as controls. All mice were in FVB-N background and were housed in a barrier facility with a 12-hour light-dark cycle and maintained on standard chow. Skeletons from postnatal 2 days (P2), 7 days (P7), 3 weeks (male only), 7 weeks (male only), and 16 weeks (male only) OSXIGF-IRKO and their control littermates were analyzed. All animal studies were approved by the Animal Use Committee of the San Francisco Veterans Affairs Medical Center, where the animals were raised and studied. Mice were anesthetized with approved anesthetics (Isoflurane) before procedures. For euthanasia, animals were exposed to Isoflurane before cervical dislocation.
Genotyping and determination of tissue-specific deletion of the IGF-1R gene
Genomic DNA was extracted from tail snips and other tissues (bone, heart, liver, kidney, spleen, and lung) of the mice using DNeasy Blood & Tissue Kit (QIAGEN, Germantown, MD, USA). PCR analyses of the DNA were performed to detect OSXGFPcre and floxed-IGF-IR alleles using corresponding primer sets as described previously.(14,18)
Histology
Tibias and femurs were fixed with 4% paraformaldehyde in PBS (4% PFA/PBS) overnight at 4°C and decalcified by 10% EDTA. To determine the GFP expression, decalcified bones were put into 30% sucrose overnight, then embedded in OCT, and cut into 10-µm sections. The sections were counterstained with DAPI and evaluated by fluorescence microscopy. For other histologic measurements, decalcified bones were embedded in paraffin and cut into 5-µm sections. The sections were stained by H&E and Safranin O/Fast Green following the standard procedures or subjected to immunohistochemisty for PCNA (Life Technologies, Grand Island, NY, USA), VEGF (Antibodies-online, Atlanta, GA, USA), MMP-13 (Abcam, Cambridge, MA, USA), CD31 (BD Pharmingen, San Jose, CA, USA), ephrin B2 (Santa Cruz Biotechnology, Inc., Dallas, TX, USA), type II collagen (Col.II), type X collagen (Col.X) and counterstained with hematoxylin. Antigen retrieval (1% hyaluronidase, 37°C, 30 minutes) was utilized for Col.II and Col.X antibodies. Sections from 3 animals of each group were analyzed.
µCT
At 7 weeks, the right femurs and tibias of the controls (n = 4) and KOs (n = 5) were scanned with a SCANCO VivaCT 40 scanner (SCANCO Medical AG, Basserdorf, Switzerland) with 10.5 μm voxel size and 55 kV X-ray energy as described previously.(19,20) One hundred serial cross-sectional scans (1.05 mm) of the secondary spongiosa of the distal femoral metaphysis (for trabecular bone) and the tibiofibular junction (TFJ, for cortical bone) were obtained. Image analysis was performed using software provided by SCANCO.
Bone marrow stromal cell culture
The left tibial and femoral bone marrow stromal cells (BMSCs) were harvested using techniques previously described.(21) Briefly, the bone marrow was flushed from the diaphysis and collected in primary culture medium (alpha modification of Eagle’s medium [α-MEM] containing L-glutamine and nucleosides; Mediatech, Herndon, VA, USA), supplemented with 10% fetal bovine serum (FBS, Atlanta Biologicals, Norcross, GA, USA), 100 U/mL penicillin/streptomycin (Mediatech), 0.25 μg/mL fungizone (Life Technologies, Rockville, MD, USA). A pool of BMSCs from each mouse was plated at 2×10⁶ cells/well in 6-well plates. Nonadherent cells were removed on day 5, and the cells were provided with secondary medium (the primary medium with 3 mM glycerophosphate [Sigma, St. Louis, MO] and 50 μg/mL ascorbic acid [Sigma]) from day 7. BMSC differentiation was evaluated by alkaline phosphatase (AP) positive colony number at day 14 and by calcium nodule formation (Alizarin red staining) at day 21.
Quantitative real-time PCR
Total RNA was extracted from epiphyseal growth plates of the knee (P4) and the tibial shaft (7 weeks, marrow flushed out). The RNA was reverse transcribed into cDNA as previously described.(13,22) Expression of IGF-IR, chondrocyte differentiation markers type II collagen (Col.II), type X collagen (Col.X), Indian Hedgehog (Ihh), and osterix (OSX), matrix metalloproteinases (MMP) MMP-9, −13, and −14, and osteoblast differentiation markers RUNX2, AP, and osteocalcin (OCN) was determined by quantitative real-time PCR using custom-made (Supplemental Table S1) or commercial (Life Technologies) primers and probes as described in previous reports.(13,21)
Statistics
Results were presented as mean ± SD and compared using unpaired Student’s t test. Significance was assigned for p < 0.05. Samples of at least 3 animals were analyzed for each experimental and control group.
Results
Osterix expression and deletion of IGF-IR during postnatal bone development
Osterix expression was traced by OSXGFP (Fig. 1A). At P2, OSXGFP (green dots) was strongly expressed in the prehypertrophic zone (PHZ) (Fig. 1A, A1), inner osteoprogenitor layer of perichondrium (IPC) closer to the growth plate (but not in the outer fibrous layer of perichondrium) (Fig. 1A, A1), and trabecular bone surface in the primary and secondary spongiosa (Fig. 1A, A1). At 1 week, OSXGFP was expressed in the same pattern as P2 but was decreased in the trabecular bone surface (Fig. 1B). At 3 weeks, OSXGFP appeared in the epiphysis (secondary ossification center, SOC) (Fig. 1C), continued to be expressed in the PHZ (Supplemental Fig. S1A) and inner layer of perichondrium (Supplemental Fig. S1B), but the OSXGFP expression in the trabecular bone surface was nearly gone (Supplemental Fig. S1C). At 7 weeks, OSXGFP was mainly expressed in the PHZ and osteocytes in the SOC and cortical bones, with little expression in the perichondrium and bone surface (Supplemental Fig. S1D). At 16 weeks, few OSXGFP-positive cells were observed in the PHZ (Supplemental Fig. S1). Deletion of IGF-IR by OSXGFP-cre in mice (OSXIGF-IRKO) was determined by immunohistochemistry using the antibody against IGF-IR (Fig. 1D–I). At 3 weeks, IGF-IR (brown) was expressed in the proliferating zone and PHZ in growth plate of the controls (Fig. 1D), whereas the expression was blunted in the PHZ, but not in the proliferating zone, of the growth plate of the OSXIGF-IRKOs (Fig. 1E). In particular, the expression of IGF-IR was abolished in the SOC (Fig. 1G versus F) and perichondrium (Fig. 1I versus H) of the OSXIGF-IRKO when compared with the controls (Fig. 1F, H). Real-time PCR analyses confirmed the profound reduction (by >50%) in IGF-IR expression in KOs versus controls (J). Specificity of gene excision in the OSXIGF-IRKO mice was confirmed by PCR analyses of genomic DNAs from different tissues with primers flanking exon 3 of IGF-1R gene. Gene excision (∆-IGF-1R) occurred only in bone tissue from the OSXIGF-IRKO mice, but not in other tissues from the same animals or in bone tissue from the control (Con) mice (Fig. 1K). These data indicate that in the KO mice, IGF-IR was specifically deleted in the osterix-expressing cells.
Fig. 1.
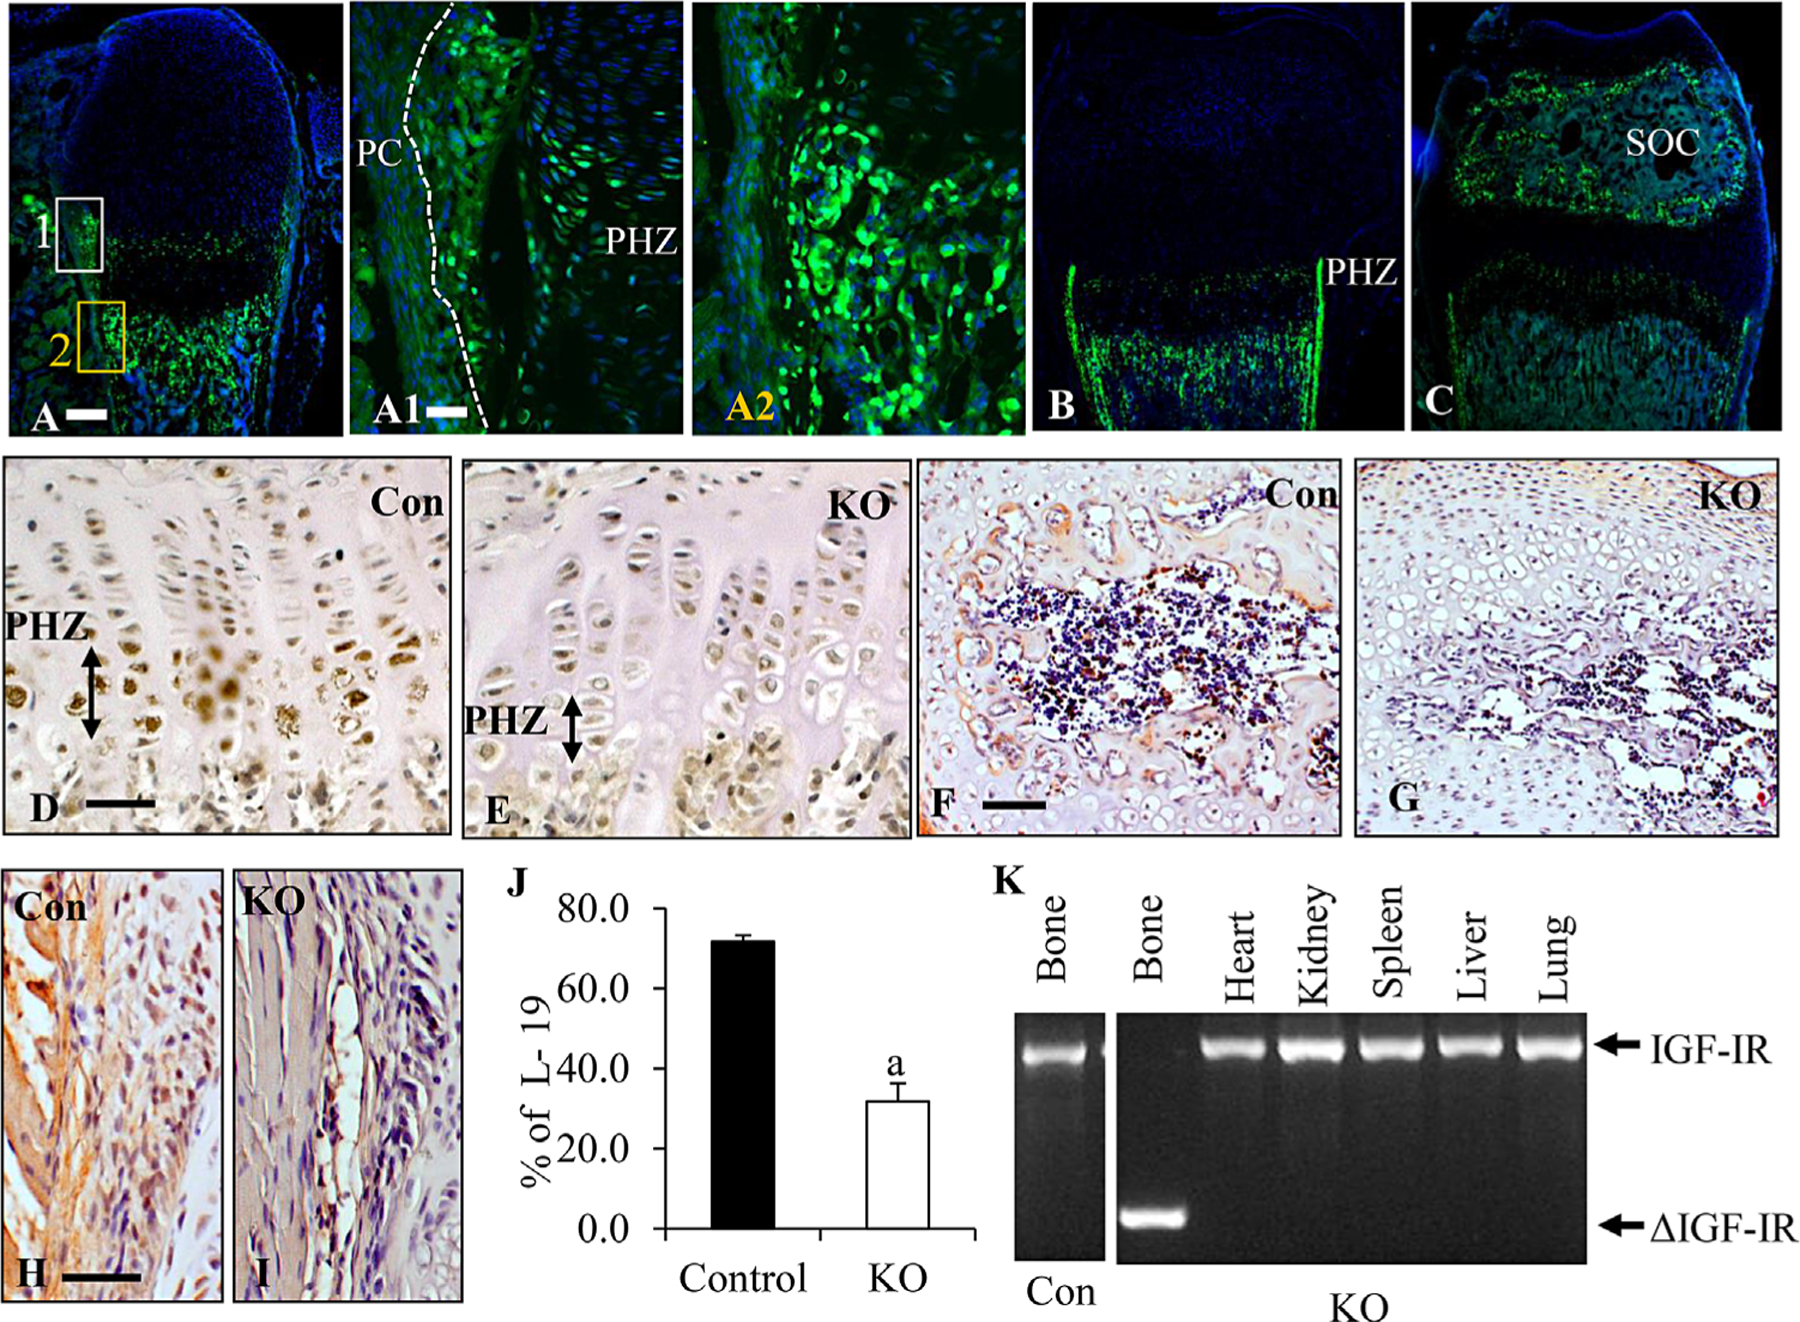
Postnatal osterix expression and ablation of IGF-IR in the OSXIGF-IRKO mice. (A–C) Osterix (OSX)-GFP (green dots) expressed in the prehypertrophic zone (PHZ), inner layer of perichondrium (IPC, separated from the outer layers by a white dotted line) and trabecular bone surface at P2 (A); the expression decreased with age at 1 week (B). At 2 to 3 weeks (C), expression was found in the epiphysis (SOC). (A1–2) High magnification of box 1 (white) and box 2 (orange) in A. Green: osx-GFP; blue: DAPI. 5× in A, B, and C; scale bar = 100 μm. 10× in A1–2; scale bar = 50 μm. (D–I) Immunohistochemistry for the expression of IGF-IR (brown) in tibial growth plates (D, E), SOC (F, G), and PC (H, I) of IGF-IRKOs (KO, E, G, I) and controls (Con, D, F, H). Signals were detected by brown DAB stain, and bone sections were counterstained with hematoxylin. 10× in F and G, 20× in the rest; scale bars = 50 μm. (J) mRNA levels of IGF-IR in cartilage (growth plate knee) of KOs (open bar, n = 6) and Cons (solid bar, n = 4) were determined by QPCR. Results are expressed as mean ± SD. a: p < 0.05 KO versus Con. (K) PCR analyses of genomic DNA extracted from different tissues from the KOs and Cons with primers amplifying the excised region (ΔIGF-IR).
Deletion of IGF-IR by osterix cre induced growth retardation during postnatal development
To monitor the growth of OSXIGF-IRKO during postnatal development, we measured the body weight and bone length of these mice compared with the control littermates from P2 to 16 weeks after birth. The OSXIGF-IRKO mice were viable at birth and showed no apparent growth defects for the first 2 days (Fig. 2A graph). Then the mice developed dwarfism, characterized by smaller body size and shorter limbs. Body weight of the OSXIGF-IRKO decreased to 58% (1W), 51% (3W), 54% (7W), and 57% (16W) of the control mice (Fig. 2A). At 7W, femur length (Fig. 2B) and tibia length (Fig. 2C) of the OSXIGF-IRKOs were decreased to 69% and 72% of the control, respectively, indicating that IGF-IR in osterix-expressing cells is required for postnatal bone growth. Mice expressing the OSXGFP-cre per se did not show this phenotype.
Fig. 2.

Growth retardation in the OSXIGF-IR knockout mice in postnatal development. Body weights (A), femur length (B, 7 weeks), and tibia length (C, 7 weeks) of the OSXIGF-IRKO mice (KO) were significantly lower when compared with the control (Con) mice. Representative pictures show body size (A), femur length (B), and tibia length (C) of 7-week-old Cons and KOs. a: p < 0.05 KO versus Con. Scale bar = 1 cm in A; 2 mm in B and C. At least 4 animals in each group for all ages.
Deletion of IGF-IR in osterix-expressing cells induced abnormal skeletal morphology
H&E staining and Safranin O staining were performed to examine skeletal morphology. At P2, compared with the control tibias (5316.3 ± 52.3 μm, n = 4), the length of the OSXIGF-IRKO tibias (4601.3 ± 339.1 μm, n = 5) was significantly shorter (p < 0.05), although the length of the femurs in the two groups was comparable (4121.9 ± 133.5 μm in control versus 4088.4 ± 302 μm in KO, p 0.87). As shown in Figure 3, in the tibia, the proliferating zone was shorter (421.79 ± 16.68 μm in the controls versus 325.63 ± 30.59 μm in the KOs, p < 0.05), but the hypertrophic zone was longer (234.49 ± 12.16 μm in the controls versus 319.69 ± 40.26 μm in the KOs, p < 0.05) in the OSXIGF-IRKOs (A2, A4, Supplemental Fig. S2B) compared with the controls (A1, A3, Supplemental Fig. S2A), whereas the resting zones in the two groups were comparable (Supplemental Fig. S2B versus A). At this time, only cartilaginous tissue was found in the proximal epiphysis of the tibia in the OSXIGF-IRKO and their control littermates. In both mice, the perichondrium at the top of the epiphysis was getting thicker (Fig. 3A1–4, Supplemental Fig. S2), and small invaginations of the thickened perichondrium were observed. In the controls, but not in the OSXIGF-IRKO, the invaginations of the perichondrium invaded into the cartilage (arrows, Fig. 3A1, 3 versus Fig. 3A2, 4, Supplemental Fig. S2C, E versus Supplemental Fig. S2D, F). In the primary and secondary spongiosa, the ratio of cartilage remnants (red) to total bone (red + green) was increased in the OSXIGF-IRKO (65%) compared with the controls (46%), although no difference in the total bone area in the two groups was observed (Supplemental Fig. S2G versus H). At P7, in both mice (Fig. 3B1–4), invaginations of the perichondrium invaded into the surrounding cartilage matrix and began to form the cartilage canals (CC, arrows), but the CCs formed in the OSXIGF-IRKOs (Fig. 3B2, Fig. 3B4, B4SOC) were smaller than those in the controls (Fig. 3B1, Fig. B3, B3SOC). The SOC was formed at this time in both mice (Fig. 3B1–4, B3SOC, B4SOC), but in the OSXIGF-IRKO mice the SOC was smaller with more cartilage remnants and less bone tissue compared with the control mice. Different from P2, the hypertrophic zone of the OSXIGF-IRKO growth plate (Fig. 3B2, B2GP) was shortened when compared with the controls (322.31 ± 49.72 μm in the control versus 190.19 ± 21.10 μm in the KO, p < 0.05) (Fig. 3B1, B1GP), but the proliferating zone was comparable in the two groups (307.07 ± 25.29 μm in the control versus 329.41 ± 10.71 μm in the KO) (Fig. 3 B1, B1GP versus B2, B2GP). The OSXIGF-IRKO mice had less trabecular bone with more cartilage remnants in the secondary spongiosa (Fig. 3B4Tb) than those in the control mice (42% in the control versus 24% in the KO) (Fig. 3B3Tb). At P21 (Fig. 3C1–4), in both mice, canals excavated into the center of the cartilage generating the marrow space forming the SOC, but a smaller marrow space, less bone matrix, and more cartilage remnant were observed in the OSXIGF-IRKOs (Fig. 3C2, 4) compared with the controls (Fig. 3C1, 3). The growth plates were getting thinner in both mice because of the SOC formation by P21. Similar to P7, the hypertrophic zone was shorter in the OSXIGF-IRKOs compared with the controls, whereas the proliferating zones were comparable (Supplemental Fig. S2H, J). These data indicate a delay in SOC formation, abnormal growth plate morphology, and less trabecular bone formation in the OSXIGF-IRKOs.
Fig. 3.

Abnormal skeletal morphology in the OSXIGF-IR knockout mice during postnatal development. H&E staining (left 2 columns) and Safranin O staining (right 2 columns) of tibias from control and OSXIGF-IRKO (KO) mice at P2 (A1–4), P7 (B1–4), and P21 (C1–4). High magnification of B1–4 of growth plate (GP), secondary ossification center (SOC), and trabecular bone (Tb) are shown in B1–4. Arrows indicate invaginations of perichondrium (A1 and A3) or cartilage canals (B1–4). RZ = resting zone; PZ = proliferating zone; HZ = hypertrophic zone. 5× in all pictures; scale bars = 100 μm.
Previous studies have reported that the OSXGFP-cre transgene causes lower body weight, delayed cortical bone expansion and accrual, and craniofacial bone development defects. The trabecular bone is unaffected as is osteoblast differentiation.(23,24) To confirm that the defects in the KOs described in this article were not caused by the OSXGFP-cre itself, we determined the phenotype of the OSXGFP-cre mice with the particular attention to the growth plate morphology. Consistent with the previous studies, OSXGFP-cre mice had lower body weight (72% of the controls) and shorter bones (tibias and femurs were 88% and 92% of the control, respectively). However, at P7, H&E staining revealed that no differences in SOC formation in the OSXGFP-cre mice compared with the controls (Supplemental Fig. S3B versus A). The proliferating zone and the hypertrophic zone were both shorter, but not significantly so, in the OSXGFP-cre mice compared with the controls (Supplemental Fig. S3C–E). These data indicate that the defects in the KOs described in this article were owing primarily to the deletion of IGF-IR, not the OSXGFP-cre transgene.
IGF-IR in osterix-expressing cells regulates chondrocyte differentiation
To investigate how IGF-IR signaling in osterix-expressing cells regulates postnatal bone development, we determined chondrocyte proliferation and differentiation by immunohistochemistry in 3-week-old (P21) OSXIGF-IRKOs and littermate controls. Compared with the control mice (Supplemental Fig. S4A), the number of PCNA-positive cells in the proliferating zone of the growth plate was significantly decreased in the OSXIGF-IRKO mice (Supplemental Fig. S4B). In the growth plate of the controls, osterix (Supplemental Fig. S4C) was mainly expressed in the maturing chondrocytes (prehypertrophic chondrocytes and hypertrophic chondrocytes), with less expression in the proliferating chondrocytes. VEGF was expressed in both proliferating and hypertrophic chondrocytes (Supplemental Fig. S4E), type II collagen (Supplemental Fig. S4G), and type X collagen (Supplemental Fig. S4I) were expressed mainly in the proliferating chondrocytes and hypertrophic chondrocytes, respectively. However, in the OSXIGF-IRKO, the expression of osterix (Supplemental Fig. S4D), VEGF (Supplemental Fig. S4F), and type X collagen (Supplemental Fig. S4J) was dramatically decreased, whereas the expression of type II collagen was increased (Supplemental Fig. S4H). Consistent with these results, quantitative real-time PCR showed that at P4, in the knee, the mRNA levels of osterix, type X collagen, and Indian Hedghog (Ihh) were decreased, whereas the mRNA level of type II collagen was increased (Supplemental Fig. S4K). These data indicate that deletion of IGF-IR in osterix-expressing cells decreased chondrocyte proliferation, delayed chondrocyte differentiation, maturation, and impaired VEGF production.
Deletion of IGF-IR in the osterix-expressing cells delayed secondary ossification center formation by impairing cartilage canal formation
One striking phenotype of the OSXIGF-IRKOs is delayed SOC formation. We determined the cartilage canal formation at P2 to P7 in the OSXIGF-IRKO and controls. Analysis of the histological sections revealed differences in the perichondrium morphology between these mice. In the controls, at P2, the perichondrium differentiated into an inner region with well-organized cuboidal cells contrasting with an outer region with elongated cells (Supplemental Fig. S5A, E) forming the bone collar (Supplemental Fig. S5C, G). In contrast, in the OSXIGF-IRKOs, the cells in both regions of the perichondrium were disorganized (Supplemental Fig. S5B, F) and formed a thinner bone collar (Supplemental Fig. S5D, H). PCNA IHC showed fewer PCNA-positive cells in the inner layer of perichondrium in the OSXIGF-IRKO (Supplemental Fig. S6B) than in the control (Supplemental Fig. S6A), indicating decreased proliferation. The decreased cell proliferation was also observed in the thickened perichondrium at the top of the tibia in the OSXIGF-IRKO (Supplemental Fig. S6D) compared with the control (Supplemental Fig. S6C) where the cartilage canals will subsequently form, indicating that deletion of IGF-IR in the perichondrium impaired perichondrial cell growth and differentiation. At P7, the morphological distinction of the layers of the perichondrium became more pronounced, with the inner layer getting thicker and containing more cuboidal cells, and the outer layer becoming thinner and more fibrous, containing fewer and more elongated cells (Supplemental Fig. S7A). These changes were not found in the OSXIGF-IRKO (Supplemental Fig. S7B). The cells in the inner layer of the perichondrium produced MMP-13 in both mice, but MMP-13 production in the OSXIGF-IRKO (brown, Supplemental Fig. S7D) was less than in the control mice (Supplemental Fig. S7C). At these same time points, the vascular compartments were revealed by H&E staining (Arrows, Supplemental Fig. S7A) and immunohistochemistry of CD31 (Supplemental Fig. S7E) in the inner layers of perichondrium of the controls, but fewer vessels appeared in the OSXIGF-IRKOs (Supplemental Fig. S7B, F). Furthermore, the expression of ephrin B2, a regulator of vessel formation whose expression is induced by IGF-I, was decreased in the inner layer of the perichondrium of the OSXIGF-IRKO (Supplemental Fig. S7H) compared with that in the control (Supplemental Fig. S7G). Thus IGF-IR in the osterix-expressing cells appears necessary for expression of matrix degrading enzymes and vessel formation in the perichondrium. In addition at P7, cartilage canals were forming at the top end of the long bones (Fig. 3B1–4). OSXGFP demonstrated the invasion of osterix-expressing cells into the cartilage canals from the perichondrium (Fig. 4A, green dots). The OSXIGF-IRKO (Fig. 4B) formed fewer canals with fewer OSX-expressing cells inside the canals. H&E staining indicated that the cartilage canals formed in the OSXIGF-IRKO mice (Fig. 4D) were smaller in size, with fewer vessels when compared with the control mice (Fig. 4C). Immunohistochemistry using an antibody against VEGF demonstrated that VEGF-expressing vessels were fewer in the 0SXIGF-IRKO (Fig. 4F) compared with the control (Fig. 4E). Matrix metalloproteinases-13 (MMP-13), which promotes cartilage degradation to form cartilage canals, was expressed in the cells inside cartilage canals, chondrocytes, and cartilage matrix in the SOC of the controls (Fig. 4G), but its expression was decreased in the OSXIGF-IRKOs (Fig. 4H). QPCR showed that the mRNA levels of three matrix metalloproteinases—MMP-9 (50%), MMP-13 (59%), and MMP-14 (58%)—were significantly decreased in the OSXIGF-IRKO compared with control (Fig. 4I). These data indicate that deletion of IGF-IR in the osterix-expressing cells decreased matrix metalloproteinase production, vascular invasion, and osteoprogenitor migration into the cartilage canals, blunting their formation and reducing SOC development.
Fig. 4.

Deletion of IGF-IR in the osterix-expressing cells impaired cartilage canal (CC) formation. At P7, GFP (green dots in A and B) indicated that osterix-expressing cells (green dots) invaded into the cartilage and formed cartilage canals (CC, arrows) in the OSXIGF-IRKO (KO, B) and controls (A). H&E staining showed smaller CC (black arrows) with fewer vessels (white arrows) in the KO (D) compared with the control (C). IHC showed that compared with the controls (E), the VEGF (brown)-expressing vessels (arrows) were dramatically decreased in the CC in the KOs (F). Similarly, the expression of MMP-13 (brown) was decreased in the CC (arrows), chondrocytes, and matrix in the SOC in the KOs (H) compared with the controls (G). 20× in A–F, 10× in G, H. Scale bars = 50 μm. QPCR showed that mRNA levels of MMP-9, −13, and −14 were significantly decreased in the KOs (open bars) compared with the controls (solid bars). Results are expressed as mean ± SD. a: p < 0.05 KO versus control.
Effects of deletion of IGF-IR in osterix-expressing cells on trabecular bone volume, bone structure, osteoblast proliferation, and differentiation
To evaluate the role of IGF-IR in osterix-expressing cells on bone, we measured trabecular bone volume and structure of 7-week-old OSXIGF-IRKOs and controls. H&E staining (Supplemental Fig. S8A, B) and Von Kossa staining (Supplemental Fig. S8C, D) showed less trabecular bone in the OSXIGF-IRKOs (Supplemental Fig. S8B, D) compared with the controls (Supplemental Fig. S8A, C). μCT measurements (Fig. 5A) revealed that trabecular bone volume (BV/TV) was significantly decreased by 48% in the OSXIGF-IRKOs compared with the controls. This was because of the decreased trabecular bone number (Tb.N, 14%) and thickness (Tb.Th, 13%). In addition, cortical thickness (Cort. Th) tended to be decreased in the OSXIGF-IRKOs (15%, p=0.056) compared with the controls. Osteoblast proliferation was analyzed by immunohistochemistry using a PCNA antibody. The number of PCNA-positive cells was significantly reduced in the OSXIGF-IRKOs (Supplemental Fig. S8F) than in the controls (Supplemental Fig. S8E). To evaluate the effects of deletion of IGF-IR in osterixexpressing cells on osteoblast differentiation, we cultured bone marrow stromal cells (BMSCs) from the controls and the OSXIGF-IRKOs (7 weeks). As shown in Fig. 5B, compared with the cultures from the controls, the number of alkaline phosphate (AP)-positive colonies (D14) and mineralized nodules (D21, indicated by alizarin red staining) were dramatically decreased in the cultures from the OSXIGF-IRKOs. QPCR (Fig. 5C) showed that the mRNA (from bones, marrow flushed out) levels of RUNX2, AP, and OCN were decreased by 53%, 59%, and 40%, respectively, compared with the controls. These data indicate that IGF-IR in the osterix-expressing cells is required for both osteoblast proliferation and differentiation to maintain normal bone volume and structure.
Fig. 5.
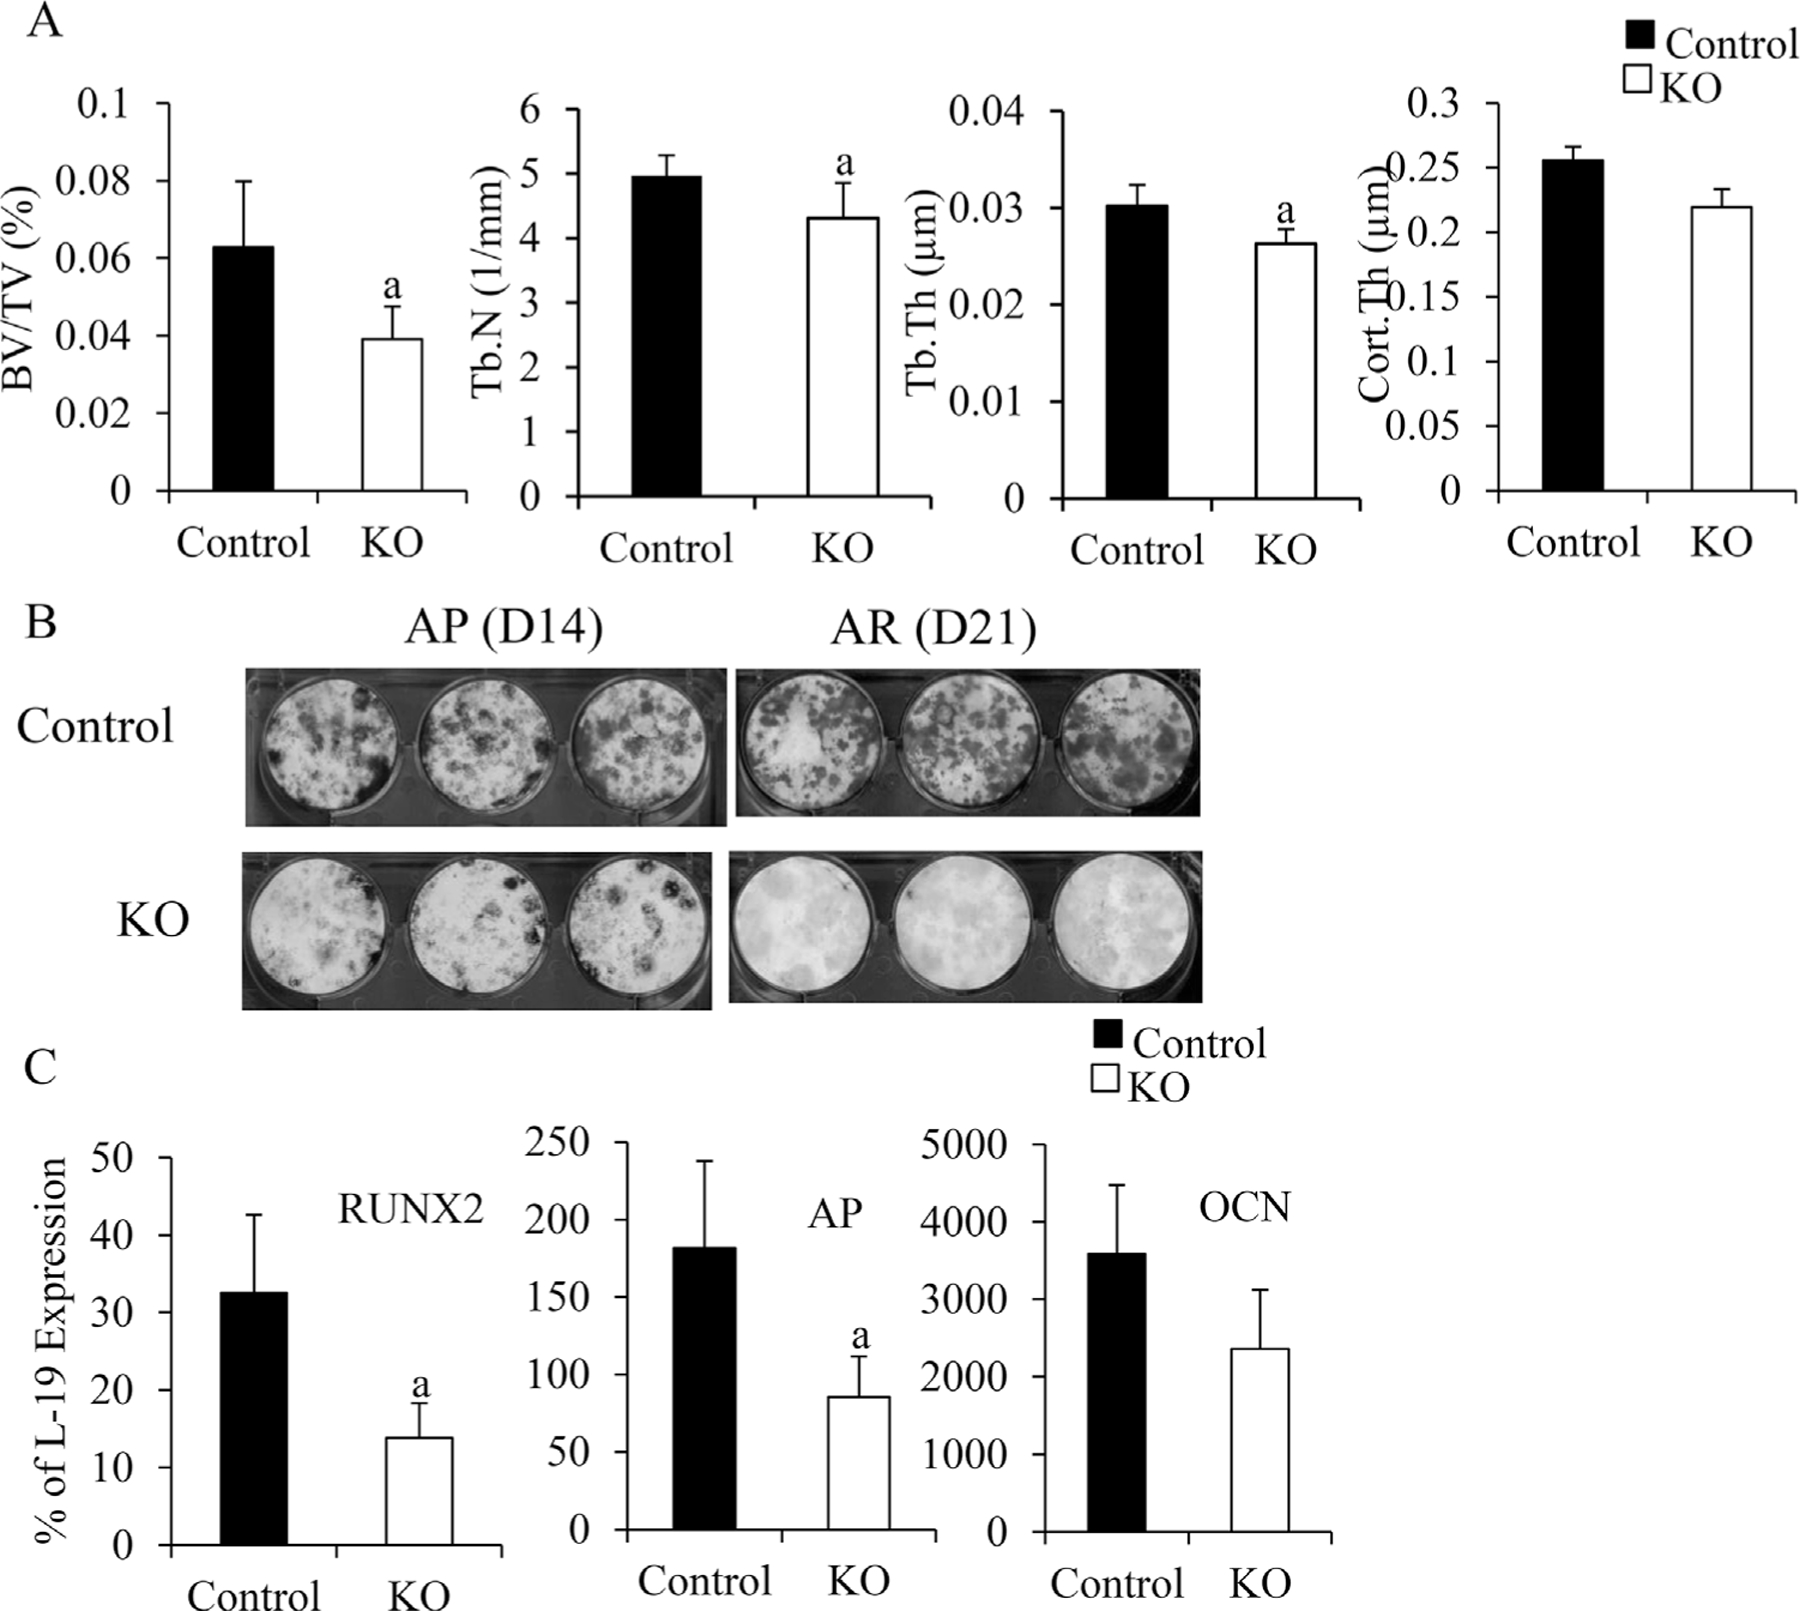
The effects of deletion of IGF-IR in the osterix-expressing cells on bone. At 7 weeks, bone structure of the KO (open bars) and control (solid bars) were determined by μCT (A), n = 4 in control group, n = 5 in KO group. Osteoblast differentiation (B) was examined by bone marrow stromal cell culture at D14 (AP staining) and D21 (alizarin red [AR] staining of mineralized nodules). RNA was isolated from the bones (marrow flushed out). mRNA levels of osteoblast differentiation markers RUNX2, AP, and osteocalcin (OCN) were measured by QPCR (C). In A and C, results are expressed by means SD. ± a: p < 0.05 KO versus control.
Discussion
In the current study, we demonstrate that after birth, perichondrial osterix-expressing osteoprogenitors lay down the bone surface in the SOC through cartilage canals. Deletion of IGF-IR in the osterix-lineage cells impairs growth plate, SOC, and trabecular bone formation. These results contribute to our knowledge that IGF-I signaling critically regulates ossification in postnatal bones.
Previous lineage-tracing studies demonstrate that during embryonic development, subsets of perichondrial osterix–expressing osteoprogenitors comigrate with the blood vessels moving from the perichondrium to the inside of the shaft to initiate the nascent primary ossification center.(2,3) Some of these cells and their progeny differentiate into mature bone-forming osteoblasts that contribute to trabecular bone formation.(25) Postnatally, osterix-positive cells are present in both primary and secondary ossification centers, as well as along the cortical bone surfaces.(26,27) The origin of the cells that occupy the SOC to form the trabecular bone within the SOC has been uncertain. Our present results address this question. We show that during postnatal bone development, in SOC formation, osterix-expressing perichondrial osteoprogenitors invade into the epiphyseal cartilage via cartilage canals invaginating from the perichondrium, and lay down the bone surface. The appearance of osterix-expressing cells in the SOC occur as their numbers in the POC are declining, but in each case these cells are involved in ossification in both POC and SOC.
During SOC formation, cleavage of the components of the cartilage extracellular matrix (ECM) is a necessary step for clearing a path for cartilage canal formation, vascular invasion, and the migration of osteoprogenitors into the epiphysis.(28) Previous studies demonstrated that MMPs, notably MMP-9, MMP-13, and MMP-14, play critical roles for degrading cartilage ECM to enable cartilage canal formation during SOC progression,(28–31) These MMPs are expressed simultaneously at discrete locations in the perichondrium that become sites of canal formation and then are expressed abundantly at the leading edges of the canals and at the expanding borders of the marrow space in the epiphyseal region during SOC development.(8,11) IGF-I/IGF-IR has been reported to be a key regulator of MMPs by in vitro experiments.(32–35) Our present results showed that the OSXIGF-IRKO mice formed smaller and fewer cartilage canals accompanied by reduced production of MMP-9, −13, and −14 in the epiphyseal cartilage, perichondrium, and cartilage canals.
Invasion of blood vessels is an important step for epiphyseal development, and this process is tightly regulated by VEGF.(36,37) Formation and advancement of the vascularized cartilage canals into the epiphysis is triggered by VEGF that is expressed in the chondrocytes adjacent to the cartilage canals. Soluble VEGF isoforms diffuse throughout the perichondrium and stimulate outgrowth of the epiphyseal vascular network and subsequent vascular invasion preceding secondary ossification.(36,37) The expression of VEGF further leads to the establishment of the SOC and its large marrow cavity.(37) It has been demonstrated that IGF-IR signaling affects VEGF expression in some types of tumors.(38,39) Furthermore, it has been shown that IGF-I treatment activates downstream PI3 kinase and MAP kinase pathways, leading to stabilization of intracellular HIF1a, which in turn upregulates transcription of VEGF in an embryonic stem cell embryoid body model.(40) The OSXIGF-IRKOs showed defects in epiphyseal SOC characterized by fewer vessels and smaller marrow cavities in the SOC. Several processes caused these defects. First, deletion of IGF-IR in the osterix-expressing cells decreased ephrin B2, a VEGF regulator,(41) in hypertrophic chondrocytes and perichondrium, reducing the production of VEGF from these cells. Second, decreased VEGF diffusing into the perichondrium impaired vessel formation around the perichondrium. Third, because of the impaired cartilage degradation, cartilage canals could not form properly to provide a path for the vessels, osteoprogenitors, and osteoclasts to enable them to establish the SOC and create a vascularized bone marrow cavity within the epiphysis.
Osterix is expressed in the prehypertrophic chondrocytes of the growth plate(41–43) where the proliferative program switches to a mature phenotypic program promoting osteogenesis from cells originating in the perichondrium.(44) During postnatal bone development, the OSXIGF-IRKOs developed similar growth plate defects as the CartIGF-IRKO mice (deletion of IGF-IR by Col.II promoter-driven cre) but with several differences. Deletion of IGF-IR in Col.II-expressing cells impairs the sequential processes of both chondrocyte proliferation and differentiation,(14) whereas deletion of IGF-IR in the prehypertrophic chondrocytes resulted in decreased chondrocyte proliferation (fewer PCNA-positive cells) but resulted in increased Col.II expression and decreased Col.X expression, suggesting that IGF-IR in the prehypertrophic chondrocytes is required for the switch from chondrocyte proliferation to differentiation during postnatal growth plate development. Prehypertrophic chondrocytes produce both osterix and Ihh. Osterix(42,43) promotes chondrocyte proliferation and differentiation, whereas Ihh stimulates chondrocyte hypertrophy independent of PTHrP during postnatal bone development.(45) In addition, VEGF produced by chondrocytes not only stimulates vascularization but promotes chondrocyte differentiation.(37) Deletion of IGF-IR in prehypertrophic chondrocytes inhibited osterix, Ihh, and VEGF production, likely contributing to the decreased chondrocyte differentiation. Furthermore, decreased Ihh may affect the resting chondrocytes to reduce the pace of chondrocyte proliferation.
In previous studies, we and others demonstrated that deletion of IGF-IR in mature osteoblasts (osteocalcin-expressing cells) decreased the later stages of osteoblast differentiation, as indicated by decreased osteocalcin expression and mineralizaed nodule formation but with normal RUNX2 and AP expression and AP-positive colony formation.(21,46) Deletion of IGF-IR in the osterix-expressing cells decreased the early stages of osteoblast differentiation, as indicated by decreased RUNX2 and AP expression, as well as AP-positive colony formation and matrix production. In addition, deletion of IGF-IR in the osterix-expressing cells decreased the proliferation of osteoblasts. The impaired osteoblast proliferation and differentiation led to trabecular bone loss and undermineralization. Thus, IGF-IR signaling in the perichondrial osterix-expressing cells stimulates osteoblast proliferation, differentiation, and matrix production required for POC formation and the development of the metaphysis.
In summary, our data indicate that during postnatal bone development, IGF-I signaling in perichondrial OSX-expressing cells promotes cartilage matrix degradation and increases ephrin B2 production to stimulate VEGF expression and vascularization. These processes are required for normal cartilage canal formation in the establishment of the SOC. IGF-I signaling in prehypertrophic chondrocytes is required for sequential chondrocyte proliferation and differentiation process for growth plate establishment, as well as longitudinal bone growth. Finally, IGF-I signaling stimulates osteoblast proliferation and differentiation required for the development and maintenance of bone mass in the metaphysis and diaphysis.
Supplementary Material
Acknowledgments
We thank for Dr Andrew P McMahon for providing the osterix-GFP Cre mice. This work was supported by NIH grants RO1 AR055924, DK 054793 (DB) and by the Department of Veteran Affairs Research Enhancement Award Program in Bone Disease and Merit Review Grants (DB).
Footnotes
Additional Supporting Information may be found in the online version of this article.
Disclosures
All authors state that they have no conflicts of interest.
References
- 1.Kronenberg HM. Developmental regulation of the growth plate. Nature 2003;423(6937):332–6. [DOI] [PubMed] [Google Scholar]
- 2.Long F. Building strong bones: molecular regulation of the osteoblast lineage. Nat Rev Mol Cell Biol 2012;13(1):27–38. [DOI] [PubMed] [Google Scholar]
- 3.Maes C, Kobayashi T, Selig MK, et al. Osteoblast precursors, but not mature osteoblasts, move into developing and fractured bones along with invading blood vessels. Dev Cell 2010;19(2):329–44. [DOI] [PMC free article] [PubMed] [Google Scholar]
- 4.Yang L, Tsang KY, Tang HC, Chan D, Cheah KS. Hypertrophic chondrocytes can become osteoblasts and osteocytes in endochondral bone formation. Proc Natl Acad Sci USA 2014;111(33):12097–02. [DOI] [PMC free article] [PubMed] [Google Scholar]
- 5.Alvarez J, Costales L, Lopez-Muniz A, Lopez JM. Chondrocytes are released as viable cells during cartilage resorption associated with the formation of intrachondral canals in the rat tibial epiphysis. Cell Tissue Res 2005;320(3):501–7. [DOI] [PubMed] [Google Scholar]
- 6.Ganey TM, Love SM, Ogden JA. Development of vascularization in the chondroepiphysis of the rabbit. J Orthop Res 1992;10(4):496–510. [DOI] [PubMed] [Google Scholar]
- 7.Blumer MJ, Longato S, Fritsch H. Structure, formation and role of cartilage canals in the developing bone. Ann Anat 2008;190(4): 305–15. [DOI] [PubMed] [Google Scholar]
- 8.Alvarez J, Costales L, Serra R, Balbin M, Lopez JM. Expression patterns of matrix metalloproteinases and vascular endothelial growth factor during epiphyseal ossification. J Bone Miner Res 2005; 20(6):1011–21. [DOI] [PubMed] [Google Scholar]
- 9.Dao DY, Jonason JH, Zhang Y, et al. Cartilage-specific beta-catenin signaling regulates chondrocyte maturation, generation of ossification centers, and perichondrial bone formation during skeletal development. J Bone Miner Res 2012;27(8):1680–94. [DOI] [PMC free article] [PubMed] [Google Scholar]
- 10.Xing W, Cheng S, Wergedal J, Mohan S. Epiphyseal chondrocyte secondary ossification centers require thyroid hormone activation of Indian hedgehog and osterix signaling. J Bone Miner Res 2014;29(10):2262–75. [DOI] [PMC free article] [PubMed] [Google Scholar]
- 11.Zhang X, Zhu J, Li Y, et al. Epidermal growth factor receptor (EGFR) signaling regulates epiphyseal cartilage development through beta-catenin-dependent and -independent pathways. J Biol Chem 2013;288(45):32229–40. [DOI] [PMC free article] [PubMed] [Google Scholar]
- 12.Liu JP, Baker J, Perkins AS, Robertson EJ, Efstratiadis A. Mice carrying null mutations of the genes encoding insulin-like growth factor I (Igf-1) and type 1 IGF receptor (Igf1r). Cell 1993;75(1): 59–72. [PubMed] [Google Scholar]
- 13.Wang Y, Nishida S, Sakata T, et al. Insulin-like growth factor-I is essential for embryonic bone development. Endocrinology 2006;147(10):4753–61. [DOI] [PMC free article] [PubMed] [Google Scholar]
- 14.Wang Y, Cheng Z, Elalieh HZ, et al. IGF-1R signaling in chondrocytes modulates growth plate development by interacting with the PTHrP/Ihh pathway. J Bone Miner Res 2011;26(7):1437–46. [DOI] [PMC free article] [PubMed] [Google Scholar]
- 15.Wang L, Hinoi E, Takemori A, Nakamichi N, Yoneda Y. Glutamate inhibits chondral mineralization through apoptotic cell death mediated by retrograde operation of the cystine/glutamate antiporter. J Biol Chem 2006;281(34):24553–65. [DOI] [PubMed] [Google Scholar]
- 16.Wang Y, Menendez A, Fong C, ElAlieh HZ, Chang W, Bikle DD. Ephrin B2/EphB4 mediates the actions of IGF-I signaling in regulating endochondral bone formation. J Bone Miner Res 2014;29(8): 1900–13. [DOI] [PMC free article] [PubMed] [Google Scholar]
- 17.Dietrich P, Dragatsis I, Xuan S, Zeitlin S, Efstratiadis A. Conditional mutagenesis in mice with heat shock promoter-driven cre transgenes. Mamm Genome 2000;11(3):196–205. [DOI] [PubMed] [Google Scholar]
- 18.Rodda SJ, McMahon AP. Distinct roles for Hedgehog and canonical Wnt signaling in specification, differentiation and maintenance of osteoblast progenitors. Development 2006;133(16):3231–44. [DOI] [PubMed] [Google Scholar]
- 19.Cheng Z, Liang N, Chen TH, et al. Sex and age modify biochemical and skeletal manifestations of chronic hyperparathyroidism by altering target organ responses to Ca2+and parathyroid hormone in mice. J Bone Miner Res 2013;28(5):1087–100. [DOI] [PMC free article] [PubMed] [Google Scholar]
- 20.Bouxsein ML, Boyd SK, Christiansen BA, Guldberg RE, Jepsen KJ, Muller R. Guidelines for assessment of bone microstructure in rodents using micro-computed tomography. J Bone Miner Res 2010;25(7):1468–86. [DOI] [PubMed] [Google Scholar]
- 21.Wang Y, Nishida S, Boudignon BM, et al. IGF-I receptor is required for the anabolic actions of parathyroid hormone on bone. J Bone Miner Res 2007;22(9):1329–37. [DOI] [PMC free article] [PubMed] [Google Scholar]
- 22.Bikle DD, Sakata T, Leary C, et al. Insulin-like growth factor I is required for the anabolic actions of parathyroid hormone on mouse bone. J Bone Miner Res 2002;17(9):1570–8. [DOI] [PubMed] [Google Scholar]
- 23.Davey RA, Clarke MV, Sastra S, et al. Decreased body weight in young Osterix-Cre transgenic mice results in delayed cortical bone expansion and accrual. Transgenic Res 2012;21(4):885–93. [DOI] [PubMed] [Google Scholar]
- 24.Wang L, Mishina Y, Liu F. Osterix-Cre transgene causes craniofacial bone development defect. Calcif Tissue Int 2015;96(2):129–37. [DOI] [PMC free article] [PubMed] [Google Scholar]
- 25.Dirckx N, Van Hul M, Maes C. Osteoblast recruitment to sites of bone formation in skeletal development, homeostasis, and regeneration. Birth Defects Res C Embryo Today 2013;99(3):170–91. [DOI] [PubMed] [Google Scholar]
- 26.Chen J, Shi Y, Regan J, Karuppaiah K, Ornitz DM, Long F. Osx-Cre targets multiple cell types besides osteoblast lineage in postnatal mice. PloS One 2014;9(1):e85161. [DOI] [PMC free article] [PubMed] [Google Scholar]
- 27.Chen J, Long F. Beta-catenin promotes bone formation and suppresses bone resorption in postnatal growing mice. J Bone Miner Res 2013;28(5):1160–9. [DOI] [PMC free article] [PubMed] [Google Scholar]
- 28.Holmbeck K, Szabova L. Aspects of extracellular matrix remodeling in development and disease. Birth Defects Res C Embryo Today 2006;78(1):11–23. [DOI] [PubMed] [Google Scholar]
- 29.Holmbeck K, Bianco P, Caterina J, et al. MT1-MMP-deficient mice develop dwarfism, osteopenia, arthritis, and connective tissue disease due to inadequate collagen turnover. Cell 1999;99(1):81–92. [DOI] [PubMed] [Google Scholar]
- 30.Zhou Z, Apte SS, Soininen R, et al. Impaired endochondral ossification and angiogenesis in mice deficient in membrane-type matrix metalloproteinase I. Proc Natl Acad Sci USA 2000;97(8): 4052–7. [DOI] [PMC free article] [PubMed] [Google Scholar]
- 31.Stickens D, Behonick DJ, Ortega N, et al. Altered endochondral bone development in matrix metalloproteinase 13-deficient mice. Development 2004;131(23):5883–95. [DOI] [PMC free article] [PubMed] [Google Scholar]
- 32.Sroka IC, McDaniel K, Nagle RB, Bowden GT. Differential localization of MT1-MMP in human prostate cancer tissue: role of IGF-1R in MT1-MMP expression. Prostate 2008;68(5):463–76. [DOI] [PubMed] [Google Scholar]
- 33.Saikali Z, Setya H, Singh G, Persad S. Role of IGF-1/IGF-1R in regulation of invasion in DU145 prostate cancer cells. Cancer Cell Int 2008;8:10. [DOI] [PMC free article] [PubMed] [Google Scholar]
- 34.Montaseri A, Busch F, Mobasheri A, et al. IGF-1 and PDGF-bb suppress IL-1beta-induced cartilage degradation through down-regulation of NF-kappaB signaling: involvement of Src/PI-3K/AKT pathway. PloS One 2011;6(12):e28663. [DOI] [PMC free article] [PubMed] [Google Scholar]
- 35.Wheeler CA, Jafarzadeh SR, Rocke DM, Grodzinsky AJ. IGF-1 does not moderate the time-dependent transcriptional patterns of key homeostatic genes induced by sustained compression of bovine cartilage. Osteoarthritis Cartilage 2009;17(7):944–52. [DOI] [PMC free article] [PubMed] [Google Scholar]
- 36.Allerstorfer D, Longato S, Schwarzer C, Fischer-Colbrie R, Hayman AR, Blumer MJ. VEGF and its role in the early development of the long bone epiphysis. J Anat 2010;216(5):611–24. [DOI] [PMC free article] [PubMed] [Google Scholar]
- 37.Maes C, Stockmans I, Moermans K, et al. Soluble VEGF isoforms are essential for establishing epiphyseal vascularization and regulating chondrocyte development and survival. J Clin Invest 2004;113(2): 188–99. [DOI] [PMC free article] [PubMed] [Google Scholar]
- 38.Li H, Adachi Y, Yamamoto H, et al. Insulin-like growth factor-I receptor blockade reduces tumor angiogenesis and enhances the effects of bevacizumab for a human gastric cancer cell line, MKN45. Cancer 2011;117(14):3135–47. [DOI] [PubMed] [Google Scholar]
- 39.Kurmasheva RT, Dudkin L, Billups C, Debelenko LV, Morton CL, Houghton PJ. The insulin-like growth factor-1 receptor-targeting antibody, CP-751,871, suppresses tumor-derived VEGF and synergizes with rapamycin in models of childhood sarcoma. Cancer Res 2009;69(19):7662–71. [DOI] [PMC free article] [PubMed] [Google Scholar]
- 40.Piecewicz SM, Pandey A, Roy B, Xiang SH, Zetter BR, Sengupta S. Insulin-like growth factors promote vasculogenesis in embryonic stem cells. PloS One 2012;7(2):e32191. [DOI] [PMC free article] [PubMed] [Google Scholar]
- 41.Wang Y, Nakayama M, Pitulescu ME, et al. Ephrin-B2 controls VEGF-induced angiogenesis and lymphangiogenesis. Nature 2010;465(7297):483–6. [DOI] [PubMed] [Google Scholar]
- 42.Nishimura R, Wakabayashi M, Hata K, et al. Osterix regulates calcification and degradation of chondrogenic matrices through matrix metalloproteinase 13 (MMP13) expression in association with transcription factor Runx2 during endochondral ossification. J Biol Chem 2012;287(40):33179–90. [DOI] [PMC free article] [PubMed] [Google Scholar]
- 43.Oh JH, Park SY, de Crombrugghe B, Kim JE. Chondrocyte-specific ablation of osterix leads to impaired endochondral ossification. Biochem Biophys Res Commun 2012;418(4):634–40. [DOI] [PMC free article] [PubMed] [Google Scholar]
- 44.Dy P, Wang W, Bhattaram P, et al. Sox9 directs hypertrophic maturation and blocks osteoblast differentiation of growth plate chondrocytes. Dev Cell 2012;22(3):597–609. [DOI] [PMC free article] [PubMed] [Google Scholar]
- 45.Mak KK, Kronenberg HM, Chuang PT, Mackem S, Yang Y. Indian hedgehog signals independently of PTHrP to promote chondrocyte hypertrophy. Development 2008;135(11):1947–56. [DOI] [PMC free article] [PubMed] [Google Scholar]
- 46.Zhang M, Xuan S, Bouxsein ML, et al. Osteoblast-specific knockout of the insulin-like growth factor (IGF) receptor gene reveals an essential role of IGF signaling in bone matrix mineralization. J Biol Chem 2002;277(46):44005–12. [DOI] [PubMed] [Google Scholar]
Associated Data
This section collects any data citations, data availability statements, or supplementary materials included in this article.