

Abstract
Nakagata, T, Yamada, Y, and Naito, H. Estimating energy cost of body weight resistance exercise using a multistage exercise test. J Strength Cond Res 36(5): 1290–1296, 2022—The purpose of this study was to examine energy cost of body weight resistance exercises with slow movement in young men using a multistage exercise test. Fifteen men aged 21–29 years performed 3 exercises (heel-raise, squat, and push-up) at different frequencies (1, 2, 3, 4, 5, and 6 repetitions·min−1). Oxygen consumption was measured using indirect calorimetry; we then computed a simple linear regression between aerobic energy expenditure (EE) and repetition frequency. The slope coefficient in the regression represents the energy cost of those exercises; we compared the extrapolated EE for a frequency of 10 repetitions·min−1. Gross EE increased linearly with repetition frequency in all subjects (y = ax + b). Energy cost was significantly greater in the case of the push-up than in the case of the squat {squat: 0.50 ± 0.14 (95% confidence interval [CI], 0.42–0.58); push-up: 0.77 ± 0.20 kcal (95% CI, 0.66–0.88); and the heel-raise elicited the lowest energy cost: 0.13 ± 0.04 kcal (95% CI, 0.11–0.15)}. Extrapolated EE at 10 repetitions·min−1 was 2.7 ± 0.5 kcal (2.3 metabolic equivalents [METs]), 6.3 ± 1.4 kcal (5.4 METs), and 9.2 ± 2.1 kcal (7.8 METs), respectively, according to the regression based on aerobic EE. These results will be useful for health professionals in prescribing resistance exercise programs improving muscle fitness and considering for weight management.
Key Words: resistance training, energy expenditure, METs, health promotion, home-based exercise program, slope
Introduction
Energy expenditure (EE) during exercise is estimated based on oxygen consumption (V̇o2) using indirect calorimetry. The energetic profile of resistance exercise (RE) is different in mild aerobic exercise (13), the V̇o2 of different mild aerobic exercise such as walking or jogging increase gradually to achieve steady-state during the submaximal effort, and then decreases exponentially toward resting levels when the exercises stopped. On the other hand, an individual's V̇o2 does not reach a steady state during anaerobic-type exercise such as RE, which is an intermittent form of exercise that includes bouts of work interspersed with short recovery intervals; V̇o2 is elevated immediately after exercise, during the recovery phase, regardless of whether fatigue is present or not (22,23). Anaerobic component of EE (ATP-phosphocreatine, lactic acid system) and increased blood lactate (La) potentially contribute to elevated V̇o2 after exercise phase. Thus, previous studies have examined various methods aiming to solve this problem and thereby examine EE during RE.
Wilmore et al. (29) were the first to attempt to quantify EE during RE; they did so by applying indirect calorimetry not only during the RE itself but also during postexercise recovery until the subjects returned to their pre-exercise V̇o2. Taking an alternative approach, Robergs et al. (21) published the first article using an accumulated oxygen deficit method for the squat and bench-press exercises, in which subjects lifted weights at 31–57% of their one repetition maximum (1RM) over a period of 5 minutes. They calculated energy cost (kcal·min−1), plotted this against absolute intensity (e.g., mass lifted in kg) and relative intensity (i.e., % of 1RM), and extrapolated energy cost for these exercises with a heavier load (∼70% 1RM) using linear regression. Other researchers have used multistage methods for isolated REs and measured energy cost of RE performed at various intensities (20,24,27).
Although previous studies have investigated traditional RE using free weights or weight machines with high loads, there is relatively little information about exercise intensity (EE and energy cost) of body weight resistance exercise (BWRE). In addition, BWRE cannot be expressed as amount of weight lifted (in kg), and the relative intensity is expressed as %1RM or number of RM to failure (e.g., 10RM). Thus, an alternative way is needed. The metabolic equivalent (MET) is a unit of physiological demand for exercises based on EE or V̇o2; we recently estimated EE and METs for popular BWRE (e.g., the squat and push-up) with slow movement in young male and older adults (16,19) using a recovery calculation method (26), taking into account measures taken during the 30 seconds after exercise and found that V̇o2 increased during the interval or recovery phase compared with the actual exercise phase in the case of all these exercises. MET intensity was defined as the area under the curve, which included the exercises and recovery phases of the second and third sets (in total 3 minutes) divided by individual resting EE (16,19); however, the time course of postexercise V̇o2 differed between the 6 exercises, and in some cases, it is possible that EE was overestimated or underestimated.
To measure EE and energy cost during physical activity performed over the course of a few seconds, Hatamoto et al. (8–10) developed a novel method to calculate EE during an instantaneous movement, such as a single change of direction during jogging or a sit-to-stand (STS) movement and named this method the Different Frequency Accumulation Method (DFAM). The DFAM is a graded multistage exercise test consisting of 4 minutes in each stage, during each of which subjects repeat the same exercise at different frequencies until a steady-state EE was achieved at each repetition frequency; “energy cost (EE for a single repetition)” of the exercise is then estimated using the linear relationship between gross EE and the frequency with which the movement is performed. The DFAM makes it possible to measure the energy cost of various movements such as BWRE, which uses no lifting weight, from the slope of linear regression; however, it is not clear whether this method can be applied in the case of BWRE. It is important to investigate this possibility because BWREs cannot be quantifies the exercise load and adjusted by changing directly, which would enable measurement of energy cost as performed for other types of RE in previous studies (20,21,24,27). Therefore, the DFAM is potentially suitable for calculating energy cost of BWRE which is EE for a single repetition using linear regression based on data collected while varying the frequency with which the exercise is performed. In addition, DFAM could estimate the extrapolated EE of BWRE-slow at a frequency of 10 repetitions·min−1, based on a linear regression. If the EE and energy cost of BWRE-slow are clarified, trainees and exercise/health professionals can use them in real-training settings.
The aims of this study were (1) to examine the applicability of the DFAM in measuring energy cost (EE for a single repetition) of BWRE-slow (heel-raise, squat, and push-up) and (2) to extrapolate these findings to obtain an EE value for each of these exercises at 10 repetitions·min−1.
Methods
Experimental Approach to the Problem
We measured EE during BWRE (heel-raise, squat, and push-up) using indirect calorimetry and estimated energy cost of BWREs with slow movement in young men using a multistage exercise test; we then computed a simple linear regression between EE and repetition frequency. The multistage exercise test consisting of 5 minutes in each stage, during each of which subjects repeat the same exercise at different frequencies (1, 2, 3, 4, 5, and 6 repetitions·min−1).
Subjects
Subjects in this study were 15 adult men aged 21–29 years (mean ± SD: mean age: 23.2 ± 2.0 years; height: 171.1 ± 5.5 cm; body mass: 66.1 ± 7.4 kg). Subjects were administered an annual health examination at their university, in which they were found to have normal blood pressure and electrocardiograms, and had no history of established cardiovascular disease, pulmonary disease, or neurological disease. Table 1 shows subject characteristics and anthropometric data. All subjects had regular exercise habits (1–3 days per week), and they performed all exercises to familiarize with the BWRE used in this study before participating in the main experiment. The study protocol was approved by the Research Ethics Review Board of Juntendo University's Graduate School of Health and Sports Science (29–85). Before the study began, participants provided written consent to participate after receiving information about the procedures and purpose of the study.
Table 1.
Subject characteristics (n = 15).
| Variables | Mean ± SD | Range |
| Age (y) | 23.2 ± 2.0 | 21–29 |
| Height (cm) | 171.1 ± 5.5 | 162.4–179.3 |
| Mass (kg) | 66.1 ± 7.4 | 57.5–79.4 |
| Body mass index (kg·m−2) | 22.5 ± 1.5 | 19.6–25.4 |
| Body fat (%) | 13.8 ± 3.9 | 5.5–21.2 |
| Total muscle mass (kg) | 32.4 ± 3.3 | 28.8–39.2 |
| Arm muscle mass (kg) | 6.1 ± 0.8 | 5.2–7.7 |
| Leg muscle mass (kg) | 17.6 ± 1.7 | 15.8–20.9 |
Procedures
The study was of a random crossover design with 3 exercises, including heel-raise, squat, and push-up on 2 separate days; subjects completed the experiment over 2 sessions held on separate days within a week between over the course of a year. In day 1, they performed either the squat or push-up only. In day 2, they performed the heel-raise at first and either the squat or push-up later. The exercise intensity of heel-raise which is very simple and single joint exercise in MET was lower than squat and push-up in our previous study (16,19). Furthermore, muscles used in squat and push-up were different from heel-raise (mainly calf), and all subjects performed heel-raise first. To eliminate influence of execution order, the allocation of the squat and push-up to day 1 and day 2 was randomized between subjects. All measurements were performed in a laboratory, where the temperature and humidity of the internal atmosphere were adjusted to 20° C and 50%, respectively.
The total duration of the entire experiment was 90 minutes, including resting in a chair for 20 minutes and in a standing position for 10 minutes for measurements of resting EE. Subjects refrained from engaging in any strenuous physical activity, including general exercise, for 1 day before the start of the experiment, and started fasting (with no restriction on water) 4 hours before the start of the experiment. Each subject's resting EE was measured using an indirect calorimeter (AE-300s; Minato Medical Science Co., Ltd., Osaka, Japan) while they were sitting in a chair and maintaining a resting position for 20 minutes, and in a standing position for 10 minutes, with a face mask attached. After measurement of their resting EE, each subject performed an exercise session.
Body Weight Resistance Exercise Protocol
The experimental protocol for all subjects is shown in Figure 1. This multistage experiment involved performing each BWRE with slow movement at different frequencies. Each stage lasted 5 minutes, with 1- to 9-minute rest between stages. The frequencies at which the exercises were performed in each stage were 1, 2, 3, 4, 5, and 6 repetitions·min−1 (for a total of 6 stages; see Table 2). All subjects were immediately seated in a chair after each stage, we confirmed that the postexercise V̇o2 return to their own resting level, and then subjects performed next stage. We selected the following 3 exercises: (a) heel-raise, (b) squat, and (c) push-up. Details of these BWRE-slow are described in our previous publication in young men (16). Heel-raise; they stand with feet a few inches apart, raise heels off the floor as high as possible while keeping knees straight, lower heels to the floor. Squat; they stand in a shoulder-width stance, bend the knees and lower hips like sitting in a chair until the thighs become parallel to the floor. During the push-up session, subjects started the exercise in a prone position on the floor, and they waited between push-ups in the same position with their chest on the floor. The main limitation of BWRE is that the exercise is limited to low- to middle-load training, so that the effect of BWRE on muscle strength is weaker than that of the traditional RE using training using free weights or machines. Previous studies performed BWRE with slow movement (BWRE-slow) to overcome the limitation and have been reported that BWRE-slow improved the muscle function and physical fitness in older adults (25,28). Thus, subjects performed the 3 exercises with a duration of 3 seconds each for the concentric and eccentric movements, which they achieved by adjusting their rhythm to the sound of a metronome. Furthermore, examiner checked depth and a complete repetition in visually.
Figure 1.

Experimental protocol. Each body weight resistance exercise with slow movement was performed in 6 different stages with a 1- to 9-minute rest between stages. Each stage lasted 5 minutes. The frequencies at which the exercise was performed in each stage were 1, 2, 3, 4, 5, and 6 repetitions·min−1. REE = resting energy expenditure.
Table 2.
Details of the body weight resistance exercises with slow movement performed to enable calculation of energy expenditure using the different frequency accumulation method.
| Variables | 1 rep·min−1 | 2 reps·min−1 | 3 reps·min−1 | 4 reps·min−1 | 5 reps·min−1 | 6 reps·min−1 |
| Timing of repetitions | 0 (every 1 min) | 0, 30 (every 30 s) | 0, 20, 40 (every 20 s) | 0, 15, 30, 45 (every 15 s) | 0, 12, 24, 36, 48 (every 12 s) | 0, 6, 12, 24, 36, 48 (every 10 s) |
| Total exercise period (s·min−1) | 6 (6 s × 1) | 12 (6 s × 2) | 18 (6 s × 3) | 24 (6 s × 4) | 30 (6 s × 5) | 36 (6 s × 6) |
| Total rest period (s·min−1) | 54 (54 s × 1) | 48 (24 s × 2) | 42 (14 s × 3) | 36 (9 s × 4) | 30 (6 s × 5) | 24 (4 s × 6) |
Anthropometrics and Body Composition
Each subject's height was measured to the closest 0.1 cm using an analog height meter. Body mass was measured, and body fat percentage was estimated using the impedance method (Inbody 730; Biospace, Tokyo, Japan) before exercise. Subjects were instructed to finish their last meal at least 4 hours before the experimental session and to empty their bladder before these measurements. They were evaluated in their underwear and were asked to stand barefoot on toe and heel electrodes and to hold the handgrips with their arms hanging down a few centimeters from the hip (30).
Indirect Calorimetry and Different Frequency Accumulation Method
Measurements of respiratory gas were performed using indirect calorimetry in our laboratory, as previously described (16). All the data were processed every 30 seconds, and the subject's ventilation volume (VE), oxygen uptake (V̇o2), and carbon dioxide production (V̇CO2) were measured. Data from the last 2 minutes or the most stable 2 consecutive minutes of each stage were taken to indicate the subject's V̇o2; their EE was calculated in accordance with previous studies (during exercise, 1 L O2 = 5 kcal) (16,26). For each resting period (sitting in a chair and standing), the average value during the last 5 minutes of rest was defined as the individual's resting EE. A V̇o2 of 3.5 ml·kg−1·min−1 was designated as 1 MET in this study.
Calculation of energy cost was modeled on a previous study (17). The DFAM is the idea that gross EE increases linearly as movement frequency increases if the EE, which is determined for performing one movement, accumulates by conducting movements repeatedly (9). The linear relationship between the gross EEs and different frequencies of the movement indicated that the slope of the regression line was expressed as an EE of a movement (net EE). Furthermore, the intercept (a zero-load EE) meant an individual resting EE was also included in the linear regression analysis. In addition, we reported that the gross EE increased linearly against the STS frequencies for both the slow and normal movements (slow: 3 seconds up, 3 seconds down; normal: 1 second up, 1 second down) (17). Gross EE was estimated while each movement was performed repeatedly, until a steady-state EE was achieved at each repetition frequency. We then calculated the linear regression line between gross EE and repetition frequency (y = ax + b). A zero-load EE (individual resting EE) was also included in the linear regression analysis. Individual resting EE was taken to be that of the standing position for the squat and heel-raise and that of the sitting position for the push-up.
Heart Rate and Rate of Perceived Exertion
Heart rate (HR) was recorded throughout the whole experiment using an electrocardiogram device (Fukuda Electronics Co., Ltd.; DS-7520). Three beats were recorded 15 seconds before the end of each stage; their average rate was taken to represent the subject's HR during that stage. The subject's rate of perceived exertion (RPE) was recorded using the Borg Scale, with a rating from 6 to 20 (4), after each stage.
Statistical Analyses
Microsoft Office Excel 2017 and PASW Statistics version 20.0 (SPSS, IBM Inc., BM Corp., Armonk, NY) were used for data processing and statistical analyses, respectively. All the variable results are presented as mean ± SD and 95% confidence interval (CI). Linear regression analyses were conducted to calculate the slopes and intercepts describing the relationship between gross EE and repetition frequency for each BWRE-slow. Paired t-tests were conducted to compare the slope, intercept, and resting EE for each exercise. In addition, we conducted paired t-tests to compare the mean EEs computed for the repetition frequency of 10 repetitions·min−1 using 2 different calculation methods. The statistical significance level was set at 0.05.
Results
All Subjects Successfully Completed Both Experimental Sessions. Figure 2A shows the relationship between the frequency at which the BWRE-slow was performed and gross EE for the heel-raise, squat, and push-up. Gross EE increased linearly with the frequency at which the exercise was performed in all cases (r = 0.991–0.999; heel-raise: y = 0.13x + 1.37; squat: y = 0.50x + 1.35; push-up: y = 0.77x + 1.47). The slope of the regression line, which represents energy cost was steepest in the case of the push-up (p < 0.001; slope: heel-raise: 0.13 ± 0.04 [95% CI, 0.11–0.15] kcal; squat: 0.50 ± 0.14 [95% CI, 0.42–0.58] kcal; push-up: 0.77 ± 0.20 [95% CI, 0.66–0.88] kcal). The value of an intercept (a zero-load EE) in the regression, which is equivalent to resting EE in a standing position, did not significantly differ between heel-raise and squat (heel-raise; 1.37 kcal, squat; 1.35 kcal). Figure 2B shows the relationship between the HR and the gross EE for the heel-raise, squat, and push-up. The gross EE increased linearly against the HR for both the squat and push-up (r = 0.987–0.999). In addition, Table 3 shows the relationship between the frequency at which the BWRE-slow was performed and other physiological responses. These results indicated that, for the squat and push-up, as the frequency with which the exercise was repeated increased, physiological responses, such as HR, respiratory quotient (RQ), and RPE, also increased. In push-up, HR and RQ achieved the maximum values 120.1 b·min−1 and 0.91 at 6 reps·min−1, respectively.
Figure 2.
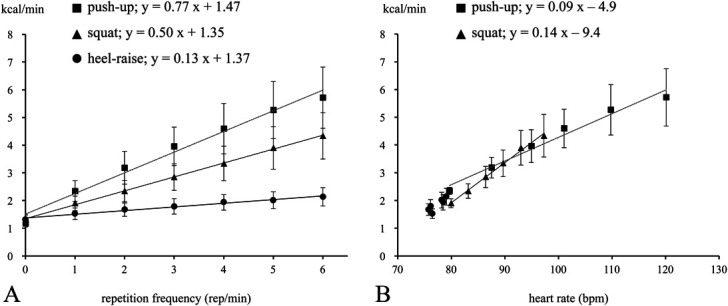
A) The linear relationship between gross energy expenditures (EEs) (kcal·min−1) and frequency of repetition for each exercise. X axis represents the repetition frequency (1, 2, 3, 4, 5 and 6 repetitions·min−1). The symbol “circle” is the heel-raise, “triangle” is the squat, and “square” is the push-up. The slope of the push-up was significantly higher than that of the squat and heel-raise (p < 0.001). B) The linear relationship between gross energy expenditures (EE) (kcal·min−1) and heart rate (HR) for each exercise.
Table 3.
Physiological responses during body weight resistance exercises with slow movement.*
| Variables | Rest | 1 rep·min−1 | 2 reps·min−1 | 3 reps·min−1 | 4 reps·min−1 | 5 reps·min−1 | 6 reps·min−1 |
| Heart rate (b·min−1) | |||||||
| Heel-raise | 75.1 ± 11.6 | 76.5 ± 12.2 | 75.7 ± 10.9 | 76.1 ± 11.1 | 78.5 ± 9.8 | 78.2 ± 10.1 | 79.1 ± 10.6 |
| Squat | 76.3 ± 12.4 | 79.9 ± 13.6 | 83.1 ± 13.9 | 86.4 ± 13.6 | 89.7 ± 14.6 | 93.0 ± 15.0 | 97.3 ± 16.7 |
| Push-up | 64.0 ± 10.7 | 79.7 ± 11.2 | 87.5 ± 11.2 | 94.9 ± 10.5 | 101.1 ± 12.0 | 109.8 ± 18.1 | 120.1 ± 21.5 |
| Metabolic equivalents (METs) | |||||||
| Heel-raise | — | 1.3 ± 0.2 | 1.4 ± 0.2 | 1.5 ± 0.2 | 1.5 ± 0.2 | 1.7 ± 0.2 | 1.8 ± 0.2 |
| Squat | — | 1.6 ± 0.1 | 2.0 ± 0.2 | 2.4 ± 0.3 | 2.9 ± 0.3 | 3.1 ± 0.9 | 3.7 ± 0.5 |
| Push-up | — | 2.0 ± 0.2 | 2.7 ± 0.4 | 3.4 ± 0.4 | 4.0 ± 0.5 | 4.5 ± 0.7 | 4.7 ± 0.8 |
| Respiratory quotient | |||||||
| Heel-raise | 0.85 ± 0.05 | 0.83 ± 0.05 | 0.82 ± 0.05 | 0.82 ± 0.05 | 0.82 ± 0.05 | 0.82 ± 0.05 | 0.81 ± 0.05 |
| Squat | 0.84 ± 0.04 | 0.81 ± 0.03 | 0.80 ± 0.04 | 0.81 ± 0.05 | 0.82 ± 0.04 | 0.83 ± 0.05 | 0.83 ± 0.05 |
| Push-up | 0.88 ± 0.06 | 0.83 ± 0.06 | 0.84 ± 0.05 | 0.87 ± 0.05 | 0.90 ± 0.05 | 0.90 ± 0.05 | 0.91 ± 0.03 |
| rate of perceived exertion | |||||||
| Heel-raise | — | 7 ± 1 | 7 ± 1 | 8 ± 2 | 8 ± 2 | 9 ± 2 | 10 ± 2 |
| Squat | — | 7 ± 1 | 8 ± 2 | 9 ± 2 | 10 ± 2 | 11 ± 2 | 12 ± 2 |
| Push-up | — | 8 ± 1 | 9 ± 2 | 11 ± 1 | 13 ± 1 | 14 ± 1 | 15 ± 2 |
V̇o2 of 3.5 ml·kg−1·min−1 was designated as 1 MET.
Discussion
The main purpose of this study was to apply a newly developed method, namely the DFAM, for evaluating the energy cost of 3 BWRE-slow (heel-raise, squat, and push-up) in young men. We computed linear regression parameters representing the relationship between gross EE and repetition frequency. The main finding of this study was that gross EE during the heel-raise, squat, and push-up exercises was found using the DFAM to increase as a function of the frequency with which each exercise was performed; furthermore, energy cost was greater in the case of the push-up than in the case of the squat in healthy young men (squat: 0.50 ± 0.14 kcal (95% CI, 0.42–0.58); push-up: 0.77 ± 0.20 kcal (95% CI, 0.66–0.88). In addition, the extrapolated EE of heel-raise, squat, and push-up at a frequency of 10 repetitions·min−1, based on a linear regression, was found to be equivalent to 2.7 ± 0.5 kcal (2.3 METs [95% CI, 2.1–2.5]), 6.3 ± 1.4 kcal·min−1 (5.4 METs [95% CI, 4.8–6.1]), and 9.2 ± 2.1 kcal·min−1 (7.8 METs [95% CI, 6.9–8.8]) for these exercises, respectively.
Previous studies have examined energy cost of traditional RE, such as free weights or machines, using linear regression analysis including postexercise V̇o2 as a measure of accumulated oxygen deficit (20,21,24,27). However, it is difficult to determine the energy cost of BWRE because there is no lifting weight and it is not easy to achieve repetition failure. Thus, we tried to obtain energy cost of BWRE using the DFAM. A unique aspect of this study was the approach to calculating energy cost (EE of a single repetition) of BWRE-slow (heel-raise, squat, and push-up): all subjects performed these exercises following a graded multistage experimental protocol in which the frequency of repetition varied; this enabled calculation of energy cost by each subject, for each exercise, using the DFAM. As shown in Figure 2A, gross EE (kcal·min−1) increased linearly against the frequency with which the BWRE-slow exercise was performed in the case of all exercises (r = 0.991–0.999). In addition, the slope of the linear regression computed using the DFAM and the actual EE during the multistage protocol at a repetition frequency of 1 repetition·min−1 were almost the same for all exercises. Therefore, in line with the findings of a previous study investigating energy cost of an STS movement (0.22 ± 0.09 kcal or 0.92 ± 0.37 kJ (9)), our results indicate that the DFAM can be applied to obtain energy cost for a BWRE-slow, even in the case of a simple exercise such as the heel-raise, in which the heels are lifted off the floor.
Comparing the slopes pertaining to each of the 3 exercises tested, the slope for the push-up was significantly steeper than that of the squat (squat: y = 0.50x + 1.35; push-up: y = 0.77x + 1.47), and that of the heel-raise was significantly shallower than that of the squat (heel-raise: y = 0.13x + 1.37). It is not surprising that the heel-raise was associated with the lowest energy cost (0.13 ± 0.04) because the heel-raise is an isolation exercise involving only the calves. In contrast to our previous findings that the intensity of the 2 multijoint movements—the push-up, which uses the upper body (mainly the pectoralis major muscles), and the squat, which uses the lower body (mainly the quadriceps muscles)—is almost identical (16), the results of this study indicated that the push-up involved significantly higher EE than the squat (p < 0.001). Robergs et al. (21) investigated energy cost of squat and bench-press exercises at 31–57% of 1RM and found that energy cost was slightly higher in the case of the squat at relative exercise load. Similarly, Reis et al. (20) reported higher energy cost of the squat than the bench press at a lower intensity (12–24% of 1RM); therefore, in contrast to our results, energy cost could be greater during lower-body RE than during upper-body RE when the exercises involve the use of free weights and weight machines.
A number of factors may have contributed to the higher energy cost observed during the push-up than during the squat in this study (squat: y = 0.50x + 1.35; push-up: y = 0.77x + 1.47). Regarding the higher energy cost during the push-up as compared to the squat, the skeletal muscle mass and volume of the muscles involved in this exercise could be relevant. In general, most adults have greater muscle mass and volume in the lower body than in the upper body; whole-body magnetic resonance imaging (MRI) suggests that the average distribution is 42.9% in the upper body and 54.9% in the lower body for men and 39.7% in the upper body and 57.7% in the lower body for women (12). Furthermore, in previous studies measuring human muscle volume using MRI, the quadriceps have been reported to measure 1,417.4 ± 440.8 cm3 (15) and the pectoralis major 290 ± 169 cm3 (11). Although we did not measure segmental muscle mass and volume in this study, the relative muscle mass (muscle mass per unit body weight) of the upper body is greater than that of the lower body. The push-up is performed in a prone position and involves activation of the pectoralis major and deltoid muscles, as indicated by electromyography (5), meaning that the relative exercise load could be greater than in the case of the squat. Second, the RQ of the push-up was greater than that of the squat and heel-raise (Table 2). The energetic profile of RE differs from that of mild aerobic exercises such as walking or jogging, and RE makes demands on the phosphagen, glycolytic, and mitochondrial energy systems (13). The mouth-based RQ obtained by indirect calorimetry does not fully reflect the aerobic and anaerobic energy systems, meaning that a higher RQ is more dependent on the anaerobic energy system. Furthermore, the push-up induced a significantly higher HR than did the squat in this study, except when performed at a frequency of 1 repetition·min−1, with the former eliciting over 120 b·min−1 at a frequency of 6 repetitions·min−1; a higher HR during the push-up would contribute to a higher energy cost. In addition, we did not measure blood lactate (La) in this study, and further studies are still needed. The 0.5 mmol·L−1 of La is equal to 1.5 ml O2/(kg·min) of anaerobic EE, and we found significantly increased La after BWRE-slow interval training (26.5 minutes in total) from 0.9 to 3.5 mmol·L−1 (18). Thus, anaerobic EE might potentially contribute to energy cost of push-up, and these factors could account for the higher EE observed during the push-up as compared to the squat.
The second aim of the current study was to obtain the extrapolated values for EE during each of the 3 exercises based on a linear regression. The extrapolated EE of heel-raise, squat, and push-up at a frequency of 10 repetitions·min−1 was found to be equivalent to 2.7 ± 0.5 kcal (2.3 METs), 6.3 ± 1.4 kcal·min−1 (5.4 METs), and 9.2 ± 2.1 kcal·min−1 (7.8 METs) for these exercises, respectively. The values of push-up was higher as compared to our previous study using the recovery calculation method (16). In this study, subjects repeated each exercise for 5 minutes in each stage. And, the EE in each stage, includes both exercise and recovery, represents a steady-state condition during exercise. Assuming that increased V̇o2 after exercise represents only a component of oxygen deficit during exercise, the oxygen deficit generated by the push-up could be greater than indicated by V̇o2 during the 30 seconds after exercise. Furthermore, RE is considered to represent 3.5 METs (code 02054) and 5.0 METs (code 02052) in the Compendium of Physical Activities (1), but according to the present findings, performing the squat and push-up at a frequency of 10 repetitions·min−1 would represent a higher intensity (5.4–7.8 METs) than assumed previously. These findings will be useful to exercise and health professionals in prescribing resistance training programs using BWRE-slow.
From the perspective of promoting muscle hypertrophy, traditional RE using free weights or machines represents the gold standard (2). However, performing free weights or machines using high-load requires longer periods of neuromuscular recovery for beginners and older populations, and principles of individualization, periodization, and progression are very important for beginner and older populations in resistance training programs (6). By contrast, BWRE-slow has great potential for use in exercise programs and may be suitable as muscle-strengthening activities for majority of healthy population, especially beginner and older populations. In addition, we believe that our findings spotlight the aspect of aerobic benefit of BWRE, which had been previously overlooked in literature. Including regular BWRE-slow training with other aerobic and muscle strength exercises is potentially a good way to meet physical activity guideline more easily. However, this study has several limitations. First, the subject sample consisted only of healthy young men (n = 15); it is important that additional research be performed with other populations (women or older adults) to investigate the influence of sex, age, and body composition on energy cost of these exercises. Absolute exercise intensity of BWRE with slow movement represents light-to-moderate intensity physical activity for healthy young men, but the same exercises will constitute relatively high intensity exercise for other groups (7). Furthermore, other populations, such as less-trained individuals, may not be able to perform BWRE-slow for a total of 6 stages and obtain linear regression between EE and repetition frequency. However, Hatamoto et al. (10) indicated that a single EE of a turn during jogging can be calculated accurately using only 2 data points. In such cases, it may not be possible to solve the problem by calculating by using DFAM. Second, we investigated only one speeds of BWRE with slow movement (3 seconds up, 3 seconds down). In real-training setting, trainees perform BWRE at different speeds, high-intensity functional training, and circuit RE (3,14). We previously examined the energy cost of STS, which has similar movement and EE with squat in this study, of both slow (3 seconds up, 3 seconds down, in total 6 seconds) and normal (1 second up, 1 second down, in total 2 seconds) experiments, the energy cost of the STS with slow was significantly greater than that of the STS with normal; the energy cost of the STS with slow was approximately 40% larger than that of the STS with normal (slow: 0.37 ± 0.12 kcal; normal: 0.26 ± 0.06 kcal). Thus, the energy cost of BWRE with faster speed is considered to lower as compared to slow movement; however, further studies are needed to apply this method of measuring the energy cost of BWRE at different speeds (e.g., more slowly or more quickly). Third, we investigated only 3 types of BWRE-slow (the heel-raise, squat, and push-up); we selected these because they cover the major muscle groups and are popular exercises that the majority of adults can perform easily. Further studies are needed to apply this method of measuring EE to other BWREs (e.g., the pull-up or glute bridge) and to traditional RE using free weights and machines. Fourth, as we discussed above, we did not measure La as anaerobic energy component, so that the current study may not fully reflect actual EE of BWRE-slow.
Practical Applications
In the general guideline of resistance training program, exercise intensity is one of the most important areas, as well as frequency, exercise time, and exercise type; traditional RE using free weights or weight machines with high loads (i.e., >70 of 1RM) is recommended for improvement in strength and muscle hypertrophy, but when these are not feasible, BWRE is alternative for those traditional RE. However, BWRE cannot be expressed as amount of weight lifted (in kg), and the relative intensity is expresses as %1RM or number of RM to failure. Therefore, we investigated the EE and METs intensity based on oxygen consumption.
To the best of our knowledge, this is the first study to evaluate the energy cost (EE for a single repetition) of BWRE-slow using from the slope of linear regression in healthy young men. The results of this study indicate that energy cost was greater in the case of the push-up than in the case of the squat (squat: 0.50 ± 0.14 kcal; push-up: 0.77 ± 0.20 kcal). Furthermore, the extrapolated EE of heel-raise, squat, and push-up at a frequency of 10 repetitions·min−1, based on a linear regression, was found to be equivalent to 2.7 ± 0.5 kcal (2.3 METs), 6.3 ± 1.4 kcal·min−1 (5.4 METs), and 9.2 ± 2.1 kcal·min−1 (7.8 METs) for these exercises, respectively. Gross EE depends on height, weight, and muscle mass, although, if average young men performed 3 exercises (10 reps × 3 sets), respectively, the gross EE is estimated to be 55 kcal (226 kJ). Although the exercise program using BWRE-slow does not necessarily become a large EE that leads to weight management and weight loss, the METs of squat and push-up are equivalent to vigorous intensity, such as general jogging (3–4 METs), and higher as compared to assumed previously. Further research should be conducted with other samples, especially older populations and beginners. The findings of this study are valuable for exercise and health professionals who prescribe RE programs using BWRE-slow to improve muscle fitness and to control/reduce body weight in a real-training setting.
Acknowledgments
The authors wish to thank all the subjects in our study. The authors declare that they have no conflict of interest. Takashi Nakagata is now with Department of Physical Activity Research, National Institute of Health and Nutrition, NIBIOHN, Shinjuku-ku, Tokyo, Japan.
References
- 1.Ainsworth BE, Haskell WL, Herrmann SD, et al. 2011 compendium of physical activities: A second update of codes and MET values. Med Sci Sports Exerc 43: 1575–1581, 2011. [DOI] [PubMed] [Google Scholar]
- 2.American College of Sports Medicine. American College of Sports Medicine position stand. Progression models in resistance training for healthy adults. Med Sci Sports Exerc 41: 687–708, 2009. [DOI] [PubMed] [Google Scholar]
- 3.Beckham SG, Earnest CP. Metabolic cost of free weight circuit weight training. J Sports Med Phys Fitness 40: 118–125, 2000. [PubMed] [Google Scholar]
- 4.Borg G. Perceived exertion as an indicator of somatic stress. Scand J Rehabil Med 2: 92–98, 1970. [PubMed] [Google Scholar]
- 5.Calatayud J, Borreani S, Colado JC, Martin F, Rogers ME. Muscle activity levels in upper-body push exercises with different loads and stability conditions. Phys Sportsmed 42: 106–119, 2014. [DOI] [PubMed] [Google Scholar]
- 6.Fragala MS, Cadore EL, Dorgo S, et al. Resistance training for older adults: Position statement from the National Strength and Conditioning Association. J Strength Cond Res 33: 2019–2052, 2019. [DOI] [PubMed] [Google Scholar]
- 7.Garber CE, Blissmer B, Deschenes MR, et al. American College of Sports Medicine position stand. Quantity and quality of exercise for developing and maintaining cardiorespiratory, musculoskeletal, and neuromotor fitness in apparently healthy adults: Guidance for prescribing exercise. Med Sci Sports Exerc 43: 1334–1359, 2011. [DOI] [PubMed] [Google Scholar]
- 8.Hatamoto Y, Yamada Y, Fujii T, et al. A novel method for calculating the energy cost of turning during running. Open Access J Sports Med 4: 117–122, 2013. [DOI] [PMC free article] [PubMed] [Google Scholar]
- 9.Hatamoto Y, Yamada Y, Higaki Y, Tanaka H. A novel approach for measuring energy expenditure of a single sit-to-stand movement. Eur J Appl Physiol 116: 997–1004, 2016. [DOI] [PubMed] [Google Scholar]
- 10.Hatamoto Y, Yamada Y, Sagayama H, et al. The relationship between running velocity and the energy cost of turning during running. PLoS One 9: e81850, 2014. [DOI] [PMC free article] [PubMed] [Google Scholar]
- 11.Holzbaur KR, Murray WM, Gold GE, Delp SL. Upper limb muscle volumes in adult subjects. J Biomech 40: 742–749, 2007. [DOI] [PubMed] [Google Scholar]
- 12.Janssen I, Heymsfield SB, Wang ZM, Ross R. Skeletal muscle mass and distribution in 468 men and women aged 18-88 yr. J Appl Physiol 89: 81–88, 2000. [DOI] [PubMed] [Google Scholar]
- 13.Knuttgen HG. Strength training and aerobic exercise: Comparison and contrast. J Strength Cond Res 21: 973–978, 2007. [DOI] [PubMed] [Google Scholar]
- 14.Lagally KM, Cordero J, Good J, Brown DD, McCaw ST. Physiologic and metabolic responses to a continuous functional resistance exercise workout. J Strength Cond Res 23: 373–379, 2009. [DOI] [PubMed] [Google Scholar]
- 15.Lube J, Cotofana S, Bechmann I, et al. Reference data on muscle volumes of healthy human pelvis and lower extremity muscles: An in vivo magnetic resonance imaging feasibility study. Surg Radiol Anat 38: 97–106, 2016. [DOI] [PubMed] [Google Scholar]
- 16.Nakagata T, Naito H, Yamada Y. Metabolic equivalents of body weight resistance training with slow movement: Implications for exercise prescription and health promotion. J Exerc Physiol Online 21: 29–38, 2018. [Google Scholar]
- 17.Nakagata T, Yamada Y, Hatamoto Y, Naito H. Energy expenditure of a single sit-to-stand movement with slow versus normal speed using the different frequency accumulation method. Medicina (Kaunas) 55, 2019. [DOI] [PMC free article] [PubMed] [Google Scholar]
- 18.Nakagata T, Yamada Y, Naito H. Energy expenditure, recovery oxygen consumption, and substrate oxidation during and after body weight resistance exercise with slow movement compared to treadmill walking. Physiol Int 105: 371–385, 2018. [DOI] [PubMed] [Google Scholar]
- 19.Nakagata T, Yamada Y, Naito H. Metabolic equivalents of body weight resistance exercise with slow movement in older adults using indirect calorimetry. Appl Physiol Nutr Metab 44: 1254–1257, 2019. [DOI] [PubMed] [Google Scholar]
- 20.Reis VM, Garrido ND, Vianna J, et al. Energy cost of isolated resistance exercises across low- to high-intensities. PLoS One 12: e0181311, 2017. [DOI] [PMC free article] [PubMed] [Google Scholar]
- 21.Robergs RA, Gordon T, Reynolds J, Walker TB. Energy expenditure during bench press and squat exercises. J Strength Cond Res 21: 123–130, 2007. [DOI] [PubMed] [Google Scholar]
- 22.Scott CB, Croteau A, Ravlo T. Energy expenditure before, during, and after the bench press. J Strength Cond Res 23: 611–618, 2009. [DOI] [PubMed] [Google Scholar]
- 23.Scott CB, Earnest CP. Resistance exercise energy expenditure is greater with fatigue as compared to non-fatigue. J Exerc Physiol Online 14: 1–10, 2011. [Google Scholar]
- 24.Scott CB, Reis VM. Modeling the total energy costs of resistance exercise: A work in progress. CEJSSM 2: 5–12, 2016. [Google Scholar]
- 25.Tsuzuku S, Kajioka T, Sakakibara H, Shimaoka K. Slow movement resistance training using body weight improves muscle mass in the elderly: A randomized controlled trial. Scand J Med Sci Sports 28: 1339–1344, 2018. [DOI] [PubMed] [Google Scholar]
- 26.Vezina JW, Der Ananian CA, Campbell KD, Meckes N, Ainsworth BE. An examination of the differences between two methods of estimating energy expenditure in resistance training activities. J Strength Cond Res 28: 1026–1031, 2014. [DOI] [PubMed] [Google Scholar]
- 27.Vianna JM, Werneck FZ, Coelho EF, Damasceno VO, Reis VM. Oxygen uptake and heart rate kinetics after different types of resistance exercise. J Human Kinetics 42: 235–244, 2014. [DOI] [PMC free article] [PubMed] [Google Scholar]
- 28.Watanabe Y, Tanimoto M, Oba N, et al. Effect of resistance training using bodyweight in the elderly: Comparison of resistance exercise movement between slow and normal speed movement. Geriatr Gerontol Int 15: 1270–1277, 2015. [DOI] [PubMed] [Google Scholar]
- 29.Wilmore JH, Parr RB, Ward P, et al. Energy cost of circuit weight training. Med Sci Sports 10: 75–78, 1978. [PubMed] [Google Scholar]
- 30.Yamada Y, Nishizawa M, Uchiyama T, et al. Developing and validating an age-independent equation using multi-frequency bioelectrical impedance analysis for estimation of appendicular skeletal muscle mass and establishing a cutoff for sarcopenia. Int J Environ Res Public Health 14: pii: E809, 2017. [DOI] [PMC free article] [PubMed] [Google Scholar]