Abstract
Spontaneous Raman microscopy, which can detect molecular vibrations in cells and tissues, could be a useful tool for the label-free assessment of non-alcoholic fatty liver disease (NAFLD). However, it is unclear whether it can be used to evaluate the nascent state of NAFLD. To address this, we analyzed the Raman spectra of rat liver tissues in the nascent state of NAFLD upon excitation at 532 nm. Raman and histochemical analyses were performed of liver tissues from rats fed a high-fat, high-cholesterol diet (HFHCD). Raman microscopic imaging analysis of formalin-fixed thin tissue slices showed hepatic steatosis, as revealed by the Raman band at 2,854 cm−1, whereas lipid droplets were not detectable by hematoxylin-eosin staining of images until 3 days after feeding a HFHCD. Raman signals of retinol at 1,588 cm−1 emitted from hepatic stellate cells were distributed alongside hepatic cords; the retinol content rapidly decreased after feeding a HFHCD, whereas hepatic lipid content increased inversely. Raman microscopic analysis of the surface of fresh ex vivo livers enabled early detection of lipid accumulation after a 1-day feeding a HFHCD. In conclusion, spontaneous Raman microscopy can be applied to the label-free evaluation of the nascent state of NAFLD liver tissues.
Keywords: spontaneous Raman microscopy, nascent state, nonalcoholic fatty liver disease
I. Introduction
Non-alcoholic fatty liver disease (NAFLD) is a disorder characterized by hepatic steatosis, despite the lack of secondary causes of hepatic fat deposition (e.g., excessive alcohol intake, use of steatogenic drugs, or hereditary disorders) [3]. It often develops with metabolic abnormalities, such as obesity, diabetes mellitus, and dyslipidemia, and affects more than 25% people in the world [18, 34, 36]. It is necessary to study tissue states at an early stage of NAFLD to elucidate the pathogenetic mechanisms; histopathological staining methods and fluorescent labeling techniques of biomolecules are commonly used for such analyses. Unfortunately, these techniques that use fluorescent proteins and staining dyes can modulate the functions of a target biomolecule and the tissue state through chemical and physical interactions [16].
In contrast, spontaneous Raman microscopy allows molecular assessment of biological samples in a label-free manner. When light collides with a molecule, part of the light is scattered. Most of the scattered light has the same frequency as the illumination light (Rayleigh scattered light). However, a very small amount of scattered light has a different frequency from that of the illumination light. This optical phenomenon is called spontaneous Raman scattering [9, 16, 28]. The difference in frequency between the incident light and Raman scattering corresponds to the energy of the molecular vibration; Raman spectral analysis is useful for quantitatively evaluating biomolecules under label-free conditions. This distinctive feature would be helpful in research on the early stages of NAFLD.
There are several reports on the usefulness of spontaneous Raman microscopy for NAFLD assessment. Kochan et al. used an animal model of NAFLD to investigate the chemical components of the lipid droplets (LDs) [15]. Minamikawa et al. demonstrated the difference in chemistry between large and small LDs in a nonalcoholic steatohepatitis (NASH) model mice [20]. In our previous study, we combined Raman imaging with machine learning to evaluate NAFLD liver tissue samples in rats and grouped tissues with similar composition, providing a descriptor that enabled inference of tissue states, thus contributing valuable information to histological inspection of NAFLD [11]. However, it is unclear whether spontaneous Raman microscopy is applicable to the evaluation of the nascent state of NAFLD; the morphological features of NAFLD are not clear in this state and the intensity of spontaneous Raman scattering light is generally weak [9].
In this study, we sought to evaluate whether spontaneous Raman microscopy can be used to evaluate the nascent state of rat NAFLD liver tissues in a label-free manner. We created a rat model of early NAFLD by feeding rats a high-fat, high-cholesterol diet (HFHCD) and analyzed the Raman spectra of liver tissues under 532 nm excitation. Raman imaging of both formalin-fixed thin liver tissue slices and fresh ex vivo liver tissue showed hepatic steatosis even 1 day after feeding a HFHCD, whereas evaluation of hematoxylin-eosin (H&E) stained tissues revealed lipid accumulation only from 3 days after feeding the HFHCD. The results showed that spontaneous Raman microscopy can provide biochemical and morphological information regarding the early state of rat NAFLD without labeling.
II. Materials and Methods
Rat model and sample preparation
All procedures for rat experiments were performed under a protocol approved by and in accordance with the guidelines of the Committee for Animal Research of the Kyoto Prefectural University of Medicine. Slc: Sprague-Dawley male rats (Ten-week-old for thin-sliced tissue imaging and eight-week-old for ex-vivo imaging, Shimizu Laboratory Supplies, Kyoto, Japan) were maintained under 12-hr light/dark cycles with ad libitum access to food and water and fed a standard diet (100% CRF-1 powder; Oriental Yeast Co., Tokyo, Japan) before the experiments. After the start of the experiments, rats were treated with a HFHCD (63.25% CRF-1 powder, 33.00% lard, 1.25% cholesterol, 0.5% cholic acid, 1.00% AIN93G mineral, 1.00% AIN93 vitamin) (Oriental Yeast Co.). After the 0, 1, 3, 7, and 14-day HFHCD feeding periods, three rats from each group were euthanized by deep general anesthesia with a combination of three anesthetic agents, medetomidine, midazolam, and butorphanol [13]. Each rat was fasted for 12 hr before the Raman and histological analyses. For Raman spectral measurement of thin-sliced tissue samples and histological analysis of H&E and Oil Red O-stained sections, portions of livers were excised and fixed with 10% formalin neutral buffer solution (FUJIFILM Wako Pure Chemical Corporation, Osaka, Japan). The fixed tissues were embedded in optimum-cutting-temperature compound (Tissue-Tek; Sakura Finetechnical Japan, Tokyo, Japan), frozen, and sliced using a cryostat (CM1950; Leica Microsystems K. K., Tokyo, Japan) at 30-μm thickness for Raman analysis and at 5-μm thickness for histological analysis. H&E and Oil Red O staining was performed according to standard techniques. Resected liver samples were snap-frozen using liquid nitrogen for the capillary western (Wes) immunoassay. For ex vivo Raman spectral measurement of freshly prepared samples, en bloc livers with hepatic capsules were excised from two rats in the group of 0 and 1-day HFHCD feeding period. After rinsed with phosphate buffered saline (PBS), the resected liver samples were immersed in PBS.
Raman microscopic measurement
A slit-scanning laser Raman confocal microscope (Nanophoton, Osaka, Japan) was used [8, 12, 19, 21, 23, 35]. The excitation wavelength for the analysis of the samples was 532 nm. The laser was focused into a line-shaped beam on the samples with 20× objective lenses (UPLSAPO20X, NA = 0.75 for ex vivo imaging; Olympus, Tokyo, Japan and Apo LWD 20X WI λS, NA = 0.95 for sliced tissue imaging; Nikon, Tokyo, Japan). The laser intensities at the samples were set to 0.5 and 0.4 mW/μm2 for thin-sliced formalin-fixed and freshly prepared samples, respectively. Raman spectral images were acquired using a cooled CCD camera (1,340 × 400 pixels, PIXIS 400BR; Princeton Instruments, Trenton, NJ, USA). The exposure time for each spectral acquisition with a line illumination was 5 s, and the CCD readout rate was 2 MHz corresponding to the readout time of ~0.3 s. The slit width was set at 20 μm, and the grating of 600 g/mm was used. All raw Raman spectra were calibrated using known lines of ethanol (884, 1,454, and 2,930 cm−1).
In Raman measurements for thin-sliced tissues, the slices were attached on MAS-coated glass coverslips (thickness: 0.16~0.19 mm, Matsunami Glass Ind., Osaka, Japan) after rinsed with PBS twice. Under measurement, the slices were immersed in fresh PBS and Raman spectra/images of them were acquired over the glass coverslip. Hyperspectral Raman images with (x)400 × (y)400 × (λ)1,340 pixels (corresponding to the sample area of 400 × 400 μm2, and detected wavenumber region of 640–3,060 cm−1) and were obtained with an image acquisition time of around 35 min. The CCD gain was set at 2.
For ex vivo Raman imaging, en bloc fresh livers were placed on a sample stage of the microscope, and focal plane was optimized with a glass coverslip (thickness: 0.16~0.19-mm) set gently on the liver. Focus of the objective lens was set to approximately 10 μm beneath the surface of the liver capsules, and hyperspectral Raman images with (x)200 × (y)400 × (λ)1,340 pixels were obtained with an image acquisition time of around 18 min. The CCD gain of 3 was used.
Data processing of Raman spectra
Before spectral analysis and image reconstruction, bias and noise components were removed from the hyperspectral Raman dataset. After the bias and cosmic rays were removed from each spectral frame, singular value decomposition was applied. Four to five components were selected for the singular value decomposition processing. A polynomial curve fitting technique was used to subtract the fluorescence-based background [17, 26]. All processing was performed using MATLAB version R2019a (Mathworks, Natick, MA, USA).
Wes immunoassay
The snap-frozen liver tissues (three (Day 0) and six tissue blocks (Days 1, 3, 7, and 14) from two rats, respectively) were lysed in SDS sample buffer (62.5 mM Tris, 2% sodium deoxycholate, 10% glycerol, pH6.8), and centrifuged for 15 min at 15,000 g at 4°C. Clear supernatants were collected and the protein concentrations of the samples were determined using a BCA assay (FUJIFILM Wako Pure Chemical Corporation, Osaka, Japan). After dilution of the samples to a final concentration of 0.2 mg/mL with 0.1× sample buffer (ProteinSimple, San Jose, CA, USA), Wes immunoassays were performed using the 12–230 kDa Jess/Wess Separation Module (ProteinSimple) [1, 5] according to the manufacturer’s instructions. The primary antibody for adipophilin (1:10, mouse monoclonal antibody, clone: AP125; PROGEN Biotechnik GmbH, Heidelberg, Germany) was used to analyze adipophilin expression. Signal intensities of bands were analyzed using Compass for SW software (v4.1.0; ProteinSimple), and adipophilin expression levels were calculated relative to the total protein levels.
Statistical analysis
Quantitative data of Wes immunoasssay are presented as the mean ± standard deviation. We used the Student’s t-test to analyze the differences in signal intensities. Statistical significance was set at p < 0.05.
Area fractions of lipid droplet and retinol in the liver were expressed as the mean ± standard deviation which were calculated from binarized spatial distributions based on the obtained Raman images. The corresponding Raman images were collected from the thin-sliced tissues of three rats in each group of HFHCD feeding period. All processing was conducted using an open-source program Fiji.
III. Results
Histochemical features of the nascent state of NAFLD
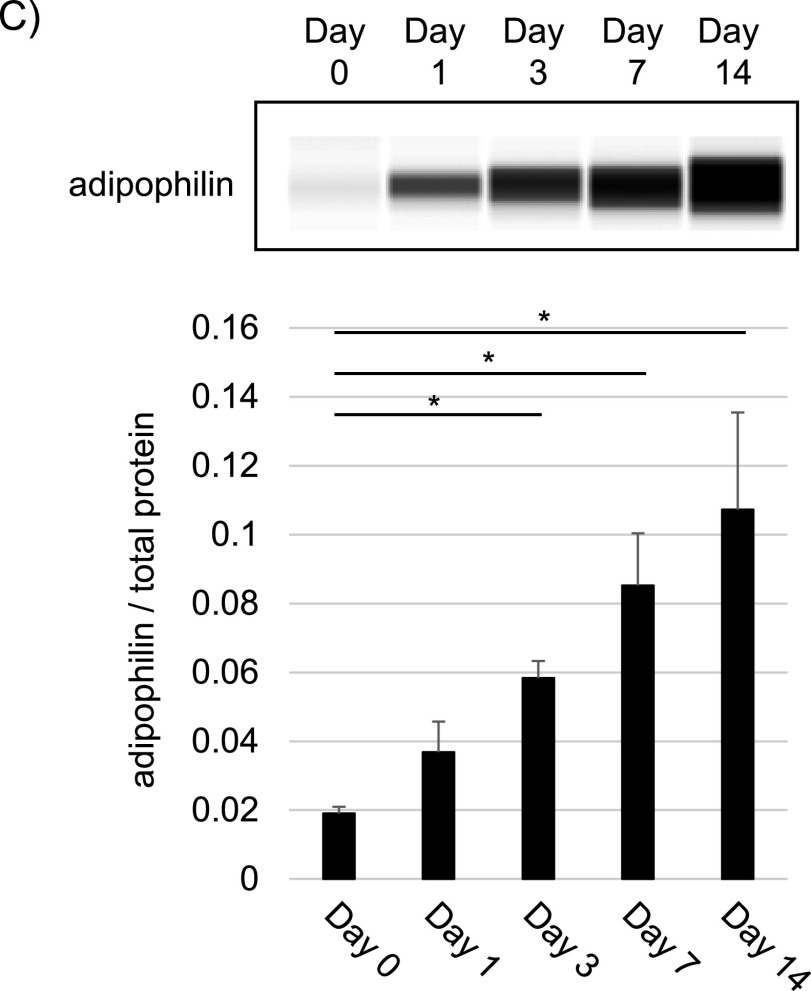
We evaluated the histochemical characteristics of the nascent stages of NAFLD (Fig. 1). Representative H&E-stained images acquired after various HFHCD feeding periods are shown in Fig. 1A. We observed no apparent steatosis on days 0 and 1, hepatocytes with clear cytoplasm were seen on day 3, and macro- and microvesicular LDs were present in hepatocytes on days 7 and 14. With Oil-Red-O staining (Fig. 1B), we identified LDs in hepatocytes on days 1, 3, 7, and 14; on days 7 and 14, the number and area of macro- and microvesicular LDs increased. The expression of adipophilin protein (perilipin 2, ADRP) in NAFLD liver tissues, a known LD marker [10, 27], was evaluated by Wes immunoassay (Fig. 1C). Adipophilin expression increased with the HFHCD feeding period. The total data from the assay are shown in Supplementary Fig. S1.
Fig. 1.
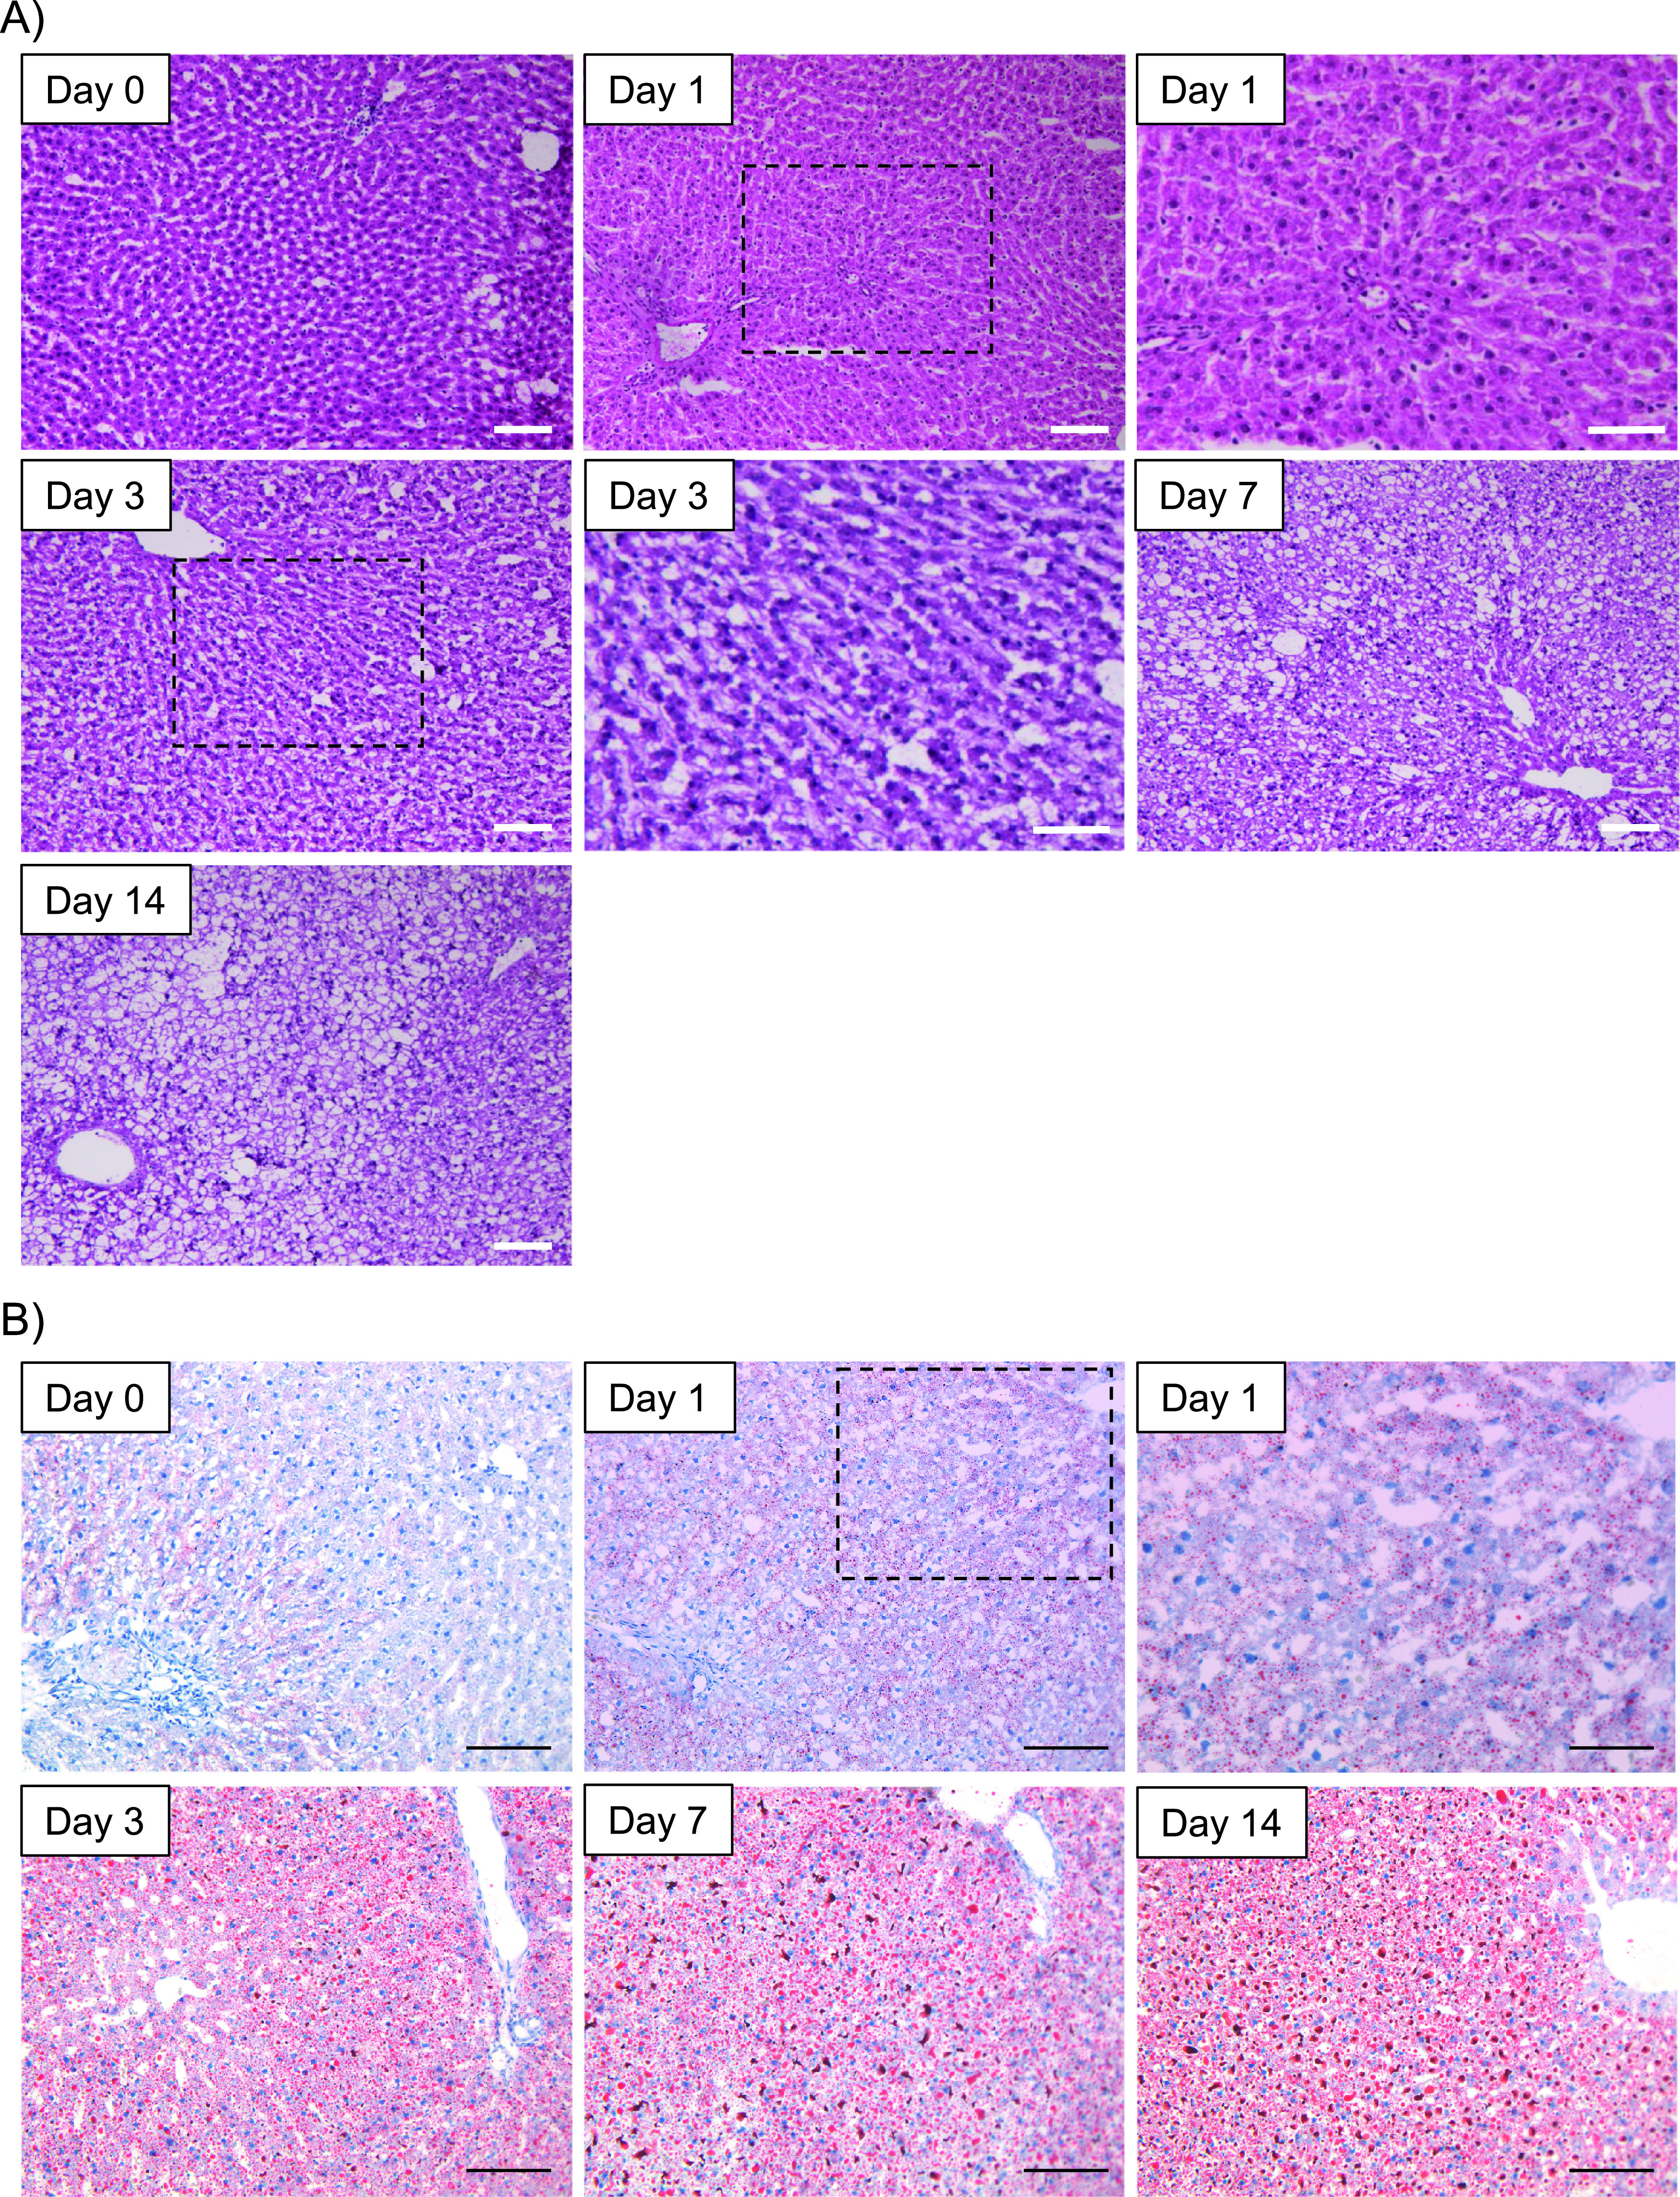
Histochemical analyses of the nascent state of rat non-alcoholic fatty liver disease (NAFLD). (A) Hematoxylin-eosin (H&E)-stained images of livers after feeding a high-fat, high-cholesterol diet (HFHCD) for 0, 1, 3, 7, and 14 days (designated as Days 0, 1, 3, 7, and 14, respectively). The low- and high-power magnification fields for Day 1 and 3 are shown. Bars = 50 μm (upper right panel) and 100 μm (except upper right panel), respectively. (B) Oil Red O-stain images of livers after feeding a HFHCD for 0, 1, 3, 7, and 14 days (designated as Day 0, 1, 3, 7, and 14, respectively). The low- and high-power magnification fields are shown for Day 1. Bars = 50 μm (upper right panel) and 100 μm (except upper right panel), respectively. (C) Representative results of Wes immunoassay of livers using adipophilin antibody (upper panel) and quantification of Wes immunoassay results (lower panel). The expression levels of adipophilin were normalized to total protein expression. Data are presented as mean ± standard deviation. An asterisk indicates a significant difference (p < 0.05) with the Student’s t-test.
Fig. 1.
Continued.
Raman spectra of formalin-fixed liver tissue slices
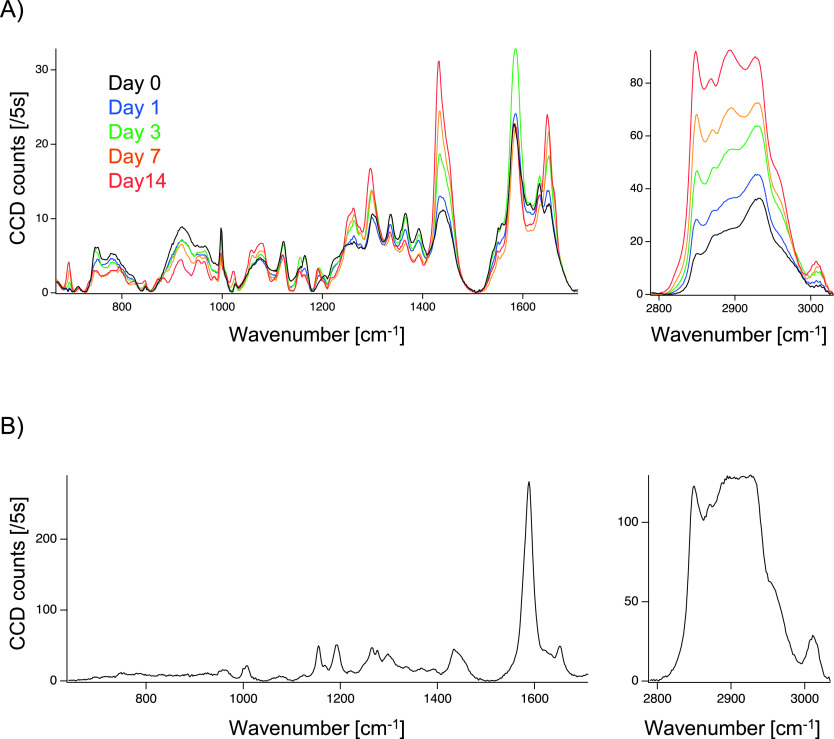
Fig. 2A shows the averaged Raman spectra of the sliced liver tissues acquired at the designated HFHCD feeding periods. Totally 8 × 10⁴ spectra after the spectral data processing were treated were averaged to output each averaged spectrum. Each spectrum included Raman peaks at 697, 1,001, 1,171, 1,298, 1,435, 1,588, 1,650, 2,854 and 2,932 cm−1. The bands at 697, 1,680, and 2,854 cm−1 correspond to cholesterol, protein (amide I), and lipid signals, respectively [4, 6, 7, 11]. Raman peaks of cholesterol and lipids gradually increased with the HFHCD feeding period. We acquired Raman spectra of hepatic sinusoidal walls in a specimen on day 0 and observed characteristic Raman peaks at 1,155, 1,192, and 1,588 cm−1 (Fig. 2B) in the low-wavelength region.
Fig. 2.
Raman spectra of formalin-fixed thin-sliced liver tissues in the nascent state of non-alcoholic fatty liver disease (NAFLD). (A) Averaged Raman spectra of sliced liver tissues after feeding a high-fat, high-cholesterol diet (HFHCD) for 0, 1, 3, 7, and 14 days. The averaged spectrum was calculated from 8.0 × 10⁴ of spectra which were measured with the exposure time of 5 s each. (B) A representative Raman spectrum of a hepatic sinusoidal wall at Day 0 after feeding a HFHCD.
Raman spectral imaging of formalin-fixed liver tissue slices
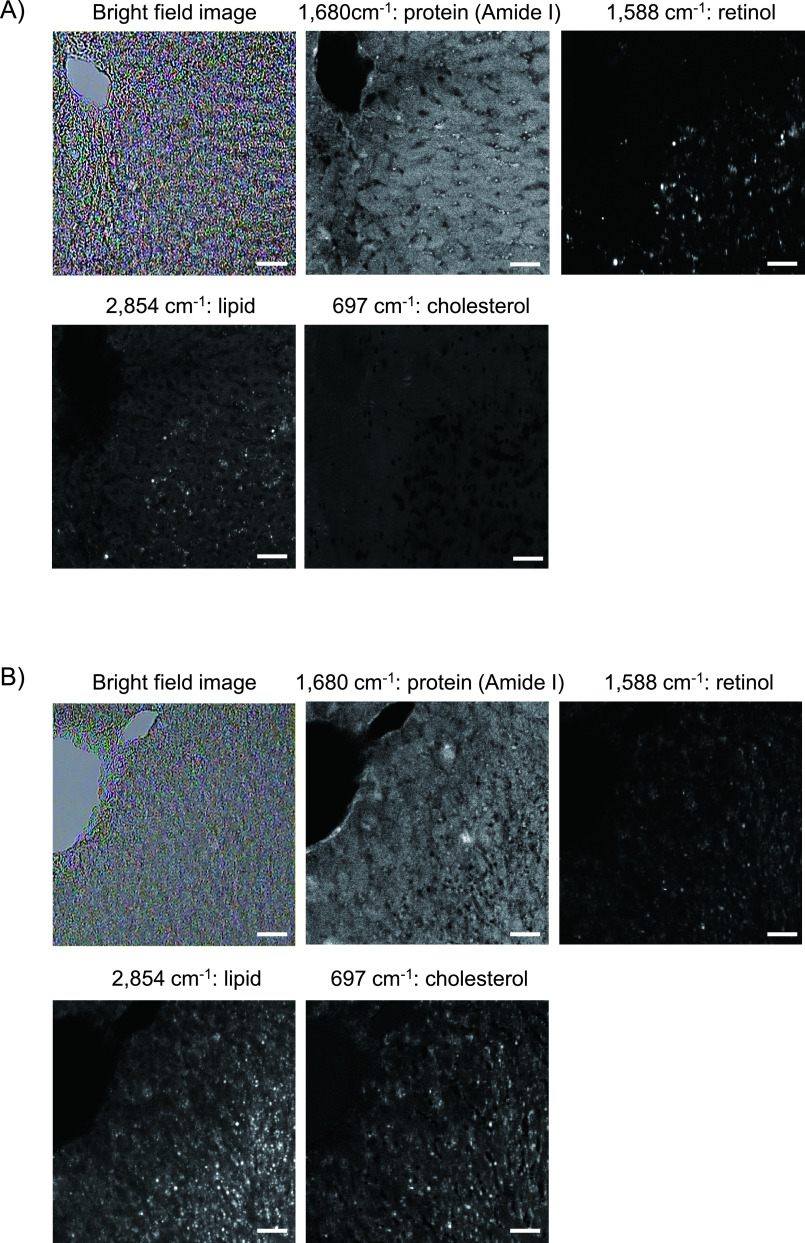
Representative Raman images of sliced liver tissue samples acquired on days 0 and 1 after HFHCD feeding are shown in Fig. 3A and 3B. Raman signals of amide I delineated the cytoplasm of hepatic parenchymal cells and revealed hepatic cell cords. The Raman signals of retinol at 1,588 cm−1 had dot-like structures, and the signal intensity on day 0 was stronger than that on day 1. Most of the Raman signals of lipids on day 0 were located alongside hepatic cords, and those on day 1 were located both in and parallel to hepatic parenchymal cells. Although cholesterol signals were not clearly identified on day 0, cholesterol signals on day 1 were discretely distributed, with a wide distribution in hepatic tissues. Fig. 3C depicts superimposed Raman images of amide I (blue), retinol (green), and lipids (red); the images were acquired on days 0, 1, 3, 7, and 14 of the HFHCD feeding period. Merged dot-like yellowish signals emitted by both retinol and lipids were observed on day 0. Lipid signals increased on day 1, and the intensity of the combined yellowish signals of retinol and lipids decreased. On days 7 and 14, the lipid signals increased considerably. Temporal changes in area with lipid and retinol content after HFHCD feeding in the Raman images are shown in Fig. 3D, expressed as the area fraction on binarized spatial distribution which were reconstructed with the Raman signals at 2,854 and 1,588 cm−1, respectively. As the area with lipid content increased, that of retinol content decreased.
Fig. 3.
Raman microscopic images of formalin-fixed thin-sliced liver tissues in the nascent state of non-alcoholic fatty liver disease (NAFLD). (A) Raman spectral images of amide I (1,680 cm−1), retinol (1,588 cm−1), lipid (2,854 cm−1), and cholesterol (697 cm−1) acquired at Day 0 after feeding a high-fat, high-cholesterol diet (HFHCD). A bright field image is also shown. Bar = 50 μm. (B) A bright field image and Raman spectral images of amide I, retinol, lipid, and cholesterol acquired after feeding a HFHCD for 1 day. Bar = 50 μm. (C) Raman spectral images after 0, 1, 3, 7, and 14 days of HFHCD feeding. Merged Raman images of amide I (blue), retinol (green), and lipid (red) are shown. Bars = 50 μm (Days 0, 1, 3, 7, and 14) and 25 μm (Day 1 (enlarged)). (D) Temporal change in areas with lipid and retinol content in the livers after feeding a HFHCD. Data are presented as mean ± standard deviation of the area fraction of lipid and retinol on binarized spatial distributions which were reconstructed with the Raman signals at 2,854 and 1,588 cm−1, respectively.
Fig. 3.
Continued.
For comparison, we observed an immunofluorescence image of glial fibrillary acidic protein on day 0 (Supplementary Fig. S2), which is a marker of hepatic stellate cells [31]. Spider-like shapes formed by dendritic processes radiating from the cell body of hepatic stellate cells were visualized along the lines with the hepatic cords.
Raman spectra and imaging of fresh ex vivo liver tissues
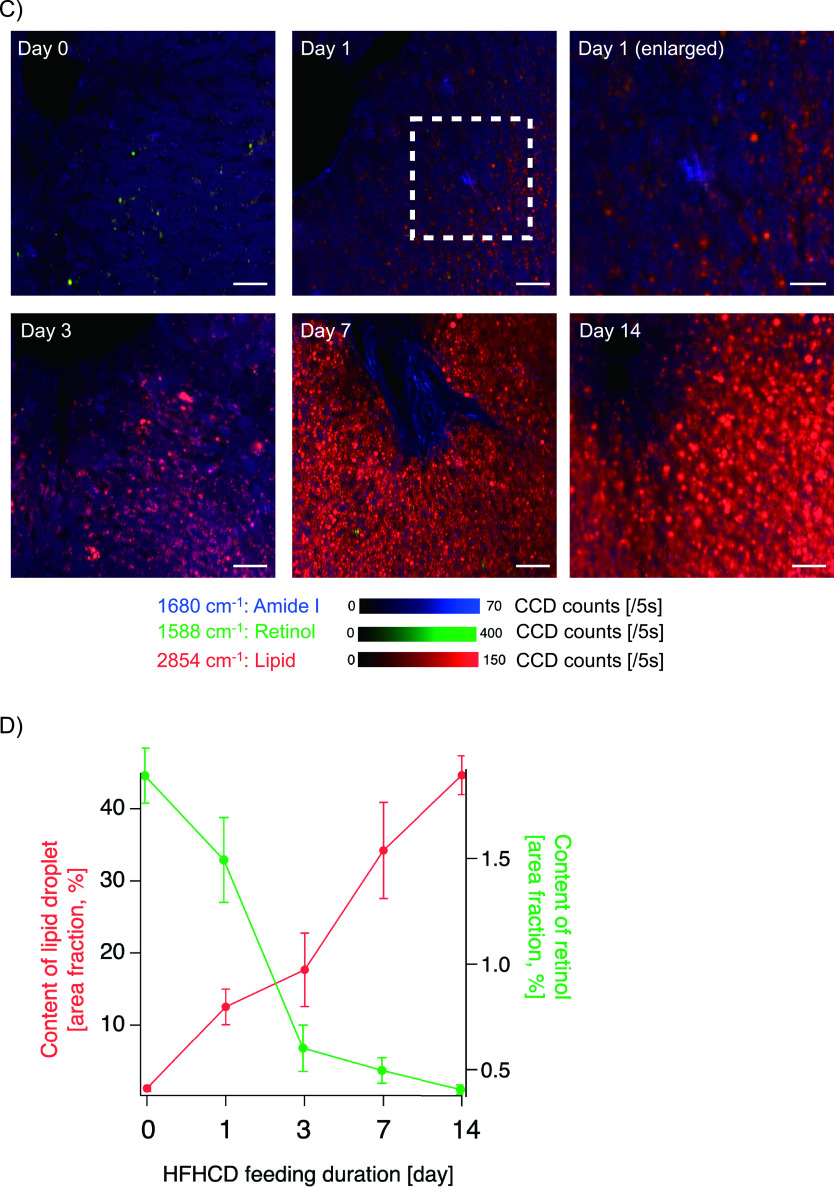
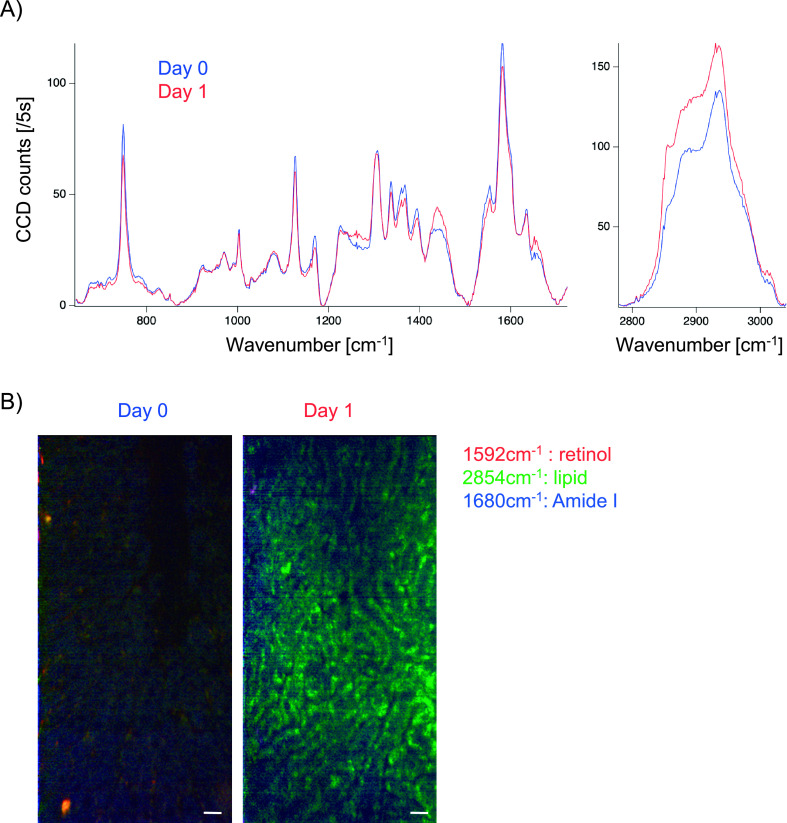
Raman spectra and images measured from the surface of en bloc resected livers on days 0 and 1 after HFHCD feeding are shown in Fig. 4. Averaged Raman spectra (calculated from 1.6 × 10⁵ spectra after the data processing) on days 0 and 1 included bands at 748, 1,001, 1,127, 1,171, 1,308, 1,337, 1,395, 1,439, 1,555, 1,581, 1,635, 2,854 and 2,935 cm−1 (Fig. 4A), and the signal intensities of lipids at 1,439 and 2,854 cm−1 on day 1 were greater than those on day 0. The Raman spectral images acquired approximately 10 μm beneath the surface of the liver capsules are shown in Fig. 4B. Raman signals of lipids at 2,854 cm−1 on day 1 were more evident than those on day 0.
Fig. 4.
Ex-vivo Raman microscopic analysis from the surface of fresh en-bloc liver specimens in the nascent state of non-alcoholic fatty liver disease (NAFLD). (A) Averaged Raman spectra on Days 0 and 1 after feeding a high-fat, high-cholesterol diet (HFHCD). The averaged spectrum was calculated from 1.6 × 10⁵ of spectra. (B) Raman spectral images of amide I (1,680 cm−1), retinol (1,592 cm−1), and lipid (2,854 cm−1) acquired on Days 0 and 1 after feeding a HFHCD. Merged images of amide I (blue), retinol (red), and lipid (green) are shown. Bar = 20 μm.
IV. Discussion
In this study, we demonstrated that Raman imaging is useful for evaluating steatosis and retinol content in formalin-fixed liver tissue slices of nascent NAFLD. We also showed that Raman microscopy is applicable for the ex vivo assessment of lipid deposition in freshly prepared unfixed liver tissue samples from the surface in the early stage of NAFLD. These results indicate that spontaneous Raman microscopy can provide biochemical and morphological information during the early state of rat NAFLD under label-free conditions.
Raman imaging of formalin-fixed thin-sliced tissue specimens revealed hepatic fatty change 1 day after HFHCD feeding (Figs. 1B and 3). In contrast, hepatic steatosis became evident 3 days after HFHCD feeding in H&E-stained sections (Fig. 1A). Although Raman microscopic imaging of biomedical phenomena is difficult owing to low Raman scattering efficiency and the long measurement time required [9, 30, 37], Raman signals of lipid species were so strong that we were able to analyze their changes even in the nascent state of NAFLD tissues. Considering the results in Figs. 1 and 3, the sensitivity of spontaneous Raman microscopy in detecting lipid species in liver tissues was considered to be comparable to that of the Oil Red O staining method.
Raman signals at 1,155, 1,192, and 1,588 cm−1 emitted from hepatic sinusoidal walls were evident in the spectral images of the formalin-fixed tissue specimens (Fig. 2B), and the Raman bands observed at the sinusoidal walls were identical to those of the pure chemical substance retinol: especially, strong Raman peak at around 1,588 cm−1 in liver tissues was proved to be assigned to retinol according to previous studies [11, 14]. The retinol signals at 1,588 cm−1 were co-localized with lipid signals at 2,854 cm−1 on day 0, with yellowish dot signals positive for both retinol and lipids being scattered in the merged image (Fig. 3C). This observation is consistent with the concept that inactivated hepatic stellate cells have LDs, including retinol [2, 29]. Yellowish signals were scarcely seen 14 days after HFHCD feeding; large red dots derived from hepatocytes were diffusely distributed. According to the measurement of areas with signals (Fig. 3D), area under retinol decreased 1 day after HFHCD feeding, whereas hepatic lipid accumulation was induced rapidly (Fig. 3D). This result agreed with previously reported findings by Kochan et al. that retinol content in the liver is a biomarker of a healthy liver [14]. Thus, spontaneous Raman microscopy had a distinctive feature to distinguish LDs in hepatic stellate cells from ones in hepatocytes. The Oil Red O staining method does not have such a property.
We succeeded in acquiring Raman images with resolution at the cellular level from formalin-fixed thin-sliced tissue sections (Fig. 3A and 3B). Our confocal Raman microscope with a line illumination and parallel detection system enabled the acquisition of high-resolution two-dimensional images with a short acquisition time [7, 22]. Previously, we acquired Raman mapping data having area 95 μm × 345 μm (20 × 70 pixels) via point-by-point scanning with a 5 μm step on the cut surfaces of unfixed liver samples and 1 s exposure time [11], and the image acquisition time via the scanning mode was so long that we failed to obtain high-resolution images of the samples. As clinically obtained specimens are usually fixed with formalin, the procedure employed in the current study would be helpful for the analysis of human-excised specimens at the cellular level.
Here, we focused on nascent NAFLD in the present study, because it is important to figure out what happens in the liver at the onset of NAFLD. The mechanisms underlying the development of NAFLD are complicated. The concept of multiple parallel hits hypothesis has been proposed as a mechanism for the onset and progression of NAFLD, in which numerous factors such as genetic predisposition, lipid metabolism, oxidative stress, endoplasmic reticulum stress, and intestinal environment are involved in a simultaneous complex manner [32, 33], however, precise mechanisms of NAFLD development especially is still undetermined. Through an analysis using spontaneous Raman microscopy combined with other modalities, we expect to elucidate mechanisms of the occurrence of NAFLD.
In addition to the formalin-fixed thin slices, we acquired Raman spectral measurements of fresh ex vivo liver tissues from the surface (Fig. 4). Some of the Raman bands of the fresh unfixed tissues were not identical to those of the formalin-fixed tissues (Fig. 2A); Raman band intensities of the reduced heme protein at 750 and 1,127 cm−1 were strong in the unfixed tissues. It has been reported that aldehyde fixation decreases the Raman peaks of the reduced heme protein [24]. When we compared the images of fresh ex vivo liver samples to those of fixed thin-sliced samples, the resolution of the Raman images of the former was lower than that of the latter. It is expected that further studies using a Raman microscope with a higher spatial resolving power in the z-axis would provide clearer Raman images of thick samples.
We used a rat model of HFHCD-induced NAFLD, which has been reported to develop NASH with liver steatosis, inflammation, and fibrosis after 12-week feeding [25]. In our study, we observed mild hepatic steatosis within 1 day of HFHCD feeding. As HFHCD contains cholate, a hepatotoxic agent, the model might induce hepatic degeneration and injury sooner than expected. Further studies using other animal models of NAFLD, without cholate, are required.
In conclusion, we studied the Raman spectral properties of the nascent state of NAFLD and observed sequential changes in Raman images during NAFLD development. To the best of our knowledge, this is the first report to show Raman spectral changes in the very early stages of NAFLD. We believe that our study highlights the potential of spontaneous Raman microscopy for label-free assessment of NAFLD.
V. Conflicts of Interest
The authors have nothing to disclose.
VI. Acknowledgments
This work was partly supported by the Japan Society for the Promotion of Science [20K12604, 20K15195]; and the Japan Science and Technology Agency [JPMJCR1662, JPMJCR1925].
Supplementary Materials
VII. References
- 1.Beekman, C., Janson, A. A., Baghat, A., van Deutekom, J. C. and Datson, N. A. (2018) Use of capillary Western immunoassay (Wes) for quantification of dystrophin levels in skeletal muscle of healthy controls and individuals with Becker and Duchenne muscular dystrophy. PLoS One 13; e0195850. [DOI] [PMC free article] [PubMed] [Google Scholar]
- 2.Blaner, W. S., O’Byrne, S. M., Wongsiriroj, N., Kluwe, J., D’Ambrosio, D. M., Jiang, H., et al. (2009) Hepatic stellate cell lipid droplets: a specialized lipid droplet for retinoid storage. Biochim. Biophys. Acta 1791; 467–473. [DOI] [PMC free article] [PubMed] [Google Scholar]
- 3.Chalasani, N., Younossi, Z., Lavine, J. E., Charlton, M., Cusi, K., Rinella, M., et al. (2018) The diagnosis and management of nonalcoholic fatty liver disease: Practice guidance from the American Association for the Study of Liver Diseases. Hepatology 67; 328–357. [DOI] [PubMed] [Google Scholar]
- 4.Czamara, K., Majzner, K., Pacia, M. Z., Kochan, K., Kaczor, A. and Baranska, M. (2015) Raman spectroscopy of lipids: a review. J. Raman Spectrosc. 46; 4–20. [Google Scholar]
- 5.Demirel, E., Arnold, C., Garg, J., Jäger, M. A., Sticht, C., Li, R., et al. (2021) RGS5 Attenuates Baseline Activity of ERK1/2 and Promotes Growth Arrest of Vascular Smooth Muscle Cells. Cells 10; 1748. [DOI] [PMC free article] [PubMed] [Google Scholar]
- 6.Fujita, K. and Smith, N. I. (2008) Label-free molecular imaging of living cells. Mol. Cells 26; 530–535. [PubMed] [Google Scholar]
- 7.Hamada, K., Fujita, K., Smith, N. I., Kobayashi, M., Inouye, Y. and Kawata, S. (2008) Raman microscopy for dynamic molecular imaging of living cells. J. Biomed. Opt. 13; 044027. [DOI] [PubMed] [Google Scholar]
- 8.Harada, Y., Dai, P., Yamaoka, Y., Ogawa, M., Tanaka, H., Nosaka, K., et al. (2009) Intracellular dynamics of topoisomerase I inhibitor, CPT-11, by slit-scanning confocal Raman microscopy. Histochem. Cell Biol. 132; 39–46. [DOI] [PubMed] [Google Scholar]
- 9.Harada, Y. and Takamatsu, T. (2013) Raman molecular imaging of cells and tissues: towards functional diagnostic imaging without labeling. Curr. Pharm. Biotechnol. 14; 133–140. [PubMed] [Google Scholar]
- 10.Heid, H. W., Moll, R., Schwetlick, I., Rackwitz, H. R. and Keenan, T. W. (1998) Adipophilin is a specific marker of lipid accumulation in diverse cell types and diseases. Cell Tissue Res. 294; 309–321. [DOI] [PubMed] [Google Scholar]
- 11.Helal, K. M., Taylor, J. N., Cahyadi, H., Okajima, A., Tabata, K., Itoh, Y., et al. (2019) Raman spectroscopic histology using machine learning for nonalcoholic fatty liver disease. FEBS Lett. 593; 2535–2544. [DOI] [PubMed] [Google Scholar]
- 12.Ikemoto, K., Hashimoto, K., Harada, Y., Kumamoto, Y., Hayakawa, M., Mochizuki, K., et al. (2021) Raman Spectroscopic Assessment of Myocardial Viability in Langendorff-Perfused Ischemic Rat Hearts. Acta Histochem. Cytochem. 54; 65–72. [DOI] [PMC free article] [PubMed] [Google Scholar]
- 13.Kawai, S., Takagi, Y., Kaneko, S. and Kurosawa, T. (2011) Effect of three types of mixed anesthetic agents alternate to ketamine in mice. Exp. Anim. 60; 481–487. [DOI] [PubMed] [Google Scholar]
- 14.Kochan, K., Marzec, K., Maslak, E., Chlopicki, S. and Baranska, M. (2015) Raman spectroscopic studies of vitamin A content in the liver: a biomarker of healthy liver. Analyst 140; 2074–2079. [DOI] [PubMed] [Google Scholar]
- 15.Kochan, K., Kus, E., Szafraniec, E., Wislocka, A., Chlopicki, S. and Baranska, M. (2017) Changes induced by non-alcoholic fatty liver disease in liver sinusoidal endothelial cells and hepatocytes: spectroscopic imaging of single live cells at the subcellular level. Analyst 142; 3948–3958. [DOI] [PubMed] [Google Scholar]
- 16.Kumamoto, Y., Harada, Y., Takamatsu, T. and Tanaka, H. (2018) Label-free Molecular Imaging and Analysis by Raman Spectroscopy. Acta Histochem. Cytochem. 51; 101–110. [DOI] [PMC free article] [PubMed] [Google Scholar]
- 17.Lieber, C. A. and Mahadevan-Jansen, A. (2003) Automated method for subtraction of fluorescence from biological Raman spectra. Appl. Spectrosc. 57; 1363–1367. [DOI] [PubMed] [Google Scholar]
- 18.Ludwig, J., Viggiano, T. R., McGill, D. B. and Oh, B. J. (1980) Nonalcoholic steatohepatitis: Mayo Clinic experiences with a hitherto unnamed disease. Mayo Clin. Proc. 55; 434–438. [PubMed] [Google Scholar]
- 19.Minamikawa, T., Harada, Y. and Takamatsu, T. (2015) Ex vivo peripheral nerve detection of rats by spontaneous Raman spectroscopy. Sci. Rep. 5; 17165. [DOI] [PMC free article] [PubMed] [Google Scholar]
- 20.Minamikawa, T., Ichimura-Shimizu, M., Takanari, H., Morimoto, Y., Shiomi, R., Tanioka, H., et al. (2020) Molecular imaging analysis of microvesicular and macrovesicular lipid droplets in non-alcoholic fatty liver disease by Raman microscopy. Sci. Rep. 10; 1–9. [DOI] [PMC free article] [PubMed] [Google Scholar]
- 21.Nishiki-Muranishi, N., Harada, Y., Minamikawa, T., Yamaoka, Y., Dai, P., Yaku, H., et al. (2014) Label-free evaluation of myocardial infarction and its repair by spontaneous Raman spectroscopy. Anal. Chem. 86; 6903–6910. [DOI] [PubMed] [Google Scholar]
- 22.Ogawa, M., Harada, Y., Yamaoka, Y., Fujita, K., Yaku, H. and Takamatsu, T. (2009) Label-free biochemical imaging of heart tissue with high-speed spontaneous Raman microscopy. Biochem. Biophys. Res. Commun. 382; 370–374. [DOI] [PubMed] [Google Scholar]
- 23.Ohira, S., Tanaka, H., Harada, Y., Minamikawa, T., Kumamoto, Y., Matoba, S., et al. (2017) Label-free detection of myocardial ischaemia in the perfused rat heart by spontaneous Raman spectroscopy. Sci. Rep. 7; 42401. [DOI] [PMC free article] [PubMed] [Google Scholar]
- 24.Okada, M., Smith, N. I., Palonpon, A. F., Endo, H., Kawata, S., Sodeoka, M., et al. (2012) Label-free Raman observation of cytochrome c dynamics during apoptosis. Proc. Natl. Acad. Sci. U S A 109; 28–32. [DOI] [PMC free article] [PubMed] [Google Scholar]
- 25.Okada, Y., Yamaguchi, K., Nakajima, T., Nishikawa, T., Jo, M., Mitsumoto, Y., et al. (2013) Rosuvastatin ameliorates high-fat and high-cholesterol diet-induced nonalcoholic steatohepatitis in rats. Liver Int. 33; 301–311. [DOI] [PubMed] [Google Scholar]
- 26.Palonpon, A. F., Ando, J., Yamakoshi, H., Dodo, K., Sodeoka, M., Kawata, S., et al. (2013) Raman and SERS microscopy for molecular imaging of live cells. Nat. Protoc. 8; 677–692. [DOI] [PubMed] [Google Scholar]
- 27.Pawella, L. M., Hashani, M., Eiteneuer, E., Renner, M., Bartenschlager, R., Schirmacher, P., et al. (2014) Perilipin discerns chronic from acute hepatocellular steatosis. J. Hepatol. 60; 633–642. [DOI] [PubMed] [Google Scholar]
- 28.Raman, C. V. and Krishnan, K. S. (1928) A new type of secondary radiation. Nature 121; 501–502. [Google Scholar]
- 29.Senoo, H., Yoshikawa, K., Morii, M., Miura, M., Imai, K. and Mezaki, Y. (2010) Hepatic stellate cell (vitamin A-storing cell) and its relative—past, present and future. Cell Biol. Int. 34; 1247–1272. [DOI] [PubMed] [Google Scholar]
- 30.Shetty, G., Kendall, C., Shepherd, N., Stone, N. and Barr, H. (2006) Raman spectroscopy: elucidation of biochemical changes in carcinogenesis of oesophagus. Br. J. Cancer 94; 1460–1464. [DOI] [PMC free article] [PubMed] [Google Scholar]
- 31.Tennakoon, A. H., Izawa, T., Wijesundera, K. K., Golbar, H. M., Tanaka, M., Ichikawa, C., et al. (2013) Characterization of glial fibrillary acidic protein (GFAP)-expressing hepatic stellate cells and myofibroblasts in thioacetamide (TAA)-induced rat liver injury. Exp. Toxicol. Pathol. 65; 1159–1171. [DOI] [PubMed] [Google Scholar]
- 32.Tilg, H. and Moschen, A. R. (2010) Evolution of inflammation in nonalcoholic fatty liver disease: the multiple parallel hits hypothesis. Hepatology 52; 1836–1846. [DOI] [PubMed] [Google Scholar]
- 33.Tilg, H., Adolph, T. E. and Moschen, A. R. (2021) Multiple Parallel Hits Hypothesis in Nonalcoholic Fatty Liver Disease: Revisited After a Decade. Hepatology 73; 833–842. [DOI] [PMC free article] [PubMed] [Google Scholar]
- 34.Wanless, I. R. and Lentz, J. S. (1990) Fatty liver hepatitis (steatohepatitis) and obesity: an autopsy study with analysis of risk factors. Hepatology 12; 1106–1110. [DOI] [PubMed] [Google Scholar]
- 35.Yamamoto, T., Minamikawa, T., Harada, Y., Yamaoka, Y., Tanaka, H., Yaku, H., et al. (2018) Label-free Evaluation of Myocardial Infarct in Surgically Excised Ventricular Myocardium by Raman Spectroscopy. Sci. Rep. 8; 14671. [DOI] [PMC free article] [PubMed] [Google Scholar]
- 36.Younossi, Z. M., Koenig, A. B., Abdelatif, D., Fazel, Y., Henry, L. and Wymer, M. (2016) Global epidemiology of nonalcoholic fatty liver disease-Meta-analytic assessment of prevalence, incidence, and outcomes. Hepatology 64; 73–84. [DOI] [PubMed] [Google Scholar]
- 37.Zhang, G., Moore, D. J., Sloan, K. B., Flach, C. R. and Mendelsohn, R. (2007) Imaging the prodrug-to-drug transformation of a 5-fluorouracil derivative in skin by confocal Raman microscopy. J. Invest. Dermatol. 127; 1205–1209. [DOI] [PubMed] [Google Scholar]
Associated Data
This section collects any data citations, data availability statements, or supplementary materials included in this article.


