

Abstract
Background
We aimed to reveal the mechanism of functional constipation in the treatment of Atractylodes macrocephala Koidz. (AMK) and Paeonia lactiflora Pall. (PLP).
Methods
The main active ingredients of AMK and PLP were screened by the Traditional Chinese Medicine Systems Pharmacology (TCMSP) platform. A database of functional constipation targets was established by GeneCard and OMIM. An “ingredient‐target” network map was constructed with Cytoscape software (version 3.7.1), and molecular docking analysis was performed on the components and genes with the highest scores. The rats in the normal group were given saline, and those in the other groups were given 10 mg/kg diphenoxylate once a day for 14 days. The serum and intestinal tissue levels of adenosine monophosphate (cAMP), protein kinase A (PKA), and adenylyl cyclase (AC) of the rats and aquaporin (AQP)1, AQP3, and AQP8 were measured.
Results
AMK and PLP had a significant role in the regulation of targets in the treatment of functional constipation. After treatment with AMK, PLP, or mosapride, the serum and intestinal tissue levels of AC, cAMP, and PKA were significantly downregulated. Groups receiving AMK and PLP or mosapride exhibited a reduction in the level of AQP1, AQP3, and AQP8 to varying degrees.
Conclusion
Molecular docking analysis revealed that AMK and PLP had a significant role in the regulation of targets in the treatment of functional constipation. Studies have confirmed that AMK and PLP can also affect AC, cAMP, and PKA. AC, cAMP, and PKA in model rats were significantly downregulated. AQP expression is closely related to AC, cAMP, and PKA. AMK and PLP can reduce the expression of AQP1, AQP3, and AQP9 in the colon of constipated rats.
Keywords: coupling of AMK and PLP, functional constipation, mechanism, network pharmacology
The intersection indicates a gene shared by two or three substances. The Venn diagAMK of the visualized relationship between PLP, AMK and functional constipation shows that PLP and AMK contain 30 common chemical constituents, PLP and functional constipation contain 76 common chemical constituents and AMK and functional constipation contain 24 common chemical constituents of which the three together contain 21 kinds of chemical compositions. To organize the active ingredients and targets of the two drugs, the components and targets of the two traditional Chinese medicines were imported into Cytoscape 3.7.1 to construct the basic adjustment and visualization of the traditional Chinese medicine compound‐target network.

1. INTRODUCTION
Constipation is a common clinical symptom with a prevalence rate of approximately 20% in the general population. 1 It refers to having fewer than 2–3 bowel movements a week, a bowel movement time of more than 30 min, and stool that is dry and solid, and of a small amount. 2 Functional constipation is a multigene and multifactorial disease. According to a population‐based study on bowel habits in a Korean community, the prevalence of self‐reported constipation was 16.5% and the prevalence of functional constipation was 9.2%. 3 Clinically, there have been good short‐term results in Western medicine and various colon operations, but poor long‐term results. Hemicolectomy increases stool frequency and reduces laxative use, with long‐term success ranging from 34% to 70%. 4 The therapeutic effect of traditional Chinese medicine is remarkable and long lasting; therefore, many clinics use Chinese medicine to treat constipation. PLP is the most commonly used Chinese herbal medicine to treat constipation. 5 Atractylodes macrocephala rhizoma is the dry rhizome of AMK, and Paeonia radix alba is the dried root of PLP. 6 PLP contains monoterpenes, including paeoniflorin. 7 The volatile oil of AMK is an effective component that acts on the gastrointestinal tract. At present, related studies have shown the effect of AMK and PLP on clinical constipation. 8 The Compendium of Materia Medica says “The combination of PLP and AMK can relieve abdominal pain.” AMK combined with PLP has been reported to be effective in the treatment of ulcerative colitis complicated with hepatosplenic disease syndrome. 9 The combined application of PLP and AMK gives a better therapeutic effect; however, there is no report on the specific mechanism of the 2 drugs.
Network pharmacology can be used to guide and to assist drug repositioning, 10 and a powerful network method can identify effective combination therapies in drug development. 11 With the advent of large‐scale data acquisition, network analysis has become an attractive tool to study the organization of complex systems and the interrelationships between their constituent entities in various fields of science. 12 In this study, the method of network pharmacology was used to predict the mechanism of the combination of AMK and PLP in the treatment of functional constipation. Network analysis identified 30 active components and 21 potential targets for functional constipation. The experimental results verified that, with the treatment with AMK and PLP, the levels of AC, cAMP, and PKA in the serum and intestinal tissue of model rats were significantly downregulated, and functional constipation was effectively treated.
2. MATERIALS AND METHODS
2.1. Compound collection and screening
In Traditional Chinese Medicine Systems Pharmacology (TCMSP), we retrieved information on the chemical composition of AMK and PLP. 13 The screening conditions were set as oral bioavailability (OB) > 30% and drug likelihood (DL) > 0.1 that the active ingredients of AMK and PLP were obtained. 14 The AMK and PLP gene targets were obtained from the UniProt database (https://www.Uniprot.org/Uniprot/).
2.2. Disease‐related targets
The gene of functional constipation was searched and screened by the GeneCard database (https://www.genecards.org/) and OMIM database (https://www.omim.org/), and duplicate targets were deleted. The target prediction results of AMK and PLP match the retrieval results of functional‐constipation‐related targets. Overlapping targets were selected as the related targets of AMK and PLP for the treatment of functional constipation, which might be the target set of AMK and PLP in the treatment of functional constipation. The active ingredient targets and the disease targets of functional constipation were mapped with the Bioinformatics (http://www.bioinformatics.com.cn/) online tool, and Venn diagrams were constructed.
2.3. Construction of drug active ingredients and disease target network
The active components and AMK and PLP target network of functional constipation were constructed in the Cytoscape 3.7.1 software. 15 It was assumed that the more directly connected nodes are to each other, the greater the influence.
2.4. Protein–protein interaction (PPI) network construction
The common gene targets of functional constipation and AMK and PLP were imported into the STRING database (https://string‐db.org/), with confidence levels defined as follows: low confidence, <0.4; middle confidence, 0.4–0.7; high confidence, >0.7. 16 To perform protein interaction network analysis and download the results in TSV format, the file was imported into Cytoscape 3.7.1; moreover, topology attribute analysis was performed. 17 The top 20 items with the highest enrichment on GO and KEGG analysis were analyzed with a variety of bioinformatic analyses. 18
2.5. GO and KEGG enrichment analysis
Functional constipation and AMK and PLP of the enrichment rankings were downloaded through the DAVID database (https://david.ncifcrf.gov). A variety of bioinformatic analyses and visualization of the results can be achieved using the Bioinformatics (http://www.bioinformatics.com.cn/) online tool.
2.6. Component‐target molecular docking
The 3‐dimensional (3D) structure of the top 6 targets in the PPI network was downloaded from the RCSB PDB database (https://www.rcsb.org/). The TCMSP database was used to download the two‐dimensional (2D) structures of the top 4 compounds of the 2 Chinese medicines, respectively. AutoDock Tools 1.5.6 was used to dock small molecules with protein. The ligand was set to be flexible, and the receptor was rigid. The conformation with the best affinity was selected as the final docking conformation and visualized in PyMol 2.2.0.
2.7. Animals
Thirty‐six 8‐ to 9‐week‐old Sprague Dawley (SD) rats weighing 200 ± 20 g were purchased from the Animal Experimental Center of Zhejiang Chinese Medicine University. They were raised in the Animal Experimental Center of Zhejiang Chinese Medicine University. The operations of experimental animals should follow the “Regulations of the People’s Republic of China on the Management of Laboratory Animals” and the operating guidelines of the Laboratory Animal Center of Zhejiang Chinese Medicine University. This experiment was reviewed and approved by the animal ethics committee of Zhejiang Chinese Medicine University (ZSLL‐2014‐196). The NO kit for rats was provided by Shanghai Zhenke Biotechnology Co., Ltd.
2.8. Modeling
Thirty‐six SD rats reared adaptively. A week later, on the basis of the random number table method, they were divided into 6 groups: the normal group, model group, control (mosapride) group, and the high‐, middle‐, and low‐dose AMK and PLP groups. The animals in the other 5 groups were used to establish models of chronic functional constipation based on the literature, except the animals in the normal group. The rats in the other 5 groups were given 10 mg/kg compound diphenoxylate once a day for 14 continuous days. The rats in the normal group were given saline of the same volume every other day for 14 continuous days. After that, 0.3 ml/40 g of prepared Chinese ink was given to each rat. The levels of cAMP, PKA, and AC in rats in each group were measured.
2.9. Treatment plan
In the mosapride treatment group, mosapride dispersible tablets were ground into a 0.15 mg/ml suspension before use. Each rat was given 2 ml by continuous intragastric administration for 3 days as a course of treatment, and 2 courses of treatment in a row. In the groups treated with the combination of AMK and WP, proper amounts of raw AMK and PLP (1:1) were added, and water was added for decocting 2 times. The first time, 5 times the amount of water was added and raw AMK and PLP were soaked for 0.5 h and decocted for 1.5 h. The second time, 2.5 times the amount of water was added, and the mixture was boiled for 1 h. Finally, we combined the 2 decoctions, and filtered and concentrated the filtrate under reduced pressure to 0.6, 1.2, and 1.8 g/ml, respectively. In the groups that were fed high, middle, and low doses of AMK and PLP, the daily doses of the rats were 6, 12, 18 g/kg, and 2 ml per mouse, respectively. The 3 groups were intragastric administration continuously for 3 days as a course of treatment, with 2 courses of treatment in a row.
2.10. Levels of AC, cAMP, and PKA in rat tissue fluid and blood
The abdominal cavity of the rat was opened after anesthetization. The abdominal aorta was found and then blood was taken. The plasma was placed in a 4°C environment for 1 h, and then centrifuged at 10 000 rpm for 10 min in a centrifuge. The supernatant was collected and stored in a −80°C refrigerator. The proximal colon was cut 5–8 mm, and the intestinal contents and blood were rinsed with normal saline at 4°C, fixed in 4% paraformaldehyde, and stored at room temperature. The ELISA kit of Shanghai Boying Biotechnology Co., Ltd., was used to measure the levels of AC, cAMP, and PKA in rat tissue fluid and blood, according to the manufacturer’s instructions.
2.11. Levels of AQP1, AQP3, and AQP8
The slices were placed in an oven at 60°C for 2 h, then dewaxed and washed with distilled water for 2 min. For high‐pressure heat repair, distilled water was put under high pressure and repair solution was added according to the volume of the slices. The solution was cooked to a boil, under pressure, for 2 min, and then cooled with distilled water. Hydrogen peroxide was blocked by 3% peroxidase. The samples were washed with PBS for 3 min, 3 times, then primary antibody was added; this was repeated twice. The samples were stained with DAB for 2 min, then counterstained and mounted, for analysis with Image‐Pro Plus 6.0 software. The results obtained in the experiment are expressed as mean ± standard deviation, and SPSS17.0 software was used for statistical analysis.
3. RESULTS
3.1. Chemical components and targets of AMK and PLP
There were 14 potential active ingredients indicated for AMK and 16 potential active ingredients for PLP in the TCMSP database (Table 1). A total of 216 potential active ingredient targets were obtained, duplicates were deleted, and 134 potential active targets were retained in the UniProt (https://www.Uniprot.org/) database. Among these, there were 36 potential active ingredient targets of AMK and 98 potential active ingredient targets of PLP.
TABLE 1.
Prediction of possible pharmacodynamic components of AMK and PLP
| Medicinal herbs | TCMSP MOL ID | Active ingredient | OB (%) | DL (%) |
|---|---|---|---|---|
| AMK | MOL000045 | Atractylenolide III | 68.11 | 0.17 |
| MOL000022 | 14‐Acetyl‐12‐senecioyl‐2E,8Z,10E‐atractylentriol | 63.37 | 0.3 | |
| MOL000020 | 12‐Senecioyl‐2E,8E,10E‐atractylentriol | 62.4 | 0.22 | |
| MOL000021 | 14‐Acetyl‐12‐senecioyl‐2E,8E,10E‐atractylentriol | 60.31 | 0.31 | |
| MOL000049 | 3β‐Acetoxyatractylone | 54.07 | 0.22 | |
| MOL000066 | Alloaromadedrene | 53.46 | 0.1 | |
| MOL000025 | α‐Longipinene | 53.26 | 0.12 | |
| MOL000057 | DIBP | 49.63 | 0.13 | |
| MOL000044 | Atractylenolide II | 47.5 | 0.15 | |
| MOL000046 | Atractylone | 41.1 | 0.13 | |
| MOL000028 | α‐Amyrin | 39.51 | 0.76 | |
| MOL000043 | Atractylenolide I | 37.37 | 0.15 | |
| MOL000033 | (3S,8S,9S,10R,13R,14S,17R)‐10,13‐Dimethyl‐17‐[(2R,5S)‐5‐propan‐2‐yloctan‐2‐yl]‐2,3,4,7,8,9,11,12,14,15,16,17‐Dodecahydro‐1H‐cyclopenta[a]phenanthren‐3‐ol | 36.23 | 0.78 | |
| MOL000072 | 8β‐Ethoxy atractylenolide III | 35.95 | 0.21 | |
| PLP | MOL001918 | Paeoniflorgenone | 87.59 | 0.37 |
| MOL001925 | Paeoniflorin_qt | 68.18 | 0.4 | |
| MOL001928 | Albiflorin_qt | 66.64 | 0.33 | |
| MOL001910 | 11alpha,12alpha‐Epoxy‐3beta‐23‐dihydroxy‐30‐norolean‐20‐en‐28,12beta‐olide | 64.77 | 0.38 | |
| MOL000676 | DBP | 64.54 | 0.13 | |
| MOL000612 | (−)‐alpha‐Cedrene | 55.56 | 0.1 | |
| MOL000211 | Mairin | 55.38 | 0.78 | |
| MOL000492 | (+)‐Catechin | 54.83 | 0.24 | |
| MOL001924 | Paeoniflorin | 53.87 | 0.79 | |
| MOL001921 | Lactiflorin | 49.12 | 0.8 | |
| MOL001919 | (3S,5R,8R,9R,10S,14S)‐3,17‐Dihydroxy‐4,4,8,10,14‐Pentamethyl‐2,3,5,6,7,9‐hexahydro‐1H‐cyclopenta[a]phenanthrene‐15,16‐dione | 43.56 | 0.53 | |
| MOL001889 | Methyl linolelaidate | 41.93 | 0.17 | |
| MOL000422 | Kaempferol | 41.88 | 0.24 | |
| MOL000358 | Beta‐Sitosterol | 36.91 | 0.75 | |
| MOL000359 | Sitosterol | 36.91 | 0.75 | |
| MOL001930 | Benzoyl paeoniflorin | 31.27 | 0.75 |
3.2. Putative targets of functional constipation
In the GeneCards database, there were 4559 targets related to the disease. In the OMIM database, there were 27 targets related to diseases. The duplicates were deleted, and 4583 targets related to functional constipation were retained.
3.3. Network construction
We selected 21 common target genes of potential active component target genes and disease target genes through the R software data package. The active ingredient targets and the disease targets of functional constipation were mapped using Bioinformatics online tool, and Venn diagrams were constructed (Figure 1). The intersection indicates genes shared by 2 or 3 substances. The Venn diagram of the visualized relationship between PLP, AMK, and functional constipation shows that PLP and AMK contain 30 common chemical constituents, PLP and functional constipation contain 76 common chemical constituents, and AMK and functional constipation contain 24 common chemical constituents, while the 3 together share 21 chemical constituents. A visualization of the traditional Chinese medicine compound‐target network in the Cytoscape 3.7.1 software is shown in Figure 2. This figure shows the correlation between drugs, ingredients, and genes.
FIGURE 1.

Venn diagram of the effect of AMK and PLP combined with functional constipation
FIGURE 2.

Visualization of the Chinese herbal compound ingredient‐target network
3.4. Protein–protein interaction data
There were 21 common target genes selected under step 2.3 of the article title. We uploaded them to the STRING database and checked “Homo sapiens”. We select the “minimum required interaction score” to set the confidence level to be greater than 0.4. The ingredient‐target network in the Cytoscape 3.7.1 software is shown in Figure 3. Among the 21 common genes, 1 gene was eliminated, and 20 genes were retained and sorted according to node correlation. According to the analysis of the PPI network, we knew that the number of nodes was 2, the number of edges was 51, and the average node degree was 4.86. The analysis information data were imported into Cytoscape 3.7.1 to analyze each node in the PPI network through the MCC algorithm in the CytoHubba plug‐in. The top 5 targets were screened as shown in Figure 3. The color represents the decreasing degree of importance from red to yellow, followed by F2, HTR2A, CHRUM1, ADRA1A, and CHRM3.
FIGURE 3.

The interaction of related target proteins of AMK and PLP combined with the disease
3.5. GO and pathway enrichment analysis
The results showed that the key targets were highly enriched in 68 GO terms, and the biological functions and processes involved included positive regulation of the apoptotic process, negative regulation of fat cell differentiation, embryo implantation, activation of adenylate cyclase activity, neuronal cell body, acute‐phase response, signal transduction, nervous system development, and response to cold. p < 0.05 served as the threshold for significance. The top 20 items on GO analysis were screened, the results of which are shown in Figure 4A,C. KEGG enrichment analysis was performed on targets of functional constipation. p < 0.05 served as the threshold for significance, and the top 20 KEGG analysis results were screened, as shown in Figure 4B,D. The targets were mainly cholinergic synapses or serotonergic synapses, or involved in the TNF signaling pathway, retrograde endocannabinoid signaling, morphine addiction, salivary secretion, regulation of actin cytoskeleton, or the cAMP signaling pathway. It is known through GO and KEGG analyses that AMK and PLP can act on functional constipation through multiple pathways.
FIGURE 4.

GO and KEGG enrichment analysis
3.6. Metascape gene list analysis report
Analysis of shared genes was performed using the Metascape (http://metascape.org/) online tool. The top‐level Gene Ontology biological processes can be viewed in Figure 5A. Terms with p < 0.01, a minimum count of 3, and an enrichment factor >1.5 were collected and grouped into clusters based on their membership similarities. The top enriched clusters (one term per cluster) are shown in Figure 5B,C.
FIGURE 5.

Metascape gene list analysis
3.7. Component‐target molecular docking
Molecular docking was used to verify if the compounds had a significant role in regulation of F2, HTR2A, CHRM1, ADRA1A, CHRM3, and IL6. A total of 48 conformations were generated. The binding energies of the various compounds are presented in Table 2. Among them, the visualization results of the top 3 are shown in Figure 6.
TABLE 2.
The binding energy of top 8 compounds and top 6 genes
| Docking score (kcal/mol) | ||||||
|---|---|---|---|---|---|---|
| F2 | HTR2A | CHRM1 | ADRA1A | CHRM3 | IL6 | |
| AMK | ||||||
| MOL000045 | −7.52 | −6.37 | −7.27 | −6.62 | −6.39 | −7.01 |
| MOL000022 | −6.2 | −4.74 | −5.79 | −4.9 | −4.14 | −4.36 |
| MOL000020 | −7.71 | −4.51 | −5.09 | −4.75 | −4.9 | −4.81 |
| MOL000021 | −5.25 | −3.41 | −4.53 | −4.85 | −4.82 | −5.51 |
| PLP | ||||||
| MOL001918 | −8.39 | −5.58 | −6.36 | −5.59 | −6.68 | −6.1 |
| MOL001925 | −7.73 | −5.05 | −6.07 | −5.99 | −6.42 | −5.91 |
| MOL001928 | −7.7 | −4.77 | −6.63 | −5.4 | −5.92 | −5.96 |
| MOL001910 | −9.86 | −7.17 | −9.75 | −6.98 | −8.76 | −8.02 |
FIGURE 6.

Visualization results of the top 3
3.8. Stool control in each group
Compared with the normal group, the stool of model rats had become harder, the rats had prolonged defecation, and the particles increased significantly. They were eating less, and they tended to cluster together; their fur was yellowish and dull. The defecation time of the rats was prolonged, and the number of stools increased. These observations indicate the successful modeling of the constipation model. After combined treatment with AMK and PLP or treatment with Western medicine, the levels of AC, cAMP, and PKA in model rats were significantly downregulated. The mental state of the rats after treatment was the same as that of normal rats. These rats became more active and ate more food than before, their stools became softer or more diluted, and their fur became shinier than before, as shown in Figure 7. Figure 7A shows the stool of the rat before modeling. Figure 7B shows that the stool of the model group rats was hard, and the particles were increased. Figure 7C shows the stool of the treated rat, which is soft and slightly loose.
FIGURE 7.

Effect on stool in each group
3.9. AC, cAMP, and PKA in serum
The level of serum AC in the model group was significantly higher than in the normal group. After combined treatment with AMK and PLP or treatment with mosapride, the level of serum AC of the rats was significantly decreased (p < 0.01). Compared with the mosapride group, the middle‐dose group of combined treatment with AMK and PLP was significantly different (p < 0.05). Compared with the model group, the level of cAMP in the other 5 groups was significantly decreased (p < 0.05). Compared with the model group, the level of PKA in the other 5 groups was significantly decreased (p < 0.01), as shown in Figure 8.
FIGURE 8.

Effect on the level of AC, cAMP, and PKA in serum. Compared with the normal group, # p < 0.05; compared with the model group, *p < 0.05, **p < 0.01; compared with the mosapride group, △ p < 0.05
3.10. AC, cAMP, and PKA in intestinal tissue
The level of AC in intestinal tissue of the model group was significantly higher than the normal group. The level of AC was significantly decreased after combined treatment with AMK and PLP or treatment with mosapride. Compared with the mosapride group, the high‐dose group that received combined treatment with AMK and PLP was significantly different (p < 0.05). Compared with the model group, the level of cAMP in the other 5 groups was significantly decreased (p < 0.05). Compared with the model group, the level of PKA in the other 5 groups was significantly decreased (p < 0.01). Compared with the mosapride group, the middle‐dose group of combined treatment with AMK and PLP was significantly different (p < 0.05), as shown in Figure 9.
FIGURE 9.

Effect on the level of AC, cAMP, and PKA in intestinal tissue. Compared with the normal group, # p < 0.05; compared with the model group, *p < 0.05, **p < 0.01; compared with the mosapride group, △ p < 0.05, △△ p < 0.01
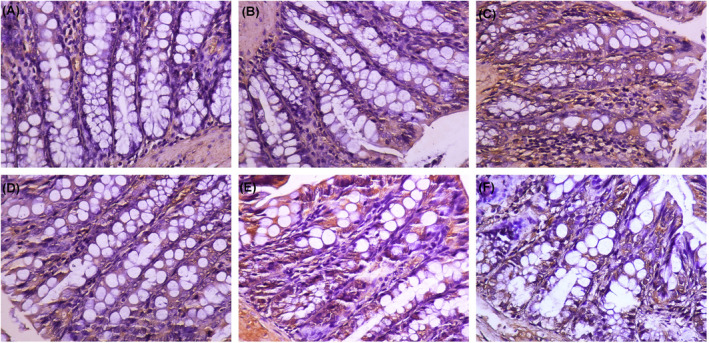
3.11. Expression of AQP1, AQP3, and AQP9 in rat tissues of each group
Immunohistochemical methods were used to detect the expression of AQP1, AQP3, and AQP8 in large intestine tissue. The results showed that, compared with the normal group, the expression of AQP1, AQP3, and AQP8 in the model group was significantly upregulated (p < 0.01). Compared with the model group, the expression of AQP1, AQP3, and AQP8 in the low‐dose AMK and PLP group (p < 0.01), middle‐dose AMK and PLP group (p < 0.05), high‐dose AMK and PLP group (p < 0.01), and mosapride group (p < 0.01) was significantly downregulated expression. Comparison of the average optical density value of AQP1, AQP3, and AQP8 expression in each group of rats is shown in Table 3 and Figures 10, 11, 12.
TABLE 3.
Comparison of the average optical density value of AQP1, AQP3, and AQP9 expression in each group of rats by immunohistochemistry
| Group | Number of cases | AQP1 | AQP3 | AQP9 | Compared with normal group (p value) | Compared with model group (p value) |
|---|---|---|---|---|---|---|
| Normal (A) | 10 | 0.145 ± 0.017 | 0.135 ± 0.017 | 0.127 ± 0.011 | / | / |
| Model (B) | 10 | 0.332 ± 0.028 | 0.322 ± 0.028 | 0.310 ± 0.050 | 0.00002 | / |
| Low‐dose AMK and PLP (C) | 10 | 0.163 ± 0.019 | 0.143 ± 0.019 | 0.135 ± 0.017 | 0.31274 | 0.00008 |
| Middle‐dose AMK and PLP (D) | 10 | 0.267 ± 0.027 | 0.231 ± 0.027 | 0.147 ± 0.056 | 0.09184 | 0.04222 |
| High‐dose AMK and PLP (E) | 10 | 0.172 ± 0.042 | 0.152 ± 0.042 | 0.238 ± 0.091 | 0.12300 | 0.00744 |
| Control (mosapride) (F) | 10 | 0.251 ± 0.019 | 0.247 ± 0.019 | 0.238 ± 0.091 | 0.00007 | 0.00052 |
FIGURE 10.

Expression of AQP1 in intestinal tissue. (A) Normal. (B) Model. (C) Low‐dose AMK and PLP. (D) Middle‐dose AMK and PLP. (E) High‐dose AMK and PLP. (F) Control (mosapride)
FIGURE 11.

Expression of AQP3 in intestinal tissue. (A) Normal. (B) Model. (C) Low‐dose AMK and PLP. (D) Middle‐dose AMK and PLP. (E) High‐dose AMK and PLP. (F) Control (mosapride)
FIGURE 12.
Expression of AQP9 in intestinal tissue. (A) Normal. (B) Model. (C) Low‐dose AMK and PLP. (D) Middle‐dose AMK and PLP. (E) High‐dose AMK and PLP. (F) Control (mosapride)
Large intestine tissue of the normal group had no lymphocyte infiltration and had normal morphology. The staining intensity of AQP1, AQP3, and AQP9 of the model group was significantly enhanced, and more satellite cell structures were located around neurons in the large intestinal plexus. In the model group, the large intestine tissue had a significant layer of lymphocyte infiltration focal patch‐shaped lymphoid tissue hyperplasia. Epithelial cell infiltration favors food passage. The staining intensity was diminished in mosapride group, revealing only a scattered lymphocyte layer. After treatment with AMK and PLP, AQP1, AQP3, and AQP9 expression distribution showed a tendency to decrease in the mucosal layer in colorectal tissue and showed decreased staining intensity in the low‐dose AMK and PLP group, middle‐dose AMK and PLP group, and high‐dose AMK and PLP group. However, the positioning did not change. Epithelial cell infiltration was not evident and with only small numbers of infiltrating lymphocytes. The phenomenon of “epithelial cell infiltration was not evident” is not conducive to the passage of food, which may affect constipation.
4. DISCUSSION
Constipation seriously affects people’s lives. The main means of treating constipation are diet and lifestyle interventions, drug treatment, and a few surgical procedures. 19 We understand that regulating the intestinal environment may be a new treatment strategy for constipation. 20 In this study, 30 active components of AMK and PLP and 21 potential targets for functional constipation were obtained. GO and KEGG analyses found 68 GO functional entries and 9 KEGG pathways. There are 5 key targets of AMK and PLP: F2, HTR2A, CHRUM1, ADRA1A, and CHRM3. The main chemical components were paeoniflorgenine, paeoniflorin_qt, α‐amyrin, 11alpha, 12alpha‐epoxy‐3beta‐23‐dihydroxy‐30‐norolean‐20‐en‐28, 12beta‐olide, and 14‐acetyl‐12‐senecioyl‐2E,8Z‐10E‐atractylentriol. In the DAVID database, the major potential active ingredients and disease‐related gene targets screened were F2, HTR2A, CHRM1, ADRA1A, and CHRM3. Molecular docking was used to verify if the compounds had a significant role in regulation of F2, HTR2A, CHRM1, ADRA1A, CHRM3, or IL6. The active components, 11alpha, 12alpha‐epoxy‐3beta‐23‐dihydroxy‐30‐norolean‐2‐20‐en‐28,12beta‐olide of AMK and PLP and F2, CHRM1, and CHRM3 can be well visualized with network pharmacology method and docked with molecular docking. This suggests that, in the treatment of functional constipation, AMK and PLP play a significant role in the regulation of F2, HTR2A, CHRM1, ADRA1A, CHRM3, and IL6.
Studies have confirmed that F2, HTR2A, CHRM1, ADRA1A, CHRM3, and IL6 can affect AC, cAMP, and PKA. 21 , 22 Meanwhile, F2, CHRM1, and CHRM3 can also affect the serum and intestinal tissue levels of AC, cAMP, and PKA. Experiments have shown that PGE1, PGE2, and PGF2 alpha on the changes in the AC and PKA activities tissues by light induced cAMP production by photoactivated adenylyl cyclase alpha. 23 , 24 Prostaglandin F2‐alpha receptor was shown to play a role in the regulation of PKA activity in human uterine myocytes treated with PGF2‐alpha. 25 Magnolol caused upregulation of CHRM1 and activation of the cAMP/PKA/CREB pathway, which is closely connected with ATF‐1 and Akt1, which play a role in signaling cAMP, and CHRM3 gene. 26 Therefore, we assessed the levels of cAMP, PKA, and AC to verify the treatment of the combination of AMK and PLP in functional constipation. After the treatment with AMK and PLP or treatment with mosapride, the serum and intestinal tissue levels of AC, cAMP, and PKA in model rats were significantly downregulated. The mental states of the treatment groups and normal group were the same. After treatment with AMK and PLP or treatment with mosapride, the rats became more active, their appetite improved, their stools became softer or more diluted, and their fur became shiny.
AQP expression is closely related to AC, 27 cAMP, 28 , 29 and PKA. 30 , 31 The adenylyl cyclase (AC)‐cyclic adenosine monophosphate (cAMP)‐protein kinase A (PKA) signaling system is the best postreceptor signal transduction system. 32 The expression of cAMP‐mediated AQP channels and the expression of G(salpha) were closely connected. 33 Acute closed soft tissue Curing‐injury Cataplasma can promote and regulate the cAMP‐PKA signaling pathways and affect AQP‐3 high expression. 34 Aquaporin (AQP) is a member of the major intrinsic protein (MIP) family. 35 It is a type of water‐permeable protein on the cell membrane and is widely present in all mammals, 36 , 37 and it plays a significant physiological role in the secretion of glands, absorption of water, and the balance of water inside and outside the cell. 38 Experiments have shown that, after treatment with AMK and PLP, the expression of AQP1, AQP3, and AQP9 in the colon of constipated rats is reduced. In the colon of constipated rats, the active expression of AQP1, AQP3, and AQP8 may increase the absorption of water by the colon and decrease the secretion of intestinal juice, which may cause dry stool. 39 This experiment further found that the levels of AQP1, AQP3, and AQP8 protein expression in each group were different. The amount and degree of coloring in the model and normal groups was higher than in other groups. After drug intervention, both the AMK and PLP and mosapride groups showed a reduction in the level of AQP1, AQP3, and AQP8, to various degrees. It can be inferred that AQP1, AQP3, and AQP8 are involved in the absorption of colonic water, and it is clear that aquaporins 1, 3, and 8 plays significant roles in the metabolism of large intestine fluid. Under the treatment with high‐dose AMK and PLP, the repair of AQP1, AQP3, and AQP8 was the worst. It is speculated that high‐dose AMK and PLP may ease the rapid absorption of water into the blood in the intestinal cavity and improve the endocrine environment of the intestinal cavity. Moreover, treatment with high‐dose AMK and PLP may reduce the level of AQP1, AQP3 and AQP8 and inhibit their expression in the colon, thereby reducing the absorption of water in the intestine, increasing the water of content of feces, and regulating water transport to treat the symptoms of constipation.
5. CONCLUSION
This article indicates that AMK and PLP play significant roles in the regulation of F2, HTR2A, CHRM1, ADRA1A, CHRM3, and IL6 in the treatment of functional constipation, using network pharmacology and molecular docking analysis method. Studies have confirmed that F2, HTR2A, CHRM1, ADRA1A, CHRM3, and IL6 can affect AC, cAMP, and PKA. The experiment verified that, after treatment with AMK and PLP, the serum and intestinal tissue levels of AC, cAMP, and PKA in model rats were significantly downregulated, and functional constipation was effectively treated. AQP expression is closely related to AC, cAMP, and PKA. After treatment with AMK and PLP, the expression of AQP1, AQP3, and AQP9 was reduced in the colon of constipated rats, indicating that the laxative mechanism of AMK and PLP may be related to the regulation of the expression of intestinal aquaporin.
CONFLICT OF INTEREST
The authors declare that there are no conflicts of interest.
AUTHOR CONTRIBUTIONS
Conception and design: Jiaqi Guan; administrative support: Jiaqi Guan, Lu Zhang; provision of study materials or patients: Yuxiao Meng, Xiaojun Li, Xiaoting Wang; collection and assembly of data: Yuxiao Meng, Xiaojun Li; data analysis and interpretation: Yuxiao Meng, Xiaojun Li; manuscript writing: Yuxiao Meng; final approval of manuscript: all authors. All authors contributed equally to the manuscript and read and approved the final version of the manuscript.
ACKNOWLEDGMENTS
We gratefully acknowledge the contributions of Jiaqi Guan and Lu Zhang in the study design and data analysis.
Meng Y, Li X, Wang X, Zhang L, Guan J. Network pharmacological prediction and molecular docking analysis of the combination of Atractylodes macrocephala Koidz. and Paeonia lactiflora Pall. in the treatment of functional constipation and its verification. Anim Models Exp Med. 2022;5:120‐132. doi: 10.1002/ame2.12226
Yuxiao Meng and Xiaojun Li contributed equally to this work.
Trial registration number (if clinical trial): ZSLL‐2014‐196.
Funding information
This study was supported by the Project of Zhejiang Natural Science Foundation (LY19H280004) and the Exploration Project of Zhejiang Natural Science Foundation (LQ21H270002)
REFERENCES
- 1. Vriesman MH, Koppen IJN, Camilleri M, Di Lorenzo C, Benninga MA. Management of functional constipation in children and adults. Nat Rev Gastroenterol Hepatol. 2020;17(1):21‐39. [DOI] [PubMed] [Google Scholar]
- 2. Vazquez Roque M, Bouras EP. Epidemiology and management of chronic constipation in elderly patients. Clin Interv Aging. 2015;10:919‐930. [DOI] [PMC free article] [PubMed] [Google Scholar]
- 3. Sung IK. Differential diagnosis of abdominal masses in children. Korean J Gastroenterol. 2008;51(1):4‐10. [PubMed] [Google Scholar]
- 4. Tsimogiann KE, Karlbom U, Lundin E, Graf W. Long‐term outcome after segmental colonic resection for slow transit constipation. Int J Colorectal Dis. 2019;34(6):1013‐1019. [DOI] [PubMed] [Google Scholar]
- 5. Zhang BH, Gao R, Li ZH, Li BS, Wang FY, Tang XD. Treatment of irritable bowel syndrome by Chinese medicine and pharmacy: an analysis of data mining on experiences of experts. Zhongguo Zhong Xi Yi Jie He Za Zhi. 2013;33(6):757‐760. [PubMed] [Google Scholar]
- 6. National Pharmacopoeia Committee . The Pharmacopoeia of the People’s Republic of China [S]. Part One. China Medical Science and Technology Press; 2020:158‐159. [Google Scholar]
- 7. Zhu B, Zhang QL, Hua JW, Cheng WL, Qin LP. The traditional uses, phytochemistry, and pharmacology of Atractylodes macrocephala Koidz.: a review. J Ethnopharmacol. 2018;226:143‐167. [DOI] [PubMed] [Google Scholar]
- 8. Wei CB, Ye R, Li H. Treatment of complications due to peritoneal dialysis for chronic renal failure with traditional Chinese medicine. J Tradit Chin Med. 1999;19(1):3‐9. [PubMed] [Google Scholar]
- 9. He L, Yajuan X, Qifang L, et al. Analysis on the medication rule of traditional Chinese medicine in treatment of ulcerative colitis with irregular liver and spleen syndrome based on traditional Chinese medicine inheritance. Syst Chin Med. 2020;15(10):1580‐1584. [Google Scholar]
- 10. Ye H, Wei J, Tang K, Feuers R, Hong H. Drug repositioning through network pharmacology. Curr Top Med Chem. 2016;16(30):3646‐3656. [DOI] [PubMed] [Google Scholar]
- 11. Cheng F, Kovács IA, Barabási AL. Network‐based prediction of drug combinations [published correction appears in Nat Commun. 2019 Apr 15;10(1):1806]. Nat Commun. 2019;10(1):1197. [DOI] [PMC free article] [PubMed] [Google Scholar]
- 12. Vogt I, Mestres J. Information loss in network pharmacology. Mol Inform. 2019;38(7):e1900032. [DOI] [PubMed] [Google Scholar]
- 13. Ru J, Li P, Wang J, et al. TCMSP: a database of systems pharmacology for drug discovery from herbal medicines. J Chem. 2014;16(6):13. doi: 10.1186/1758-2946-6-13 [DOI] [PMC free article] [PubMed] [Google Scholar]
- 14. Liu ZJ, Zhong J, Zhang M, et al. The alexipharmic mechanisms of five licorice ingredients involved in CYP450 and Nrf2 pathways in paraquat‐induced mice acute lung injury. Oxid Med Cell Longev. 2019;2019:7283104. doi: 10.1155/2019/7283104 [DOI] [PMC free article] [PubMed] [Google Scholar]
- 15. Shannon P, Markiel A, Ozier O, et al. Cytoscape: a software environment for integrated models of biomolecular interaction networks. Genome Res. 2003;13(11):2498‐2504. [DOI] [PMC free article] [PubMed] [Google Scholar]
- 16. Zhou WX, Wang TX, Cheng XR, Han L, Zhang YX. Techniques of molecular network analysis in study on network pharmacology. J Int Pharmaceutical Res. 2016;43(3):399‐409. [Google Scholar]
- 17. Tang Y, Li M, Wang J, Pan Y, Wu FX. CytoNCA: a cytoscape plugin for centrality analysis and evaluation of protein interaction networks. Biosystems. 2015;127:67‐72. [DOI] [PubMed] [Google Scholar]
- 18. Zhang L, Shi X, Huang Z, et al. Network pharmacology approach to uncover the mechanism governing the effect of radix Achyranthis bidentatae on osteoarthritis. BMC Complement Med Ther. 2020;20(1):121. doi: 10.1186/s12906-020-02909-4 [DOI] [PMC free article] [PubMed] [Google Scholar]
- 19. Camilleri M, Ford AC, Mawe GM, et al. Chronic constipation. Nat Rev Dis Primers. 2017;3:17095. [DOI] [PubMed] [Google Scholar]
- 20. Ge X, Zhao W, Ding C, et al. Potential role of fecal microbiota from patients with slow transit constipation in the regulation of gastrointestinal motility. Sci Rep. 2017;7(1):441. [DOI] [PMC free article] [PubMed] [Google Scholar]
- 21. Tachado SD, Zhang Y, Abdel‐Latif AA. Protein kinase C is involved in cyclic adenosine monophosphate formation due to PGF2 alpha desensitization in bovine iris sphincter. Invest Ophthalmol Vis Sci. 1993;34(6):2023‐2032. [PubMed] [Google Scholar]
- 22. Zhu G, Fang Y, Cui X, Jia R, Kang X, Zhao R. Magnolol upregulates CHRM1 to attenuate amyloid‐β‐triggered neuronal injury through regulating the cAMP/PKA/CREB pathway. J Nat Med. 2022;76(1):188‐199. doi: 10.1007/s11418-021-01574-2 [DOI] [PubMed] [Google Scholar]
- 23. Kondo S, Morita T, Hirano S. Effects of prostaglandin E1, E2 and F2 alpha on the changes in the adenylate cyclase activities of rabbit urinary tract tissues. J Smooth Muscle Res. 1993;29(1):29‐36. doi: 10.1540/jsmr.29.29 [DOI] [PubMed] [Google Scholar]
- 24. Looser J, Schröder‐Lang S, Hegemann P, Nagel G. Mechanistic insights in light‐induced cAMP production by photoactivated adenylyl cyclase alpha (PACalpha). Biol Chem. 2009;390(11):1105‐1111. doi: 10.1515/BC.2009.132 [DOI] [PubMed] [Google Scholar]
- 25. Liang Z, Sooranna SR, Engineer N, et al. Prostaglandin F2‐alpha receptor regulation in human uterine myocytes. Mol Hum Reprod. 2008;14(4):215‐223. doi: 10.1093/molehr/gan008 [DOI] [PubMed] [Google Scholar]
- 26. Rubach M, Lang R, Skupin C, Hofmann T, Somoza V. Activity‐guided fractionation to characterize a coffee beverage that effectively down‐regulates mechanisms of gastric acid secretion as compared to regular coffee. J Agric Food Chem. 2010;58(7):4153‐4161. doi: 10.1021/jf904493f [DOI] [PubMed] [Google Scholar]
- 27. Kim SW, Yeum CH, Kim S, Oh Y, Choi KC, Lee J. Amphotericin B decreases adenylyl cyclase activity and aquaporin‐2 expression in rat kidney. J Lab Clin Med. 2001;138(4):243‐249. doi: 10.1067/mlc.2001.117826 [DOI] [PubMed] [Google Scholar]
- 28. Luo R, Hu S, Liu Q, et al. Hydrogen sulfide upregulates renal AQP‐2 protein expression and promotes urine concentration. FASEB J. 2019;33(1):469‐483. doi: 10.1096/fj.201800436R [DOI] [PMC free article] [PubMed] [Google Scholar]
- 29. Matsumura Y, Uchida S, Rai T, Sasaki S, Marumo F. Transcriptional regulation of aquaporin‐2 water channel gene by cAMP. J Am Soc Nephrol. 1997;8(6):861‐867. doi: 10.1681/ASN.V86861 [DOI] [PubMed] [Google Scholar]
- 30. Wang W, Zheng M. Role of cAMP‐PKA/CREB pathway in regulation of AQP 5 production in rat nasal epithelium. Rhinology. 2011;49(4):464‐469. doi: 10.4193/Rhino10.107 [DOI] [PubMed] [Google Scholar]
- 31. Wang WB, Li JT, Hui Y, Shi J, Wang XY, Yan SG. Combination of pseudoephedrine and emodin ameliorates LPS‐induced acute lung injury by regulating macrophage M1/M2 polarization through the VIP/cAMP/PKA pathway. Chin Med. 2022;17(1):19. doi: 10.1186/s13020-021-00562-8 [DOI] [PMC free article] [PubMed] [Google Scholar]
- 32. Peng Y, Zhang C, Su Y, Wang Z, Jiang Y. Activation of the hippocampal AC‐cAMP‐PKA‐CREB‐BDNF signaling pathway using WTKYR in depression model rats. Electrophoresis. 2018. PMID: 30511424. doi: 10.1002/elps.201800381 [DOI] [PubMed] [Google Scholar]
- 33. Kim SW, Cho SH, Oh BS, et al. Diminished renal expression of aquaporin water channels in rats with experimental bilateral ureteral obstruction. J Am Soc Nephrol. 2001;12(10):2019‐2028. doi: 10.1681/ASN.V12102019 [DOI] [PubMed] [Google Scholar]
- 34. Wang W, Wu R, Ru XL, Sun Y. Effect of injury‐curing cataplasma on expression of AQP3 in skeletal muscles of rats by regulating cAMP‐PKA signal pathway. Pak J Pharm Sci. 2017;30(5):1889‐1893. [PubMed] [Google Scholar]
- 35. Verkman AS, Mitra AK. Structure and function of aquaporin water channels. Am J Physiol Renal Physiol. 2000;278(1):F13‐F28. doi: 10.1152/ajprenal.2000.278.1.F13 [DOI] [PubMed] [Google Scholar]
- 36. Matsuzaki T, Tajika Y, Ablimit A, Aoki T, Hagiwara H, Takata K. Aquaporins in the digestive system. Med Electron Microsc. 2004;37(2):71‐80. doi: 10.1007/s00795-004-0246-3 [DOI] [PubMed] [Google Scholar]
- 37. Geyer RR, Musa‐Aziz R, Qin X, Boron WF. Relative CO(2)/NH(3) selectivities of mammalian aquaporins 0‐9. Am J Physiol Cell Physiol. 2013;304(10):C985‐C994. doi: 10.1152/ajpcell.00033.2013 [DOI] [PubMed] [Google Scholar]
- 38. Zhu S, Ran J, Yang B, Mei Z. Aquaporins in digestive system. Adv Exp Med Biol. 2017;969:123‐130. doi: 10.1007/978-94-024-1057-0_8 [DOI] [PubMed] [Google Scholar]
- 39. Cao Y, He Y, Wei C, et al. Aquaporins alteration profiles revealed different actions of senna, sennosides, and sennoside a in diarrhea‐rats. Int J Mol Sci. 2018;19(10):3210. doi: 10.3390/ijms19103210 [DOI] [PMC free article] [PubMed] [Google Scholar]