Abstract
The sleep and waking discharge of pontine gigantocellular field’ units was studied in unrestrained cats. Three cell types were distinguished on the basis of discharge rate. Type 1 had no spontaneous activity during quiet waking and sleep, discharging only during movements. Type 2 had high rates of tonic activity during both quiet waking and sleep. Type 3 had low activity rates during quiet waking and slow-wave sleep, but discharged in bursts during both waking movements and rapid eye movement (REM) sleep. Units with augmented discharge restricted to REM sleep were not observed. All pontine gigantocellular field cells discharged rapidly during specific waking movements at rates exceeding mean REM sleep rates. Among type 2 and 3 cells, REM sleep and active waking discharge rates were correlated, with cells that discharged rapidly in REM sleep also showing high rates during active waking. Adaptation to head restraint reduced waking motor activity and the correlated pontine gigantocellular field discharge, yielding a reduced estimate of waking discharge rates. Our results are consistent with an hypothesis of pontine gigantocellular field unit involvement in the motor activation common to both waking and REM sleep, but are not consistent with an executive role for these neurons in the triggering of the REM sleep state.
INTRODUCTION
The unit discharge of neurons in the brain stem pontine gigantocellular tegmental field (FTG) of unrestrained cats is related to specific head, neck, and forelimb movements (24). One cell type in this region, although active during movements, shows no spontaneous activity (NSA cells) between movements, or in slow-wave sleep (SWS) or rapid eye movement (REM) sleep. The NSA cells .are also found in other brain stem regions (23). Other cells in the FTG field exhibit activity in both waking and sleep (14). It has been reported that the discharge of FTG cells is selectively augmented during REM sleep (9, 13). Those studies were performed in cats adapted to a restraint system that prevented head movements and reduced body movements (8). Similar conclusions have been reached in a study using cats immobilized by decerebration (18). Because our studies had shown that most FTG unit discharge was associated with movement, it appeared that the immobilization procedure, by reducing unit discharge levels during waking, might have been responsible for the apparent selectivity of FTG discharge for REM sleep observed in those earlier studies. Therefore, we compared the waking and sleep activity rates of FTG neurons recorded in unrestrained cats. We found that augmented FTG discharge is not selective for REM sleep.
METHODS
Six female and three male cats were anesthetized with sodium pentobarbi-tal (Nembutal), 35 mg/kg, intraperitoneally, and were implanted with electrodes for recording sensorimotor cortex electroencephalograms (EEG), eye movements, neck electromyograms (EMG), and lateral geniculate nucleus spikes, using standard techniques (25). Pairs of hexagonal wrench sockets were cemented on the heads of three cats to permit head restraint. During restraint, the sockets were mated with wrenches which were secured in the ear bar slots of a Kopf stereotaxic device. This immobilized the cat’s head in all three axes without tissue compression.
Units were recorded using a previously described technique (6) which allows stable, long-term recording of single units in unrestrained cats. Bundles of six 32-μm insulated microwire electrodes, attached to a mechanical microdrive, were stereotaxically positioned in the pontine tegmentum at 25° from the vertical in the sagittal plane to avoid the bony tentorium (21). The microwires within a bundle typically remained grouped in a pattern with a diameter less than 200 μm Each cat was prepared with two microdrives propelling one or two bundles each, for a total of two or four recording tracks. Unit activity was monitored by a continuous display of the amplified unit signal 011 a type 565 Tektronics oscilloscope, an audio monitor, and by a window discriminator whose output was used to drive an event marker channel on a Grass model 6 polygraph. Only units with signal-to-noise ratios greater than 4:1, good isolation from other units, and stable spike amplitudes were studied. All cells were recorded for at least one complete cycle (waking, SWS, REM sleep, waking). Slow-wave and unit signals and a binary coded decimal time code were recorded on paper and on analog tape for further analysis.
During recordings the cats were placed in a shielded, sound-insulated 58 X 60 X 85 cm chamber. The chamber contained a litter box and food and water cups, and had two windows, each 8.5 cm in diameter. The cats were connected to recording amplifiers with low-noise Filotex wire cables, suspended by a counterweight system. Chamber lights and lights in the cats’ home cages were automatically maintained on a 12-h light, 12-h dark cycle. Most recordings were made during the light phase.
Maximum and minimum waking and REM sleep discharge rates were determined by replaying segments of taped unit signals through a pulseamplitude window discriminator connected to a Hewlett-Packard electronic counter set for 10-s epochs. A minimum of 5 min of waking was obtained from each unit for rate determinations. Mean REM sleep rates were determined by averaging consecutive 10-s epochs. REM sleep onset was defined as the time, after the initiation of lateral geniculate nucleus spikes, at which both EEG desynchronization and EMG suppression began. REM sleep offset was defined as the time of the first EMG burst exceeding 0.5 s. SWS rates were taken from periods having EEG slow waves and spindles, but no geniculate spikes. Because some of the minimum waking, minimum REM sleep, and SWS rates were zero, an X + 1 transformation was used to calculate the geometric means of these values.
Each cell was monitored during systematic sensory stimulation and spontaneous behaviors until the correlates of discharge were determined, as previously described (23, 24).
Cats were killed with an overdose of Nembutal after passing a 15-μA, 15-s current through the microwires that had recorded unit activity. After perfusing with saline and 4% formalin, brains were removed and sectioned in the sagittal or coronal planes. The carbol-fuchsin red Nissl stain and Gomori’s iron reaction were used to locate the tips of the microwire penetrations. Electrode tracks were reconstructed after allowance was made for brain shrinkage.
Recording sites were located, lateralities measured, and units were assigned to appropriate tegmental fields on the basis of cytoarchitectonic patterns. Anatomic landmarks such as the abducens nuclei, genu of the facial nerve, shape of the fourth ventricle, and position of the inferior olive were used to place recording sites with reference to the stereotaxic coordinates on the sagittal plates of the Berman atlas (2).
RESULTS
Cell Types.
Within the FTG field three cell types were distinguished on the basis of discharge patterns during the sleep-waking cycle. Type 1 cells had no background activity during quiet waking, SWS, or REM sleep (Fig. 1), and were previously denoted NSA cells (23). They discharged in association with spontaneous in association with spontaneous or stimulus-evoked movements and were otherwise silent. The characteristics of these cells will be examined in detail elsewhere. Type 2 FTG neurons had relatively high levels of tonic activity in quiet waking, SWS, and REM sleep (Fig. 2). The defining characteristic of this heterogeneous cell group was a SWS discharge rate exceeding 4 spikes/s. These cells show a relatively small increase in mean firing rate during the SWS-REM sleep transition. Type 2 cells tended to have lower signal-to-noise ratios and therefore are probably under-represented in our sample. Type 3 cells had a low level of spontaneous discharge in quiet waking and SWS (below 4 spikes/s). During the SWS-REM transition, the firing rates in these cells increased, most activity coming in phasic discharge bursts (Fig. 3). These cells most closely resemble the cell type that has been hypothesized to be the “executive neuron” for REM sleep control. However, all cell types showed intense discharge bursts during waking movements. We did’ not find any cells with high discharge rates in REM sleep that did not also show rapid discharge in the waking cat
Fig. 1.
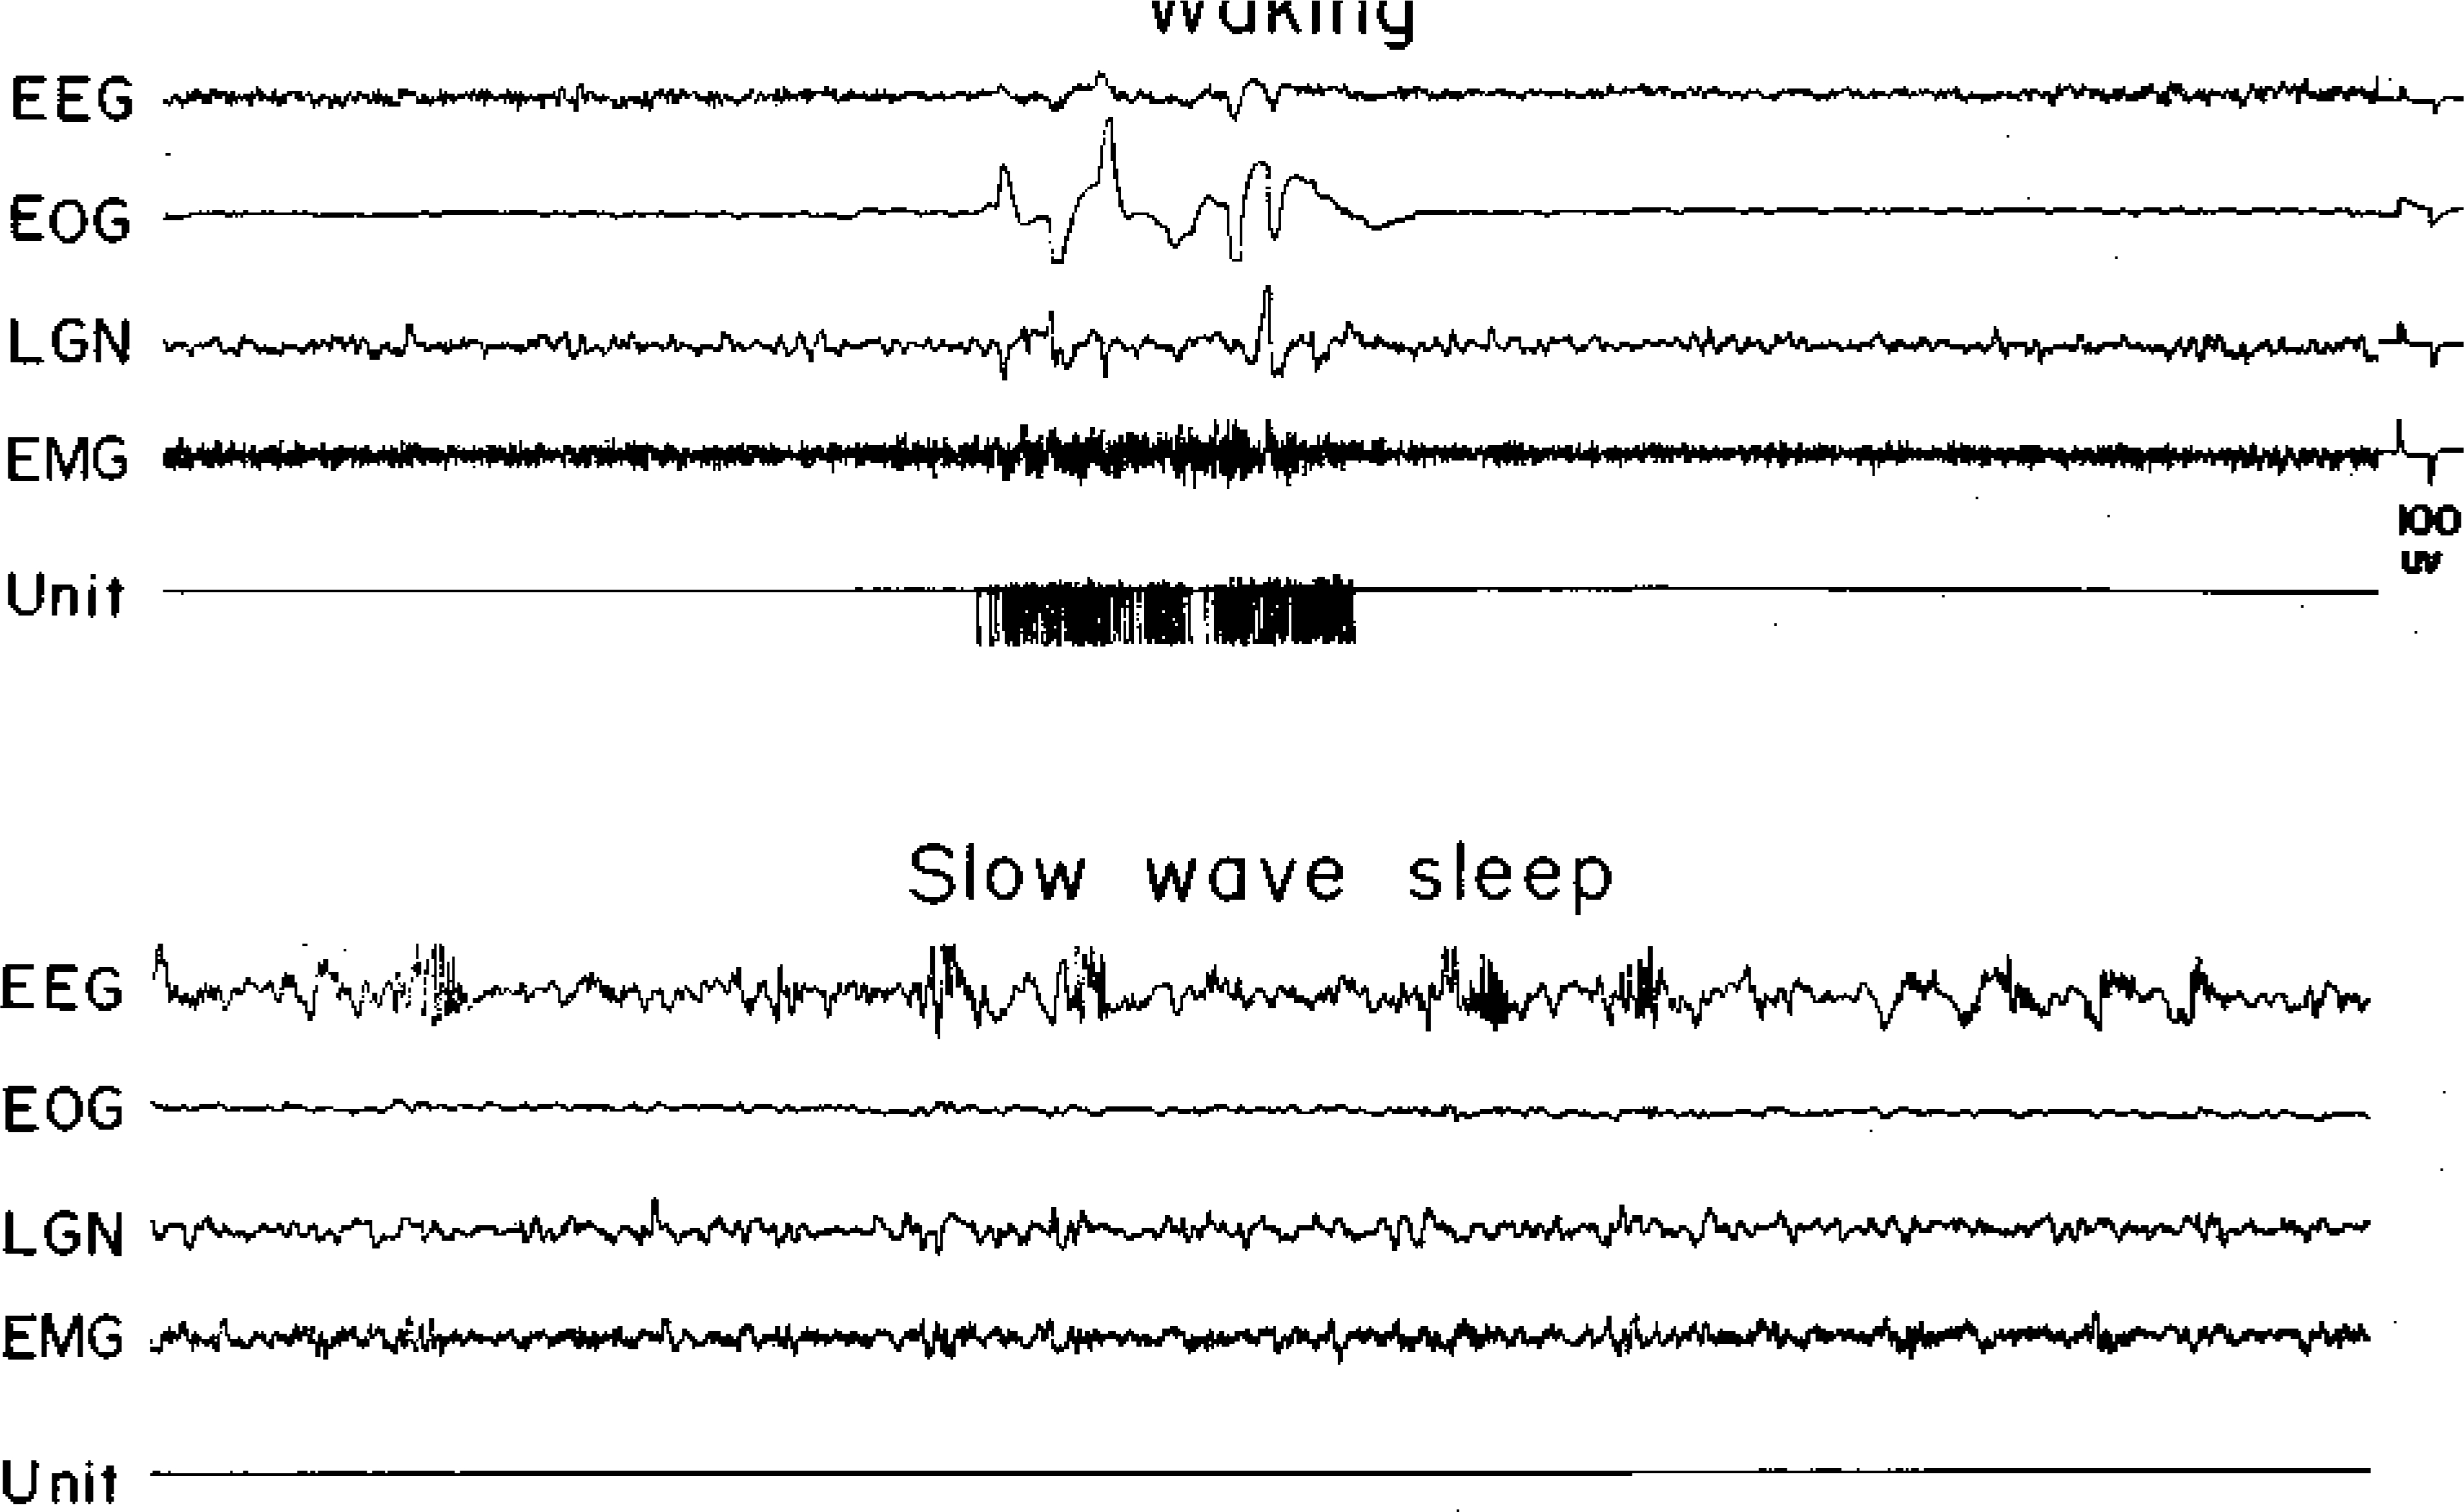

A type 1 (NSA) cell. Abbreviations for this and succeeding figures: EEG, electroencephalogram from sensorimotor cortex; EOG, electrooculogram; LGN, lateral geniculate nucleus activity; EMG, dorsal neck muscle electromyogram. The unit channel displays the pulse output of a window discriminator
Fig. 2.
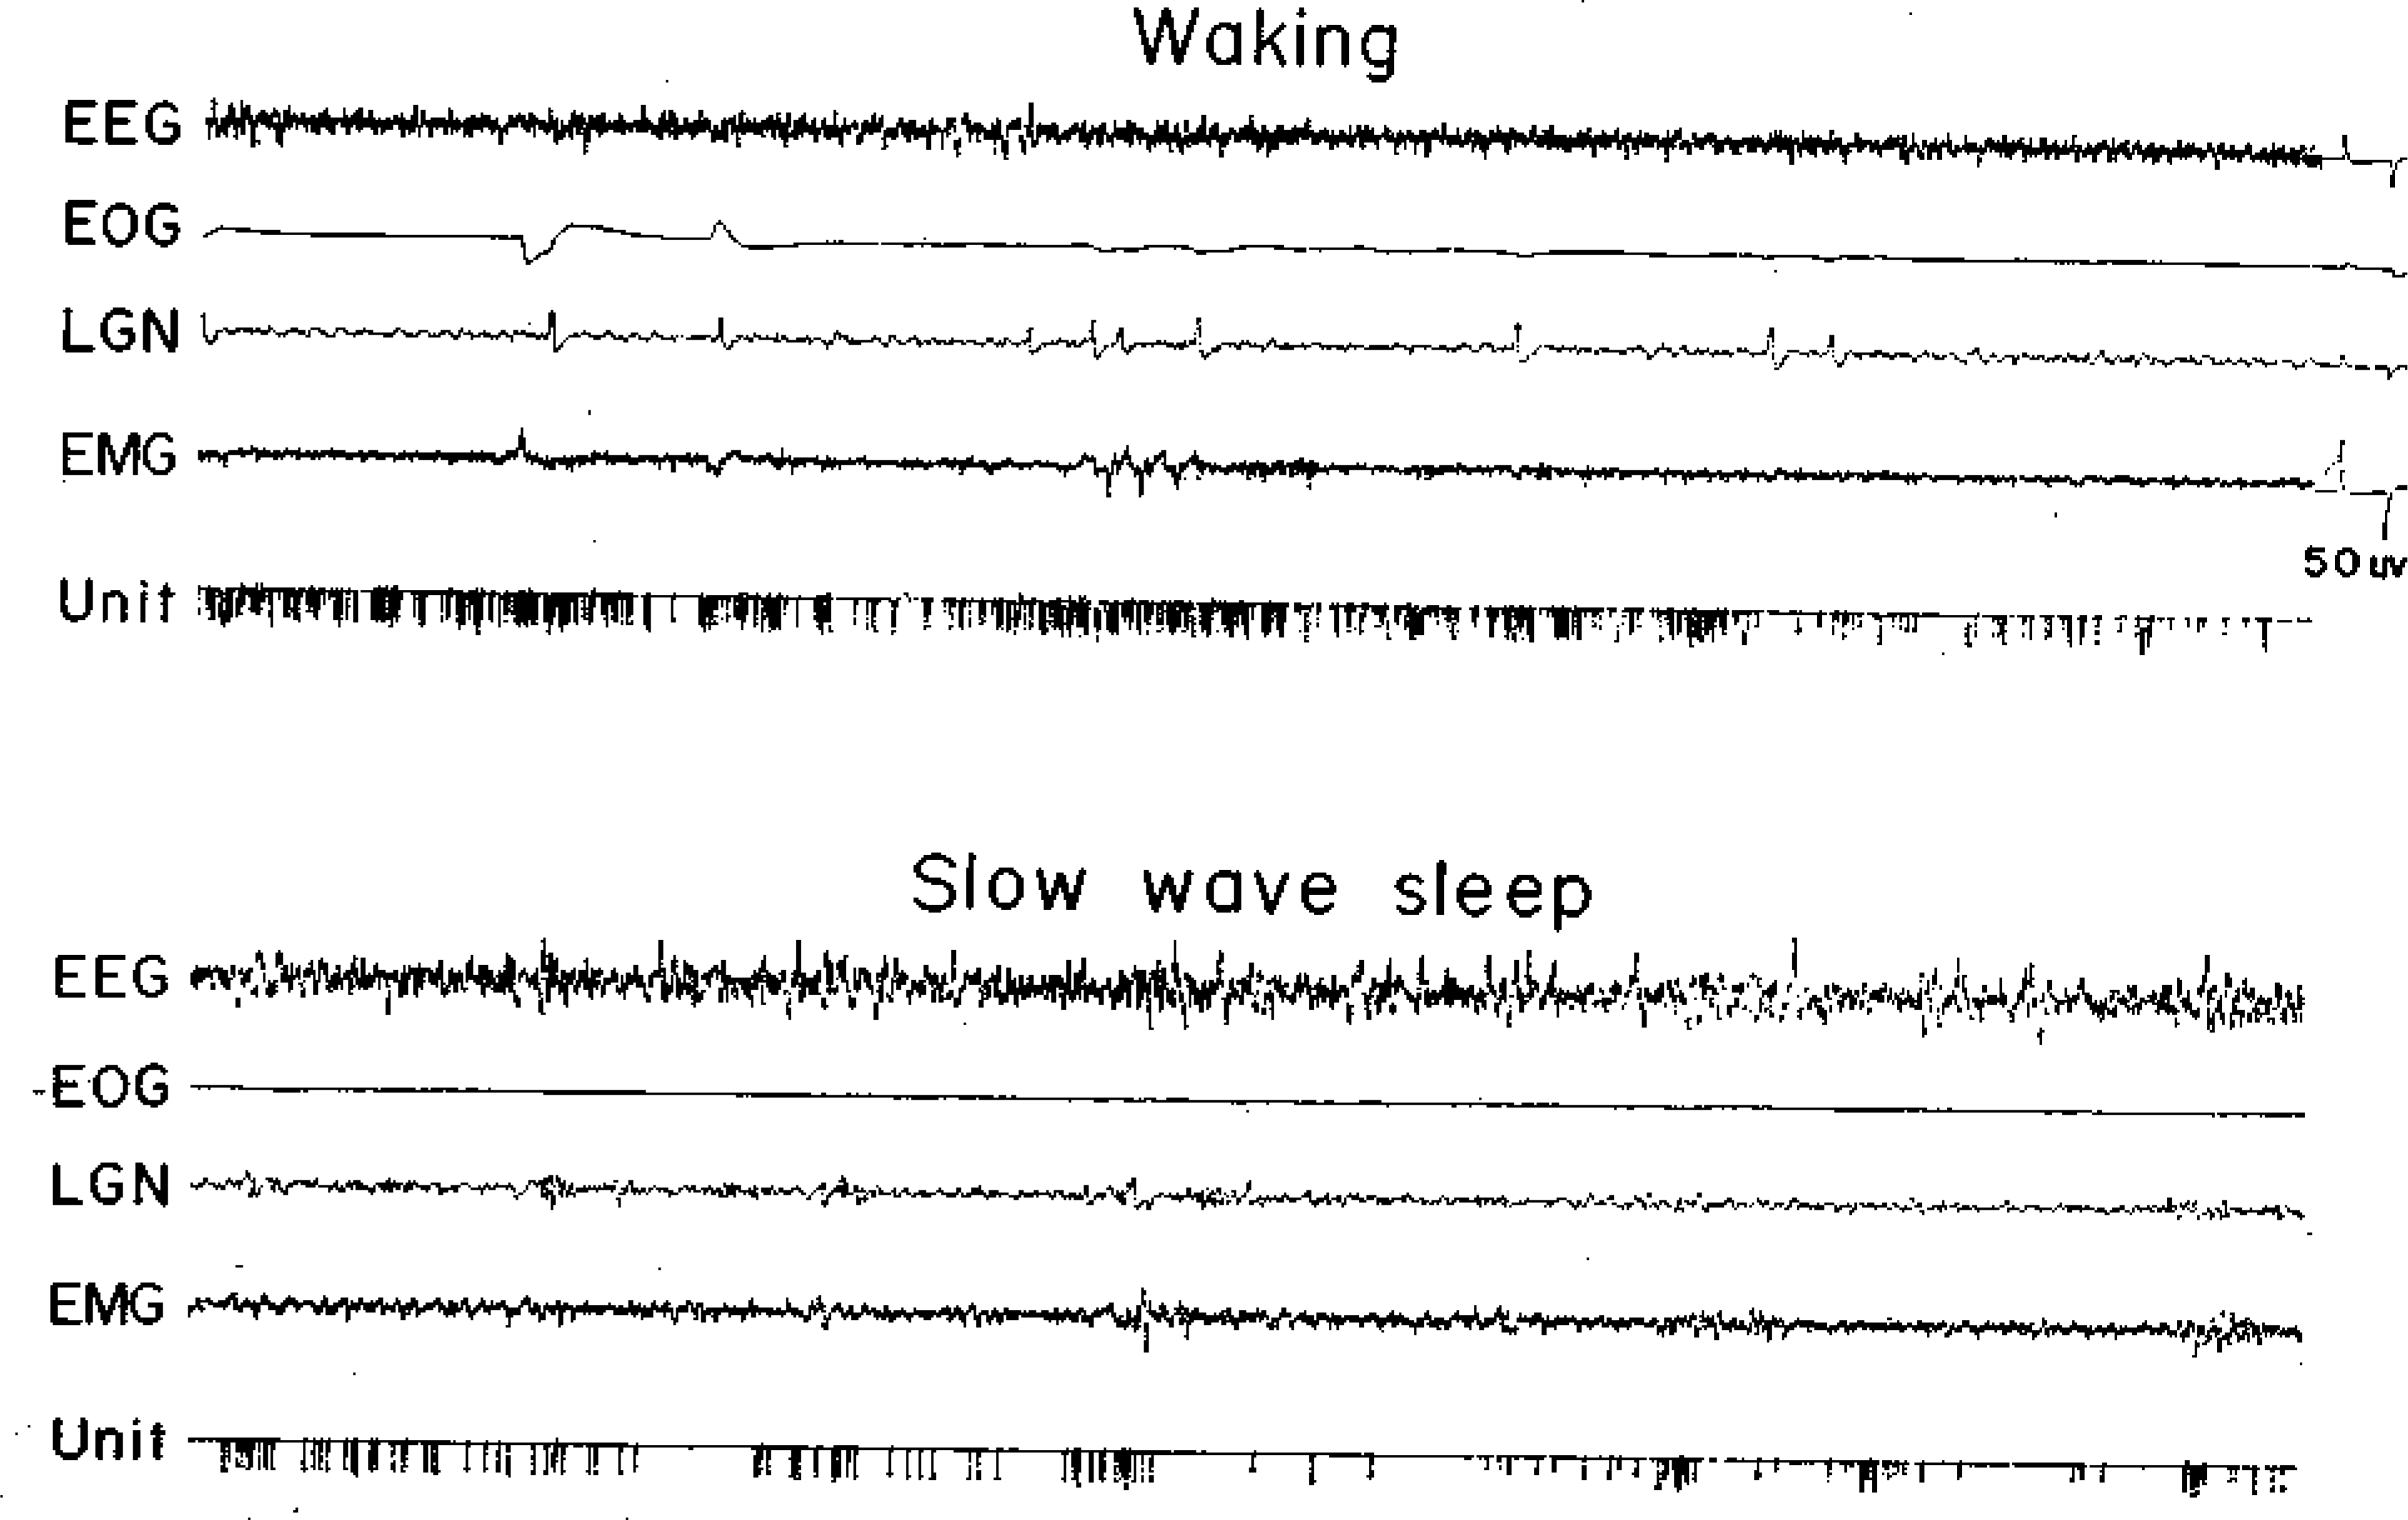

A type 2 cell. See Fig, 1 for abbreviations.
Fig. 3.
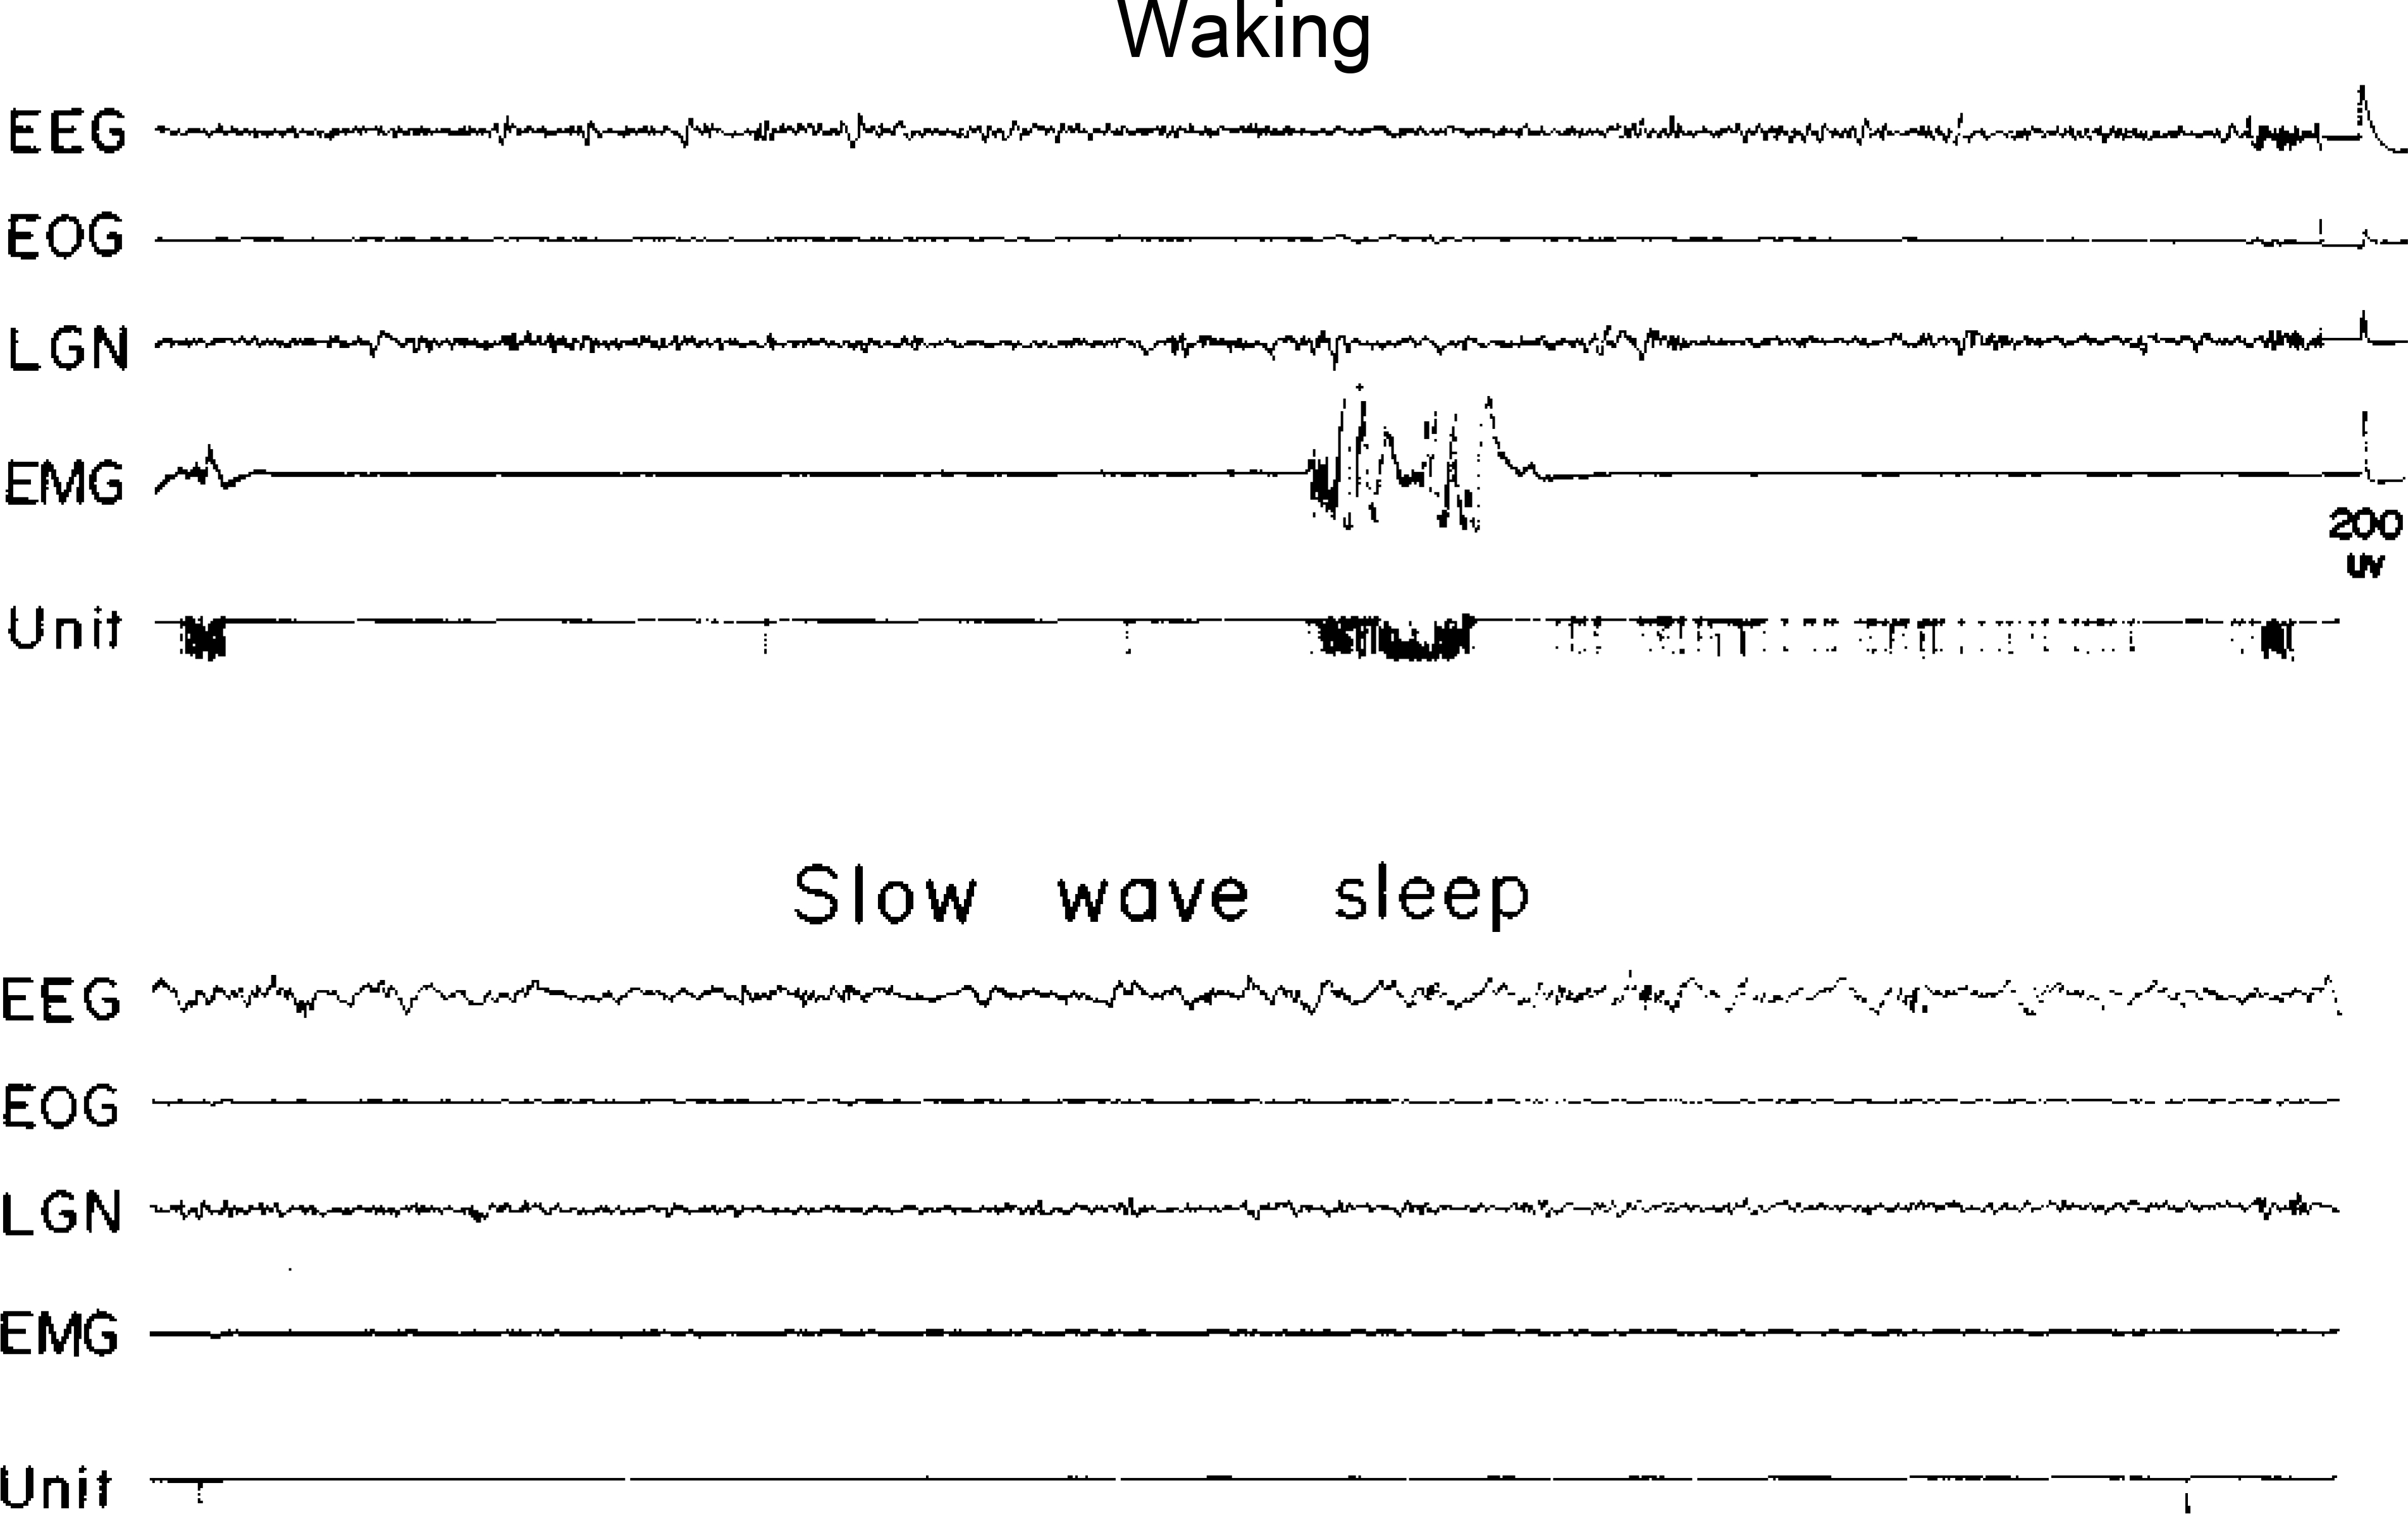
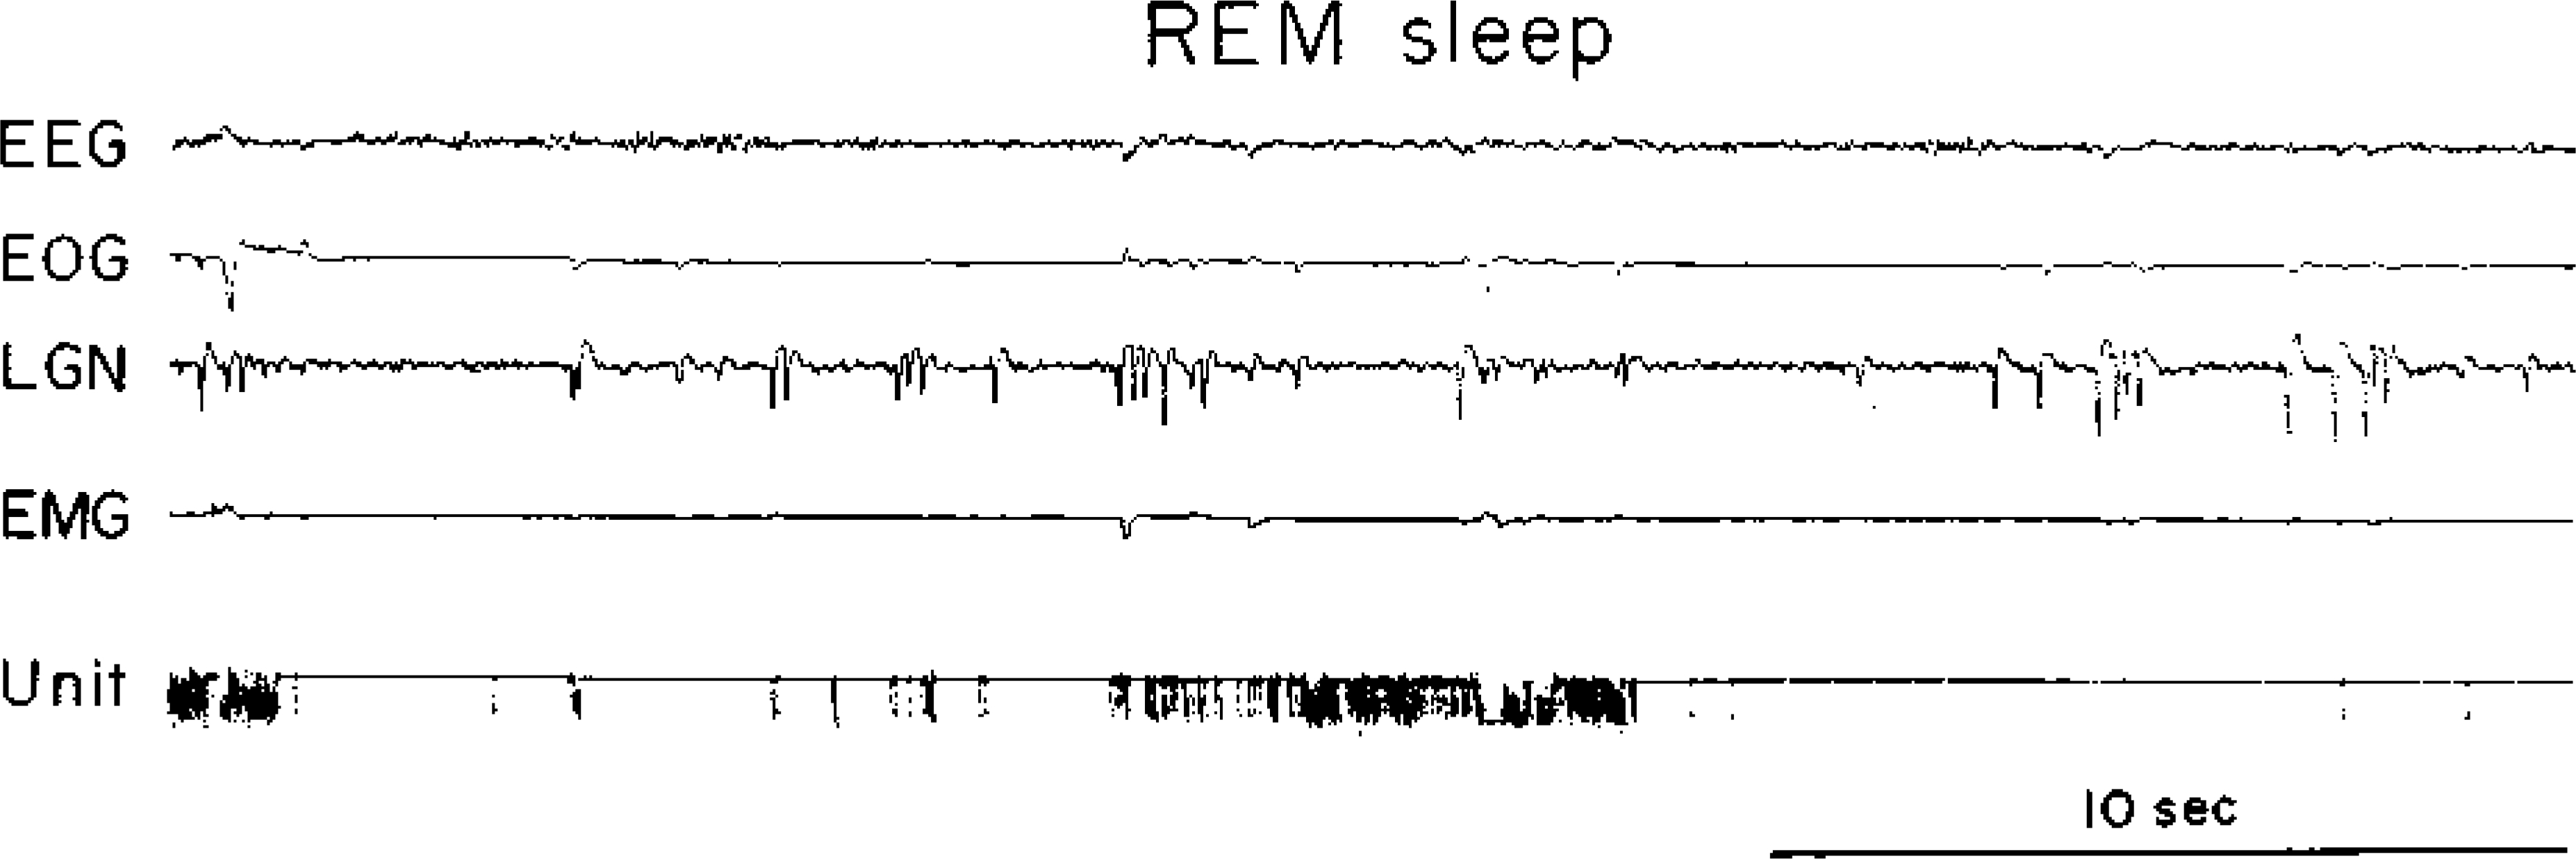
A type 3 cell. See Fig. 1 for abbreviations.
Histology.
The positions of cells assigned to the FTG are mapped in Fig. 4. Photographs of representative electrode tracts are presented in Fig. 5. Cells were from 0.8 to 2.1 mm lateral to the midline (mean, 1.54; standard deviation 0.38). All cells presented in Fig. 4 were assigned to the FTG field on the basis of local cytoarchitectonic patterns. No attempt was made to outline the boundaries of the field in the summary figures because they were often indistinct and varied among animals. There were discontinuities in the field even within serial sections in a single cat. Therefore, we have presented a stereotaxic coordinate scale to allow representation of the unit positions with reference to a standard, widely available series of plates (2). In the present series the three cell types did not appear to be clearly segregated within the FTG field, although they were not entirely homogeneous in their anatomic distribution. They were sometimes recorded simultaneously on the same or adjoining wires within a bundle. The techniques for recognizing NS A cells were developed only in our later cats, and this may account for some of their clustering in the histology summary. A total of 85 cells histologically localized to the pontine or ponto-medullary FTG field were recorded. Of these, 24 (28%) were classified as type 1 (NSA) cells, 13 (15%) were classified as type 2 cells, and 48 (5 7%) were classified as type 3 cells.
Fig. 4.
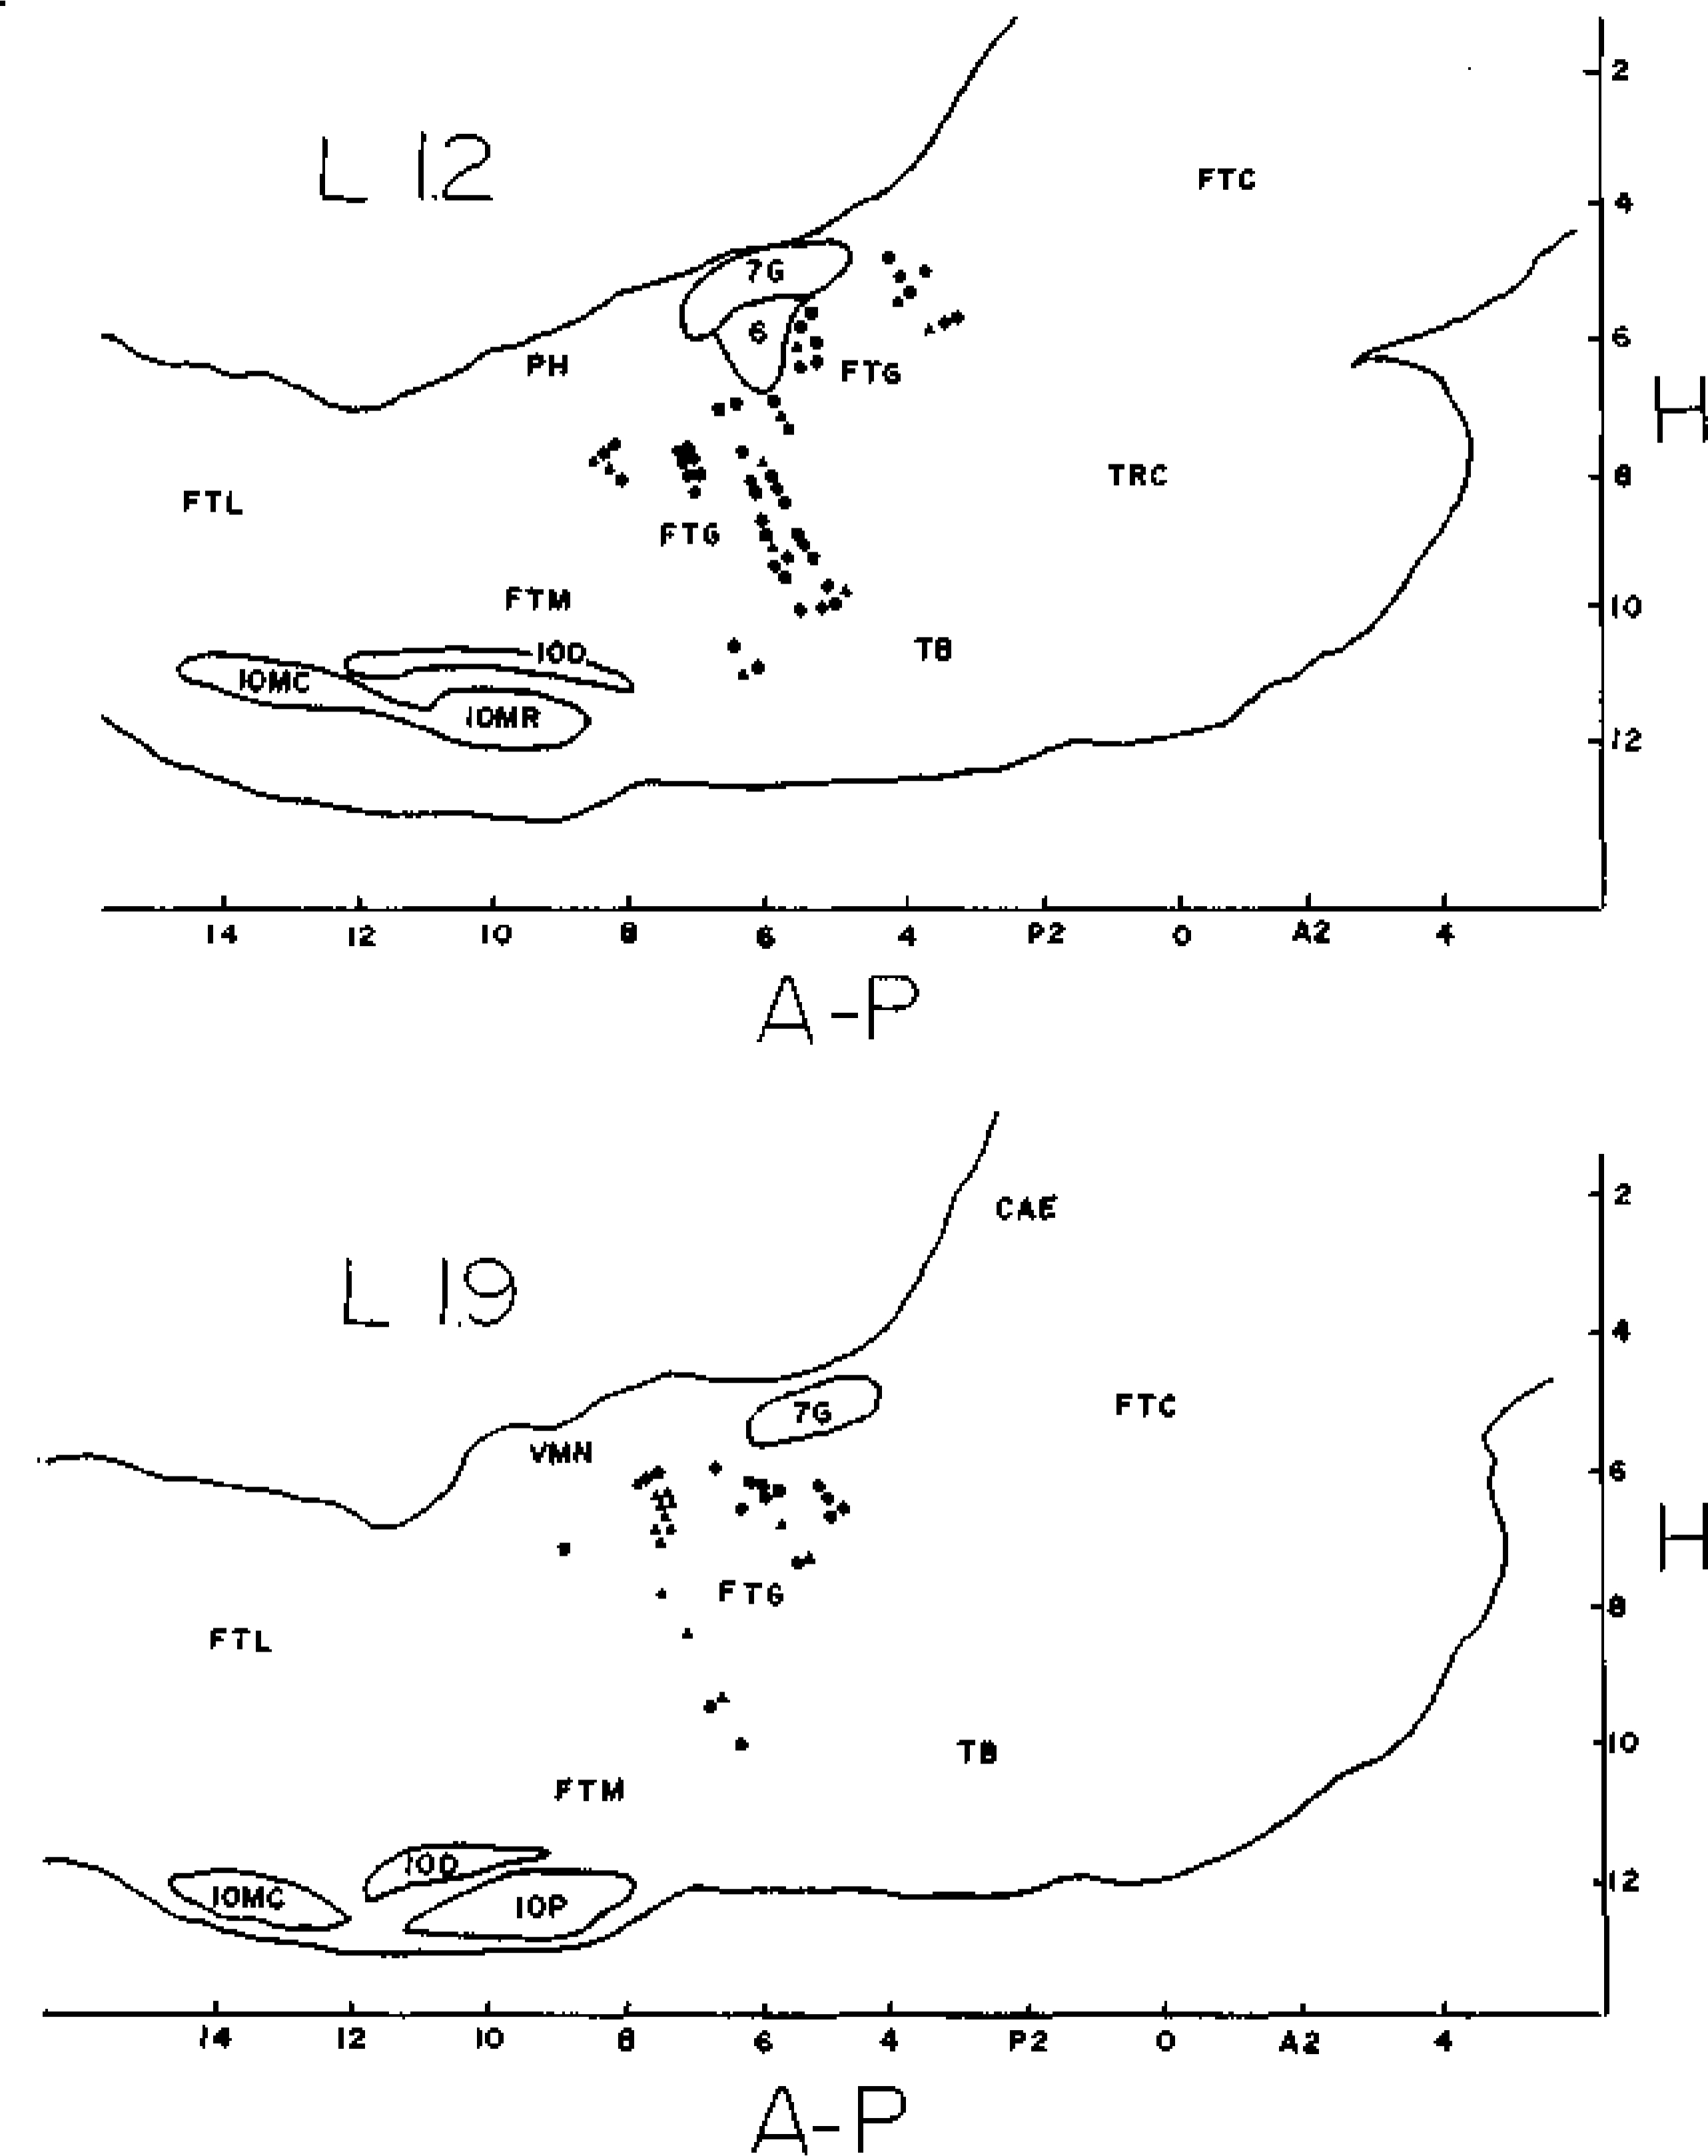
Stereotaxic positions of FTG cells mapped on sagittal sections 1.2 (top) or 1.9 (bottom) mm lateral to the midline. Type 1 cells are represented by triangles, type 2 by squares, and type 3 by circles. A-P— millimeters anterior or posterior to stereotaxic zero, H—millimeters ventral to Stereotaxic zero, 6—abducens nucleus, 7G— genu of the facial nerve, CAE—nucleus coeruleus, FTC—central tegmental field, FTG—gigantocellular tegmental field, FTL—lateral tegmental field, FTM—magno-cellular tegmental field, IOD—dorsal accessory nucleus of the inferior olive, IOMC— medial accessory nucleus of the inferior olive, caudal division, IOMR—medial accessory nucleus of the inferior olive, rostral division, IOP—principal nucleus of the inferior olive, PH—nucleus praepositus hypoglossi, TB—trapezoid body, TRC—tegmental reticular nucleus, central division, VMN—medial vestibular nucleus. to that of the maximum waking rates was 0.41. Comparison of the geometric mean of average REM rates with that of the minimum waking rates would produce a selectivity ratio of 120.15.
Fig. 5.
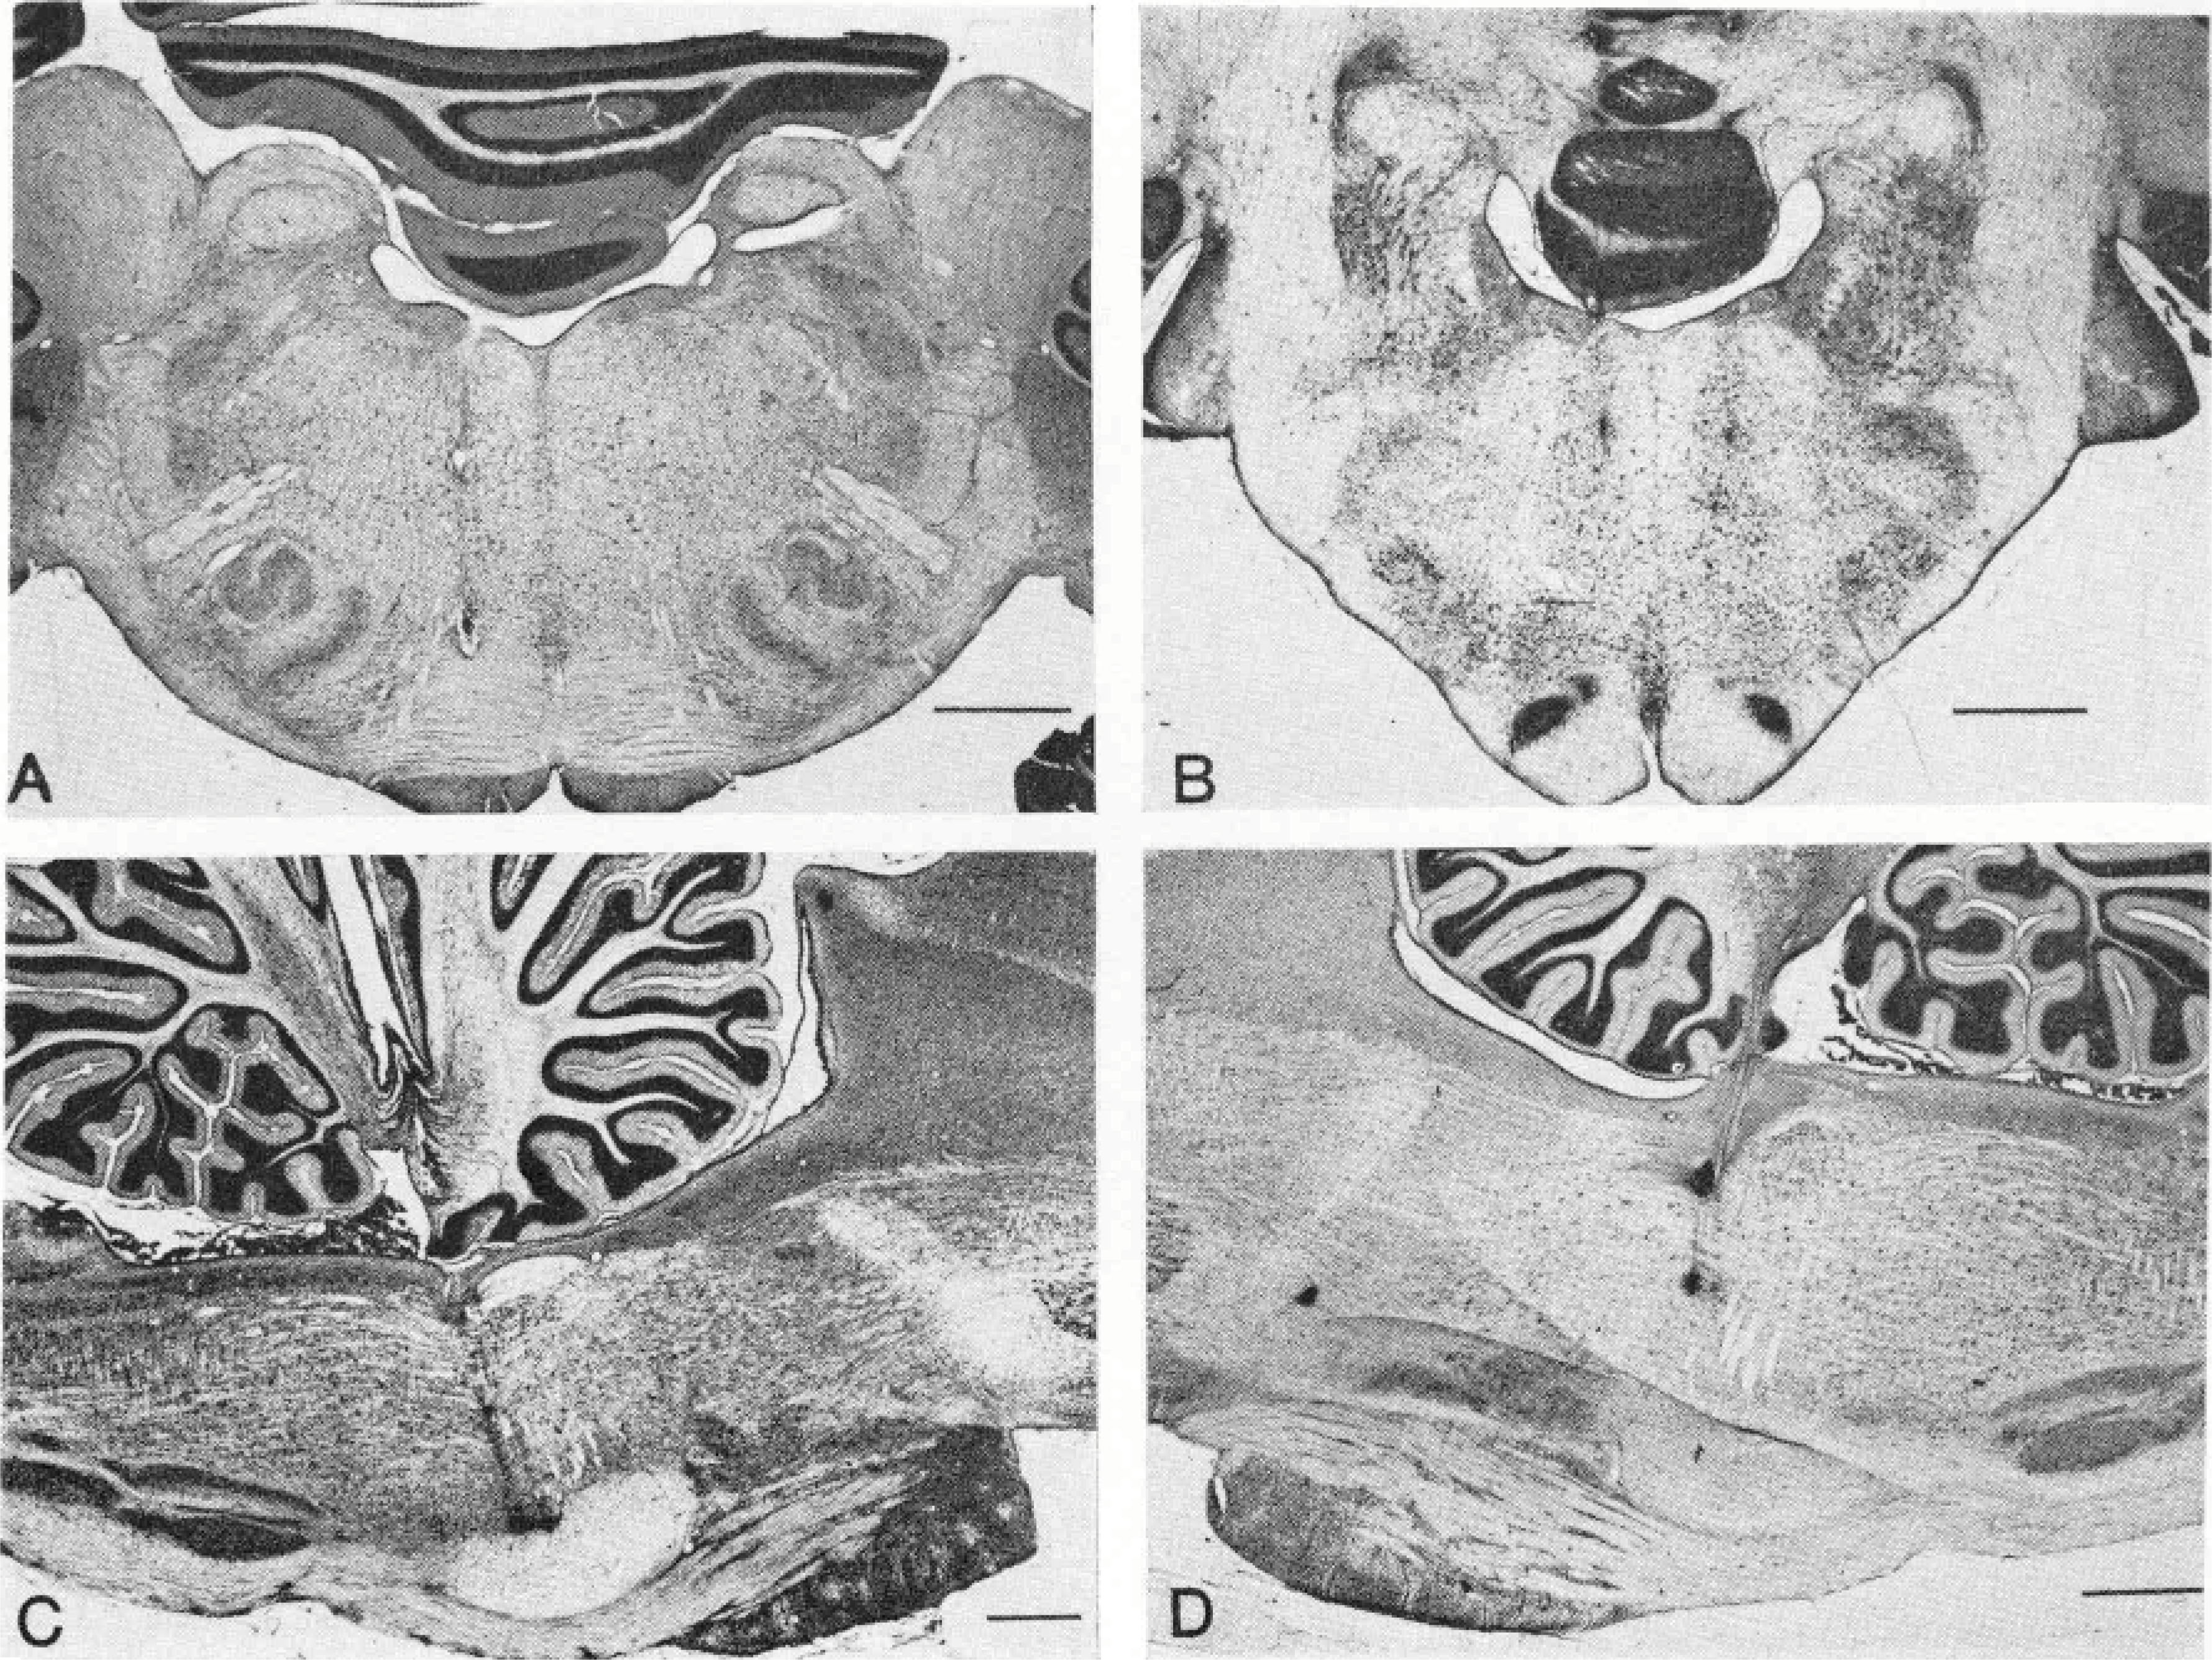
Representative electrode tracks. A—Coronal section at PS.2. Two electrode tracks are visible on left portion of slide. B—Coronal section at P7.7. A bilateral pair of electrode tracks is visible. C—Sagittal section at L1.2. A pair of electrode tracks and their terminal lesions are visible. D—Sagittal section at L1.2. An electrode track with two lesions. Calibration lines, 2 mm.
Behavioral Correlates.
The sensory responses and motor correlates of discharge are similar for all three neuronal types. Discrete stimuli evoked only brief unit responses, as previously reported (22, 24). Most discharge was linked to specific movements of the head and neck, ear, forepaw, scapula, tongue, or face (24). A unit’s rate of discharge was a function of the direction and speed of the cat’s movements. A cell which fired during leftward head movements when the cat groomed its loft side might not fire during vertical head movements occurring when the cat groomed its paw (Fig. 6). Many factors, including the stimuli that were present and the general activity level of the cat, influenced the cat’s motor behavior and therefore the discharge rates of FTG units.
Fig. 6.
Activity of FTG unit during grooming. This cell fired during leftward head movements but not during vertical movements. Unit’s discharge rate was a function of the type of movements occurring during sampling periods.
Unit discharge during waking was monitored with an oscilloscope to confirm the absence of movement artifact. Wave shape and amplitude of unit spikes were stable. We never saw the notched spikes or short inter-spike intervals typical of injury discharge. Indeed, minimum interspike intervals tended to be shorter in REM sleep than in waking (14). Five units were studied while the cat was under barbiturate (Netnbutal) anesthesia. Under those conditions vigorous movement of the head by the experimenter, in all axes, did not produce any unit discharge. Recordings were stable for long periods of time (normally more than 12 h) and units were never lost abruptly during waking” discharges. Furthermore, a variety of observations discussed previously (23, 24), including firing- during isometric muscle contractions while the cat’s head was restrained, habituation of discharge to vestibular and other stimuli, and the nature of movement correlations, are all inconsistent with the possibility that motor-related unit discharge represents movement artifact.
Discharge Rates.
During waking, units discharged in a phasic manner in association with movements. During periods of vigorous movement, rates exceeding 100 discharges/s could be observed, whereas immediately after the movement the same unit could remain completely silent for several seconds. The upper portion of Fig. 7 shows a continuous 11-min sample of unit activity from a waking period of a typical type 3 cell. No stimuli were applied to the cat during this period. As the figure illustrates, waking discharge rates vary over a wide range. “Average” waking rate for an FTG cell would be entirely a function of the cat’s behavior during the sample period. Because the exact onset and offset times of movements cannot be consistently and unambiguously defined, we determined the maximum and minimum 10-s rates. This provided a more conservative and replicable estimate of the range of waking activity rates.
Fig. 7.
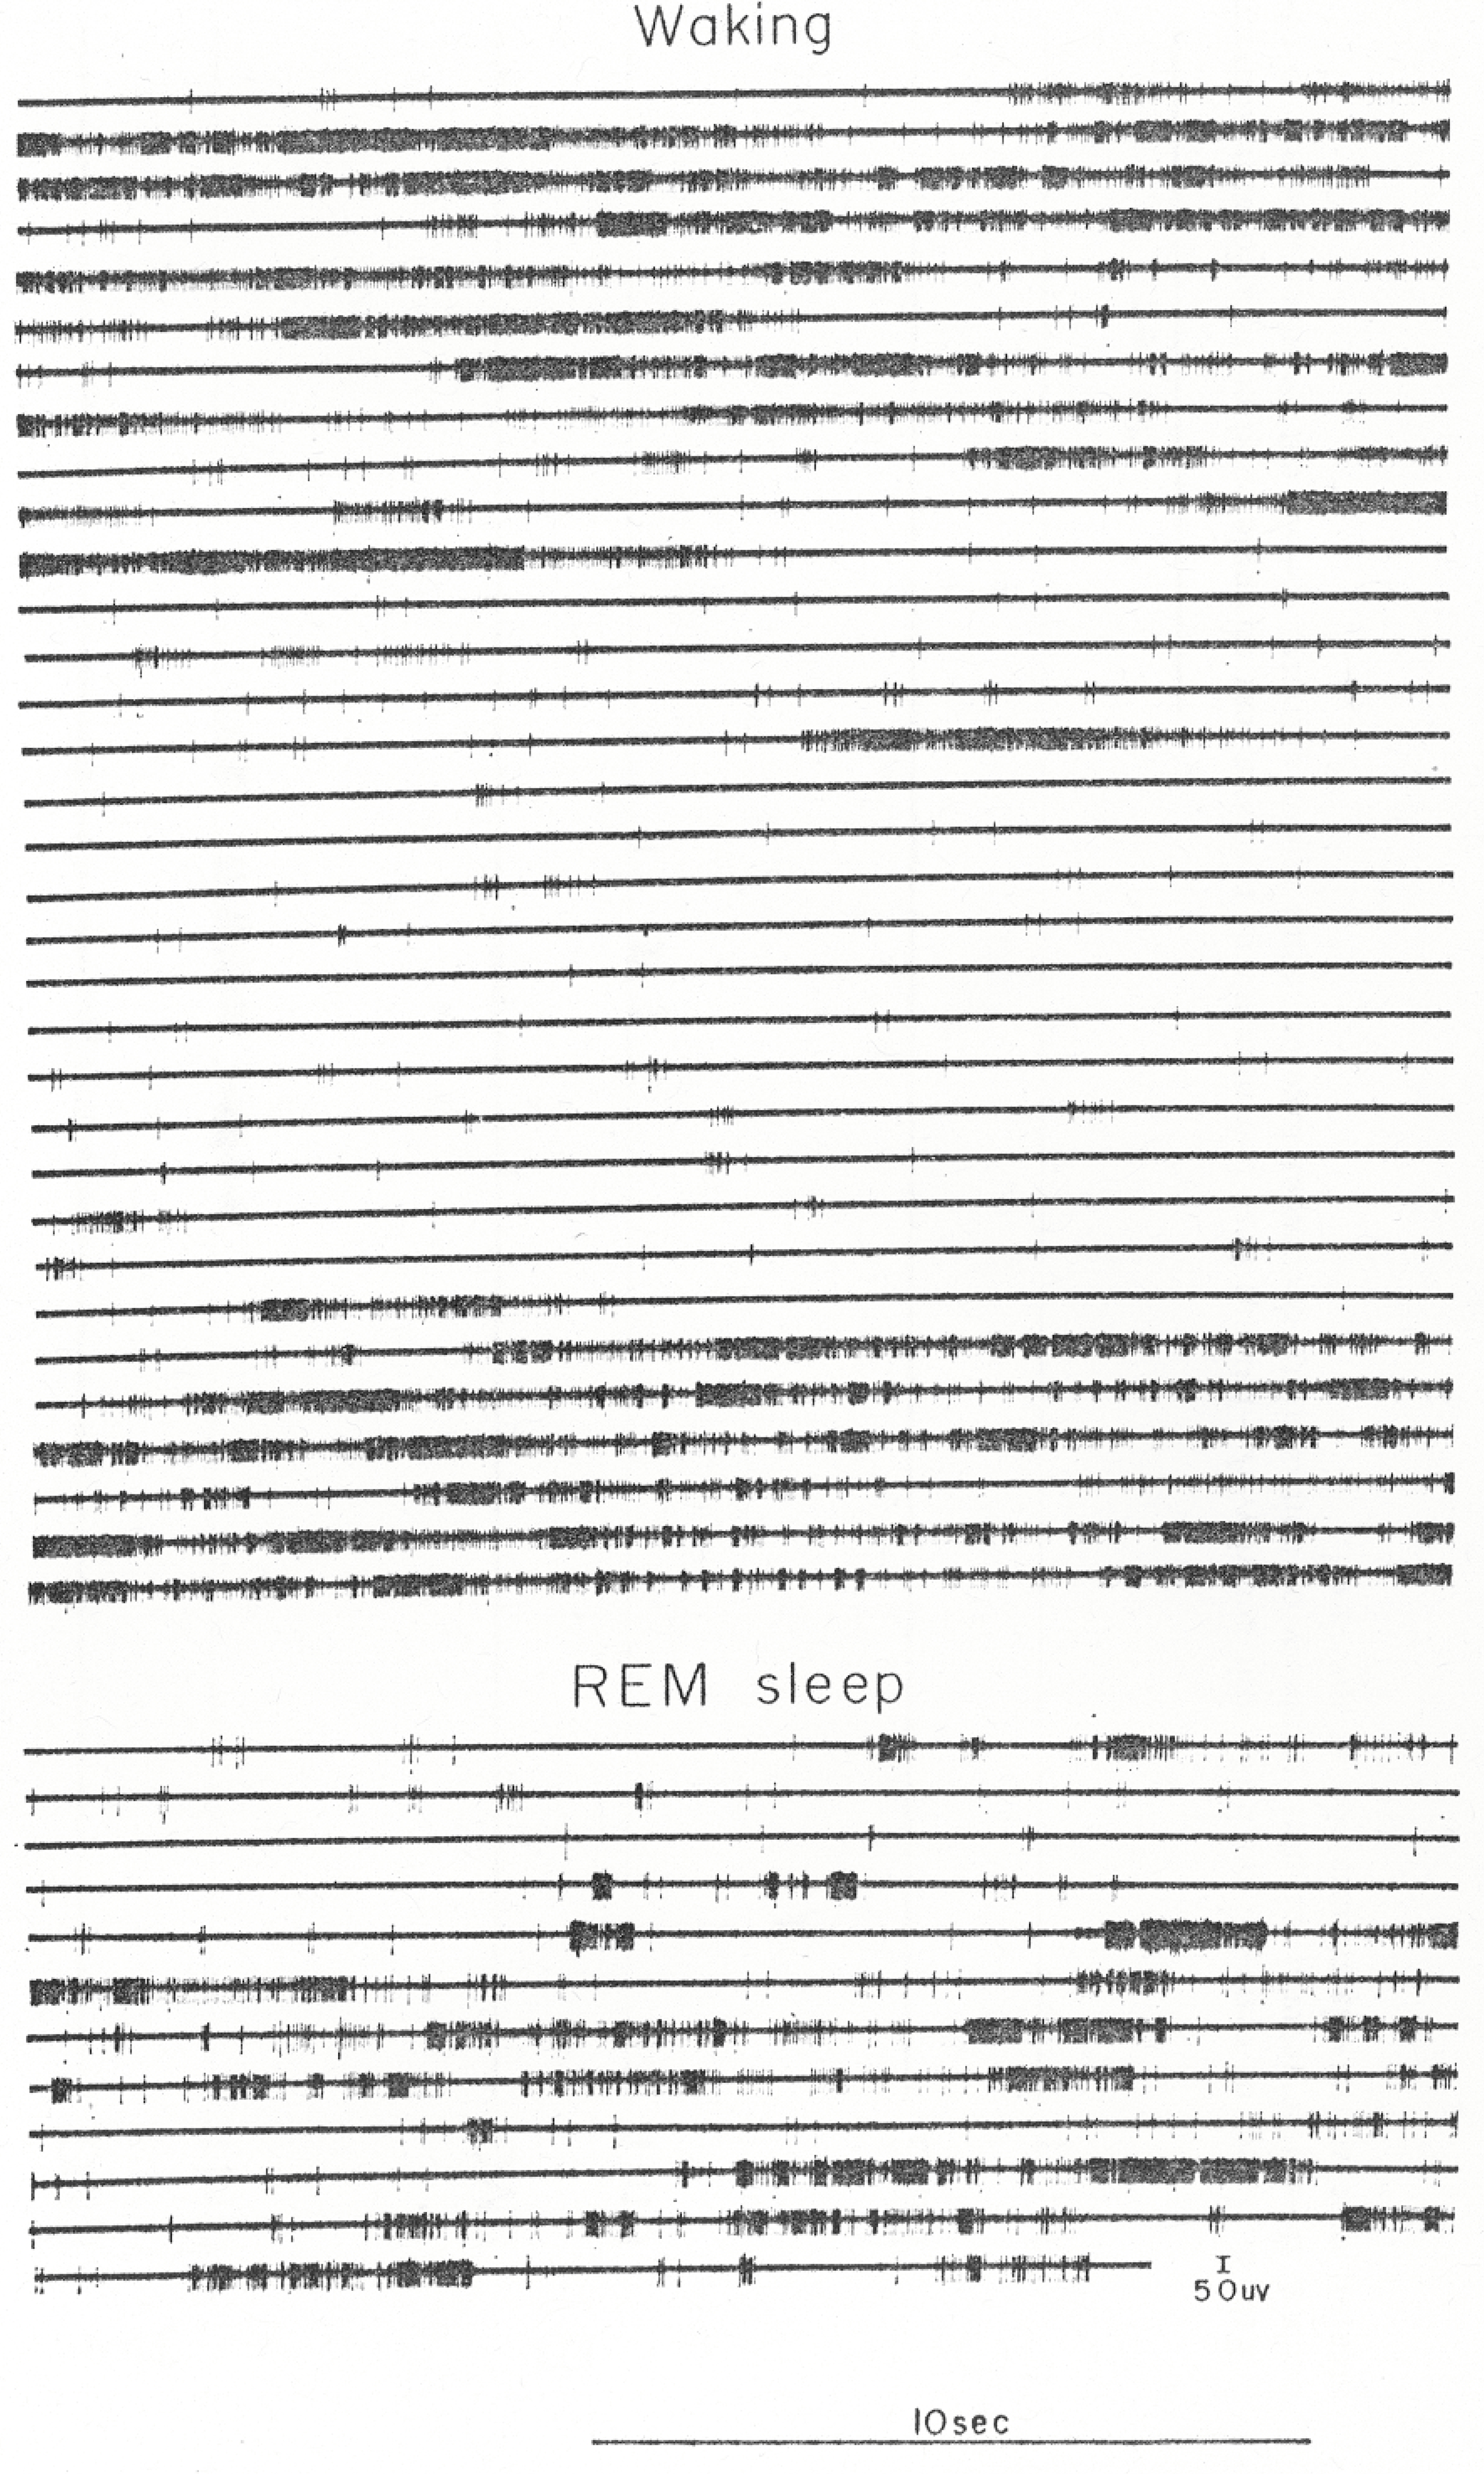
Two continuous samples of the amplified unit recording of a type 3 cell. The upper portion is an 11-min waking sample, and the lower is a 4-min recording spanning an entire REM sleep period. Note the variability of rate. “Average” waking rates would be a function of the cat’s behavior during the sample period.
During REM sleep, type 2 and 3 FTG units discharged in phasic bursts, separated by periods of reduced activity. The burst—pause pattern of discharge in REM sleep was similar to that seen in active waking. The lower portion of Fig. 7 presents a continuous 4-min sample of REM sleep activity in a type 3 unit. Table 1 presents systematic rate data for 31 type 2 and 3 FTG cells.
TABLE 1.
Discharge Rates of Type 2 and 3 Cells during Waking with and without Movement, REM sleep, and Slow-Wave Sleep
| Waking |
|
|
|
REM sleep |
Slow-wave Mean rate | |
|---|---|---|---|---|---|---|
| With movement (10-s maximum) | Without movement (10-s minimum) | Mean rate | 10-s maximum | 10-s minimum | ||
|
| ||||||
| Overall (« = 31) | ||||||
| Arithmetic mean | 43.37 | 0.72 | 17.36 | 63.75 | 0.76 | 5.44 |
| Standard deviation | 21.11 | 2.09 | 8.02 | 31.79 | 1.48 | 10.30 |
| Geometric mean | 38.17 | 0.13 | 15.62 | 57.16 | 0.22 | 1.31 |
| Type 2 (N = 9) | ||||||
| Arithmetic mean | 49.24 | 2.12 | 21.52 | 82.97 | 1.27 | 16.61 |
| Standard deviation | 26.08 | 3.57 | 11.11 | 48.22 | 1.97 | 14.06 |
| Geometric mean | 42.22 | 0.69 | 18.87 | 68.21 | 0.59 | 11.74 |
| Type 3 (n = 22) | ||||||
| Arithmetic mean | 40.97 | 0.14 | 15.66 | 55.88 | 0.56 | 0.87 |
| Standard deviation | 18.89 | 0.46 | 5.87 | 18.30 | 1.23 | 1.00 |
| Geometric mean | 36.63 | 0.03 | 14.46 | 52.17 | 0.13 | 0.49 |
All FTG neurons had 10-s waking rates exceeding their mean REM sleep rate. The “selectivity ratio” comparing the geometric mean of the maximum 10-s REM sleep rates with that of the maximum 10-s waking rates was 1.50, and the ratio of the geometric mean of the average REM sleep rates
Correlation between Waking and REM Rates.
Maximum waking rates were surprisingly well correlated with REM sleep rates, despite the variability within both measures among sleep cycles for any single cell. The correlation coefficient between waking and REM sleep maximum rates for type 2 and 3 cells was + 0.43, P < 0.02 (n = 31). The correlation coefficient between waking maximum and REM sleep average rates was + 0.52, P < 0.003 (n = 31).
Effect of Restraint.
Previous studies concluding that FTG neurons fire selectively in REM sleep have utilized a preparation adapted to an atraumatic restraint system that prevented head movements. Therefore, we investigated the effect of head restraint on unit activity to determine if this procedure might account for the low waking discharge rates that have been reported.
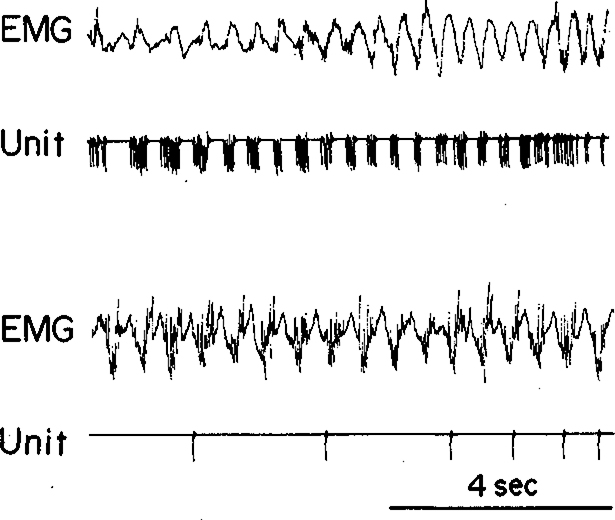
We found that immediately after the onset of restraint in naive cats, FTG units continue to show rapid discharge in association with periods of struggling (Fig. 8A). Indeed, during the first 3 min of restraint, the intermittent motor activity produces an elevation of discharge rates (24). After several minutes, both struggling and FTG activity decrease (Fig. 8B, C). Cats which have previously experienced restraint will show a more rapid reduction in both struggling and unit discharge during the procedure. If the cat is not disturbed, the rate reduction can continue for the duration of the restraint period with average discharge rates approximating the minimum waking rates obtained in the unrestrained cat.
Fig. 8.
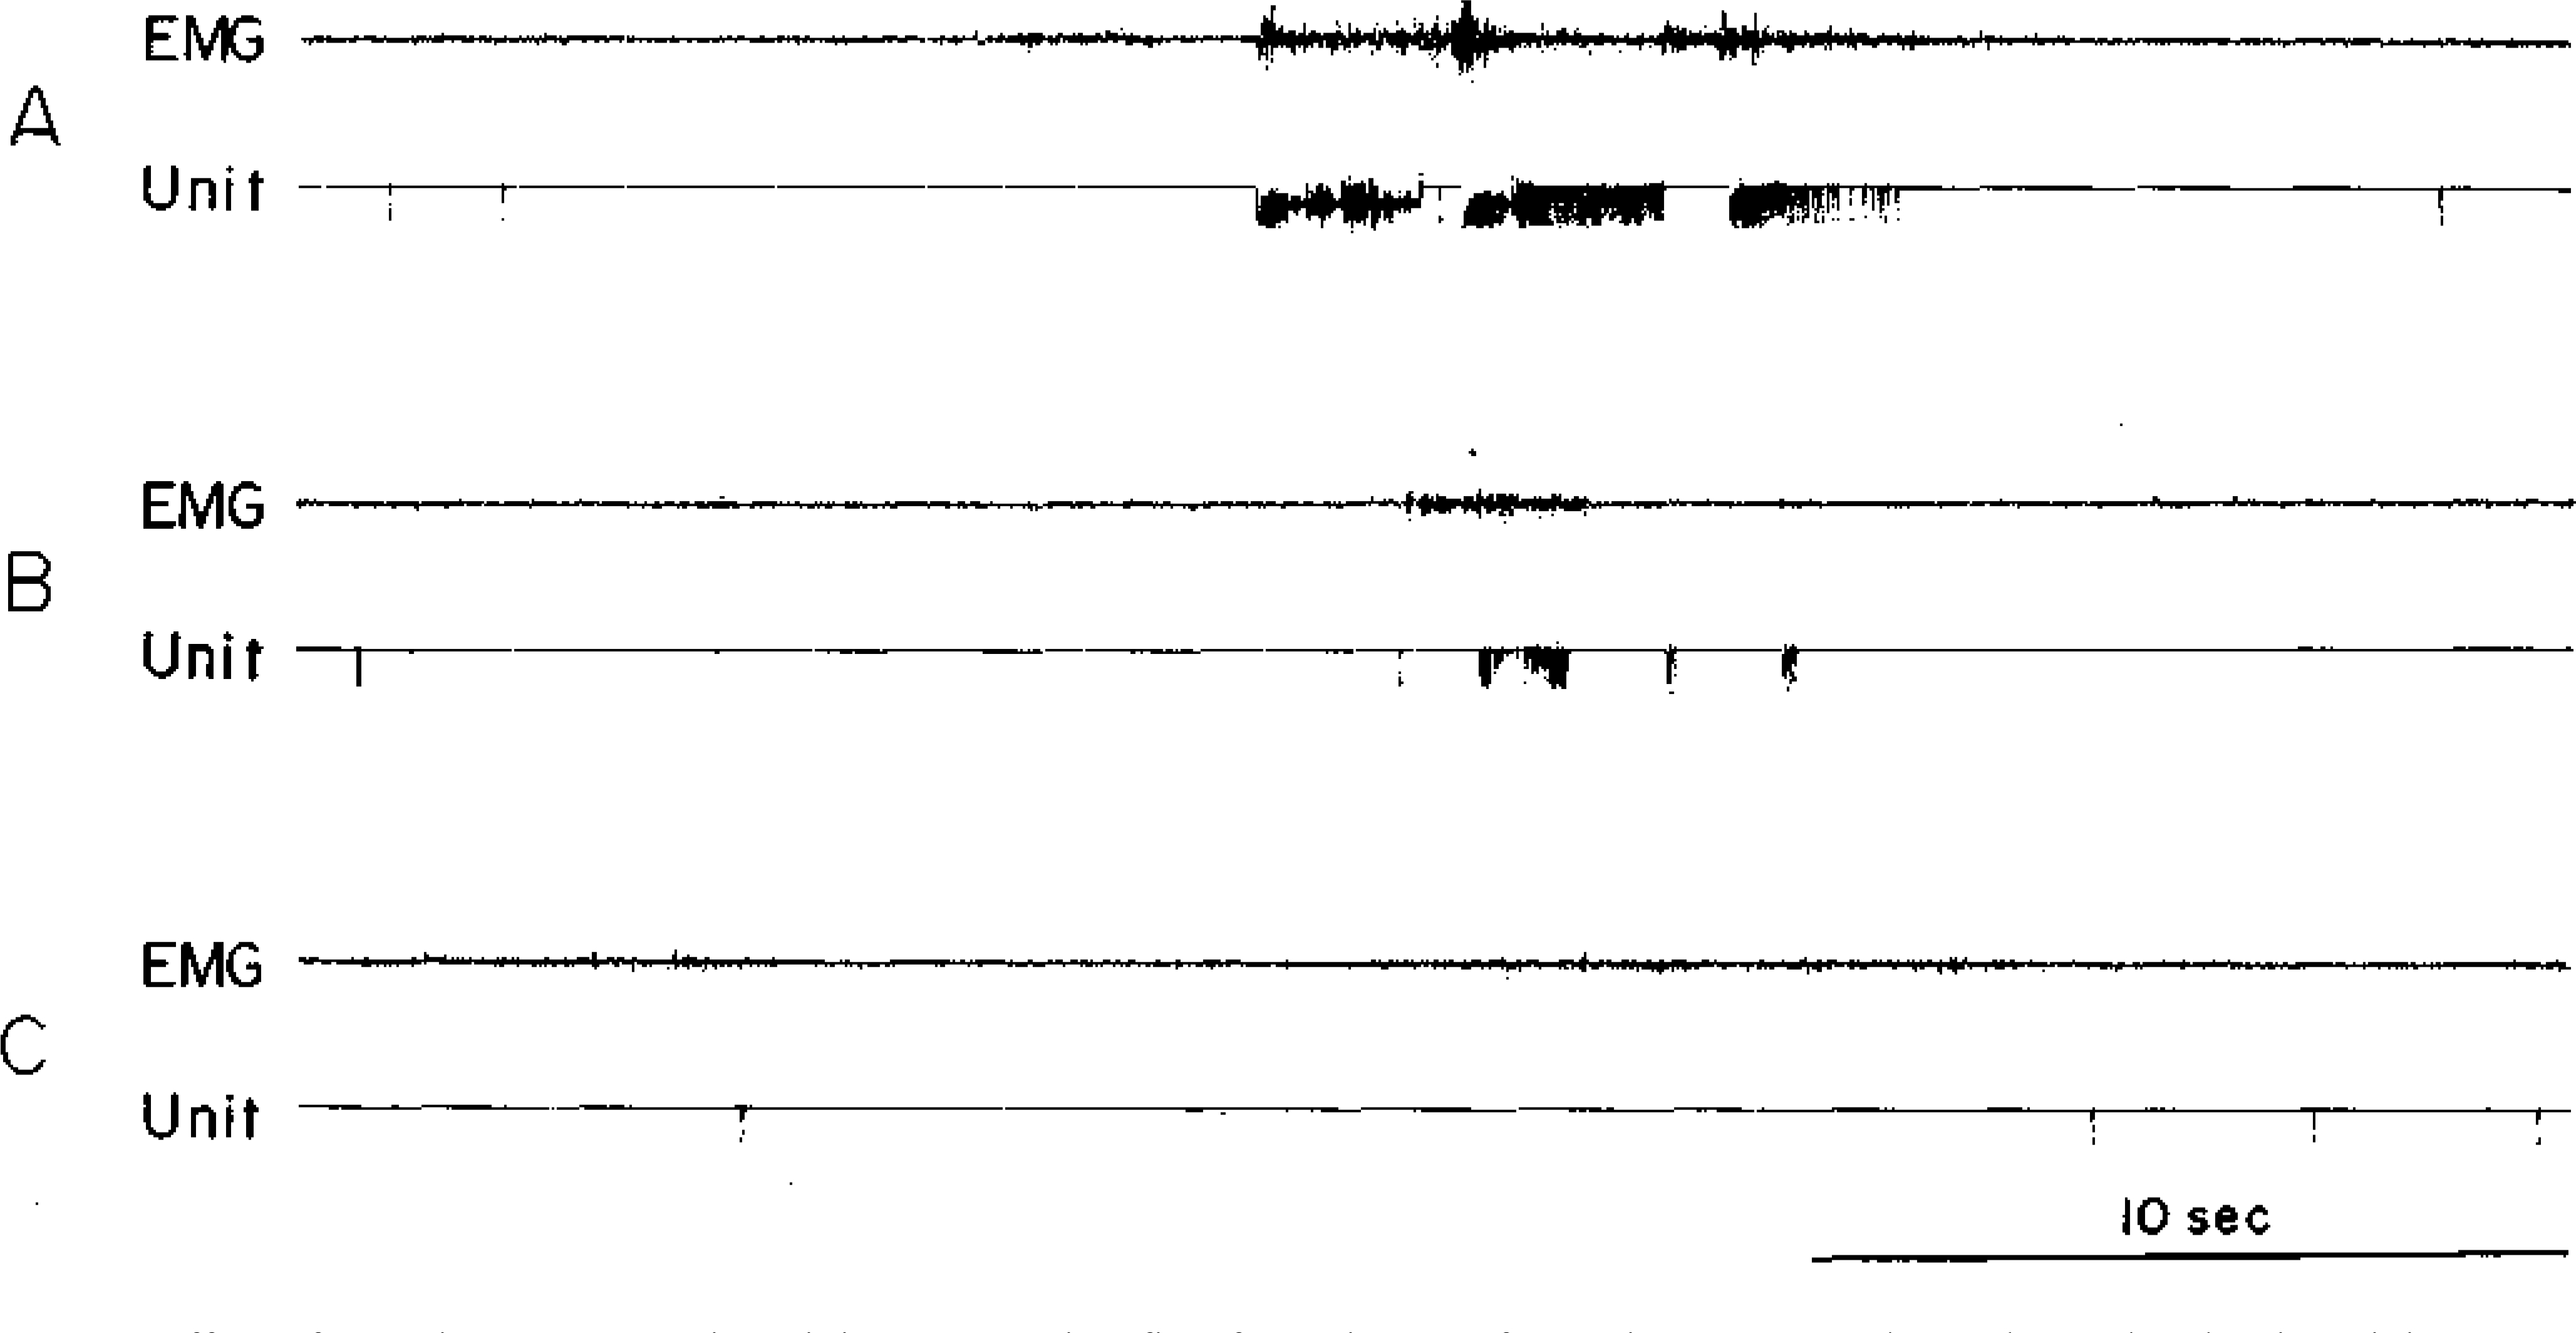
Effect of restraint on FTG unit activity. A—During first few minutes of restraint, cat struggles and correlated unit activity occurs. B—After several minutes, intensity of unit activity decreases together with motor activity. C—As cat becomes adapted to restraint, unit activity is maintained at low level.
DISCUSSION
Maximum 10-s waking rates exceeded average REM sleep rates in every FTG unit we encountered. Maximum waking rates were always associated with specific motor activities. Thus, the ratio of REM sleep rates to waking rates, or “selectivity” (13), was a function of the cat’s motor activities during the waking period used for comparison. Similar findings in the rat had been briefly reported (26). Procedural differences can explain the selectivity of FTG unit discharge for REM sleep found in earlier studies (9, 13). Previous investigations used cats which were secured to an atraumatic head restraint device. We have shown that as the cat adapts to such restraint, both motor activity and unit discharge decrease. Hobson et al. utilized a behavioral adaptation procedure (8), placing the cat in the restraint system for several hours before recording unit activity in order to reduce struggling. Furthermore, cats were subjected to a 12-h sleep deprivation procedure prior to recording sessions (13) which might also tend to reduce waking activity. This reduction in waking activity would then make discharge in the FTG cells appear to be “selective” for REM sleep. In our unrestrained cats “selectivity ratios” based on minimum waking or SWS rates resembled those reported by Hobson et al. (9).
When cats were adapted to restraint they did not attempt many movements, as was evidenced by the reductions in phasic EMG activity or struggling (e.g., see Fig. 8). The exclusion of “isolated bursts associated with gross movement” (10) would further reduce estimates of waking discharge rate and variability in restrained animals. This technique produces a lower and more stable waking discharge rate than seen in the behaving animal. Rate changes preceding REM sleep, the unit’s “tonic latency” (10), can be more easily detected when compared with a low and less variable baseline rate.
In agreement with many previous studies of these neurons (1, 4, 9, 16, 19, 20), we have found consistent but relatively weak responses to discrete sensory stimuli. Only when stimuli evoke a motor response do extended discharge bursts occur. Depriving units of their adequate stimuli did not appreciably reduce their average waking discharge rates (24).
The NSA, or type 1 FTG units, normally had little or no activity in REM sleep and therefore could be described as having discharge selectivity for waking. These units discharged primarily during specific movements. This cell type has not been identified in the previous sleep studies of this region, presumably because of the lack of motor activity in the restrained preparation, and the practice of searching for units during sleep (9), a time when NSA cells are normally silent. We found that at least 28% of the FTG neurons were of this type.
The discharge of FTG neurons during REM sleep is consistent with a variety of findings suggesting that motor activation occurs in this state. This activation can be clearly seen in the movements of younger animals, where REM sleep is often described as “active” sleep. In older animals the motor discharge is less obvious except in the occulomotor system and in the occasional twitches in facial and distal limb musculature. Expression of motor activation is prevented in REM sleep by postsynaptic inhibition of motor neurons (17). However, the activation can still be detected in unit recordings from a variety of motor systems including pyramidal tract (3), cerebellum (15), ventrolateral thalamus (12), and red nucleus (5). Lesions in the dorsal pontine tegmentum appear to disrupt the peripheral motor inhibition of REM sleep, producing a preparation which engages in intense overt motor activity during a state which otherwise resembles REM sleep (7, 11). Because FTG neuronal discharge is clearly related to motor activity in waking, the presence of unit activity during REM sleep in the FTG system of intact cats supports the interpretation that the dorsal pontine lesion preparation allows the expression of normal REM sleep motor activation.
We find that unit discharge rates during REM sleep are positively correlated with their rates during waking. This finding is further evidence for a similar role of FTG units in the motor activity of both waking and REM sleep. If NS A cells are included, the correlation between waking and REM discharge rates would be even greater because, in the unstimulated cat, NSA rates are quite low in both states. The principal differences between FTG discharge pattrns in these two states are increased frequency of interspike intervals shorter than 12.5 ms and of spike bursts lasting more than 720 ms in REM sleep (14).
In conclusion, high rates of firing during waking are readily observed in FTG neurons recorded in unrestrained cats. Their waking discharge rates on the average reach 250% of the average REM rates. Thus, high rates of firing in FTG cells are not linked uniquely to the REM state and are not sufficient for its triggering. These observations suggest that these neurons are not the “executive” neurons for REM sleep generation. Further investigation will be required to determine the functional role of FTG unit discharge in REM sleep. The most parsimonious conclusion that can be drawn from the present study is that FTG cells are motor-related cells, participating in the activation of motor systems which occurs in both waking and REM sleep.
Acknowledgments
Supported by the Medical Research Service of the Veterans Administration and U.S. Public Health Service Grant MH10083.
Abbreviations :
- REM
rapid eye movement
- FTG
gigantocellular tegmental field
- NSA
no spontaneous activity
- SWS
slow-wave sleep
- EEG
electroencephalogram
- EMG
electromyogram
REFERENCES
- 1.AMASSIAN VE, AND DEVITO RV. 1954. Unit activity in reticular formation and nearby structures. /. Neurophysiol. 17 : 575–603. [DOI] [PubMed] [Google Scholar]
- 2.HERMAN AL 1968. The Brain Stem of the Cat. University of Wisconsin Press, Madison. [Google Scholar]
- 3.EVARTS EV 1964. Temporal patterns of discharge of pyramidal tract neurons during sleep and waking in the monkey. J. Neurophysiol. 27: 152–171. [DOI] [PubMed] [Google Scholar]
- 4.GROVES PM, MILLER SW, PARKER MV, AND REBEC GV. 1973. Organization by sensory modality in the reticular formation of the rat. Brain Res. 54: 207–224. [DOI] [PubMed] [Google Scholar]
- 5.HARPER RM, AND JACOBS BL. 1972. Red nucleus neuronal activity during sleep and wakefulness. Sleep Res. 1 : 20. [Google Scholar]
- 6.HARPER RM, AND McGiNTY DJ. 1973. A technique for recording single neurons from unrestrained animals. Pages 80–104 in PHILLIPS MI, Ed., Brain Unit Activity during Behavior. Thomas, Springfield, Illinois. [Google Scholar]
- 7.HENLEY K, AND MORRISON AR. 1974. A re-evaluation of the effects of lesions of the pontine tegmentum and locus coeruleus on phenomena of paradoxical sleep in the cat. Acta Neurobiol. Exp. 34: 215–232. [PubMed] [Google Scholar]
- 8.HOBSON JA 1972. A method of head restraint for cats. 1972. Electroencephalogr. Clin. Neurophysiol. 32 : 443–444. [DOI] [PubMed] [Google Scholar]
- 9.HOBSON JA, MCCARLEY RW, PIVIK T, AND FREEDMAN R. 1974. Selective firing by cat pontine brain stem neurons in desynchronized sleep. /. Neurophysiol. 37: 497–511. [DOI] [PubMed] [Google Scholar]
- 10.HOBSON JA, MCCARLEY RW, FREEDMAN R, AND PIVIK RT. 1974. Time course of discharge rate changes by cat pontine brain stem neurons during sleep cycle. /. Neurophysiol. 37 : 1297–1309. [DOI] [PubMed] [Google Scholar]
- 11.JOUVET M, AND DELORME F. 1965. Locus coeruleus et sommeil paradoxal. C. R. Soc. Biol (Paris’) 159: 895–899. [Google Scholar]
- 12.LAMARRE Y, FILION M, AND CORDEAU JP. 1971. Neuronal discharges of the ventrolateral nucleus of the thalamus during sleep and wakefulness in the cat. I. Spontaneous activity. Exp. Brain Res. 12: 480–498. [DOI] [PubMed] [Google Scholar]
- 13.McCARLEY RW, AND HOBSON JA. 1971. Single neuron activity in cat giganto-cellular tegmental field: selectivity of discharge in desynchronized sleep. Science 174: 1250–1252. [DOI] [PubMed] [Google Scholar]
- 14.McGiNTY DJ, AND SIEGEL JM. 1977. Neuronal activity patterns during rapid-eye-movement sleep: relation to waking patterns. Pages 135–158 in DRUCKER-COLIN R AND McGAucH J, Eds., Neurobiology of Sleep and Memory. Academic Press, New York. [Google Scholar]
- 15.Pellet J, tardy MF, harlay F, dubrocard S, and gilhodes JC. 1974. Activite spontanee des cellules dc Purkinje chez le chat chronique: etude statistique des spikes complexes. Brain Res. 81 : 75–96. [DOI] [PubMed] [Google Scholar]
- 16.PETERSON BW, FRANCK JI, PITTS NG, AND DAUNTON NG. 1976. Changes in responses of medial pontomedullary reticular neurons during repetitive cutaneous, vestibular, cortical and tectal stimulation. /. Neurophysiol. 39: 564–581. [DOI] [PubMed] [Google Scholar]
- 17.POMPEIANO O 1970. Mechanisms of sensorimotor integration during sleep. Progr. Physiol. Psychol. 3 : 1–179. [Google Scholar]
- 18.POMPEIANO O, AND HOSHINO K. 1976. Central control of posture: reciprocal discharge by two pontine neuronal groups leading to suppression of decerebrate rigidity. Brain Res. 116: 131–138. [DOI] [PubMed] [Google Scholar]
- 19.SCHEIBEL ME, AND ScHEiBEL AB. 1965. The response of reticular units to repetitive stimuli. Arch. Ital. Biol. 103 : 279–299. [PubMed] [Google Scholar]
- 20.SEGUNDO JP, TAKENAKA T, AND ENCABO H. 1967. Somatic sensory properties of bulbar reticular neurons. /. Neurophysiol. 30 : 1221–1238. [DOI] [PubMed] [Google Scholar]
- 21.SIEGEL JM 1974. A stereotaxic map of the bony tentorium of the cat. Physiol. Behav. 13: 715–717. [DOI] [PMC free article] [PubMed] [Google Scholar]
- 22.SIEGEL JM, AND McGINTY DJ. 1976. Waking activity in pontine FTG neurons. Nemosci. Abst. 2: 896. [Google Scholar]
- 23.SIEGEL JM, AND McGINTY DJ. 1976. Brainstem neurons without spontaneous unit discharge. Science 193 : 240–242. [DOI] [PMC free article] [PubMed] [Google Scholar]
- 24.SIEGEL JM, AND McGINTY DJ. 1977. Pontine reticular formation neurons: relationship of discharge to motor activity. Science 196: 678–680. [DOI] [PMC free article] [PubMed] [Google Scholar]
- 25.STERMAN MB, KNAUSS T, LEHMANN D, AND CLEMENTE CD. 1965. Cir-cadian sleep and waking patterns in the laboratory cat. Electroencephalogr. Clin. Neurophysiol. 19, 509–517. [DOI] [PubMed] [Google Scholar]
- 26.VERTES RP 1976. Selective firing of rat pontine gigantocellular neurons during movement and REM sleep. Neurosci. Abst. 2: 897. [DOI] [PubMed] [Google Scholar]


