

SUMMARY
DNA-binding transcription factors (TFs) remain challenging to target with molecular probes. Many TFs function in part through interaction with Mediator, a 26-subunit complex that controls RNA polymerase II activity genome-wide. We sought to block p53 function by disrupting the p53-Mediator interaction. Through rational design and activity-based screening, we characterize a stapled peptide, with functional mimics of both p53 activation domains, that blocks p53-Mediator binding and selectively inhibits p53-dependent transcription in human cells; importantly, this “bivalent” peptide has negligible impact, genome-wide, on non-p53 target genes. Our proof-of-concept strategy circumvents the TF entirely and targets the TF-Mediator interface instead, with desired functional outcomes (i.e., selective inhibition of p53 activation). Furthermore, these results demonstrate that TF activation domains represent viable starting points for Mediator-targeting molecular probes, as an alternative to large compound libraries. Different TFs bind Mediator through different subunits, suggesting this strategy could be broadly applied to selectively alter gene expression programs.
In brief
Allen et al. combine chemical synthesis and biochemistry to develop a Mediator-targeting “bivalent” peptide that blocks p53-Mediator binding and selectively inhibits p53 target gene expression in human cells. This proof-of-concept study shows that p53 activity can be blocked by molecules targeting p53-Mediator binding, circumventing p53 itself.
Graphical Abstract
INTRODUCTION
Sequence-specific, DNA-binding transcription factors (TFs) drive myriad physiological processes and their mutation or disruption underlies many human diseases (Lee and Young, 2013). They are unquestionably high-impact targets for molecular therapeutics. Unfortunately, TFs have proved difficult to target with small molecules (Bradner et al., 2017); their DNA-binding domains are charged and similar to other TFs, and their activation domains (ADs) are typically unstructured and intrinsically disordered.
Among the estimated ~1,600 TFs in the human genome (Lambert et al., 2018), p53 stands out for its general importance in cancer biology (Kastenhuber and Lowe, 2017; Khoo et al., 2014; Kruiswijk et al., 2015). Across many cell lineages, p53 functions as a tumor suppressor and can paradoxically function as an oncogene if it acquires specific gain-of-function mutations (Freed-Pastor and Prives, 2012); p53 also plays key roles in mammalian development, aging, and stem cell biology. Like many TFs, the p53 protein possesses a DNA-binding domain and an AD. The p53AD actually consists of two separate but closely spaced domains, called AD1 (residues 13–29) and AD2 (residues 41–60). Although most transcriptional activation function can be attributed to p53AD1 (Jimenez et al., 2000; Johnson et al., 2005), loss-of-function p53AD1 mutations retain some ability to activate specific subsets of p53 target genes, and mutation of both AD1 and AD2 is required to mimic a p53-null phenotype (Brady et al., 2011; Jiang et al., 2011).
The human Mediator complex contains 26 subunits and is generally required for RNA polymerase II (pol II) transcription (Lambert et al., 2021). A four-subunit kinase module containing CDK8 or CDK19 can reversibly associate with Mediator to control its function (Luyties and Taatjes, 2022), but the CDK-Mediator complex was not a focus of this study. Mediator interacts extensively with the pol II enzyme and regulates its function in ways that remain poorly understood; however, a basic aspect of Mediator function is to enable TF-dependent activation of transcription. Mediator was discovered in Saccharomyces cerevisiae using an in vitro assay to screen for factors required for TF-dependent transcription (Flanagan et al., 1991), and similar functions were confirmed for human Mediator complexes (Fondell et al., 1996). Because TFs do not interact with pol II directly, these and other studies established that TFs regulate pol II function indirectly, through the Mediator complex. The p53 TF binds Mediator, and this interaction has been shown to activate p53 target gene expression in vitro and in cells (Ito et al., 1999; Meyer et al., 2010). Oncogenic mutations in p53AD1 disrupt p53-Mediator interactions (Ito et al., 1999), and this correlates with loss of p53 function (Lin et al., 1994). Although specific residues and structural details remain unclear, the p53-Mediator interface appears to involve the MED17 subunit (Ito et al., 1999; Meyer et al., 2010). Interestingly, other TFs (e.g., SREBP or nuclear receptors) activate transcription through interactions with different Mediator subunits (Ito et al., 2000; Yang et al., 2006).
Directly targeting TF ADs has proved to be a difficult strategy to control TF function. Here, we sought to test whether the same outcome could be achieved by targeting Mediator instead. We chose p53 as a test case because it is well studied and biomedically important and contains a well-characterized AD. An apparent obstacle was that Mediator is large (1.4 MDa, 26 subunits) and its p53 interaction site is not precisely defined. However, we reasoned that the p53 AD (residues 13–60) evolved to selectively interact with Mediator with high affinity; supporting this concept, the p53AD alone can selectively purify Mediator from human cell extracts (Meyer et al., 2010), and mass spectrometry analysis of p53AD-bound factors revealed Mediator as a top hit (Tables S1 and S2). Consequently, we used the native p53AD structure and sequence as a starting point, rather than screen thousands of drug-like compounds. To directly assess p53-Mediator function, we used a defined in vitro transcription system that recapitulated p53 and Mediator-dependent transcription. Biochemical results were tested further in human cells, using genome-wide approaches. Collectively, these experiments establish that p53 activity can be selectively controlled by targeting its interaction with Mediator.
RESULTS
An in vitro assay to test p53-activated versus basal transcription
To screen peptides for the ability to selectively block p53-dependent transcription, we required an assay that enabled p53-dependent activation but that could also support basal (i.e., activator-independent) transcription. We previously established an in vitro transcription assay (Knuesel et al., 2009) using purified human factors (Figure 1A). A key feature of this assay was that both activated and basal transcription could be reconstituted on naked DNA templates (i.e., DNA templates not assembled into chromatin). To adapt this assay for the purposes of measuring basal versus p53-activated transcription, we generated templates with Gal4 DNA-binding sites upstream of a TATA-containing promoter sequence (Figures S1A and S1B). Upon titration of a Gal4 DNA-binding domain-p53 AD (residues 1–70) fusion protein into this system, we observed pol II-dependent transcription that was dependent on p53AD and Mediator (Figure S1C). Reactions containing Gal4-p53AD generally produced about 2- to 4-fold more transcripts compared with reactions with no activator (Figure S1C). Because experiments without Gal4-p53AD produced a low level of basal transcription that could be quantitated, this system allowed assessment of both p53-activated and basal transcription.
Figure 1. Human factors and peptides used for the in vitro transcription assays.

(A) Purified pre-initiation complex (PIC) factors.
(B) WT p53AD1 sequence and sequences of p53AD1 peptides containing diverse penta-arg motifs.
(C) WT p53AD2 sequence and sequences of p53AD2 peptides.
(D) Residues Z, X, and B represent α,α-disubstituted amino acids with olefin tethers for hydrocarbon stapling. Unstapled structures shown.
Design and synthesis of stapled peptides
We designed hydrocarbon-stapled peptide mimetics of the AD1 and AD2 regions of p53. Hydrocarbon staples were employed to promote helicity within the peptides. Hydrocarbon-stapled peptides have previously been developed to mimic the α-helical portion of p53AD1 that binds MDM2/MDM4 with the goal of blocking the p53-MDM2/MDM4 interaction and restoring wild-type (WT) p53 activity (Bernal et al., 2007; Brown et al., 2013). For the p53AD1 mimetics, we synthesized N-acetylated versions of the penta-arg-containing peptides BP1.2–BP1.7 (Quach et al., 2018), which are based on residues 14–29 of p53 (Figure 1B). This panel of peptides contains an i, i + 7 hydrocarbon staple at positions 20 and 27 and five arginine residues grafted into various positions, which were originally introduced to improve peptide cytosolic access and nuclear localization (Quach et al., 2018). For the p53AD2 mimetics, we designed a panel of hydrocarbon-stapled peptides that varied the length and position of the hydrocarbon staple and spanned residues 45–57 of p53 (Figure 1C). The panel included two peptides with an i, i + 7 hydrocarbon staple (AD2–1 and AD2–2), two peptides with an i, i + 4 staple (AD2–3 and AD2–4), and one peptide with an i, i + 3 staple (AD2–4). Furthermore, both stapled and unstapled variants of the p53AD2 peptides were generated.
Functional screening of stapled peptide mimics of p53AD1 and p53AD2
Starting with the stapled p53AD1 peptides, we tested whether any would block p53-dependent transcription activation without inhibiting basal transcription. Initial screens were completed with 5 μM concentrations of each peptide (BP1.2–BP1.7; Figure 1B). At this concentration, all peptides reduced p53-activated transcription, but BP1.4 and BP1.5 did not affect basal transcription (Figure S1D). In follow-up experiments, we observed that the BP1.5 peptide negatively affected basal transcription to some degree, in contrast to BP1.4 (Figure S1E). We therefore chose the BP1.4 peptide for further testing (also see below).
To determine a concentration range in which the BP1.4 peptide selectively blocked p53-activated transcription but not basal transcription, we titrated BP1.4 into transcription reactions at concentrations between 0.9 μM and 9 μM (Figure S1F). Interestingly, BP1.4 activated basal transcription at concentrations of 4 μM and above, which could reflect weak binding of BP1.4 to Mediator (i.e., mimicking p53AD) to promote transcription activation. Consistent with this result, promoter-bound pol II complexes are activated upon p53-Mediator binding in vitro (Meyer et al., 2010). Although basal transcription was inhibited at the 9 μM titration point, the weak BP1.4-dependent activation made the determination of the half maximal inhibitory concentration (IC50) for basal transcription impossible using an inhibitor response curve. The IC50 describing the inhibition of p53-activated transcription by BP1.4 was 3.2 ± 0.2 μM (Figure S1G). The concentration window in which BP1.4 selectively blocked activated transcription was therefore relatively narrow, but this issue was circumvented with next-generation peptides (see below).
We next tested the p53AD2 peptides (Figure 1C) in a similar manner. In contrast to the p53AD1 peptides, the p53AD2 peptides either had no effect on p53-activated transcription or non-specifically inhibited both p53-activated and basal transcription at 5 μM (data not shown). Testing further at different peptide concentrations (i.e., increasing concentration if no activity was observed at 5 μM or decreasing concentration if both activated and basal transcription were inhibited) did not reveal any p53AD2 peptides with specificity for p53-activated transcription. These results were not entirely unexpected, as p53AD2 plays a lesser role (versus p53AD1) in activation of p53 target genes in vivo (Brady et al., 2011; Jiang et al., 2011; Jimenez et al., 2000; Johnson et al., 2005).
A “bivalent” peptide selectively blocks p53-dependent activation in vitro
We hypothesized that covalently linking two peptides with low to moderate affinity could generate a cooperatively binding bivalent peptide with improved ability to inhibit p53-dependent activation. Given the inactivity of the p53AD2 peptides tested, we elected to tether the BP1.4 peptide to the WT p53AD2 sequence. In this way, we hoped to generate a competitive inhibitor of p53AD-Mediator binding by recapitulating the combined landscape of p53AD1/AD2 interactions. Also, because the p53AD1 portion was stapled (e.g., BP1.4), it would permanently retain the α-helical state, lowering the entropic cost of binding to more effectively compete with WT p53 for Mediator binding.
We synthesized and tested three bivalent peptides (BP1.4 + p53AD2 sequence) that contained a 2-, 6-, or 10-unit polyethylene glycol (PEG) linker (bivalent peptide 1, 2, or 3; Figure S2A). Notably, the bivalent peptides were significantly more potent inhibitors of p53-activated transcription than BP1.4 alone. As shown in Figure S2B, bivalent peptides (500 nM) containing either a 6- or 10-unit PEG linker (i.e., bivalent peptide 2 or 3) inhibited p53-activated, but not basal, transcription. By contrast, the bivalent peptide with a 2-unit PEG linker (i.e., bivalent peptide 1) did not inhibit transcription at 500 nM (Figure S2B). We additionally compared bivalent peptides BP1.4 and BP1.5 with the PEG6 linker and found that BP1.4 was slightly more potent (Figures S2D and S2E). Because the bivalent peptide containing a 6-unit PEG linker (i.e., BP1.4_PEG6_p53AD2; bivalent peptide 2) was easier to synthesize versus 10-unit PEG, it was used for all future experiments. For simplicity, this molecule (bivalent peptide 2, Figure S2A) will be called the bivalent peptide throughout this paper.
The in vitro transcription assays on naked DNA templates demonstrated improved potency of the bivalent peptide and also confirmed that it inhibited p53-activated transcription but not basal transcription. We next tested its function on more physiologically relevant chromatin templates, in which basal transcription is repressed. In fact, a TF AD (such as p53AD) and Mediator are required for transcription on chromatin templates (Meyer et al., 2010; Naar et al., 1998), presumably because of the ability of Mediator to relay the activation signal from the TF directly to the pol II enzyme. In vitro transcription assays with chromatin templates revealed that the bivalent peptide had an IC50 of 85 nM when added to reactions with Gal4-p53AD. By contrast, the BP1.4 peptide alone had an IC50 of 330 nM in these assays (Figures 2A and 2B). Upon introduction of a QS mutation into p53AD2, which blocks its activation function in vivo (Jiang et al., 2011), the IC50 increased to 713 nM, about 8-fold higher than the bivalent peptide and 2-fold higher than BP1.4 alone (Figures 2A and 2B). Collectively, these results indicate that both p53AD1 and p53AD2 contribute to Mediator-dependent transcriptional activation in vitro.
Figure 2. In vitro transcription on chromatin templates reveals bivalent peptide is a potent and selective inhibitor of p53-dependent transcription.

(A) IC50 plot showing activity of bivalent peptide (n = 3–8 biological replicates) versus BP1.4 (stapled p53AD1 mimic; n = 2–6 biological replicates) or a bivalent peptide with a mutated p53AD2 region (n = 3–9 biological replicates).
(B) Representative data from experiments plotted in (A).
(C) IC50 plot showing that bivalent peptide is selective for p53; repressive activity is reduced with GAL4-VP16 (n = 2–6 biological replicates), which binds a different Mediator subunit compared with p53.
(D) Representative data from experiments plotted in (C). Vertical lines in plots represent standard error of the mean (A and C).
We next assessed whether the bivalent peptide would selectively block p53-dependent transcription compared with VP16, a viral AD. Although p53 and VP16 both interact with Mediator (Ito et al., 1999; Milbradt et al., 2011; Vojnic et al., 2011), they do so through different subunits (MED17 and MED25, respectively). In contrast to Gal4-p53AD (85 nM), the bivalent peptide had an IC50 of 424 nM in the presence of Gal4-VP16 (Figures 2C and 2D). These data, which resulted from experiments in which the only difference was the TF AD (i.e., identical DNA templates; identical TF DNA-binding domains), indicated that the bivalent peptide selectively blocked the p53-Mediator interaction versus the VP16-Mediator interaction; this was further supported by biochemical data (see below). The reduced transcription with Gal4-VP16 at much higher concentration of bivalent peptide likely reflects transcriptional squelching, in which high levels of TF ADs repress transcription in vitro or in cells, presumably through competition for binding of co-activators such as Mediator (Flanagan et al., 1991; Gill and Ptashne, 1988; Meyer et al., 1989).
Bivalent peptide directly inhibits p53AD-Mediator interaction
To further test whether the bivalent peptide would selectively block the p53AD-Mediator interaction, we performed a series of biochemical experiments, as outlined in Figure S3A. The p53AD can bind Mediator with specificity and apparent high affinity (Ito et al., 1999); for example, the p53AD itself is sufficient to selectively isolate Mediator from partially purified cell extracts (Meyer et al., 2010). As shown in Figure S3B, p53AD binding to Mediator was markedly reduced (approximately 60% bound versus no peptide controls) in the presence of the bivalent peptide; by contrast, the bivalent peptide did not reduce VP16AD binding to Mediator (Figure S3C). Furthermore, a QS mutation abolished the ability of the bivalent peptide to block Mediator binding (Figure S3B). These data are consistent with in vitro transcription results (Figure 2) and reveal that the bivalent peptide directly blocks p53AD-Mediator interactions. Chromatin immunoprecipitation sequencing (ChIP-seq) experiments in HCT116 cells showed general agreement with these in vitro binding results, as described below.
Bivalent peptide suppresses p53 activity in Nutlin-stimulated cells
Prior analysis of the BP1.4 peptide showed that it is not effectively taken up by cells (Quach et al., 2018), and, given its larger size, the bivalent peptide was expected to have poor cellular uptake. To circumvent this issue, we used a well-tested protocol to enhance cell uptake of the bivalent peptide (see STAR Methods). HCT116 cells were evaluated in either the presence of bivalent peptide (Figure 3A) or vehicle (water), with or without Nutlin-3a. Nutlin-3a is a small molecule that activates and stabilizes p53 by inhibiting MDM2, a repressor of p53 (Vassilev et al., 2004). A 3-h treatment time was used based on experiments that showed the bivalent peptide was biologically active for only a limited time in cells (see STAR Methods). After 3-h Nutlin-3a treatment (or DMSO control, plus or minus bivalent peptide), nuclear RNA was isolated and biological replicate RNA sequencing (RNA-seq) libraries were prepared (Table S3).
Figure 3. The bivalent peptide blocks activation of p53 target genes but has negligible effect on pol II transcription in the absence of p53 activation.

(A) Schematic of the stapled, bivalent peptide.
(B) Volcano plot showing significant induction of p53 target genes upon Nutlin treatment.
(C) Volcano plot showing that the bivalent peptide reduces expression of p53 target genes in Nutlin-treated cells.
(D) Enrichment score (GSEA) heatmap for Nutlin and Nutlin + peptide at a core set of p53 target genes. The p53 pathway is the most significantly altered pathway in both contexts: most upregulated in Nutlin and most downregulated in Nutlin + peptide (Figures S4A and S4B).
(E) Volcano plot showing that the bivalent peptide causes virtually no significant changes in pol II transcription in the absence of p53 activation. Although MT1M met the significance cutoff, the data showed an outlier in one DMSO replicate, suggesting that it does not reflect a true biological difference (see STAR Methods). RNA-seq data were obtained in biological replicate.
As expected, Nutlin-3a induced expression of p53 target genes (Figure 3B; gene set enrichment analysis [GSEA] Figure S4A, Table S4; qRT-PCR Figure S4C), consistent with previous studies in HCT116 cells (Allen et al., 2014). Strikingly, however, Nutlin-induced activation of p53 target genes was diminished in cells treated with the bivalent peptide (Figure 3C; GSEA, Figure S4B, qRT-PCR Figure S4C). Inhibition by the bivalent peptide was observed across a core set of p53 target genes shown by reduced enrichment in GSEA (Figure 3D; Table S5). An additional set of RNA-seq experiments was completed, in biological triplicate, to test whether serum-free media (Brown et al., 2013; Chang et al., 2013) would influence bivalent peptide activity (see STAR Methods). The data (RNA-seq experiment 2; Figures S5A and S5B) were consistent with the first series of biological replicates (RNA-seq experiment 1, Figures 3B–3D, S4A, and S4B; Table S4), despite a reduced p53 response to Nutlin. Collectively, these results indicated that the bivalent peptide inhibits activation of p53 target genes in human cells, consistent with the in vitro results.
Bivalent peptide has negligible transcriptional effects in absence of p53 activation
An expectation of our experimental strategy was that the bivalent peptide, which was designed based on p53AD structure, would selectively block p53 function. HCT116 cells express hundreds of sequence-specific, DNA-binding TFs, including high-level expression of TFs that define the cell lineage (Hnisz et al., 2013). For HCT116 cells, these TFs include SREBF1, ELF3, JUNB, NR2F1, and MYC. To assess the general impact of the bivalent peptide on pol II transcription, we compared RNA-seq data from cells without Nutlin treatment in the presence or absence of bivalent peptide. The data revealed that the bivalent peptide had no significant impact on pol II transcription, genome-wide, in unstimulated HCT116 cells. For example, only one gene (MT1M) changed significantly, out of 28,260 transcripts analyzed (Figure 3E), and similar results were observed in the second set of RNA-seq experiments (Figure S5C; qRT-PCR Figure S4D).
Although the volcano plots show fold-change effects with a significance cutoff, GSEA instead reports on trends within a ranked gene list. Interestingly, GSEA results for peptide-treated versus untreated cells (no Nutlin treatment) showed evidence for modest activation of a small number of pathways, including the p53 pathway (Figure S5D). This observation could reflect an ability of the bivalent peptide to mimic p53AD-Mediator binding to activate transcription (as suggested in vitro for the BP1.4 peptide; Figure S1F) and/or an ability to reduce MDM2 or MDM4 binding to p53 in HCT116 cells.
Taken together, the RNA-seq data from Nutlin-stimulated or uninduced cells (i.e., not treated with Nutlin) indicate that the bivalent peptide is selective for p53 and does not inhibit other TF-Mediator interactions that would otherwise more broadly affect pol II transcription.
Reduced pol II occupancy in peptide-treated cells
ChIP-seq experiments were completed to further probe the effects of the bivalent peptide. We emphasize that ChIP-seq experiments have limitations because data are collected at a single time point, whereas RNA-seq can better represent cumulative effects following a stimulus. The timing for ChIP-seq was chosen to be 3 h post Nutlin, based on ChIP-qPCR experiments at the p21/CDKN1A locus (Figure S6A). This time point matched that of the RNA-seq experiments. ChIP-seq analysis of Mediator itself was not feasible based on the low cell numbers required (ca. 1 million cells/replicate) due to limited quantities of the bivalent peptide. Because the genomic occupancy of Mediator correlates with pol II recruitment and transcription (Whyte et al., 2013), we completed ChIP-seq experiments for ser5-phosphorylated pol II, whose levels peak at gene 5’ ends (i.e., promoterproximal regions).
The ChIP-seq data showed increased ser5-phosphorylated pol II occupancy at the 5ʼ ends of p53 target genes in Nutlin-treated cells, as expected. The bivalent peptide reduced pol II levels at gene 5’ ends, in agreement with the RNA-seq data (Figures 4A and 4B, S6B, and S6C) and consistent with in vitro data that showed inhibition of p53-Mediator binding by the bivalent peptide. Note that the bivalent peptide decreased pol II occupancy at most, but not all, p53 target genes (Figure S6D and S6E), perhaps reflecting differential timing of Nutlin induction.
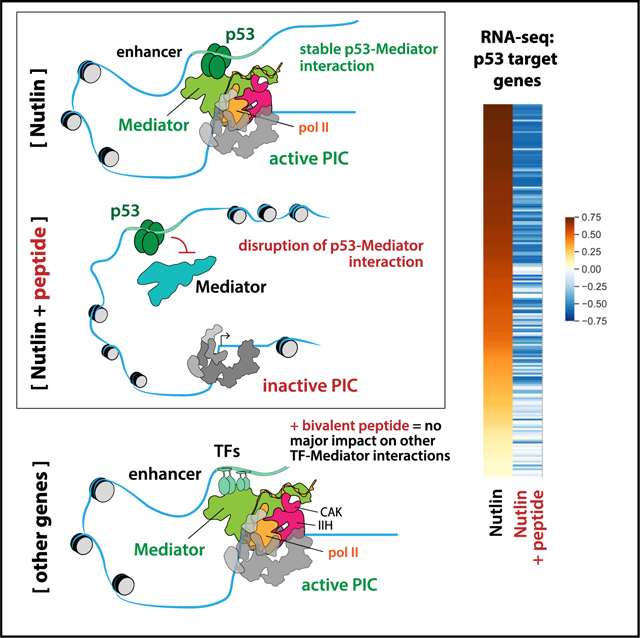
Figure 4. Representative RNA-seq and ChIP-seq data; model.

(A) RNA-seq traces at the p53 target gene BTG2, showing bivalent peptide blocks Nutlin-dependent activation. The y axis is read-depth normalized read density. RNA-seq data were obtained in biological replicate.
(B) ChIP-seq traces showing decreased pol II CTD Ser5P occupancy at the BTG2 promoter region in bivalent peptide-treated cells. The y axis is normalized read density (see STAR Methods); ChIP-seq data were obtained in single or biological replicates (see STAR Methods).
(C) Model. The bivalent peptide effectively competes with p53 to reduce its binding to Mediator, which reduces activation of p53 target genes. At non-p53 target genes, which are activated through other TF-Mediator interactions (via different Mediator subunits), the bivalent peptide has minimal impact on pol II transcription.
Collectively, the RNA-seq and ChIP-seq data were consistent with the in vitro results and demonstrated that the bivalent peptide (1) blocks transcriptional activation by p53 and (2) has negligible impact on pol II transcription in general (that is, at genes responsive to other TFs) (Figure 4C).
DISCUSSION
Although few TF-Mediator interactions have been characterized in detail, the importance of bivalent or multi-valent interactions is an emerging theme (Currie et al., 2017; Herbig et al., 2010). Our results demonstrate the importance of both p53 ADs in Mediator-dependent transcription activation. A bivalent interaction may be required to selectively bind Mediator, as other proteins are bound by p53AD1 or p53AD2 individually (Ferreon et al., 2009; Lin et al., 1994) or can have their affinity enhanced by p53AD phosphorylation (Krois et al., 2016). For instance, p53AD phosphorylation will increase its binding affinity for CBP/p300 (Ferreon et al., 2009). The stapled, bivalent peptide is likely a poor substrate for site-specific phosphorylation, which may contribute to its effectiveness in cells. However, we cannot exclude the possibility that other functionally relevant interactions are influenced by the bivalent peptide, which may contribute to its cellular activity.
Although p53 normally functions as a tumor suppressor, gain-of-function p53 mutations are common and can be oncogenic (Freed-Pastor and Prives, 2012; Kastenhuber and Lowe, 2017); thus, blocking the activity of such p53 mutants is a viable therapeutic strategy (Brosh and Rotter, 2009). Recent work has also shown that suppression of p53 function may have applications for tissue regeneration (Shoffner et al., 2020) or to prevent drug resistance (Webster et al., 2020). Stapled peptides have shown promise as molecular therapeutics (Morrison, 2018), and peptide drugs represented approximately $50 billion in US sales in 2019, with more than 50 new drug approvals over the past 20 years (Muttenthaler et al., 2021). The strategy outlined here demonstrates that stapled peptides derived from TF ADs can be effective molecular probes; however, further optimization is required for potential clinical use.
Our staple design for p53AD1 was based on previous studies (Bernal et al., 2007) and enforces an α-helical conformation. Future experiments are needed to structurally define the p53-Mediator interface targeted by the bivalent peptide. Indeed, although biochemical data suggest that p53 interacts with the MED17 subunit (Ito et al., 1999), precise details about the molecular interface are lacking. Among Mediator subunits, MED17 is noteworthy because it represents a core structural subunit, along with MED14 (Zhao et al., 2021). Data from yeast suggest that MED17 may be more important for pol II transcription, genome-wide, compared with MED14 (Holstege et al., 1998; Tourigny et al., 2021). Given the central role for p53 in diverse physiological functions, its interaction with MED17 may ensure robust p53 responses independent of MED14 status or cell type.
Historically, TFs have been intractable as therapeutic targets, although progress has been made (Bushweller, 2019). This proof-of-concept study suggests that desired transcriptional outcomes can be achieved by avoiding the TF entirely and targeting the human Mediator complex instead. Additional support for this concept was provided by Arthanari and colleagues (Nishikawa et al., 2016), in which the Med15-Pdr1 interaction was blocked with a small molecule in yeast (Candida glabrata). Analogous to our results with p53, they showed that disruption of the Mediator-Pdr1 interaction prevented activation of Pdr1 target genes in yeast cells. Although many, if not most, TFs target the Med15 subunit in yeast (Sanborn et al., 2021), TFs bind many different sites on human Mediator (Poss et al., 2013). An implication is that blocking a single Mediator-TF interaction will not affect other signal-responsive or lineage-specific TFs, thus providing a means to selectively alter gene expression patterns. Our results suggest that this strategy could be applied toward p53 and other human TFs that target distinct Mediator subunits.
Limitations of this study
The RNA-seq experiments were completed with nuclear RNA after only 3 h of Nutlin treatment, to better capture direct versus indirect effects. Analysis across longer time points could reveal more gene expression changes from peptide treatment, but this would also increase the contribution from indirect effects due to p53 activity changes. Although the in vitro experiments can reliably assess direct p53-Mediator effects and mechanism, the complexity of factors (i.e., proteins, nucleic acids, metabolites) that converge on active genes in human cells prevents a complete understanding of cellular mechanisms. We could not obtain Mediator ChIP-seq data to assess its recruitment in cells; our ChIP-seq experiments were limited to about 1 million cells/ replicate because of limited amounts of the bivalent peptide. This is about 50-fold less than typical for pol II ChIP-seq (Aoi et al., 2020) and over 100-fold less than published Mediator ChIP-seq experiments (Quevedo et al., 2019).
STAR★METHODS
RESOURCE AVAILABILITY
Lead contact
Requests for resources and reagents should be directed to and will be fulfilled by the Lead Contact, Dylan Taatjes (taatjes@colorado.edu).
Materials availability
All reagents generated in this study are available from the Lead Contact without restriction or with a Materials Transfer Agreement; however, availability of bivalent peptides is limited.
Data and code availability
RNA-seq and ChIP-seq data have been deposited on NCBI GEO and are publicly available on the date of publication.
Accession numbers are listed in the key resources table. All original code used to analyze this data has been deposited at https://zenodo.org/badge/latestdoi/467625091 and is publicly available on the date of publication.
Any additional information required to re-analyze the data reported in this paper is available from the lead contact upon request.
KEY RESOURCES TABLE
| REAGENT or RESOURCE | SOURCE | IDENTIFIER |
|---|---|---|
|
| ||
| Antibodies | ||
|
| ||
| DO-1 p53 | Santa Cruz Biotechnology | sc-126; RRID:AB_628082 |
| Ser5P clone 3E8 | Millipore Sigma | 04–1572; RRID:AB_10615822 |
| MED23 | Bethyl | A300–425A;RRID:AB_2142309 |
| MED15 | Lab stock | N/A |
| MED1 | Santa Cruz Biotechnology | sc-8998; RRID:AB_2144021 |
| GST | Santa Cruz Biotechnology | sc-459; RRID:AB_631586 |
|
| ||
| Chemicals, peptides, and recombinant proteins | ||
|
| ||
| McCoy’s 5A media | Gibco | 16600082 |
| RPMI media | Gibco | 12633012 |
| Cell Culture Supplement: Antibiotic-Antimycotic | Gibco | 15240062 |
| Cell Culture Supplement: Fetal Bovine Serum | Gibco | 16141061 |
| Phenol/chloroform | Sigma | P1944 |
| Immobilon Chemiluminescent HRP substrate | Millipore | P90719 |
| TRIzol reagent | Invitrogen | 15596018 |
| RNAseOUT | Invitrogen | 10777019 |
| rATP | Promega | E6011 |
| rCTP | Promega | E6041 |
| rGTP | Promega | E6031 |
| rUTP | Promega | E6021 |
| [γ−32P]ATP | Perkin Elmer | NEG502Z001MC |
| Proteinase K | New England Biolabs | P81075 |
| T4 Polynucleotide Kinase | New England Biolabs | M0201S |
| Standard Fmoc-protected amino acids | Novabiochem | amino acid specific |
| (S)-N- Fmoc-2-(4’- pentenyl)alanine | Okeanos Tech Jiangsu Co., Ltd | OK-UA-09216 |
| (R)-N-Fmoc-2-(7’-octenyl)alanine | Okeanos Tech Jiangsu Co., Ltd | OK-UA-09222 |
| Rink amide resin | Sigma-Aldrich | 8.55001 |
| N,N-dimethylformamide (DMF) | Sigma-Aldrich | 227056 |
| N- hydroxybenzotriazole (HOBt) | Sigma-Aldrich | 157260 |
| Grubbs CatalystTM 1st Generation | Sigma-Aldrich | 579726 |
| Trifluoroacetic acid (TFA) | Acros Organics | 432291000 |
| Dichloroethane (DCE) | Acros Organics | 433580010 |
| N,N,N’,N’- tetramethyl-uronium-hexafluoro-phosphate (HBTU) | AmericanBio | AB00883 |
| diisopropylethylamine (DIEA) | AmericanBio | discontinued |
| Anhydrous piperazine | EMD Millipore | 807325 |
| 6-chlorobenzotriazole-1-yloxy-tris-pyrrolidinophosphonium hexafluorophosphate (PyClocK) |
EMD Millipore | 851087 |
| Acetic anhydride | ThermoScientific, Pierce Biotechnology | AC149490010 |
| Nutlin-3a | SelleckChem | S8059 |
|
| ||
| Deposited data | ||
|
| ||
| RNA-seq | This paper | GEO: GSE135870 |
| ChIP-seq | This paper | GEO: GSE193418 |
| Custom code | Zenodo | https://zenodo.org/badge/latestdoi/467625091 |
|
| ||
| Experimental models: Cell lines | ||
|
| ||
| HCT116 cells | ATCC | CCL-247 |
| SJSA Cells | ATCC | CRL-2098 |
|
| ||
| Oligonucleotides | ||
|
| ||
| qRT-PCR primers | IDT | see Table S6 |
|
| ||
| Software and algorithms | ||
|
| ||
| Mascot v2.2 | Matrix Sciences | https://www.matrixscience.com/ |
| RNAseq-Flow- Nextflow pipeline v1.1 | Dowell Lab; Mapping, trimming and quality assessment | https://github.com/Dowell-Lab/RNAseq-Flow |
| ChIP-Flow - Nextflow pipeline v1.0 | Dowell Lab; Mapping, trimming and quality assessment | https://github.com/Dowell-Lab/ChIP-Flow |
| BBDuk v38.05 | Bushnell B., Joint Genome Institute; Trimming | https://jgi.doe.gov/data-and-tools/bbtools/ |
| FastQC v0.11.8 | Babraham Bioinformatics; Quality assessment | https://www.bioinformatics.babraham.ac.uk/projects/fastqc/ |
| Preseq v2.0.3 | Andrew D Smith; Quality assessment | https://github.com/smithlabcode/preseq |
| HiSat2 v2.1.0 | Daehwan Kim; Mapping | http://daehwankimlab.github.io/hisat2/manual/ |
| Samtools v1.8 | Li et al., 2009; Mapping file conversions | http://www.htslib.org/ |
| IGV Tools v2.3.75 | Broad Institute; Mapping file conversions and visualization | https://software.broadinstitute.org/software/igv/igvtools |
| kentUtils | ENCODE; Mapping file conversions | https://github.com/ENCODE-DCC/kentUtils |
| Bedtools v2.28.0 | Quinlan and Hall, 2010; Coordinate math on mapped files | https://bedtools.readthedocs.io/en/latest/ |
| Python v3.6.3 | General data assessment and plot generation | https://www.python.org/ |
| R v3.6.0 | General data assessment and plot generation | https://www.r-project.org/ |
| limma v3.42.2 | Ritchie et al., 2015; Batch correction | https://bioconductor.org/packages/release/bioc/html/limma.html |
| Rsubread v2.0.1 | Liao et al., 2019; Counting RNA-seq reads | http://subread.sourceforge.net/ |
| DESeq2 v1.26.0 | Love et al., 2014; Differential expression analysis | https://bioconductor.org/packages/release/bioc/html/DESeq2.html |
| Gene Set Enrichment Analysis v4.0.3 | Subramanian et al., 2005; Pathway analysis | https://www.gsea-msigdb.org/gsea/index.jsp |
| seaborn v0.9.0 | General plotting software | https://seaborn.pydata.org/introduction.html |
| bokeh v1.4.0 | General plotting software | https://docs.bokeh.org/en/latest/ |
| pyGenomeTracks v3.5 | Ramirez et al., 2018; Plotting software | https://github.com/deeptools/pyGenomeTracks |
|
| ||
| Other | ||
|
| ||
| Microcon YM-30 spin concentrator | Millipore Sigma | Z648086 |
| Phenomenex Jupiter C18 (5mM 300 Å, 0.25 × 150mm) column | Custom fabricated | N/A |
| Acclaim PepMap C18 (3μm 100 Å, 0.075 × 150mm) column | Dionex | 164946 |
| Triaryl-C18 (YMC-Triaryl-C18, 150mm x 10mm,5 μm, 12 nm) column | YMC America, Inc. | YMTA12S05–1546WT |
| C8 reverse phase (Sonoma C8(2), 3 μm, 100 Å, 2.1 × 100 mm) analytical column | ES Industries | ES132121-SMA-C8(2) |
| G-25 column | Millipore Sigma | GE27–5325-01 |
| Glutathione-Sepharose resin | GE Healthcare | 17–0756-05 |
| Protein G Dynabeads | Invitrogen | 10003D |
| CellTiter-Glo assay | Promega | G7570 |
| Neon™ Transfection System Kit | ThermoFisher Scientific | MPK1025/MPK10025 |
| High Capacity cDNA kit | ThermoFisher Scientific | 4368813 |
| RNA-seq Library Prep Kit: Next II Ultradirectional | New England Biolabs | E7760S |
| Covaris truChIP Chromatin Shearing Kit | Covaris | 520237 |
| Light-5PRIME Phase Lock Tubes | Quanta Bio | 2302820 |
| ChIP-seq Library Prep Kit: KAPA Hyper Prep Kit | KAPA Biosystems | KK8502 |
EXPERIMENTAL MODEL AND SUBJECT DETAILS
HCT116 cell culture
HCT116 cells were grown in McCoy’s media (Gibco, 16600082) with Gibco 100× Antibiotic-Antimycotic (Fisher Sci, 15240062) penicillin-streptomycin and 10% fetal bovine serum (FBS) supplementation.
SJSA cell culture
SJSA cells were grown in RPMI media supplemented with Gibco 100× Antibiotic-Antimycotic (Fisher Sci, 15240062) and 10% FBS, 37°C and 5% CO2.
METHOD DETAILS
Affinity purification-mass spectrometry
Affinity purification was completed from HeLa cell nuclear extract with a GST fusion of the p53AD (residues 1–70) immobilized on Glutathione-Sepharose beads (GE Life Sciences). After binding, the resin was washed five times with 10 column volumes (CV) 0.5 M KCl HEGN (20 mM Hepes pH 7.6; 0.1 mM EDTA; 10% Glycerol; 0.1% NP-40 alternative) and once with 10 CV 0.15 M KCl HEGN (0.02% NP-40 alternative). Bound proteins were eluted with 30mM GSH in elution buffer (80 mM Tris, 0.1 mM EDTA, 10% Glycerol, 0.02% NP-40, 100 mM KCl) and applied to a 15%–40% linear glycerol gradient (in 0.15 M KCl HEG) and centrifuged for 6 h at 55,000 rpm. Twenty-two 100μL fractions were removed and Mediator-containing fractions (>1.0 MDa) were combined for proteomics analysis. GST-p53AD (residues 1–70) affinity purified Mediator complex-containing fractions were precipitated on ice by adding 20% (w/v) TCA, 0.067mg/mL insulin and 0.067%(w/v) sodium deoxycholate. Precipitated protein pellets were washed twice with –20°C acetone and air dried. Proteins were trypsin digested using a slightly modified filter-aided sample prep (FASP) protocol (Wisniewski et al., 2009). Briefly, protein pellets were suspended with 4%(v/v) SDS, 0.1M Tris pH 8.5, 10mM TCEP, incubated 30min at ambient temperature to reduce disulfides. Reduced proteins were diluted with 8M Urea, 0.1M Tris pH 8.5 and iodoacetamide was added to 10mM and incubated 30 min in total darkness. Reduced and alkylated proteins were then transferred to a Microcon YM-30 (Millipore) spin concentrator and washed twice with 8M Urea, 0.1M Tris pH 8.5 to remove SDS. Three washes were performed with 2M urea, 0.1M Tris pH 8.5, then trypsin and 2mM CaCl2 were added and incubated approximately 2 h in a 37°C water bath. Digested peptides were eluted and acidified with 5% (v/v) formic acid. Peptides were then desalted online and fractionated with a Phenomenex Jupiter C18 (5μM 300Å, 0.25 × 150mm) custom fabricated column using a two dimensional LC/MS/MS method (Agilent 1100). Seven steps of increasing acetonitrile (6, 8, 10, 12, 14, 17, 65% acetonitrile with 10mM ammonium formate) at a flowrate of 5μL/min was used to elute peptides for second dimension analyses with an Acclaim PepMap C18 (3μm 100Å, 0.075 × 150mm) column (Dionex). Peptides were gradient eluted at 0.2μL/min from 5 to 25% acetonitrile, 0.1% formic acid in 100 min and detected with an Agilent MSD Trap XCT (3D ion trap) mass spectrometer. All spectra were searched using Mascot v2.2 (Matrix Sciences) against the International Protein Index (IPI) human database version 3.65 with a maximum of two missed cleavages and a mass tolerance of ±2.0 daltons for MS1 and ±0.8 daltons for MS2 spectra. Peptides were accepted above a Mascot ion score corresponding to a 1% false discovery rate (1% FDR) determined by a separate search of a reversed IPI v3.65 human database. Peptides were then filtered and protein identifications were assembled using in-house software as described (Meyer-Arendt et al., 2011; Resing et al., 2004).
Purification of PIC factors for in vitro transcription
TFIIA, TFIIB, TFIID, TFIIE, TFIIF, TFIIH, Mediator, and pol II were purified as described (Fant et al., 2020).
In vitro transcription
Chromatinized templates and in vitro transcription assays were generated and completed as described (Knuesel et al., 2009). Briefly, each activator (GAL4-p53AD or GAL4-VP16AD) was titrated to yield maximum transcription. While the activator bound the template, the general transcription factors (GTFs) were mixed in 0.1 M HEMG (10 mM HEPES pH 7.6, 100 mM KCl, 0.1 mM EDTA, 10% glycerol, 5.5 mM MgCl2) to give approximate final concentrations of 40 nM TFIIA, 10 nM IIB, 0.8 nM TFIID, 10 nM TFIIE, 10 nM TFIIF, 0.5 nM TFIIH and 2 nM pol II. A non-limiting amount of Mediator was then diluted in a separate salts mix (10 mM HEPES pH 7.6, 100 mM KCl, 2.5% PVA, 2.5% PEG, 7.5 mM MgCl2), along with 400 U of RNAseOUT, about 300 ng PC4 and about 300 ng HMGB1. On ice, the desired concentration of peptide was then added to the Mediator mix, followed by the GTF mix at a 5:11 ratio. The GTFs, Mediator and peptide were then incubated at least 5 min at 30°C. Then, 15 μL of the mixture was added to each reaction. PIC assembly proceeded for 15 min, then transcription was initiated by adding 5 μL of a solution containing 5 mM of each NTP. After thirty minutes, reactions were stopped with the addition of 150 μL Stop Buffer (20 mM EDTA, 200 mM NaCl, 1% SDS, 100 mg/mL Proteinase K, 100 mg/mL glycogen) and incubating at 37°C for 15 min. RNA was isolated with 100 μL phenol/chloroform/isoamyl alcohol (pH 7.7–8.3); 140 μL of the aqueous phase was mixed with 5 μL, 7.5 M ammonium acetate and 5 μL of twenty-fold diluted, radiolabeled (32P) Reverse Transcriptase (RT) probe and transferred to a 500 μL microfuge tube. The RNA was then precipitated by adding 375 μL, 100% cold ethanol and placing at –20°C for at least an hour.
Radiolabeling of reverse transcription primer
A reverse transcriptase (RT) primer was synthesized to complement the RNA transcript 85 bases downstream of the transcription start site. The RT primer was radiolabeled in polynucleotide kinase (PNK) buffer (70 mM Tris-HCl pH 7.6, 10 mM MgCl2, 5 mM DTT) with the addition of about 150 μCi [γ-32P]ATP, 6 U of T4 PNK and 48 ng of the RT primer in a final volume of 10 μL. The reactions were then incubated at 37°C for 45 min. A glycogen mixture (10 mM Tris pH 7.5, 34 mM EDTA, 1.33 mg/mL glycogen) was then added to bring the volume to 25 μL, and the reaction was passed through a G-25 column to remove excess free [γ-32P]ATP. An additional 25 μL of TE buffer (10 mM Tris pH 7.5, 1 mM EDTA) was added. The radiolabeled primer was then stored at 4°C until needed (up to 1 week).
Primer extension
Reactions were spun down at 14K RPM (Eppendorf 5415) for 20 min and the ethanol was removed. Pellets were then briefly dried (speedvac) and resuspended in 10 μL Annealing Buffer (10 mM Tris-HCl pH 7.8, 1 mM EDTA, 250 mM KCl). The resuspended RNA was then incubated in a thermocycler as follows: 85°C for 2 min, cool to 58°C at 30 s/degree, 58°C for 10 min, 57°C for 20 min, 56°C for 20 min, 55°C for 10 min, and cool to 25°C at 30 s/degree. 38 μL of RT mix (20 mM Tris-HCl pH 8.7, 10 mM MgCl2, 0.1 mg/mL actinomycin D, 330 μM of each dNTP, 5 mM DTT, 0.33 U/μL Moloney Murine Leukemia Virus (MMLV) reverse transcriptase) was then added to the annealing reactions and allowed to extend for forty-five minutes at 37°C. Reactions were then stopped and precipitated by adding 300 μL cold ethanol and placed at –20°C for at least an hour.
In vitro transcription analysis by denaturing polyacrylamide gel electrophoresis
The cDNA reactions were spun down at 14K RPM (Eppendorf 5415) for 25 min and the ethanol was removed from the pellets. After briefly drying pellets (speedvac), cDNA was resuspended in 6 μL formamide loading buffer (75% formamide, 4 mM EDTA, 0.1 mg/mL xylene cyanol, 0.1 mg/mL bromophenol blue, 33 mM NaOH), heated for 3 min at 90°C and loaded onto a denaturing polyacrylamide gel (89 mM Tris base, 89 mM boric acid, 2 mM EDTA, 7 M Urea, 6% acrylamide/bisacrylamide [19:1]). Gels were run at 35 W for about 1.5 h, then transferred to filter paper and dried for 1 h at 80°C. Gels were then exposed on a phosphorimager screen.
Peptide synthesis reagents
All purchased reagents were used without further purification. Standard Fmoc-protected amino acids were purchased from Novabiochem (San Diego, CA). Fmoc-protected olefinic amino acids, (S)-N-Fmoc-2-(4’- pentenyl)alanine and (R)-N-Fmoc-2-(7’-octenyl) alanine, were purchased from Okeanos Tech Jiangsu Co., Ltd (Jiangsu, P.R. China). Rink amide resin, N,N-dimethylformamide (DMF), N-hydroxybenzotriazole (HOBt), and Grubbs Catalyst™ 1st Generation were purchased from Sigma-Aldrich (St. Louis, MO). Trifluoroacetic acid (TFA) and dichloroethane (DCE) were purchased from Acros Organics (Fair Lawn, NJ). N,N,N’,N’- tetramethyl-uronium-hexafluoro-phosphate (HBTU) and diisopropylethylamine (DIEA) were purchased from AmericanBio (Natick, MA). Anhydrous piperazine and 6-chlorobenzotriazole-1-yloxy-tris-pyrrolidinophosphonium hexafluorophosphate (PyClocK) was purchased from EMD Millipore (Billerica, MA). Acetic anhydride was purchased from ThermoScientific, Pierce Biotechnology (Rockford, IL).
Solid phase peptide synthesis
Peptides were synthesized using standard Fmoc chemistry with Rink amide resin on Biotage® Initiatior + Alstra from Biotage (Charlotte, NC) using microwave acceleration. Fmoc deprotections were performed using 5% piperazine with 0.1 M HOBt to reduce aspartimide formation in DMF. Coupling reactions were performed using 5 equivalents of amino acid, 4.9 equivalents of HBTU, 5 equivalents of HOBt, and 10 equivalents of DIEA in DMF at 75°C for 5 min. Fmoc-NH-(PEGn)-COOH linkers were coupled as amino acids were. All arginine residues were double coupled at 50°C. Olefinic 55 side-chain bearing residues were coupled using 3 equivalents of amino acid, 3 equivalents of PyClocK, and 6 equivalents of DIEA and stapled for 2 h at room temperature PyClocK. Residues following olefinic residues were double coupled using standard coupling procedures. N-terminally capped peptides were generated by treating Fmoc-deprotected resin with 100 equivalents acetic anhydride and 100 equivalents DIEA for 10 min at room temperature. Following synthesis, resin was washed thoroughly with alternating DMF (5 mL) and DCM (10 mL) washes before subsequent cyclizing, labeling, and cleavage.
Ring closing olefin metathesis
Peptides containing olefinic amino acids were washed with DCM (3 × 1 min) and DCE (3 × 1 min) prior to cyclizing on resin using Grubbs Catalyst I (20 mol % compared to peptide, or 1 equivalent compared to resin) in DCE (4 mL) for 2 h under N2. The cyclization step was performed twice (Kim et al., 2011). The resin was then washed three times with DCM (5 mL) before washing with MeOH (5 mL x 5 min) twice to shrink the resin. The resin was dried under a stream of nitrogen overnight.
Peptide cleavage
After shrinking and drying overnight, the peptide was cleaved from the resin using a 3 mL solution of trifluoroacetic acid (TFA) (81.5%), thioanisole (5%), phenol (5%), water (5%), ethanedithiol (EDT) (2.5%) and triisopropylsilane (TIPS) (1%) for 2 h at RT on an orbital shaker. Cleaved peptides were precipitated in diethyl ether (40 mL, chilled to –80°C), pelleted by centrifugation, washed with additional diethyl ether (40 mL, –80°C), pelleted, redissolved in a solution of acetonitrile (ACN) and water (15% CAN), frozen, lyophilized to dryness, and reconstituted in 1 mL dimethyl sulfoxide (DMSO) prior to purification by high-performance liquid chromatography (HPLC).
Peptide purification by HPLC
Peptide solutions were filtered through nylon syringe filters (0.45 μm pore size, 4 mm diameter, Thermo Fisher Scientific) prior to HPLC purification. Peptides were purified using an Agilent 1260 Infinity HPLC system on a reverse phase Triaryl-C18 column (YMC-Triaryl-C18, 150 mm × 10 mm, 5 μm, 12 nm) (YMC America, Inc.) over H2O/ACN gradients containing 0.1% TFA. Peptides were detected at 214 nm and 280 nm. Peptide purity was verified using a Shimadzu Analytical ultra-performance liquid chromatography (UPLC) system (ES Industries, West Berlin; Shimadzu Corporation, Kyoto, Japan) and a C8 reverse phase (Sonoma C8(2), 3 μm, 100 Å, 2.1 × 100 mm) analytical column. Analytical samples were eluted over a gradient of 15–57 60% ACN in water containing 0.1% TFA over 15 min with detection at 214 and 280 nm.
In vitro binding assays
Starting from 180 μL HeLa nuclear extract (which contains Mediator), bivalent peptide was added (to 5μM concentration) followed by addition of purified p53AD (residues 1–70; to 2 μM concentration). A parallel experiment lacked added bivalent peptide. Each sample was allowed to incubate, with mixing, for 2 h at 4°C. Each sample was then incubated, with mixing, over an anti-MED1 affinity resin (to immunoprecipitate Mediator from the sample) for 90 min at 4°C. The resin was then washed 4 times with 20 resin volumes with 0.5M KCl HEGN (20 mM HEPES, pH 7.9; 0.1 mM EDTA, 10% glycerol, 0.1% NP-40) and once with 0.15M KCl HEGN (0.02% NP-40). Material that remained bound to the resin (i.e. Mediator) was eluted with 1M glycine, pH 2.2 and subsequently probed by western. As an alternate protocol, HeLa nuclear extract (1 mL) was first incubated over a GST-SREBP affinity column, washed 5 times with 0.5M HEGN, once with 0.15M HEGN, and eluted with 30 mM glutathione buffer, as described (Ebmeier and Taatjes, 2010). This material (160 μL), which is enriched in Mediator, was then incubated with p53AD (residues 1–70; to 2 μM concentration) or GST-VP16AD (residues 411–490) in the presence or absence of bivalent peptide or its p53AD2 QS mutant (5 μM) at 4°C for 1 h. Then each sample was incubated, with mixing, over an anti-MED1 affinity resin, washed, eluted, and probed by western as described above.
Western blotting
Protein samples were run on 7% or 9% acrylamide gels and transferred onto a nitrocellulose membrane for western blotting. Westerns were scanned on an ImageQuant LAS 4000 series imager, and ImageJ software was used to measure band intensity, which was normalized to MED15 for quantitation.
Experimental time frame for RNA-seq experiments
In a series of experiments in SJSA cells, we initially tested whether the bivalent peptide could cause a phenotypic change. SJSA cells are unusually sensitive to Nutlin-3a (Vassilev et al., 2004) and therefore if the p53 response could be persistently blocked by the bivalent peptide, peptide-treated cells would show enhanced survival following Nutlin treatment. Starting with a 24-h Nutlin treatment (10 μM), we observed no significant effect of the bivalent peptide: similar percentages of cell death were observed in control vs. peptide-treated populations as analyzed by CellTiter-Glo assay (Promega). Although these results could be attributed to poor cellular uptake of the bivalent peptide (see below), we also suspected that the peptide was active in cells for only a limited time (e.g. before being secreted or degraded). We next determined that a 6-h Nutlin treatment time was the shortest that would still trigger significant SJSA cell death within 24–48 h. However, we obtained similar results with 6-h Nutlin treatment times (± bivalent peptide). Note these experiments did not implement electroporation to increase peptide uptake. It remains plausible that phenotypic effects would result from methods that ensured increased bivalent peptide uptake in SJSA cells. We next tested the prospect of RNA-seq experiments, in hopes that gene expression changes and shorter time frames would allow an assessment of bivalent peptide effects. Here, we used HCT116 cells, which show strong transcriptional response to Nutlin (Allen et al., 2014). For RNA-Seq experiments, we needed a time frame long enough to allow accumulation of p53 target gene mRNAs but short enough to enable maximum activity of the bivalent peptide (e.g. prior to its secretion, export, and/or degradation). Using qRT-PCR assays, we confirmed that a 3-h Nutlin treatment was a minimum amount of time to reliably detect induction of p53 target genes. Parallel qRT-PCR assays confirmed that the bivalent peptide was blocking activation of p53-target genes in HCT116 cells during this time frame (e.g. Figures S4C and S4D).
Electroporation of bivalent peptide into HCT116 cells (RNA-Seq experiment 1)
Two 6-well plates (HCT116 cells) were grown to about 80% confluency. Cells were then trypsinized, washed with PBS, and resuspended in 150 μL Neon Buffer R. The cells were then split into two groups: No peptide and 10 μM peptide. The cells were then drawn into a 10 μL Neon pipet tip, electroporated and ejected into 2 mL of McCoy’s 5A media without antibiotic. For each experiment, two cell electroporation aliquots were added to media containing either 0.1% DMSO (control) or 10 μM Nutlin-3a (in DMSO, to a final concentration of 0.1%). For wells containing cells electroporated with peptide, an additional 200 nM peptide was added to the well to allow for peptide uptake during the experiment. The 6-well plate was then placed back at 37 C for 3 h. After 3 h, cells were scraped from the plates, transferred to a 15 mL conical vial, pelleted at 1,000 × g, and washed in 10 mL phosphate buffered saline (PBS) solution. To isolate the nuclei, cells were resuspended in 10 mL lysis buffer (10 mM Tris-HCl, pH 7.4, 2 mM MgCl2, 3 mM CaCl2, 0.5% NP-40, 10% glycerol) and thoroughly mixed. The nuclei were spun down at 1,000×g for 10 min, the lysis buffer was removed, and 1 mL of TRIzol was added. The nuclear RNA was isolated as described in the TRIzol instructions, except an additional phenol/chloroform extraction and chloroform-only extraction were performed to reduce contaminants. RNA was precipitated and washed twice with 75% ethanol to further remove contaminants. The RNA was then converted to cDNA using the High Capacity cDNA kit from Thermo Fisher Scientific.
Electroporation of bivalent peptide into HCT116 cells (RNA-Seq experiment 2)
One 15cm plate (HCT116 cells) was grown to about 70% confluency. Cells were then trypsinized, washed with PBS, and resuspended in 40 μL Neon Buffer R. The cells were then split into two groups: No peptide and 10 μM peptide. The cells were then drawn into a 10 μL Neon pipet tip, electroporated and ejected into 2 mL of serum-free McCoy’s 5A media without antibiotic. Serum-free media was tested based upon prior reports that it may enhance cellular peptide uptake (Brown et al., 2013; Chang et al., 2013). For each experiment, two cell electroporation aliquots were added to media containing 0.1% DMSO (control) or 10 μM Nutlin-3a (in DMSO, to a final concentration of 0.1%). For wells containing cells electroporated with peptide, an additional 200 nM peptide was added to the well to allow for peptide uptake during the experiment. The 6-well plate was then placed back at 37C for 3 h. After 3 h, cells were scraped from the plate, transferred to 2 mL eppendorf tubes, pelleted at 1,000 × g, and washed in 1 mL cold phosphate buffered saline (PBS) solution. To isolate the nuclei, cells were resuspended in 0.5 mL lysis buffer (10 mM Tris-HCl, pH 7.4, 2 mM MgCl2, 3 mM CaCl2, 0.5% NP-40, 10% glycerol) and mixed by pipetting up and down 20 times. The nuclei were spun down at 1,000 × g for 10 min, the lysis buffer was removed, and 200 μL of TRIzol was added. The RNA was isolated as described in the TRIzol instructions, except an additional phenol/chloroform extraction and chloroform-only extraction were performed. RNA was precipitated and washed twice with 75% ethanol. The RNA was then converted to cDNA using the High Capacity cDNA kit from Thermo Fisher Scientific.
RNA-seq data analysis
The RNA-seq data were mapped to hg38 and processed using a Nextflow pipeline v1.1 (https://github.com/Dowell-Lab/RNAseq-Flow). Batch correction for experiment 2 was performed in R using the removeBatchEffect function provided by the limma package (Ritchie et al., 2015) from the R programming language. Gene counts were generated using featureCounts (Liao et al., 2014) and differential gene expression analysis was performed using DESeq2 (Anders and Huber, 2010). Duplicate transcripts were filtered for those with the highest RPKM, leaving 28,260 transcripts. RNA-seq was performed on nuclear RNA instead of total RNA to better assess acute transcriptional changes; furthermore, analyses were completed at 3h post-Nutlin instead of longer time points, to reduce indirect/secondary effects from p53 activation. Because of this strategy, fewer differential mRNA products were expected (e.g. vs. total RNA analysis at 12h post-Nutlin). Nevertheless, numerous p53 target genes showed differential expression with statistical confidence. A prerank file was generated in R using the results from the differential analysis results (prerank < - tibble(gene = differential_expression_results$Gene, rank = -log(differential_expression_results$p value) * sign(differential_expression_results$log2FoldChange)) %>% arrange(desc(rank)) %>% drop_na()) and used in the Broad Institute’s Gene Set Enrichment Analysis (GSEA 4.0.3) software, using hallmark pathways gene sets (hall.v7.4) (Subramanian et al., 2005). Heatmaps were generated in Python using seaborn 0.9.0 (https://seaborn.pydata.org/introduction.html). Other plots (bar plots, boxplots, volcano, moustache) were made with the python package bokeh 1.4.0 (https://docs.bokeh.org/en/latest/). Gene traces were made using pyGenomeTracks 3.5, part of the deeptools suite (https://github.com/deeptools/pyGenomeTracks). Note that for comparisons between peptide-treated vs. untreated cells in the absence of Nutlin stimulation (e.g. Figure 3E), MTM1 met our significance threshold; however, MT1M was highly expressed in only one replicate of the DMSO control (R1 RPKM = 8.61; R2 RPKM = 0.63) and MT1M expression in other conditions (Nutlin, DMSO + peptide, or Nutlin + peptide) was less than 1.0 across all replicates, suggesting a sampling artifact rather than a true biological difference.
qRT-PCR
Experiments were performed as described (Audetat et al., 2017); primers used are shown in Table S6.
ChIP-seq
HCT116 cells were grown to about 80% confluency in one 15cm plate. Cells were then trypsinized, washed with PBS, and resuspended in 250 μL Neon Buffer R to a concentration of 2.2 million cells per 100 μL. The cells were then split into either a no peptide or a peptide group. The peptide group had 10 μM peptide during electroporation and 200 nM peptide on the plate during the 3hr incubation. The cells were drawn into a 100 μL Neon pipet tip, electroporated and ejected into 700 μL of McCoy’s 5A media without antibiotic. This sample was then split, 400 μL (containing ~1 million cells) each into 5mL of antibiotic-free media with 0.1% DMSO or with 10 mM Nutlin-3a. The plates containing the four conditions were placed at 37°C for 3 h. After this incubation, the cells were fixed with 1% formaldehyde for 10 min and quenched with 125mM glycine for 5 min before nuclei isolation in NRO buffer. All buffers were as described (Levandowski et al., 2021) unless otherwise noted. Shearing was performed based on the Covaris truChIP Chromatin Shearing Kit (Covaris: PN 520237) and sheared in 1 mL of Covaris D3 buffer for 8 min, with a duty factor 5% and peak power of 75,200 cycles/burst with a Covaris M220 Focused-ultrasonicator. Protein G Dynabeads (6 μg antibody 25 μL beads per condition. Beads: Invitrogen, #10003D. Antibody: pol II Ser5P clone 3E8 Millipore Sigma, 04–1572) were loaded with the crosslinked chromatin and allowed to incubate with shaking at 4°C overnight (~18hr) in a final buffer composition of 15 mM Tris-HCl pH 8, 150 mM NaCl, 1 mM EDTA, 1% Triton X-100, 5% Glycerol, 0.1% Sodium Deoxycholate, 0.1% SDS and the protease inhibitor cocktail. Note that the buffer composition and antibody:bead ratio was optimized empirically for this assay, to maximize sample recovery. The beads were then washed at 4°C with 2× IP Buffer (15 mM Tris-HCl pH 8, 150 mM NaCl, 1 mM EDTA, 5% Glycerol, 0.1% Sodium Deoxycholate, 1% Triton X-100 and the protease inhibitor cocktail), 2× RIPA Buffer, 2× LiCl Wash Buffer and 2× TE Salt Buffer. Samples were kept on ice throughout the wash steps, and all washes were completed in less than 30 min; each wash step was 1 min to reduce sample loss. After washes, the sample was eluted from beads with PK buffer containing 100 μg of Proteinase K (New England BioLabs: P81075) and incubated at 65°C for 2 h with periodic vortexing. The eluted sample was removed from the magnetic beads and reverse-crosslinked for 16 h at 65°C. DNA was purified by phenol chloroform extraction using Light-5PRIME Phase Lock Tubes (Quanta Bio: 2302820) based on the manufacturer’s instructions. To increase yield, samples were ethanol precipitated from glycogen (20μg/sample), sodium acetate (pH 5.2) and 10mM MgCl2 and kept at –20°C overnight. Isolated DNA was tested by qPCR at the CDKN1A promoter (Forward 5’- CCAGGAAGGGCGAGGAAA, Reverse 5’- GGGACCGATCCTAGACGAACTT) and the BTG2 promoter (Forward 5’- AGGGTAACGCTGTCTTGTGG, Reverse 5’- CAGGAGGCTGGAGAGGAAG). Subsequently, libraries with approximately 1 ng of input DNA were prepared using the KAPA Hyper Prep Kit (KAPA Biosystems: KK8502) and sequenced on Illumina NextSeq V2 high output 75-cycle. Adapters were diluted 1:10 before use and amplified for 12–14 cycles before sequencing.
ChIP-seq data analysis
The ChIP-seq data were mapped to hg38 and processed using Nextflow pipeline v1.0 (https://github.com/Dowell-Lab/ChIP-Flow). QC metrics showed that biological replicate 2 was higher quality. The Nutlin + peptide replicate 1 showed low complexity, high background and high duplication; despite this, we still observed similar trends in Nutlin response consistent with replicate 2. Due to these complexity and background issues, replicate 1 in the DMSO + peptide and Nutlin + peptide were not used in subsequent analyses. Due to the nature of pol II Ser5P ChIP-seq (i.e. Ser5P is enriched at gene 5’-ends), we focused on transcriptional start sites (TSS) and counted over a 1000bp window at all RefSeq TSSs (NCBI Reference Sequences for hg38 downloaded from the UCSC track browser on May 18, 2018; n = 82,500 annotated transcripts). All counting was performed with bedtools multicov (v 2.28.0) and only the highest RPKM annotated start site per transcript was retained (n = 28,260). The data were then normalized using a Signal to Noise ratio (SNR) equivalent to the CHIPIN quantile method as described (Polit et al., 2021). To perform this method, we estimated signal per condition by summing the top 75% expressing TSSs, excluding 1) p53 target genes and 2) any differentially expressed genes (padj <0.05) in any of the 6 pairwise comparisons in RNA-seq experiment 1 and RNA-seq experiment 2 (excluded n = 2,820 transcripts, approximately n~18,000 transcripts remained for normalization). To estimate noise, we randomly shuffled 82,500 1000bp regions with bedtools shuffle and counted using bedtools multicov (v 2.28.0). These counts were then filtered twice by dropping all zero-read regions and by keeping only the 10th-90th quantile of reads. We did this to remove 1) any lowly expressed and highly variable regions and 2) to remove any regions that may overlap with a gene body. This left approximately 50,000 regions to estimate the noise per condition. The average signal per condition (reads per region assessed) was then divided by the average noise per condition (reads per region assessed). This gave us an SNR factor that was applied to bedgraph files for 1) bigwig conversion using UCSC kentUtils for visualization or 2) count tables for quantification. ChIP figures were generated with the same software outlined in the RNA-seq analysis section, seaborn 0.9.0, bokeh 1.4.0 and pyGenomeTracks 3.5.
QUANTIFICATION AND STATISTICAL ANALYSIS
RNA-seq experiments were completed in biological replicate (experiment 1) or biological triplicate (experiment 2). Statistical analysis of RNA-seq data is described in the Method details. ChIP-seq experiments were completed in biological replicate; however, single replicates for DMSO + peptide and Nutlin + peptide did not pass quality control (see STAR Methods). The number of replicates for each in vitro transcription experiment is indicated in the Figure Legends. Statistical analysis of in vitro transcription data is provided in Figure Legends and Method details.
Supplementary Material
Highlights.
Proteomics identifies Mediator (MED) as “top hit” interactor with p53AD
Stapled peptide inhibits p53-MED binding and p53 transcription; other TFs not affected
TF activation domains viable starting points for design of Mediator-targeting probes
TF function can be controlled by avoiding TF entirely and targeting Mediator instead
ACKNOWLEDGMENTS
We thank J. Goodrich for TAF4 antibodies, R. Tjian for ERCC3 antibodies, A. Erbse for managing the research instruments core, and T. Nahreini for assistance with cell culture. Funding support was provided by the NCI (CA170741 to A.S. and D.J.T.), Golfers Against Cancer (D.J.T.), the NIA (F30AG054091 to C.B.L.), and the NIH (GM117370 and GM139550 to D.J.T.; GM125871 to R.D.D.; T32GM008759 to B.L.A. and J.D.R.; T32GM065103 to T.J.; F32GM122361 to T.R.).
DECLARATION OF INTERESTS
A.S. and D.J.T. have filed a provisional patent application relating to the methodology described in this study. D.J.T. is a member of the scientific advisory board at Dewpoint Therapeutics. A.S. is a member of the scientific advisory board at Lycia and Evozyne. R.D.D. is a founder of Arpeggio Biosciences.
Footnotes
SUPPORTING CITATIONS
The following references appear in the supplemental information: Blagosklonny et al. (1997); Naar et al. (1999); Shi et al. (2012), Andrysik et al. (2017).
SUPPLEMENTAL INFORMATION
Supplemental information can be found online at https://doi.org/10.1016/j.celrep.2022.110630.
REFERENCES
- Allen MA, Andrysik Z, Dengler VL, Mellert HS, Guarnieri A, Freeman JA, Sullivan KD, Galbraith MD, Luo X, Kraus WL, et al. (2014). Global analysis of p53-regulated transcription identifies its direct targets and unexpected regulatory mechanisms. Elife (Cambridge) 3, e02200. [DOI] [PMC free article] [PubMed] [Google Scholar]
- Anders S, and Huber W. (2010). Differential expression analysis for sequence count data. Genome Biol. 11, R106. [DOI] [PMC free article] [PubMed] [Google Scholar]
- Andrysik Z, Galbraith MD, Guarnieri AL, Zaccara S, Sullivan KD, Pandey A, MacBeth M, Inga A, and Espinosa JM (2017). Identification of a core TP53 transcriptional program with highly distributed tumor suppressive activity. Genome Res. 27, 1645–1657. [DOI] [PMC free article] [PubMed] [Google Scholar]
- Aoi Y, Smith ER, Shah AP, Rendleman EJ, Marshall SA, Woodfin AR, Chen FX, Shiekhattar R, and Shilatifard A. (2020). NELF regulates a promoter-proximal step distinct from RNA pol II pause-release. Mol. Cell 78, 261–274.e265. [DOI] [PMC free article] [PubMed] [Google Scholar]
- Audetat KA, Galbraith MD, Odell AT, Lee T, Pandey A, Espinosa JM, Dowell RD, and Taatjes DJ (2017). A kinase-independent role for cyclindependent kinase 19 in p53 response. Mol. Cell Biol 37, e00626–00616. [DOI] [PMC free article] [PubMed] [Google Scholar]
- Bernal F, Tyler AF, Korsmeyer SJ, Walensky LD, and Verdine GL (2007). Reactivation of the p53 tumor suppressor pathway by a stapled p53 peptide. J. Am. Chem. Soc 129, 2456–2457. [DOI] [PMC free article] [PubMed] [Google Scholar]
- Blagosklonny M, Wu G, Somasundaram K, and Eldeiry W. (1997). Wildtype p53 is not sufficient for serum starvation-induced apoptosis in cancer cells but accelerates apoptosis in sensitive cells. Int. J. Oncol 11, 1165–1170. [DOI] [PubMed] [Google Scholar]
- Bradner JE, Hnisz D, and Young RA (2017). Transcriptional addiction in cancer. Cell 168, 629–643. [DOI] [PMC free article] [PubMed] [Google Scholar]
- Brady CA, Jiang D, Mello SS, Johnson TM, Jarvis LA, Kozak MM, Broz DK, Basak S, Park EJ, McLaughlin ME, et al. (2011). Distinct p53 transcriptional programs dictate acute DNA-damage responses and tumor suppression. Cell 145, 571–583. [DOI] [PMC free article] [PubMed] [Google Scholar]
- Brosh R, and Rotter V. (2009). When mutants gain new powers: news from the mutant p53 field. Nat. Rev. Cancer 9, 701–713. [DOI] [PubMed] [Google Scholar]
- Brown CJ, Quah ST, Jong J, Goh AM, Chiam PC, Khoo KH, Choong ML, Lee MA, Yurlova L, Zolghadr K, et al. (2013). Stapled peptides with improved potency and specificity that activate p53. ACS Chem. Biol 8, 506–512. [DOI] [PubMed] [Google Scholar]
- Bushweller JH (2019). Targeting transcription factors in cancer - from undruggable to reality. Nat. Rev. Cancer 19, 611–624. [DOI] [PMC free article] [PubMed] [Google Scholar]
- Chang YS, Graves B, Guerlavais V, Tovar C, Packman K, To KH, Olson KA, Kesavan K, Gangurde P, Mukherjee A, et al. (2013). Stapled alpha-helical peptide drug development: a potent dual inhibitor of MDM2 and MDMX for p53-dependent cancer therapy. Proc. Natl. Acad. Sci. U S A 110, E3445–E3454. [DOI] [PMC free article] [PubMed] [Google Scholar]
- Currie SL, Doane JJ, Evans KS, Bhachech N, Madison BJ, Lau DKW, McIntosh LP, Skalicky JJ, Clark KA, and Graves BJ (2017). ETV4 and AP1 transcription factors form multivalent interactions with three sites on the MED25 activator-interacting domain. J. Mol. Biol 429, 2975–2995. [DOI] [PMC free article] [PubMed] [Google Scholar]
- Ebmeier CC, and Taatjes DJ (2010). Activator-Mediator binding regulates Mediator-cofactor interactions. Proc. Natl. Acad. Sci. U S A 107, 11283–11288. [DOI] [PMC free article] [PubMed] [Google Scholar]
- Fant CB, Levandowski CB, Gupta K, Maas ZL, Moir J, Rubin JD, Sawyer A, Esbin MN, Rimel JK, Luyties O, et al. (2020). TFIID enables RNA polymerase II promoter-proximal pausing. Mol. Cell 78, 785–793. [DOI] [PMC free article] [PubMed] [Google Scholar]
- Ferreon JC, Lee CW, Arai M, Martinez-Yamout MA, Dyson HJ, and Wright PE (2009). Cooperative regulation of p53 by modulation of ternary complex formation with CBP/p300 and HDM2. Proc. Natl. Acad. Sci. U S A 106, 6591–6596. [DOI] [PMC free article] [PubMed] [Google Scholar]
- Flanagan PM, Kelleher RJ III., Sayre MH, Tschochner H, and Kornberg R. (1991). A Mediator required for activation of RNA polymerase II transcription in vitro. Nature 350, 436–438. [DOI] [PubMed] [Google Scholar]
- Fondell JD, Ge H, and Roeder RG (1996). Ligand induction of a transcriptionally active thyroid hormone receptor coactivator complex. Proc. Natl. Acad. Sci. USA 93, 8329–8333. [DOI] [PMC free article] [PubMed] [Google Scholar]
- Freed-Pastor WA, and Prives C. (2012). Mutant p53: one name, many proteins. Genes Dev. 26, 1268–1286. [DOI] [PMC free article] [PubMed] [Google Scholar]
- Gill G, and Ptashne M. (1988). Negative effect of the transcriptional activator GAL4. Nature 334, 721–724. [DOI] [PubMed] [Google Scholar]
- Herbig E, Warfield L, Fish L, Fishburn J, Knutson BA, Moorefield B, Pacheco D, and Hahn S. (2010). Mechanism of Mediator recruitment by tandem Gcn4 activation domains and three Gal11 activator-binding domains. Mol. Cell Biol 30, 2376–2390. [DOI] [PMC free article] [PubMed] [Google Scholar]
- Hnisz D, Abraham BJ, Lee TI, Lau A, Saint-Andre V, Sigova AA, Hoke HA, and Young RA (2013). Super-enhancers in the control of cell identity and disease. Cell 155, 934–947. [DOI] [PMC free article] [PubMed] [Google Scholar]
- Holstege FC, Jennings EG, Wyrick JJ, Lee TI, Hengartner CJ, Green MR, Golub TR, Lander ES, and Young RA (1998). Dissecting the regulatory circuitry of a eukaryotic genome. Cell 95, 717–728. [DOI] [PubMed] [Google Scholar]
- Ito M, Yuan C, Malik S, Gu W, Fondell JD, Yamamura S, Fu Z, Zhang X, Qin J, and Roeder RG (1999). Identity between TRAP and SMCC complexes indicates novel pathways for the function of nuclear receptors and diverse mammalian activators. Mol. Cell 3, 361–370. [DOI] [PubMed] [Google Scholar]
- Ito M, Yuan CX, Okano HJ, Darnell RB, and Roeder RG (2000). Involvement of the TRAP220 component of the TRAP/SMCC coactivator complex in embryonic development and thyroid hormone action. Mol. Cell 5, 683–693. [DOI] [PubMed] [Google Scholar]
- Jiang D, Brady CA, Johnson TM, Lee EY, Park EJ, Scott MP, and Attardi LD (2011). Full p53 transcriptional activation potential is dispensable for tumor suppression in diverse lineages. Proc. Natl. Acad. Sci. U S A 108, 17123–17128. [DOI] [PMC free article] [PubMed] [Google Scholar]
- Jimenez GS, Nister M, Stommel JM, Beeche M, Barcarse EA, Zhang XQ, O’Gorman S, and Wahl GM (2000). A transactivation-deficient mouse model provides insights into Trp53 regulation and function. Nat. Genet 26, 37–43. [DOI] [PubMed] [Google Scholar]
- Johnson TM, Hammond EM, Giaccia A, and Attardi LD (2005). The p53QS transactivation-deficient mutant shows stress-specific apoptotic activity and induces embryonic lethality. Nat. Genet 37, 145–152. [DOI] [PubMed] [Google Scholar]
- Kastenhuber ER, and Lowe SW (2017). Putting p53 in context. Cell 170, 1062–1078. [DOI] [PMC free article] [PubMed] [Google Scholar]
- Khoo KH, Verma CS, and Lane DP (2014). Drugging the p53 pathway: understanding the route to clinical efficacy. Nat. Rev. Drug Discov 13, 217–236. [DOI] [PubMed] [Google Scholar]
- Kim YW, Grossmann TN, and Verdine GL (2011). Synthesis of all-hydrocarbon stapled alpha-helical peptides by ring-closing olefin metathesis. Nat. Protoc 6, 761–771. [DOI] [PubMed] [Google Scholar]
- Knuesel MT, Meyer KD, Bernecky C, and Taatjes DJ (2009). The human CDK8 subcomplex is a molecular switch that controls Mediator co-activator function. Genes Dev. 23, 439–451. [DOI] [PMC free article] [PubMed] [Google Scholar]
- Krois AS, Ferreon JC, Martinez-Yamout MA, Dyson HJ, and Wright PE (2016). Recognition of the disordered p53 transactivation domain by the transcriptional adapter zinc finger domains of CREB-binding protein. Proc. Natl. Acad. Sci. U S A 113, E1853–E1862. [DOI] [PMC free article] [PubMed] [Google Scholar]
- Kruiswijk F, Labuschagne CF, and Vousden KH (2015). p53 in survival, death and metabolic health: a lifeguard with a licence to kill. Nat. Rev. Mol. Cell Biol 16, 393–405. [DOI] [PubMed] [Google Scholar]
- Lambert E, Puwakdandawa K, Tao YF, and Robert F. (2021). From structure to molecular condensates: emerging mechanisms for Mediator function. FEBS J. 10.1111/febs.16250. [DOI] [PubMed] [Google Scholar]
- Lambert SA, Jolma A, Campitelli LF, Das PK, Yin Y, Albu M, Chen X, Taipale J, Hughes TR, and Weirauch MT (2018). The human transcription factors. Cell 172, 650–665. [DOI] [PubMed] [Google Scholar]
- Lee TI, and Young RA (2013). Transcriptional regulation and its misregulation in disease. Cell 152, 1237–1251. [DOI] [PMC free article] [PubMed] [Google Scholar]
- Levandowski CB, Jones T, Gruca M, Ramamoorthy S, Dowell RD, and Taatjes DJ (2021). The Delta40p53 isoform inhibits p53-dependent eRNA transcription and enables regulation by signal-specific transcription factors during p53 activation. PLoS Biol. 19, e3001364. [DOI] [PMC free article] [PubMed] [Google Scholar]
- Li H, Handsaker B, Wysoker A, Fennell T, Ruan J, Homer N, Marth G, Abecasis G, Durbin R, and Genome Project Data Processing, S. (2009). The sequence alignment/map format and SAMtools. Bioinformatics 25, 2078–2079. [DOI] [PMC free article] [PubMed] [Google Scholar]
- Liao Y, Smyth GK, and Shi W. (2014). featureCounts: an efficient general purpose program for assigning sequence reads to genomic features. Bioinformatics 30, 923–930. [DOI] [PubMed] [Google Scholar]
- Liao Y, Smyth GK, and Shi W. (2019). The R package Rsubread is easier, faster, cheaper and better for alignment and quantification of RNA sequencing reads. Nucleic Acids Res. 47, e47. [DOI] [PMC free article] [PubMed] [Google Scholar]
- Lin J, Chen J, Elenbaas B, and Levine AJ (1994). Several hydrophobic amino acids in the p53 amino-terminal domain are required for transcriptional activation, binding to mdm-2 and the adenovirus 5 E1B 55-kD protein. Genes Development 8, 1235–1246. [DOI] [PubMed] [Google Scholar]
- Love MI, Huber W, and Anders S. (2014). Moderated estimation of fold change and dispersion for RNA-seq data with DESeq2. Genome Biol. 15, 550. [DOI] [PMC free article] [PubMed] [Google Scholar]
- Luyties O, and Taatjes DJ (2022). The Mediator kinase module: an interface between cell signaling and transcription. Trends Biochem. Sci 47, 314–327. [DOI] [PMC free article] [PubMed] [Google Scholar]
- Meyer KD, Lin S, Bernecky C, Gao Y, and Taatjes DJ (2010). p53 activates transcription by directing structural shifts in Mediator. Nat. Struct. Mol. Biol 17, 753–760. [DOI] [PMC free article] [PubMed] [Google Scholar]
- Meyer ME, Gronemeyer H, Turcotte B, Bocquel MT, Tasset D, and Chambon P. (1989). Steroid hormone receptors compete for factors that mediate their enhancer function. Cell 57, 433–442. [DOI] [PubMed] [Google Scholar]
- Meyer-Arendt K, Old WM, Houel S, Renganathan K, Eichelberger B, Resing KA, and Ahn NG (2011). IsoformResolver: a peptide-centric algorithm for protein inference. J. proteome Res 10, 3060–3075. [DOI] [PMC free article] [PubMed] [Google Scholar]
- Milbradt AG, Kulkarni M, Yi T, Takeuchi K, Sun ZY, Luna RE, Selenko P, Naar AM, and Wagner G. (2011). Structure of the VP16 transactivator target in the Mediator. Nat. Struct. Mol. Biol 18, 410–415. [DOI] [PMC free article] [PubMed] [Google Scholar]
- Morrison C. (2018). Constrained peptides’ time to shine? Nat. Rev. Drug Discov 17, 531–533. [DOI] [PubMed] [Google Scholar]
- Muttenthaler M, King GF, Adams DJ, and Alewood PF (2021). Trends in peptide drug discovery. Nat. Rev. Drug Discov 20, 309–325. [DOI] [PubMed] [Google Scholar]
- Naar AM, Beaurang PA, Robinson KM, Oliner JD, Avizonis D, Scheek S, Zwicker J, Kadonaga JT, and Tjian R. (1998). Chromatin, TAFs, and a novel multiprotein coactivator are required for synergistic activation by Sp1 and SREBP-1a in vitro. Genes Dev. 12, 3020–3031. [DOI] [PMC free article] [PubMed] [Google Scholar]
- Naar AM, Beaurang PA, Zhou S, Abraham S, Solomon W, and Tjian R. (1999). Composite co-activator ARC mediates chromatin-directed transcriptional activation. Nature 398, 828–832. [DOI] [PubMed] [Google Scholar]
- Nishikawa JL, Boeszoermenyi A, Vale-Silva LA, Torelli R, Posteraro B, Sohn YJ, Ji F, Gelev V, Sanglard D, Sanguinetti M, et al. (2016). Inhibiting fungal multidrug resistance by disrupting an activator-Mediator interaction. Nature 530, 485–489. [DOI] [PMC free article] [PubMed] [Google Scholar]
- Polit L, Kerdivel G, Gregoricchio S, Esposito M, Guillouf C, and Boeva V. (2021). CHIPIN: ChIP-seq inter-sample normalization based on signal invariance across transcriptionally constant genes. BMC bioinformatics 22, 407. [DOI] [PMC free article] [PubMed] [Google Scholar]
- Poss ZC, Ebmeier CC, and Taatjes DJ (2013). The Mediator complex and transcription regulation. Crit. Rev. Biochem. Mol. Biol 48, 575–608. [DOI] [PMC free article] [PubMed] [Google Scholar]
- Quach K, LaRochelle J, Li XH, Rhoades E, and Schepartz A. (2018). Unique arginine array improves cytosolic localization of hydrocarbon-stapled peptides. Bioorg. Med. Chem 26, 1197–1202. [DOI] [PubMed] [Google Scholar]
- Quevedo M, Meert L, Dekker MR, Dekkers DHW, Brandsma JH, van den Berg DLC, Ozgur Z, van IWFJ, Demmers J, Fornerod M, et al. (2019). Mediator complex interaction partners organize the transcriptional network that defines neural stem cells. Nat. Commun 10, 2669. [DOI] [PMC free article] [PubMed] [Google Scholar]
- Quinlan AR, and Hall IM (2010). BEDTools: a flexible suite of utilities for comparing genomic features. Bioinformatics 26, 841–842. [DOI] [PMC free article] [PubMed] [Google Scholar]
- Ramirez F, Bhardwaj V, Arrigoni L, Lam KC, Gruning BA, Villaveces J, Habermann B, Akhtar A, and Manke T. (2018). High-resolution TADs reveal DNA sequences underlying genome organization in flies. Nat. Commun 9, 189. [DOI] [PMC free article] [PubMed] [Google Scholar]
- Resing KA, Meyer-Arendt K, Mendoza AM, Aveline-Wolf LD, Jonscher JR, Pierce KG, Old WM, Cheung HT, Russell S, Wattawa JL, et al. (2004). Improving reproducibility and sensitivity in identifying human proteins by shotgun proteomics. Anal. Chem 76, 3556–3568. [DOI] [PubMed] [Google Scholar]
- Ritchie ME, Phipson B, Wu D, Hu Y, Law CW, Shi W, and Smyth GK (2015). Limma powers differential expression analyses for RNA-sequencing and microarray studies. Nucleic Acids Res. 43, e47. [DOI] [PMC free article] [PubMed] [Google Scholar]
- Sanborn AL, Yeh BT, Feigerle JT, Hao CV, Townshend RJ, Lieberman Aiden E, Dror RO, and Kornberg RD (2021). Simple biochemical features underlie transcriptional activation domain diversity and dynamic, fuzzy binding to Mediator. eLife 10, e68068. [DOI] [PMC free article] [PubMed] [Google Scholar]
- Shi Y, Felley-Bosco E, Marti TM, Orlowski K, Pruschy M, and Stahel RA (2012). Starvation-induced activation of ATM/Chk2/p53 signaling sensitizes cancer cells to cisplatin. BMC Cancer 12, 571. [DOI] [PMC free article] [PubMed] [Google Scholar]
- Shoffner A, Cigliola V, Lee N, Ou J, and Poss KD (2020). Tp53 suppression promotes cardiomyocyte proliferation during zebrafish heart regeneration. Cell Rep. 32, 108089. [DOI] [PMC free article] [PubMed] [Google Scholar]
- Subramanian A, Tamayo P, Mootha VK, Mukherjee S, Ebert BL, Gillette MA, Paulovich A, Pomeroy SL, Golub TR, Lander ES, et al. (2005). Gene set enrichment analysis: a knowledge-based approach for interpreting genome-wide expression profiles. Proc. Natl. Acad. Sci. U S A 102, 15545–15550. [DOI] [PMC free article] [PubMed] [Google Scholar]
- Tourigny JP, Schumacher K, Saleh MM, Devys D, and Zentner GE (2021). Architectural mediator subunits are differentially essential for global transcription in saccharomyces cerevisiae. Genetics 217, iyaa042. [DOI] [PMC free article] [PubMed] [Google Scholar]
- Vassilev LT, Vu BT, Graves B, Carvajal D, Podlaski F, Filipovic Z, Kong N, Kammlott U, Lukacs C, Klein C, et al. (2004). In vivo activation of the p53 pathway by small-molecule antagonists of MDM2. Science 303, 844–848. [DOI] [PubMed] [Google Scholar]
- Vojnic E, Mourao A, Seizl M, Simon B, Wenzeck L, Lariviere L, Baumli S, Baumgart K, Meisterernst M, Sattler M, et al. (2011). Structure and VP16 binding of the Mediator Med25 activator interaction domain. Nat. Struct. Mol. Biol 18, 404–409. [DOI] [PubMed] [Google Scholar]
- Webster MR, Fane ME, Alicea GM, Basu S, Kossenkov AV, Marino GE, Douglass SM, Kaur A, Ecker BL, Gnanapradeepan K, et al. (2020). Paradoxical role for wild-type p53 in driving therapy resistance in melanoma. Mol. Cell 77, 633–644.e635. [DOI] [PMC free article] [PubMed] [Google Scholar]
- Whyte WA, Orlando DA, Hnisz D, Abraham BJ, Lin CY, Kagey MH, Rahl PB, Lee TI, and Young RA (2013). Master transcription factors and mediator establish super-enhancers at key cell identity genes. Cell 153, 307–319. [DOI] [PMC free article] [PubMed] [Google Scholar]
- Wisniewski JR, Zougman A, Nagaraj N, and Mann M. (2009). Universal sample preparation method for proteome analysis. Nat. Methods 6, 359–362. [DOI] [PubMed] [Google Scholar]
- Yang F, Vought BW, Satterlee JS, Walker AK, Jim Sun Z, Watts JL, DeBeaumont R, Mako Saito R, Hyberts SG, Yang S, et al. (2006). An ARC/Mediator subunit required for SREBP control of cholesterol and lipid homeostasis. Nature 442, 700–704. [DOI] [PubMed] [Google Scholar]
- Zhao H, Young N, Kalchschmidt J, Lieberman J, El Khattabi L, Casellas R, and Asturias FJ (2021). Structure of mammalian Mediator complex reveals Tail module architecture and interaction with a conserved core. Nat. Commun 12, 1355. [DOI] [PMC free article] [PubMed] [Google Scholar]
Associated Data
This section collects any data citations, data availability statements, or supplementary materials included in this article.
Supplementary Materials
Data Availability Statement
RNA-seq and ChIP-seq data have been deposited on NCBI GEO and are publicly available on the date of publication.
Accession numbers are listed in the key resources table. All original code used to analyze this data has been deposited at https://zenodo.org/badge/latestdoi/467625091 and is publicly available on the date of publication.
Any additional information required to re-analyze the data reported in this paper is available from the lead contact upon request.
KEY RESOURCES TABLE
| REAGENT or RESOURCE | SOURCE | IDENTIFIER |
|---|---|---|
|
| ||
| Antibodies | ||
|
| ||
| DO-1 p53 | Santa Cruz Biotechnology | sc-126; RRID:AB_628082 |
| Ser5P clone 3E8 | Millipore Sigma | 04–1572; RRID:AB_10615822 |
| MED23 | Bethyl | A300–425A;RRID:AB_2142309 |
| MED15 | Lab stock | N/A |
| MED1 | Santa Cruz Biotechnology | sc-8998; RRID:AB_2144021 |
| GST | Santa Cruz Biotechnology | sc-459; RRID:AB_631586 |
|
| ||
| Chemicals, peptides, and recombinant proteins | ||
|
| ||
| McCoy’s 5A media | Gibco | 16600082 |
| RPMI media | Gibco | 12633012 |
| Cell Culture Supplement: Antibiotic-Antimycotic | Gibco | 15240062 |
| Cell Culture Supplement: Fetal Bovine Serum | Gibco | 16141061 |
| Phenol/chloroform | Sigma | P1944 |
| Immobilon Chemiluminescent HRP substrate | Millipore | P90719 |
| TRIzol reagent | Invitrogen | 15596018 |
| RNAseOUT | Invitrogen | 10777019 |
| rATP | Promega | E6011 |
| rCTP | Promega | E6041 |
| rGTP | Promega | E6031 |
| rUTP | Promega | E6021 |
| [γ−32P]ATP | Perkin Elmer | NEG502Z001MC |
| Proteinase K | New England Biolabs | P81075 |
| T4 Polynucleotide Kinase | New England Biolabs | M0201S |
| Standard Fmoc-protected amino acids | Novabiochem | amino acid specific |
| (S)-N- Fmoc-2-(4’- pentenyl)alanine | Okeanos Tech Jiangsu Co., Ltd | OK-UA-09216 |
| (R)-N-Fmoc-2-(7’-octenyl)alanine | Okeanos Tech Jiangsu Co., Ltd | OK-UA-09222 |
| Rink amide resin | Sigma-Aldrich | 8.55001 |
| N,N-dimethylformamide (DMF) | Sigma-Aldrich | 227056 |
| N- hydroxybenzotriazole (HOBt) | Sigma-Aldrich | 157260 |
| Grubbs CatalystTM 1st Generation | Sigma-Aldrich | 579726 |
| Trifluoroacetic acid (TFA) | Acros Organics | 432291000 |
| Dichloroethane (DCE) | Acros Organics | 433580010 |
| N,N,N’,N’- tetramethyl-uronium-hexafluoro-phosphate (HBTU) | AmericanBio | AB00883 |
| diisopropylethylamine (DIEA) | AmericanBio | discontinued |
| Anhydrous piperazine | EMD Millipore | 807325 |
| 6-chlorobenzotriazole-1-yloxy-tris-pyrrolidinophosphonium hexafluorophosphate (PyClocK) |
EMD Millipore | 851087 |
| Acetic anhydride | ThermoScientific, Pierce Biotechnology | AC149490010 |
| Nutlin-3a | SelleckChem | S8059 |
|
| ||
| Deposited data | ||
|
| ||
| RNA-seq | This paper | GEO: GSE135870 |
| ChIP-seq | This paper | GEO: GSE193418 |
| Custom code | Zenodo | https://zenodo.org/badge/latestdoi/467625091 |
|
| ||
| Experimental models: Cell lines | ||
|
| ||
| HCT116 cells | ATCC | CCL-247 |
| SJSA Cells | ATCC | CRL-2098 |
|
| ||
| Oligonucleotides | ||
|
| ||
| qRT-PCR primers | IDT | see Table S6 |
|
| ||
| Software and algorithms | ||
|
| ||
| Mascot v2.2 | Matrix Sciences | https://www.matrixscience.com/ |
| RNAseq-Flow- Nextflow pipeline v1.1 | Dowell Lab; Mapping, trimming and quality assessment | https://github.com/Dowell-Lab/RNAseq-Flow |
| ChIP-Flow - Nextflow pipeline v1.0 | Dowell Lab; Mapping, trimming and quality assessment | https://github.com/Dowell-Lab/ChIP-Flow |
| BBDuk v38.05 | Bushnell B., Joint Genome Institute; Trimming | https://jgi.doe.gov/data-and-tools/bbtools/ |
| FastQC v0.11.8 | Babraham Bioinformatics; Quality assessment | https://www.bioinformatics.babraham.ac.uk/projects/fastqc/ |
| Preseq v2.0.3 | Andrew D Smith; Quality assessment | https://github.com/smithlabcode/preseq |
| HiSat2 v2.1.0 | Daehwan Kim; Mapping | http://daehwankimlab.github.io/hisat2/manual/ |
| Samtools v1.8 | Li et al., 2009; Mapping file conversions | http://www.htslib.org/ |
| IGV Tools v2.3.75 | Broad Institute; Mapping file conversions and visualization | https://software.broadinstitute.org/software/igv/igvtools |
| kentUtils | ENCODE; Mapping file conversions | https://github.com/ENCODE-DCC/kentUtils |
| Bedtools v2.28.0 | Quinlan and Hall, 2010; Coordinate math on mapped files | https://bedtools.readthedocs.io/en/latest/ |
| Python v3.6.3 | General data assessment and plot generation | https://www.python.org/ |
| R v3.6.0 | General data assessment and plot generation | https://www.r-project.org/ |
| limma v3.42.2 | Ritchie et al., 2015; Batch correction | https://bioconductor.org/packages/release/bioc/html/limma.html |
| Rsubread v2.0.1 | Liao et al., 2019; Counting RNA-seq reads | http://subread.sourceforge.net/ |
| DESeq2 v1.26.0 | Love et al., 2014; Differential expression analysis | https://bioconductor.org/packages/release/bioc/html/DESeq2.html |
| Gene Set Enrichment Analysis v4.0.3 | Subramanian et al., 2005; Pathway analysis | https://www.gsea-msigdb.org/gsea/index.jsp |
| seaborn v0.9.0 | General plotting software | https://seaborn.pydata.org/introduction.html |
| bokeh v1.4.0 | General plotting software | https://docs.bokeh.org/en/latest/ |
| pyGenomeTracks v3.5 | Ramirez et al., 2018; Plotting software | https://github.com/deeptools/pyGenomeTracks |
|
| ||
| Other | ||
|
| ||
| Microcon YM-30 spin concentrator | Millipore Sigma | Z648086 |
| Phenomenex Jupiter C18 (5mM 300 Å, 0.25 × 150mm) column | Custom fabricated | N/A |
| Acclaim PepMap C18 (3μm 100 Å, 0.075 × 150mm) column | Dionex | 164946 |
| Triaryl-C18 (YMC-Triaryl-C18, 150mm x 10mm,5 μm, 12 nm) column | YMC America, Inc. | YMTA12S05–1546WT |
| C8 reverse phase (Sonoma C8(2), 3 μm, 100 Å, 2.1 × 100 mm) analytical column | ES Industries | ES132121-SMA-C8(2) |
| G-25 column | Millipore Sigma | GE27–5325-01 |
| Glutathione-Sepharose resin | GE Healthcare | 17–0756-05 |
| Protein G Dynabeads | Invitrogen | 10003D |
| CellTiter-Glo assay | Promega | G7570 |
| Neon™ Transfection System Kit | ThermoFisher Scientific | MPK1025/MPK10025 |
| High Capacity cDNA kit | ThermoFisher Scientific | 4368813 |
| RNA-seq Library Prep Kit: Next II Ultradirectional | New England Biolabs | E7760S |
| Covaris truChIP Chromatin Shearing Kit | Covaris | 520237 |
| Light-5PRIME Phase Lock Tubes | Quanta Bio | 2302820 |
| ChIP-seq Library Prep Kit: KAPA Hyper Prep Kit | KAPA Biosystems | KK8502 |