Abstract
The green cyanide-free gold deposition is an important development direction in electroless gold plating. However, the commonly Au(i) based cyanide-free gold plating bath always suffers from severe corrosion to the Ni–P layer and unsatisfactory service life of the bath. In this work, a green and environmentally friendly cyanide-free gold plating bath was developed with hypophosphite added as a reducing agent into the Au(iii)–DMH (5,5-dimethylhydantoin) based plating bath to retard the corrosion of the Ni–P layer. SEM micrographs combined with XRD and XPS analysis indicated that the electroless deposited gold was pure and compact. And XRD also revealed that the oriented deposition of gold was growing preferentially on Au (111). Corrosion tests, including salt spray tests, potentiodynamic polarization tests, and electrochemical impedance spectroscopy tests, indicated that the obtained Cu/Ni–P/Au coatings had significantly improved corrosion resistance performance with the loading of hypophosphite as the reducing agent. The baths remained transparent and no turbidity or precipitates were detected for 210 days, reflecting good stability. The detection for the Ni2+ concentration in the bath showed that adding hypophosphite could retard the replacement reaction between Au3+ and the Ni–P layer in part and this is important for decreasing the severe corrosion of the Ni–P layer. Moreover, Au was inactive for catalyzing the oxidation of hypophosphite during the deposition process which was confirmed furthermore via quantum chemical calculations. Therefore, our developed green cyanide-free electroless gold deposition process can beneficially provide research value and application prospects in microelectronic industry.
In the Au(iii)–DMH based cyanide-free electroless gold plating bath, the added hypophosphite inhibited the black pad and improved the corrosion resistance of the Cu/Ni–P/Au coating.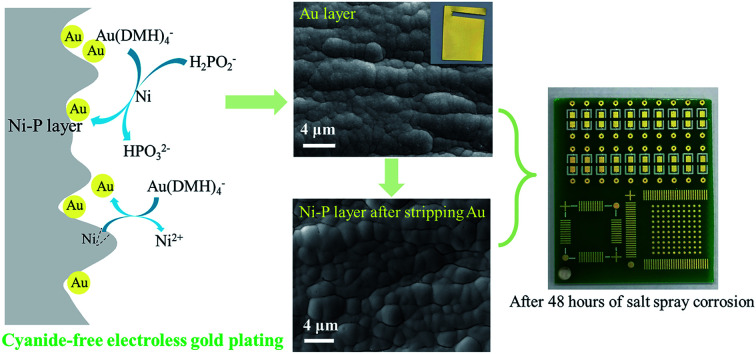
1. Introduction
Copper is popular in the electronic field because of its high conductivity and low price. However, copper has poor oxidation and corrosion resistance. Oxidation and corrosion products will hinder the conduction of electronic circuits, so it is necessary to carry out surface protection treatments on copper. Gold has excellent electrical function and chemical stability, and can provide an ideal corrosion protection effect on copper.1 It is not recommended to deposit gold directly on copper, because copper will diffuse to the gold layer under the high temperature of wire bonding and encapsulation processes.2 A nickel–phosphorus alloy can be used as a barrier to prevent diffusion.3,4 In electronics, it is a common surface treatment to deposit nickel–phosphorus alloy and gold on the copper substrate in turn. It is usually realized through the electroless nickel/immersion gold (ENIG) process. The Cu/Ni–P/Au multi-layer film has excellent corrosion resistance and oxidation resistance compared with bare copper. The Au layer is thin soft pure gold except for electrical contact materials, and the thickness is usually about 0.03–0.1 μm. Although gold is an inert metal, it may be porous, especially at low thickness.5 These pores induce the corrosion of the sublayer. The porosity of the gold layer obtained through immersion process had been reported as a fatal shortcoming.6 Therefore, the deposition of a dense Au layer is very important to improve the corrosion resistance of Cu/Ni–P/Au multi-layer film.
In the traditional gold deposition, CN− is widely used as a good complexing agent for Au+ to form Au(CN)2− coordination ion with high stability constant (Kf) of 1038, which avoids the disproportionation reaction generally and retards bath decomposition effectively.7 However, the complexing agent of cyanide in baths is highly toxic, and CN− is also in poor compatibility with photoresists, which is harmful to the performance of electronic products. With the improvement of environmental consciousness and for the manufacture of high-reliability precision electronic equipment, significant efforts have been made to find alternatives of CN−. In the Au(i) based cyanide-free electroless plating baths, sulfite bath (Kf[Au(SO3)23−] = 1026.8) and thiosulfate bath (Kf[Au(S2O3)23−] = 1026.1) were widely studied.1,8 Unfortunately, the optimized operating conditions of pH for both baths were above 8.9–11 In a high-temperature and alkaline environment (pH > 8), the photoresist will dissolve and its organic products will contaminate the bath. Accordingly, Kato et al.12 and Osaka et al.13 proposed a nearly neutral gold plating bath containing both sulfite and thiosulfate as mixed complexing agents (Kf[Au(S2O3)(SO3)3−] = 1027.1).14 However, this neutral gold plating bath suffered from the co-deposition of S element.15 The presence of S atom will reduce the weldability and corrosion resistance of coatings.16,17 Moreover, this type of bath was not stable sufficiently in whole service life. Recently, mercaptosuccinic acid and l-cysteine have been used as cyanide-free ligands for Au+.18,19 The sulfhydryl group has a very strong coordination ability, and can even replace part of CN− in Au(CN)2−.20 However, the smell of mercaptosuccinic acid and l-cysteine are unpleasant, especially under high-temperature reaction conditions. It remains challenging to develop green and environmental friendly cyanide-free Au(i) based plating baths.
In aqueous solution, Au3+ is more stable than Au+, so it has been favored by more researchers in recent years. 5,5-Dimethylhydantoin (DMH),21–24 theophylline,25 and hypoxanthine26,27 were cyanide-free complexing agents used in electroplating baths with Au3+ as the main salt. Among the three new complexing agents, DMH has been studied most. DMH is a nitrogen heterocyclic organic compound with low price, strong coordination ability, and good solubility in water. After the N atom between its two C O bonds ionizes H+, it can form DMH− ion and then coordinate with Au3+ to form a four-coordinate complex.22,28,29 The stability constant of Au(DMH)4− which is square planar in geometry is 1021.1 The cyanide-free gold plating system with DMH as a complex can electrodeposit bright gold layer. As we all know, electroless plating is an essential way of metal deposition due to its unique advantages. Uniform thickness of coatings can be obtained via electroless plating, especially for parts or products with complex geometry. For the unconnected metal surface or non-conductive nonmetal surface, electroless plating is of competence, while electroplating is powerless.30 Therefore, it is of great significance to study Au3+ in electroless plating systems and it is expected to solve the problem of instability of cyanide-free plating baths. However, other problems will follow. ENIG process relies on the replacement reaction of gold ions and nickel atoms to achieve gold deposition, and this process leads to the unavoidable corrosive behavior of gold ions to Ni–P layer. The black pad phenomenon,31 also known as black nickel, which will reduce the corrosion resistance of the coating, will occur if the corrosion of gold ions is serious. According to eqn (1) and (2), it can be known that when depositing the same number of gold atoms, Au3+ consumes Ni atoms three times more than Au+, which means that the Au3+ based gold plating bath is more prone to black pad. As reported by Wang et al., although the Au(iii)–ChCl based immersion gold plating bath was very stable, the black pad appeared and the coating could not effectively protect the copper substrate.32 Thus, Au3+ is usually disliked in electroless process.
| 2Au+ + Ni → Ni2+ + 2Au | 1 |
| 2Au3+ + 3Ni → 3Ni2+ + 2Au | 2 |
It may be an effective strategy to replace nickel atom with a reductant to provide electrons and participate in the reaction by adding reducing agents. Although this strategy has been reported in electroless gold plating, the reports mainly used KAu(CN)2 as the gold salt and focused on the plating rate and electrochemical behavior.33–36 There are few reports on Au3+ as the gold salt and few attention focused on the inhibition for black pad. During the electroless gold deposition, Au layer is usually produced by the controlled chemical reduction of metallic ions onto a catalytic surface. Therefore, the added reducing agent should be catalyzed by the substrate (i.e. nickel for our work) and the Au deposition is favored on it.37 In electroless nickel plating baths, many reducing agents including sodium hypophosphite, amino boranes, sodium borohydride, and hydrazine have been shown to be catalyzed by nickel.30 Because of its low-cost and relative safety, sodium hypophosphite is especially attractive in electroless nickel plating. Inspired by previous reports, low-cost and environment-friendly DMH and sodium hypophosphite were used as the complexing agent and reducing agent in our work, respectively.
In this study, a green and environmentally friendly cyanide-free gold plating bath was developed with adding hypophosphite as a reducing agent into the Au(iii)–DMH based plating bath to retard the corrosion of Ni–P layer. At first, the structures and elemental compositions of Cu/Ni–P/Au coatings prepared from plating baths containing different concentrations of sodium hypophosphite were studied, including scanning electron microscope (SEM), X-ray diffraction (XRD), and X-ray photoelectron spectroscopy (XPS). Importantly, the corrosion resistance of the coatings was evaluated by salt spray tests, potentiodynamic polarization (PDP) tests, and electrochemical impedance spectroscopy (EIS) tests. It proved that the addition of sodium hypophosphite as a reducing agent into the Au(iii)–DMH based plating bath improved the corrosion resistance of Cu/Ni–P/Au coatings efficiently. Finally, the catalytic process for the oxidation of hypophosphite was conformed by atomic absorption spectrophotometer (AAS) and quantum chemical calculations. Overall, this basic research showed the importance of reducing agents and great potential of using Au3+ as the main salt in electroless gold deposition. For developing the novel environmentally friendly cyanide-free Au(iii) based plating bath, researchers can no longer limit their attention only to the development of cyanide-free complexing agents as usual, and the exploration of reducing agents is also particularly important for cyanide-free gold plating.
2. Material and methods
2.1. Reagent and electroless deposition of Cu/Ni–P/Au coatings
In this work, AuCl3 was used as the gold salt, purchased from Macklin Biochemical Co., Ltd (China). DMH, NaH2PO2, NaH2PO4, Na2HPO4, Na2S2O8, and PdCl2 were obtained from Aladdin Bio-Chem Technology Co., Ltd (China). All the chemicals used were analytical grade. Ultrapure water (18.2 MΩ cm−1) was employed as the solvent.
Copper sheets (see Fig. S1(a)† (ESI) for SEM image) were used as the substrates in this study. Copper sheets were degreased with a cleaner (9167T, GHTECH, China) for 5 min at 35 °C, subsequently pickled in a mixed solution of 5 wt% sulfuric acid and 60 g L−1 Na2S2O8 for 1 min at room temperature (see Fig. S1(b)† (ESI) for SEM image) and activated in 30 mg L−1 PdCl2 solution for 3 min at room temperature. After these pretreatment steps, copper sheets were immediately transferred into the commercial electroless Ni–P plating bath (5183S, GHTECH, China). Its compositions and operation conditions are presented in Table 1. The thickness and P content of the Ni–P layer (see Fig. S2(a)† (ESI) for SEM image) are 5 μm and 9.4 wt%, respectively. Electroless nickel plating was followed by electroless gold plating process. Detailed chemical composition and operation conditions of the electroless gold plating bath are listed in Table 2. In order to obtain the same thickness of Au layer, the operation time decreases with the increase of the concentration of NaH2PO2. The reaction time of gold plating process is listed in Table S1† (ESI). Unless otherwise specified, the thickness of the Au layer is 0.05 μm. There was a doubly distilled water washing step between each step of the process above.
Chemical composition of the electroless nickel plating bath and its operation condition.
| Chemicals | Concentration | Condition |
|---|---|---|
| NiSO4·6H2O | 21 g L−1 | pH = 4.8 |
| NaH2PO2 | 28 g L−1 | Temperature: 85 °C |
| Others | Proprietary | Plating time: 25 min |
Chemical composition of the electroless gold plating bath and its operation condition.
| Chemicals | Concentration | Condition |
|---|---|---|
| AuCl3 | 0.54 g L−1 | pH = 6.0 |
| DMH | 4.88 g L−1 | Temperature: 85 °C |
| NaH2PO2 | 0–10 g L−1 | Plating time: 8–15 min |
| NaH2PO4·2H2O | 27.36 g L−1 | |
| Na2HPO4 | 3.49 g L−1 |
2.2. Characterization
Thickness was measured by an X-ray coating thickness meter (XDLM-PCB200, Fischer, Germany). Surface morphologies of the Au layers and Ni–P layers after stripping gold were characterized through SEM (Phenom ProX, Phenom-World, Netherlands) with 15 kV accelerating voltage. Comparing with the SEM images (Fig. S2† (ESI)) of Ni–P layer before and after the stripping process, it can be seen that the surface morphology of the Ni–P layer has not changed significantly after the stripping step, indicating that the stripping process will not damage the Ni–P layer. The cross-sectional morphologies were analyzed by a field-emission scanning electron microscope (FESEM, LYRA 3 XMU, Tescan, Czech Republic) with a focused ion beam (FIB). To avoid the damage of the gold layer during sanding, a 5 μm Ni–P layer as a protective layer was deposited on the gold layer when making the sample for photographing the cross-sectional morphology. The composition of the nickel plating bath was the same as above. Atomic force microscopy (AFM, Dimension FastScan, Bruker, America) was used to obtain 3-D surface topography of the Ni–P layer. The crystal structure was investigated by performing X-ray diffraction (Aeris, Panalytical, Netherlands) using Cu Kα1 radiation and the identification of peaks on the XRD patterns was carried out by using the data of the card file JSPDS. The chemical composition of the Au layer was analyzed by X-ray photoelectron spectroscopy (Escalab 250Xi, Thermo Fisher, England) with a monochromatic Al Kα X-ray source and a beam diameter of 650 μm, operating at a pressure around 5.0 × 10⁻⁹ mBar. XPS depth profiles study was performed by etching the surface with a 1 keV Ar ion beam for 100 s repeatedly, and XPS spectra were taken after every etching cycle. The reference sputtering rate was 0.1 nm s−1, as calibrated vs. a silicon dioxide standard. Due to the fluctuation of the coating surface, the etch depth did not represent the accurate coating thickness.
Corrosion tests included neutral salt spray tests, PDP tests, and EIS tests. The neutral salt spray tests were realized in the cyclic corrosion tester (LX-60A, Laibote, China). According to ISO 9227-2017 standard, the temperature and air pressure of the atomized saline solution were maintained at 35 °C and 197.2 kPa, respectively. The samples were exposed to a 5 wt% NaCl solution and retrieved for observation with naked eyes and optical microscopy after 48 hours. The electrochemical corrosion resistance of the Cu/Ni–P/Au coatings in a 3.5% NaCl solution was analyzed using an Autolab electrochemical work station (Pgstat302n, Metrohm, Switzerland) equipped with a three-chamber electrochemical cell. The working electrode was the Cu/Ni–P/Au coating with a square area of 0.7 × 0.7 cm2, exposed in a 3.5 wt% NaCl solution for about 30 min before each experiment to stabilize the potential, which was then taken as the open circuit potential (OCP). A platinum electrode (Φ 16 mm) and saturated calomel electrode (SCE) were performed as the counter and reference electrodes, respectively. A lugging capillary was placed near the working electrode to reduce the IR drop. In PDP tests, the potential range was ±300 mV vs. the OCP with a scan rate of 5 mV s−1. In EIS tests, the frequency region was from 105 to 0.05 Hz with a 10 mV amplitude in the OCP. The fitting results of PDP and EIS tests were obtained with the built-in software. The electrochemical parameters obtained from the PDP curves were used in the calculation of the total coating porosity (P):38
 where Rp is the polarization resistance, P is the total coating porosity, icorr is the corrosion current density, Ecorr is the corrosion potential, βa and βc are the anodic and cathodic Tafel slopes, respectively.
The adhesion properties of the coatings were determined by tape. First, the samples were stored in the high and low temperature cyclic tester (BPH-060C, Blue pard, China) for 16 days. A high temperature of 130 °C for 24 hours and a low temperature of −35 °C for 24 hours constituted a cycle. After being destroyed by extreme temperature, a blade was used to scratch 100 squares of 1 mm2 on the coatings. Then stick on the transparent tape (600, Scotch, America) and tear off after pressing according to the standard ASTM D3359.
UV-vis absorption spectra were recorded on a spectrophotometer (Lambda 950, PerkinElmer, America) for investigating the stability of baths.
Atomic absorption spectrophotometer (AA-6800, Shimadzu, Japan) was used to detect the concentration of nickel ions in the solution.
2.3. Quantum chemical calculation
ORCA 4.2.1 program was employed for the quantum chemistry calculations.39,40 All results presented in this work were calculated in the SMD solvation model41 with water as solvent. Basis set of def2-SV(P)42,43 was employed for geometry optimization with the PBE0-D3(BJ)44,45 functional method. The structure analyses were performed via the Multiwfn 3.8(dev) code.46 The molecular structure and isosurface maps were rendered by means of Visual Molecular Dynamics (VMD) software47 based on the files exported by Multiwfn. The metal surface orientation was (111) facet.
3. Results and discussion
3.1. Structural characterization of Cu/Ni–P/Au coating
3.1.1. Macroscopic and microscopic morphologies of the Au layers
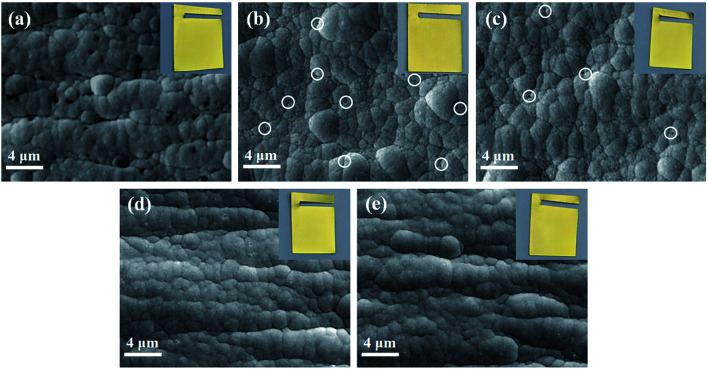
Five concentrations (0, 2.5, 5.0, 7.5, and 10 g L−1) of NaH2PO2 were chosen to be added into the plating bath for gold deposition. Fig. 1 shows the SEM morphologies and macroscopic appearances of the obtained Au layers. In the absence and the presence of NaH2PO2, the appearances of the deposited gold were yellow, and there was no obvious difference. SEM images showed that the deposited Au layers consisted of nodules about 1–2 μm in diameters, and different concentrations of NaH2PO2 had no significant effect on nodule size. This structure was consistent with that typically observed for Au layer deposited by electroless method.32,36,48 Through further observation, the microscopic difference of the Au layers deposited with different concentrations of NaH2PO2 can be found. As shown in Fig. 1(a), many micropores appeared in the Au layer deposited without NaH2PO2, and their sizes were about 0.15–0.4 μm. These micropores may be the reaction channels left by the intense attack of Au3+ to the Ni–P layer. The micropores will also become the channels for the penetration of corrosive medium, which are unfavorable to the corrosion resistance of coatings.49 For adding the concentration of 2.5 g L−1 NaH2PO2, the numbers and sizes (about 0.08 μm) of micropores decreased significantly. With the increase of the added concentration of NaH2PO2, the appearances of the Au layers developed further better. As shown in Fig. 1(d), the micropores on the Au layer were almost invisible. Thus it can be concluded that the addition of NaH2PO2 is beneficial to obtain a dense Au layer.
Fig. 1. SEM images of the Au layers deposited from cyanide-free baths containing different concentrations of NaH2PO2: (a) 0 g L−1, (b) 2.5 g L−1, (c) 5.0 g L−1, (d) 7.5 g L−1, and (e) 10 g L−1. The inset images are the macroscopic appearances.
3.1.2. Microscopic morphologies of the Ni–P layers after stripping Au
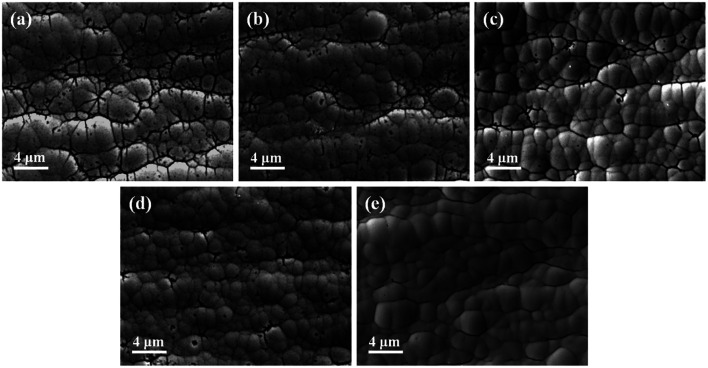
Black pad is one of the most concerned problems in ENIG process. Even in the cyanide system, it is hard to avoid the black pad. In order to assess the extent of the black pad, it is usual to observe the microscopic morphologies of Ni–P layer after stripping Au. Fig. 2 shows the SEM images of the Ni–P layers after stripping the Au layers prepared with different concentrations of NaH2PO2. It is obvious that the Ni–P layers were also a nodular structure. As we have mentioned in the introduction, serious nickel corrosion is inevitable if the Au layer deposits in the form of immersion, and this is confirmed as shown in Fig. 2(a). Extensive fissures between the nodules and a few pitting corrosion were clearly observed in Fig. 2(a), meaning that the Ni–P layer was seriously damaged.50 Similar to the micropores in the Au layer, these fissures and pitting may also become channels for corrosive media. The P content of Ni–P layer is the main factor controlling its corrosion resistance. However, the distribution of P in the plane and depth directions is usually uneven, especially at nodule boundaries, where the P content is lower, causing Ni–P layer to be preferentially corroded by Au3+.51–53 Therefore, it can be seen that corrosion mainly occurred at the boundaries. After adding NaH2PO2 into the bath, the corrosion degree was mitigated, which was in line with our expectations. In Fig. 2(d), it can be seen that the length of the fissures had become partial and short, while in Fig. 2(e), the fissures could hardly be seen, which proves the essential role of NaH2PO2 in Au(iii) based cyanide-free electroless gold plating bath. The mechanism of nickel corrosion has rarely been studied, and some researchers believed that it was related to the formation of galvanic cells in areas with different P content in Ni–P layer.54 Regardless of the specific mechanism, the direct cause of nickel corrosion is the displacement reaction between gold ions and nickel atoms. The addition of NaH2PO2 could replace the role of nickel atoms and donate electrons to Au3+; therefore the black pad phenomenon was reduced. Fig. 2 reveals that as the concentration of NaH2PO2 increased, this substitution effect become more pronounced.
Fig. 2. SEM images of the Ni–P layers after stripping the Au layer prepared from cyanide-free baths containing different concentrations of NaH2PO2: (a) 0 g L−1, (b) 2.5 g L−1, (c) 5.0 g L−1, (d) 7.5 g L−1, and (e) 10 g L−1.
3.1.3. Cross-sectional morphologies of the Cu/Ni–P/Au coatings
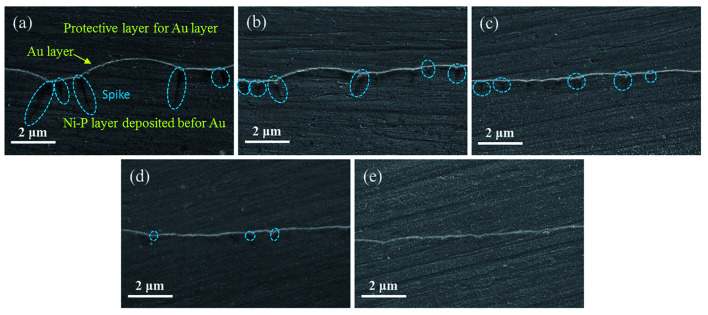
Cross-sectional SEM analyses of the Cu/Ni–P/Au coatings are shown in Fig. 3. It can be seen from Fig. 3(a) that the spikes penetrated into the Ni–P layer with a depth of about 0.62–2.19 μm, which was a conclusive evidence of the black pad. At the same time, the Ni–P layer was deformed and become a bulging shape due to the attack of Au3+, which was also common in black pad.31,50 In the presence of NaH2PO2, the depths of the spikes were reduced. As shown in Fig. 3(b–d), the depths of the spikes were 1.0, 0.5, and 0.2 μm, respectively, corresponding to the NaH2PO2 concentrations of 2.5, 5.0, and 7.5 g L−1. 0.2 μm spikes were generally acceptable in actual application. With adding the 10 g L−1 NaH2PO2, it is worth noting that there was no spike observed in Fig. 3(e) and the Au layer was relatively flat. The cross-sectional morphologies of the coatings also indicate that adding NaH2PO2 as a reducing agent into the Au(iii)–DMH based plating bath is beneficial to inhibit the occurrence of black pad.
Fig. 3. Cross-sectional SEM images of the Cu/Ni–P/Au coatings deposited from cyanide-free baths containing different concentrations of NaH2PO2: (a) 0 g L−1, (b) 2.5 g L−1, (c) 5.0 g L−1, (d) 7.5 g L−1, and (e) 10 g L−1.
3.1.4. Crystal structures of the Cu/Ni–P/Au coatings
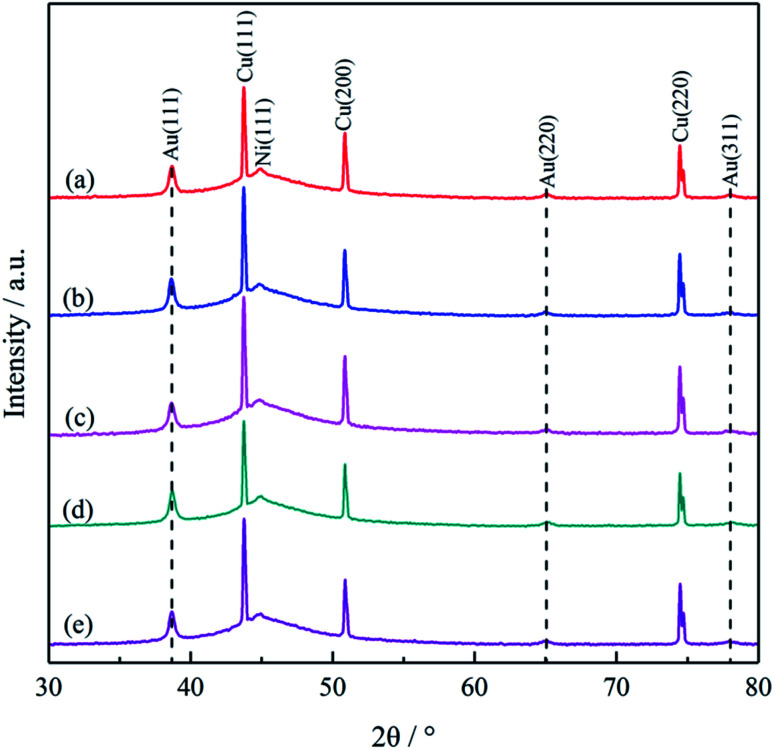
The crystal structures of the Cu/Ni–P/Au coatings obtained with different concentrations of NaH2PO2 were examined via XRD. Fig. 4 displays the overlaid diffractions of the coatings. It can be seen that the crystal structure and composition in different coatings were agreed well with others reports about electroless gold plating.48,55,56 Copper peaks were present at 2θ = 43.7°, 50.8°, and 74.4° due to the copper substrate, and the very broad peaks at 44.7° were ascribed to the (111) of amorphous Ni–P alloy.57 The Au (111), Au (220), and Au (300) diffraction peaks were detected at 38.6°, 65.1°, and 78.0°, respectively, and the Au (111) was the preferred orientation. The XRD patterns of the gold peaks of five kinds of coatings were similar, indicating that the addition of NaH2PO2 did not affect the crystal structure of gold regardless of the NaH2PO2 concentration. In the electroless nickel plating process using NaH2PO2 as the reducing agent, the deposited nickel layer is a nickel–phosphorus alloy instead of pure nickel. The P element is derived from NaH2PO2, and its content in Ni–P layer is positively correlated with the concentration of NaH2PO2.53 The co-deposition of P in the crystal lattice of the nickel layer leads to structure distortion, disrupting of periodicity, and hence formation of a crystalline coating.58,59 Crystalline, mixed amorphous crystalline, and amorphous structures of the Ni–P layers were different for low (1–5 wt%), medium (5–9 wt%), and high (>9 wt%) phosphorus content, respectively.53 In this work, NaH2PO2 was also adopted for electroless gold plating, so it is inevitable to be confused about the question for whether P element being co-deposited? According to the results from Fig. 4 that the diffraction peaks of the Au(111) did not broaden significantly, we can speculate preliminarily that there was no P element in the Au layers, or the P content was so low that it was not enough to create an arresting change in the crystal structures. The exact P content requires further analysis.
Fig. 4. XRD patterns of Cu/Ni–P/Au coatings deposited from cyanide-free baths containing different concentrations of NaH2PO2: (a) 0 g L−1, (b) 2.5 g L−1, (c) 5.0 g L−1, (d) 7.5 g L−1, and (e) 10 g L−1.
3.1.5. Elemental composition of the Au layers
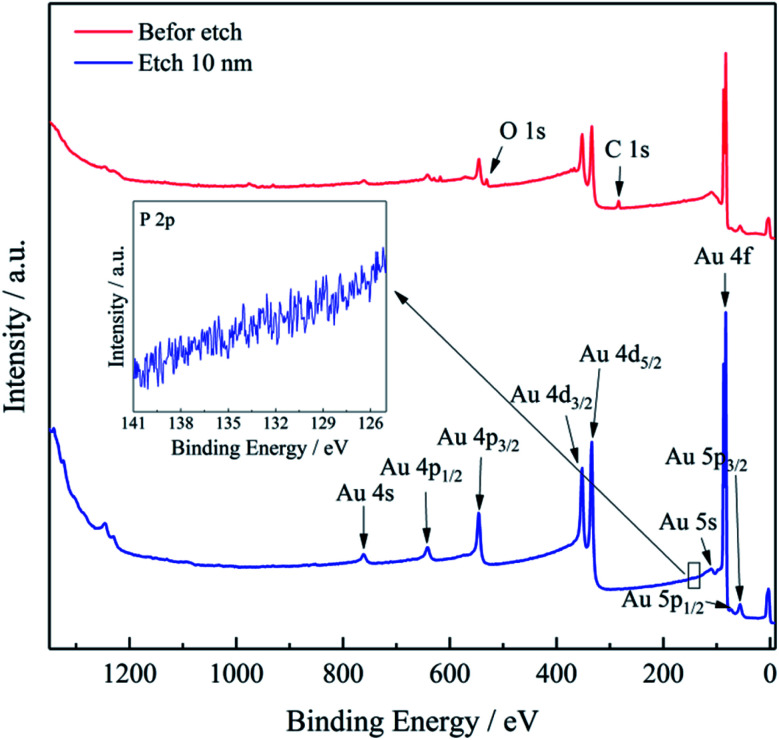
XPS as a surface analysis technology was used to confirm the elemental composition of the Au layer. Since the detection depth in XPS is less than 10 nm, the P element in the Ni–P layer will not be monitored, which is very suitable for studying the elements in the Au layer. Fig. 5 shows the full XPS spectrum of the Au layer (0.09 μm) before and after etching 10 nm. As the Au layer was mainly composed of Au, the Au peaks were very obvious. Before etching, polluting elements C and O were detected, probably from the atmospheric environment, as they disappeared after etching. The inset image shows the high-resolution XPS spectrum of P 2p region, and no peak was observed. The XPS analysis indicated that the Au layer did not contain P element, and the Au layer was pure gold.
Fig. 5. Full XPS spectrum of the Au layer before and after etching 10 nm. The inset image is the high-resolution XPS spectrum of P 2p region.
The valence state of P in NaH2PO2 is +1, therefore, it may be accompanied by an oxidation reaction (+1 → 0) when being oxidized (+1 → +3 or +1 → +5), but it is worth noting that it is not inevitable. For example, in the treatment of electroless nickel plating wastewater containing NaH2PO2, hypophosphite was oxidized to phosphate for recovery, and no phosphorus (0 valence state) was detected in the precipitates.60 In the field of metal deposition, the necessary condition for the formation of alloys is that the electrode potentials of the co-deposited elements are close according to the co-deposited theory. Reduction potentials for Ni2+/Ni (E = −0.594 V vs. NHE) and H2PO2−/P (E = −0.714 V vs. NHE) are near relatively facilitating their codeposition.53,61,62 However, the situation of Au3+ is quite different from that of Ni2+. The reduction potential for Au(DMH)4−/Au (E = −0.276 V vs. NHE) is much higher than that of H2PO2−/P, so it is difficult to co-deposit Au with P to form alloy in principle.28 Since the electrode potential of Au(DMH)4−/Au is higher than that of H2PO2−/P, Au deposits preferentially at first. Therefore, the Au layer was pure gold with no containing P element, and the XPS results eliminated the confusion about whether P co-deposited with Au.
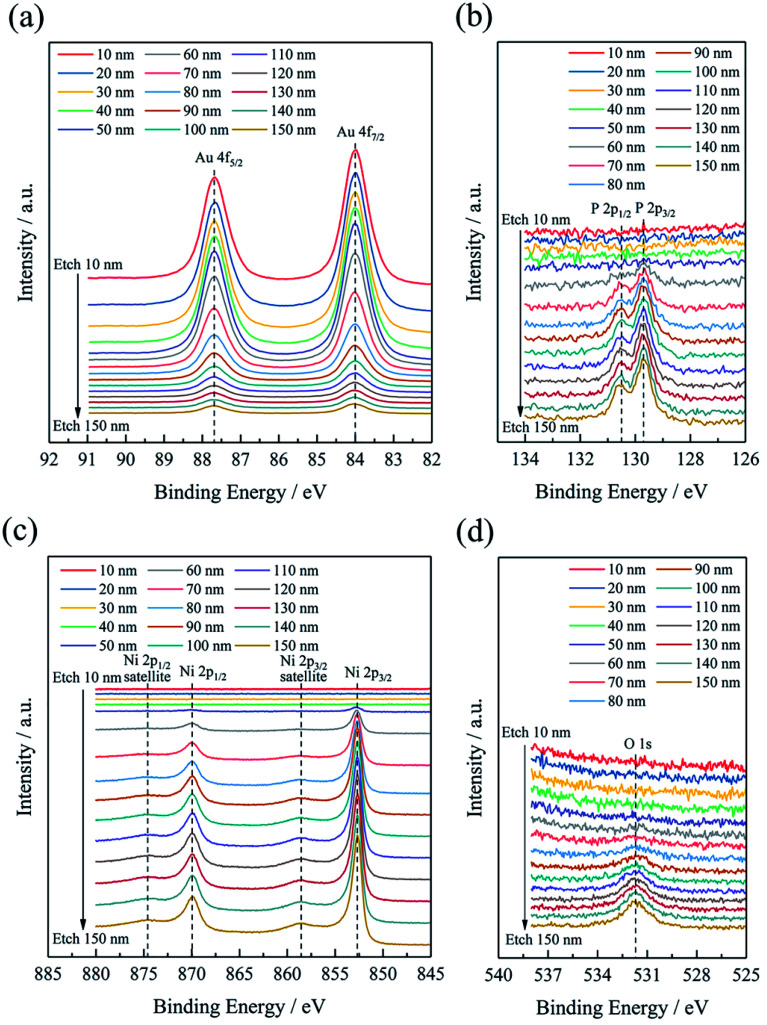
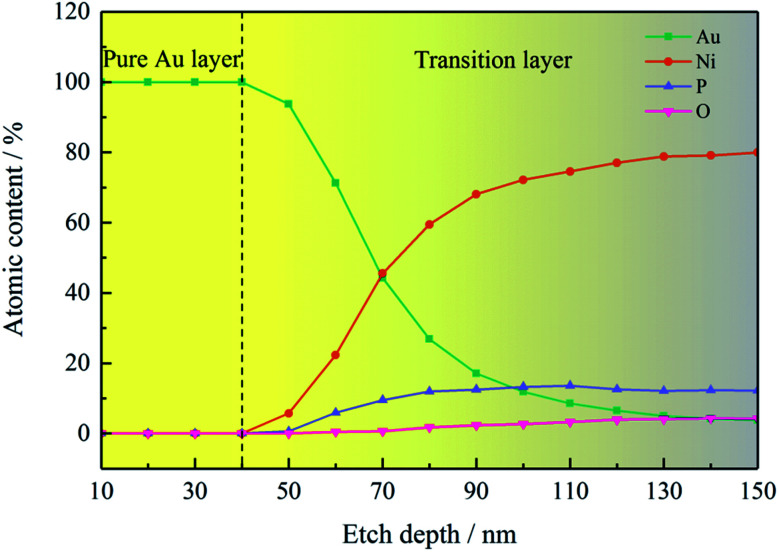
XPS depth profiles (see Fig. 6) provide more abundant element distribution information of the coating, which is favorable to understand the process of deposition mechanism. When the etching depth was less than 50 nm, there were only Au 4f peaks, but no Ni 2p, P 2p, or O 1s peaks was observed, which also indicated that the Au layer (∼50 nm) was pure gold. After etching depth above 50 nm, an interesting result was detected that the intensities of Au 4f peaks gradually decreased, while the intensities of Ni 2p, P 2p, and O 1s peaks increased. And it is obvious that there appeared the defined region where the four elements coexisted after etching 50 nm. With the increase of etching depth, the Au content decreased while the other three elements increased. High-resolution Ni 2p XPS spectra exhibited four deconvoluted peaks (Fig. S3† (ESI)), corresponding to Ni, NiO, and Ni–P, in agreement with the compositions of Ni–P layer.15 The variation of element content with different etching depth is shown in Fig. 7, and the detailed values are listed in Table S2† (ESI). The O element was possibly introduced into the Ni–P layer from the washing step after the electroless nickel plating. Therefore, it can be seen from Fig. 7 that O element appeared at the same time as the Ni and P elements, reflecting the composition of the oxidized Ni–P layer. After etching 150 nm, there was still 3.81 at% Au coexisting with the Ni–P layer. It can be found that although the deposited Au layer was pure gold, the gold in the early stage seemed to integrate with the Ni–P layer. The thickness of this special area cannot be underestimated, which is thicker than the pure gold layer in the strict sense. The formation of this special area is closely related to the nodular structure of the Ni–P layer. If the surface of the Ni–P layer was completely flat, gold particles should uniformly deposit on it, as shown in Fig. 8(a). At this time, XPS depth profiles should show that the Au content changes from 100% to 0%. However, the surface of the Ni–P layer was not as ideal as we imagined in fact. As shown in the AFM image of the Ni–P layer and the sectional analysis of the AFM image (Fig. S4† (ESI)), it looked like mountains with peaks and saddles. Gold will deposit on “saddles”, gradually filling the spaces between the two “mountains”, forming an inlaid structure with the Ni–P layer, as shown in the schematic diagram of Fig. 8(b). When etching to the Ni–P layer, the four elements of Au, Ni, P, and O will be detected at the same time. This special area can be considered as the transition layer between pure Ni–P layer and pure Au layer. The formation of the inlaid structure is very important to ensure the close combination of the two layers with different compositions. As mentioned in Section 2, the copper sheets needed to be soaked in a mixed solution of sodium thiosulfate and sulfuric acid for 1 minute before electroless nickel plating. As we all know, the purpose of this step is to form a concave–convex structure on the copper surface, then form an inlaid structure with the Ni–P layer to increase their contact area and improve their adhesion. It is foreseeable that the adhesion between the Au layer and the Ni–P layer will be qualified. Adhesion tests will be mentioned below.
Fig. 6. High-resolution XPS spectra of (a) Au 4f, (b) Ni 2p, (c) P 2p, and (d) O 1s with different etch depth.
Fig. 7. Elemental contents of Au, Ni, P, and O obtained from depth profiles.
Fig. 8. Schematic diagrams of deposition process of gold particles in the early stage on (a) ideal Ni–P layer and (b) actual Ni–P layer.
3.2. Performances of the Cu/Ni–P/Au coatings
3.2.1. Corrosion tests
The atmospheric corrosion and oxidation of electronic circuits will lead to premature failure of electronic devices and reduce the service life of electronic products. In order to increase the corrosion resistance, gold with stable chemical properties is selected as the protective layer, while the nickel layer acts as a barrier between the Cu substrate and the Au layer to prevent atomic diffusion.3 Of course, the Ni–P layer also has a protective effect on the Cu substrate.
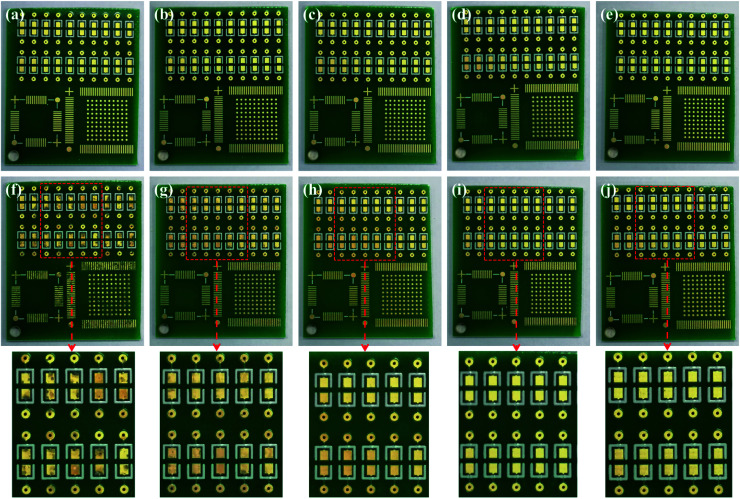
The results of salt spray tests on the printed circuit boards are shown in Fig. 9, and Fig. 9(a–e) shows the appearances before the salt spray test. Similar to Fig. 1, there was no difference in the macroscopic appearances of the Au layers. Whether it was a large pad (Φ 1.47 mm) or a small one (Φ 0.57 mm), or a slender circuit (M = 0.25 mm), the yellow Au layer was successfully deposited on the Ni–P layer without omission. After 48 hours of salt spray corrosion, the appearances of the printed circuit boards are shown in Fig. 9(f–j). Compared with Fig. 9(a and f), a large number of brown stains appeared on the surface of the Au layer deposited from the bath without containing NaH2PO2, indicating that the coating has been corroded very seriously. Although gold is an inert metal, the inevitable gaps between the gold particles make it easy for the corrosive medium (Cl−) to penetrate into the substrate. At the initial stage, the Ni–P layer was corroded due to the porous Au layer (Fig. 1(a)). With the corrosion of Cl−, galvanic corrosion started where Au acted as the cathode and Ni as the anode.50,63 Then Cl− continued to penetrate into the Cu substrate through the wide boundary of the Ni–P layer (Fig. 2(a)), and Ni was accelerated to be corroded through galvanic coupling with Cu. Meanwhile, Cu used the defects of the Ni–P layer and Au layer to diffuse to the Au-top surface, and it was eventually oxidized there under the acceleration of a galvanic coupling with Au.2 Murugan's research work63 showed that the brown corrosion product was consisted of a thick base of Cu2O covered by a film of CuO (major) and Cu2(OH)3Cl (minor) with XPS analysis. It can be seen that the pores and gaps of the coating are closely related to corrosion resistance. It is noteworthy that the corrosion resistance of the coating enhanced remarkably after adding 2.5 g L−1 NaH2PO2 into the bath (see Fig. 9(g)). And with the further increase of concentration of added NaH2PO2, no brown stains could be observed clearly on the surface of boards, as shown in Fig. 9(h–j). The optical microscope images also show that the addition of NaH2PO2 is beneficial to the salt spray corrosion resistance of the coatings, as shown in Fig. S5† (ESI). Combined with the SEM images in Fig. 1–3, it can be concluded that the obtained dense Ni–P/Au coatings deposited after adding NaH2PO2 retard the corrosion of the printed circuit boards.
Fig. 9. Appearances of printed circuit board before (a–e) and after (f–j) salt spray tests. The Au layers were deposited from cyanide-free baths containing different concentrations of NaH2PO2: (a and f) 0 g L−1, (b and g) 2.5 g L−1, (c and h) 5.0 g L−1, (d and i) 7.5 g L−1, and (e and j) 10 g L−1.
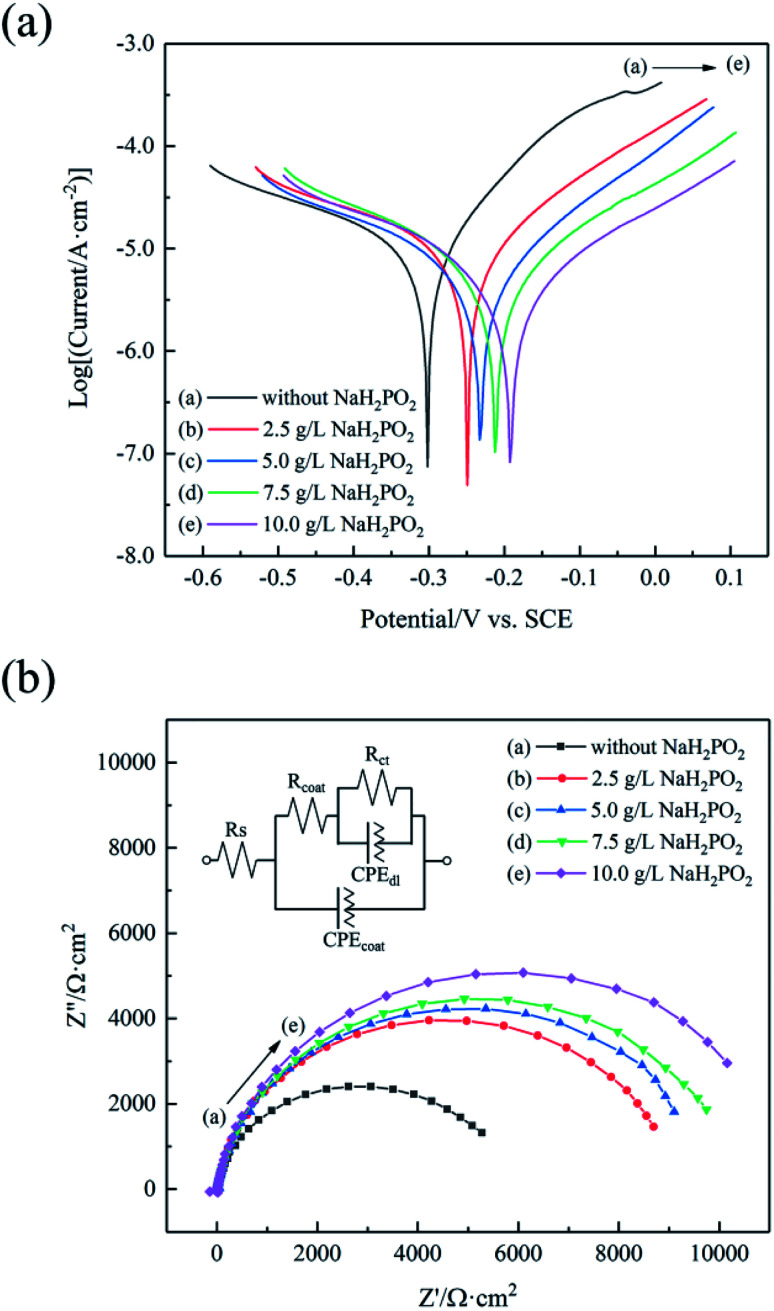
The PDP curves of the coatings deposited in the baths containing different concentrations of NaH2PO2 are shown in Fig. 10(a), and the corresponding parameters are summarized in Table 3. Generally speaking, corrosion potential (Ecorr) is a thermodynamic parameter indicating the corrosion trend, and corrosion current density (icorr) is a kinetic parameter indicating the corrosion rate.64 A high Ecorr means that corrosion reaction is difficult to occur, and a low icorr means that the corrosion rate is low. In the absence of NaH2PO2, the coating exhibited a low Ecorr (−0.302 V) with a high icorr (11.5 μA cm−2). As the concentration of added NaH2PO2 gradually increased from 2.5 g L−1 to 10 g L−1, the Ecorr of four coatings increased and icorr decreased slightly. When the added NaH2PO2 concentration was 10 g L−1, the obtained coating exhibited the highest Ecorr (−0.191 V) and the lowest icorr (4.6 μA cm−2). The corrosion resistance in our investigation is better than the Cu/Ni–P/Au coating deposited from an Au(i)–sulfite–thiosulfate bath reported in the literature55 (Ecorr = −0.278 V and icorr = 5.8 μA cm−2). We speculate that this difference may stem from denser Au and Ni–P layers in our work. Unfortunately, the morphology of the Ni–P layer after stripping off gold was not shown in the literature.55 In addition, the comparison of the porosity of different Ni–P/Au coatings was listed in Table 3. The PDP curve for copper is shown in Fig. S6† (ESI), and it is used to obtain electrochemical parameters (substrate) for porosity calculation. It can be seen from Fig. 1 and 2 that the porosity is more related to the fissure of Ni–P layer than the micropore of Au layer, because there are more defects (fissure and pitting) in Ni–P layer. It is clear that the porosity of the coatings decreased with the increase of the concentration of added NaH2PO2. The coating obtained from the bath with 10 g L−1 NaH2PO2 had the lowest porosity (0.84%), which was significantly lower than that without NaH2PO2 (20.53%), indicating that the addition of NaH2PO2 not only makes Au layer more dense, but also reduces the defects of Ni–P layer.
Fig. 10. (a) PDP curves and (b) Nyquist curves of the coatings in a 3.5 wt% NaCl solution. The inset image in (b) is the equivalent circuit.
Electrochemical parameters for PDP tests and EIS tests in a 3.5 wt% NaCl solution.
| Sample | Concentration of NaH2PO2 (g L−1) | E corr (V) | i corr (μA cm−2) | β a (V dec−1) | β c (V dec−1) | P (%) | R ct (kΩ cm−2) |
|---|---|---|---|---|---|---|---|
| Cu substrate | — | −0.329 | 26.6 | 0.120 | 0.403 | — | — |
| Cu/Ni–P/Au coating | 0 | −0.302 | 11.5 | 0.163 | 0.407 | 20.53 | 5.83 |
| 2.5 | −0.248 | 8.0 | 0.344 | 0.178 | 5.05 | 9.01 | |
| 5.0 | −0.231 | 5.9 | 0.336 | 0.192 | 2.58 | 9.99 | |
| 7.5 | −0.217 | 5.5 | 0.303 | 0.237 | 1.70 | 10.33 | |
| 10.0 | −0.191 | 4.6 | 0.295 | 0.251 | 0.84 | 11.31 |
Fig. 10(b) displays the Nyquist curves and corresponding equivalent circuit of the coatings in a 3.5 wt% NaCl solution. The Nyquist plots of all coatings show imperfect semicircles (incomplete capacitor arcs), indicating the existence of a single low-frequency capacitor arc in the frequency range studied.65 In general, the larger the diameter of the semicircle, the better the corrosion resistance.66 From the Nyquist curves, it can be preliminarily judged that after NaH2PO2 was added, the corrosion resistance of the coating was improved, as the diameter increased successively. For the qualitative interpretation of the Nyquist curves, an equivalent circuit was selected to perform curves fitting. Rs presents the solution resistance, Rcoat is the coating resistance, and Rct is the charge transfer resistance. CPEcoat is a constant phase element, which represents the capacitance of the coating. CPEdl is the double-layer capacitance.67 The corrosion resistance of a coating is positively related to Rct. Bode phase plots (Fig. S7† (ESI)) give two peaks at investigated frequency range which indicate the presence of two time constants. The one in the high-frequency can be represented by Rcoat and CPEcoat. The one in the lower-frequency range is attributed to the corrosion reactions, which are elucidated by the Rct and CPEdl.68 The values of Rct are listed in Table 3, and other fitting parameters are summarized in Table S3† (ESI). The results in Table 3 show that as the concentration of NaH2PO2 increased, Rct increased prominently from 5.83 kΩ cm−2 to 11.31 kΩ cm−2. The results obtained from the EIS tests are in accordance with those from the salt spray tests and the PDP tests. The corrosion resistance of the Cu/Ni–P/Au coating can be improved significantly with adding NaH2PO2 as the reduction agent in Au(iii)–DMH based cyanide-free plating bath.
3.2.2. Adhesion tests
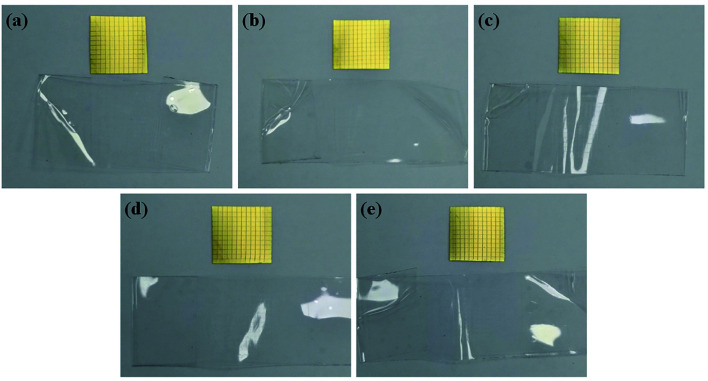
Adhesion is another important performance for coatings. A coating with poor adhesion property will fall off easily and lose the significance of protection. Fig. 11 displays the appearances of the Au layers and the tapes after adhesion tests. As shown in Fig. 11, there were no signs of detachment on the Cu/Ni–P/Au coatings regardless of the presence of NaH2PO2 after extreme temperature destruction and tape sticking. The result shows that the adhesion of the coating was qualified and could be classified as 5B level according to the standard ASTM D3359. The effective adhesion performance of the Au layer is related to the inlaid structure formed in the interface between the Au layer and the Ni–P layer shown in XPS depth profiles.
Fig. 11. Appearances of Au layers and tape after adhesion tests. The Au layers were deposited from cyanide-free baths containing different concentrations of NaH2PO2: (a) 0 g L−1, (b) 2.5 g L−1, (c) 5.0 g L−1, (d) 7.5 g L−1, and (e) 10 g L−1.
3.3. Characterization of the stability of gold plating bath
The unsatisfactory bath stability both for Au(i) and Au(iii)-reductant based cyanide-free electroless gold plating remains challenging in electroless deposition. With the addition of NaH2PO2, the corrosion resistance of the coatings was improved, but the baths become metastable systems as the oxidation–reduction reaction between Au3+ and H2PO2− might occur in the solution. If the reaction occurs, the produced gold nanoparticles which present different colors with different particle sizes will result in the decomposition of the gold plating bath and the color of the bath will change.69 Therefore, how to inhibit the oxidation–reduction reaction between Au3+ and H2PO2− in the solution is crucial in the presence of H2PO2−. In this work, with adjusting the contents ratio of hypophosphite and complexing agent DMH as well as the plating process parameter, the good plating bath whose composition and operation condition are listed in Table 2 can retain good stability.
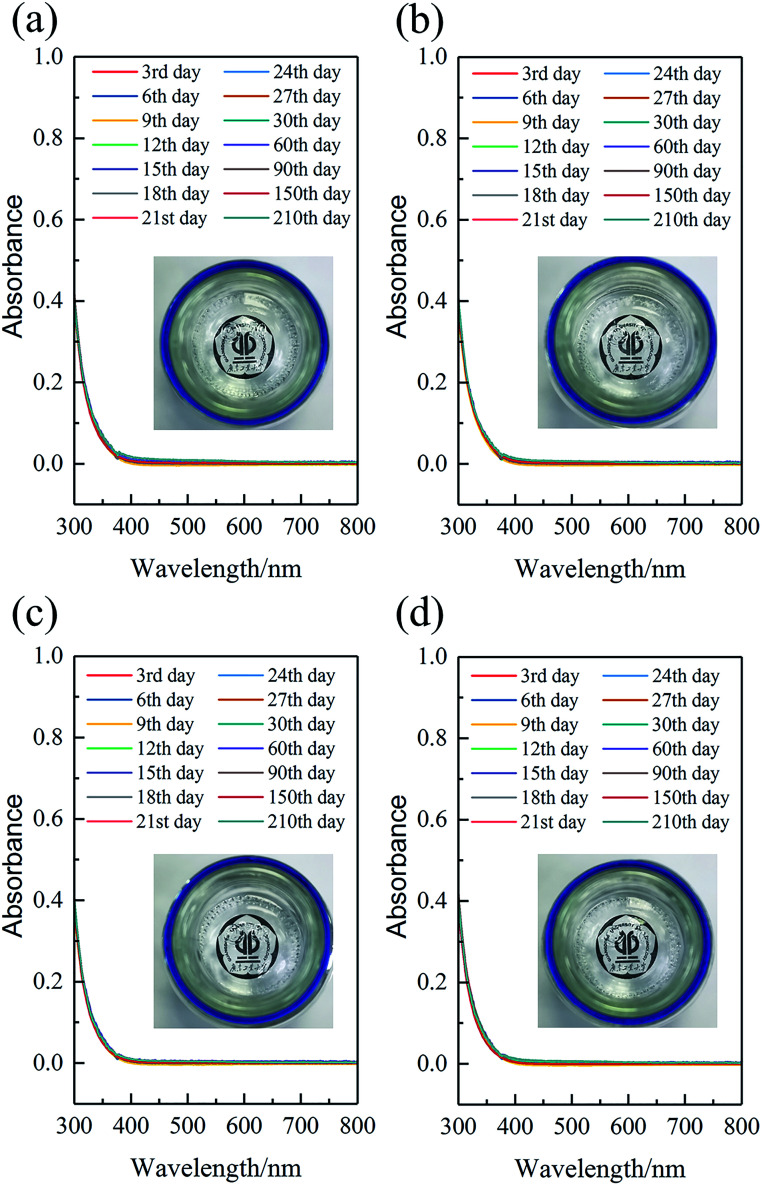
In the NaH2PO4–Na2HPO4 buffer system, after AuCl3 coordinated with sufficient DMH, the prepared gold plating baths were colorless and transparent with the added NaH2PO2 concentration no more than 10 g L−1. Furthermore, the baths remained colorless and transparent during storage for 210 days, as shown in inset images of Fig. 12. Also, the UV-vis absorption spectra (Fig. 12) of the plating baths were detected to access the bath stability. The observed absorption value of the baths in the visible region (about 400–800 nm) almost was unchanged and remained at constant (changed absorbance was less than 0.01). No new absorption peak appeared in the visible region, indicating that no gold nanoparticles formed during storage for 210 days.
Fig. 12. Evolution of the UV-vis absorption curves of the cyanide-free bath containing different concentrations of NaH2PO2 over 210 days: (a) 2.5 g L−1, (b) 5.0 g L−1, (c) 7.5 g L−1, and (d) 10 g L−1. The inset images are the top view of the baths after 210 days.
In our previous work,18 we reported the stability of Au(i)–DMH based immersion gold plating bath, that precipitated gold particles could be observed obviously after storage for 200 days at room temperature. However, in this work, the Au(iii)–DMH based cyanide-free plating bath was more stable than Au(i)–DMH immersion bath, even adding NaH2PO2 as the reduction agent. The bath stability of Au(iii)–DMH is inseparable from the stable nature of Au3+ ion itself which is not easy to disproportionate, and also from the stable nature of Au(iii)–DMH complex combined with the strong coordinated bonds. Of course, the contents of hypophosphite, plating process parameters, and the preparation method of baths are all related to bath stability. It is important that NaH2PO2 is added in portions to the bath finally.
3.4. Deposition process of the gold layer
In order to further learn about the deposition process, the produced concentration of Ni2+ ions at different reaction time in the two baths (without NaH2PO2 and with adding 10 g L−1 NaH2PO2) were detected by AAS, as shown in Fig. S8† (ESI). During the electroless gold plating process, the replacement reaction between Ni and Au(iii)–DMH complex was certain to occur, therefore the concentration of Ni2+ both in the two baths increased with the increase of the reaction time. However, after adding NaH2PO2 into the bath, at the same deposition time, the concentration of produced Ni2+ decreased accordingly, indicating that NaH2PO2 as a reduction agent participated in the electroless deposition reaction. And the replacement reaction between Ni and Au(iii)–DMH complex was replaced partly with the reduction reaction between H2PO2− and Au(iii)–DMH complex. Combining Table S1† (ESI) and Fig. S8† (ESI), we calculated that the concentration of Ni2+ produced in the Au(iii) based bath containing 10 g L−1 NaH2PO2 was about two-seventh of that of the Au(iii) based immersion plating bath when depositing 0.05 μm gold layer, which was also lower than that of the Au(i) based immersion plating bath theoretically according to eqn (1) and (2).
As mentioned earlier, the replacement reaction of gold ions and nickel atoms during ENIG process leads to the unavoidable corrosive behavior of Ni–P layer, and the black pad phenomenon will occur if the corrosion of gold ions is serious. Though adding NaH2PO2 into the bath as a reduction agent, NaH2PO2 replaced nickel atom partially to provide electrons and participated in deposition reaction, and the corrosive resistance of Cu/Ni–P/Au coating enhanced as expected. In addition, the enriching of NaH2PO2 could also increase the deposition rate. The time required to deposit the same thickness of Au layers is listed in Table S1† (ESI). The reduced deposition time will be beneficial for retarding the corrosion to Ni–P layer. In a word, NaH2PO2 as a reduction agent mitigates the attack of Au3+ on Ni–P layer by reducing the reaction time and retarding the occurrence of the replacement reaction.
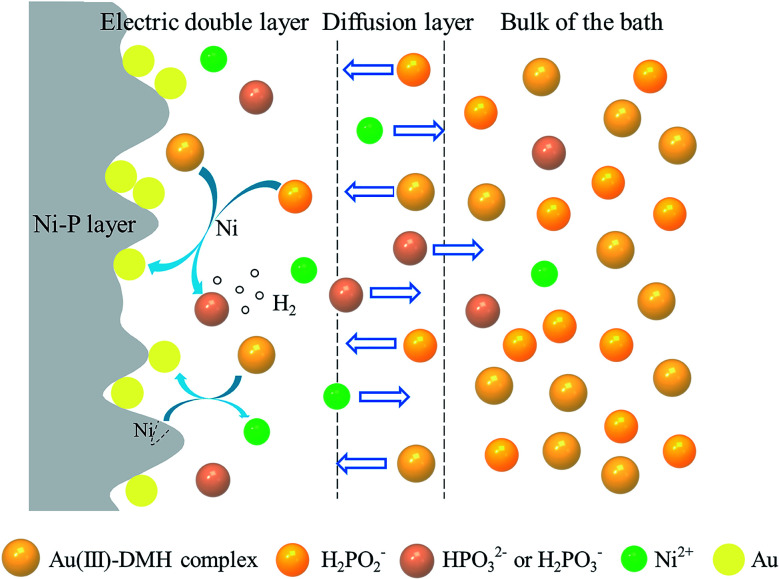
Based on the related experiments and analysis, we proposed the gold deposition process, as shown in Fig. 13. In the bulk of the bath, the electrode potential of the complex formed by the coordination of DMH and Au3+ is lower than that of free Au3+ ions, and the reducing ability of H2PO2− is not enough to reduce the complex, so the plating bath can remain stable. The concentrations of Au(iii)–DMH complex and H2PO2− in the bulk of the bath are higher than that on the Ni–P surface, so they will spontaneously diffuse to the Ni–P surface and adsorb on it to form an electric double layer. After H2PO2− adsorbs on the Ni–P surface, it is catalyzed by Ni, and the reduction ability is significantly improved, so the deposition reaction of gold occurs, which reflects the characteristics of substrate catalysis. Combined with XPS analysis, atomic hydrogen mechanism30,51 of H2PO2− oxidation in nickel plating process, as well as our observation of gas (H2 (ref. 70)) generation, we supposed the reaction equations of Au3+ and H2PO2−:
| H2PO2− + H2O → H+ + HPO3− + 2Hads | 3 |
| Au3+ + Hads → Au + 3H+ | 4 |
| 2Hads → H2 | 5 |
where Hads is the hydrogen atom in the adsorbed state. Electrochemical mechanism30 is also a widely accepted oxidation mechanism of hypophosphite. The reaction equations of Au3+ and H2PO2− proposed by this mechanism are as follows:
| H2PO2− + H2O → 2H+ + H2PO32− + 2e− | 6 |
| Au3+ + 3e− → Au | 7 |
| 2H+ + 2e−→ H2 | 8 |
Fig. 13. Reaction diagrams on Ni–P layer in the electroless gold plating bath.
Even in the field of electroless nickel plating, the reaction mechanism of hypophosphite has not yet reached a consensus. For electroless gold plating system, the reaction process of hypophosphite still needs to be verified by subsequent researchers.
Of course, the replacement reaction between Au(iii)–DMH complex and Ni is also inevitable, which causes corrosion for Ni–P layer. However, because the reduction reaction replaces the partial replacement reaction, the degree of corrosion for Ni–P layer has been greatly reduced, thus improving the corrosion resistance of the coating. Also combined with element distribution of the coating based on XPS depth profiles, we deduce that the reduced gold atom preferentially deposited on “saddles” spaces between the two “mountains” on the Ni–P layer, as shown in the schematic diagram of Fig. 8(b) and S4† (ESI). The main products of the reduction reaction and the displacement reaction, including HPO32− (or H2PO3−) and Ni2+, have a higher concentration on the Ni–P surface than in the bulk of the bath, so they also spontaneously diffuse into the bulk of the bath. Whereas H2 floats to the surface of the bath due to buoyancy.
3.5. Quantum chemical calculation
The deposition reaction taking place preferentially on the metal surface is closely related to the catalytic properties of the surface. Profiting from the catalysis by Ni, H2PO2− can play a reducing effect in the gold deposition process in this paper. This relationship between H2PO2− and Ni has been fully proven and studied in the field of nickel plating.30,71,72 In the gold deposition process, nickel is a kind of substrate, so the deposition process has the characteristics of substrate catalytic reduction.35 We are more concerned about whether there is autocatalytic reduction in addition to substrate catalysis, which can deepen our understanding of the reaction process.
In order to further understand the catalytic difference of gold for the reduction of H2PO2− compared with nickel at the molecular level, quantum chemical calculations were carried out. It is well known that Cu cannot catalyze the oxidation of H2PO2−,73 so the interaction between Cu and H2PO2− was also analyzed as a comparison to help further understand the interaction between Au and H2PO2−. The structures of metal clusters are shown in Fig. S9† (ESI). The structures of H2PO2− adsorbed on Au31 and Cu31 clusters and the structural parameters of H2PO2− are shown in Fig. S10† (ESI) and Table S4† (ESI), respectively. H2PO2− adsorbed on the clusters through O atom, and its structures on Au31 and Cu31 clusters were similar according to Fig. S10 (ESI) and Table S4† (ESI), meaning that the catalytic properties of Au for H2PO2− may resemble that of Cu. Onabuta et al.72 also reported that H2PO2− adsorbed on the copper surface via O atom by the first-principle study. Kunimoto et al.74 reported that H2PO2− adsorbed on Ni clusters relying on H atoms, while O atoms were far away. The significantly different structures of H2PO2−–Au and H2PO2−–Ni indicate that Au is destined to have different catalytic properties for H2PO2− from Ni.
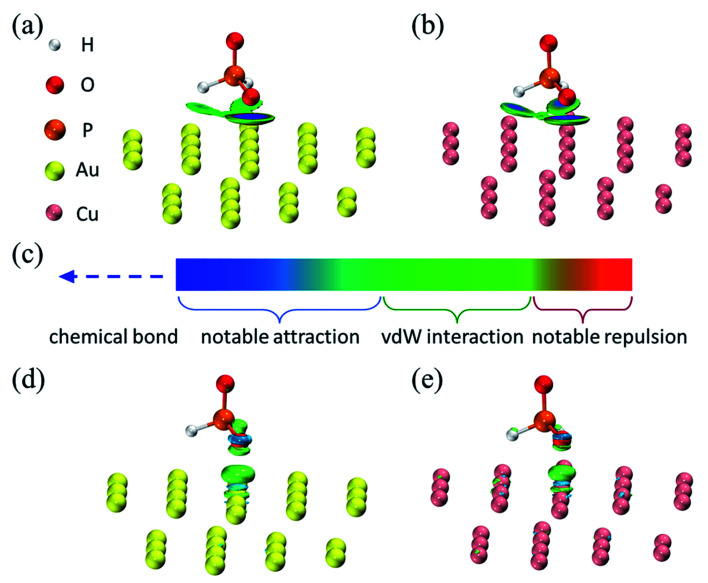
Through visual analysis methods, including Independent Gradient Model analysis based on Hirshfeld partition of molecular density (IGMH, 0.01 a. u.)75,76 and difference map of electron density (0.006 a. u.), the interaction between H2PO2− and Au, as well as Cu, can be visually displayed, as shown in Fig. 14. The interaction type can be determined by comparing the color of the color bar (Fig. 14(c)) with the color-filled isosurface. It can be seen that there was a very broad and flat isosurface sandwiched between the H2PO2− and metal surface, which clearly portrayed the major interaction region. The isosurfaces in Fig. 14(a and b) were similar. They looked like three green circular pies, corresponding to the van der Waals action. A blue area appeared in the center of the pie between O and Au atoms, indicating a slightly stronger attraction than the van der Waals action, but the intensity had not yet reached the strength of chemical bonds, as the isosurface was not only composed of pure blue. Therefore, H2PO2− adsorbed on the Au and Cu surfaces in the weak interaction. Furthermore, since the blue around the center of the isosurface corresponding to the O–Au interaction was lighter than that corresponding to the O–Cu interaction, it is expected that the H2PO2−–Au31 cluster interaction was weaker. The electron density difference map intuitively showed the change of the electron density after H2PO2− adsorbed on the metal surface, as shown in Fig. 14(d and e). The increase and decrease of electron density were represented by grass-green and sky-blue isosurfaces respectively, which also meant the strengthening and weakening of bonds respectively. It can be seen from Fig. 14(d and e) that the isosurface between O and Au atoms as well as Cu atoms were all grass-green, meaning that the electron density was reduced, which was not conducive to formate a chemical bond. IGMH analysis and electron density difference analysis revealed the nature of the interaction between H2PO2− and Au as well as Cu surfaces, that is, they relied on weak interaction to adsorb instead of chemical bonds. However, the stable adsorption of H2PO2− on the metal relying on the orbital interaction is the key to the high catalytic activity of the metal for H2PO2−.71,72 Quantum chemistry calculation results showed that the adsorption structures of H2PO2− on Au and Cu did not meet this requirement, meaning that there was no autocatalytic reduction in deposition process.
Fig. 14. Visual analyses for adsorption structures of hypophosphite on Au31 and Cu31 clusters: (a and b) IGMH analyses, (c) color bar for IGMH analysis, and (d and e) difference map of electron density.
4. Conclusion
In this work, a green, stable, and environmentally friendly cyanide-free gold plating bath is developed with adding hypophosphite as a reducing agent into the Au(iii)–DMH based plating bath. With the employ of NaH2PO2, the Au layer became denser, and the black pad phenomenon of the Ni–P layer was almost eliminated. However, the addition of NaH2PO2 did not change the crystal structure of the Au layer, and the preferred orientation was (111). XPS showed that P element was not introduced, so the Au layer was pure gold. XPS depth profiles suggested that there was a transition layer between the Au layer and the Ni–P layer, and the two layers were combined in an inlaid structure. This combination way allowed the coating to be firmly integrated even after 16 days of extreme temperature damage. When the concentration of NaH2PO2 is 10 g L−1, the appearance of the Au layer was still yellow after neutral salt spray corrosion for 48 hours. The PDP and EIS tests showed that the Ecorr was −0.191 V, the icorr was 11.5 μA cm−2, the porosity was 0.84%, and the Rct was 11.31 kΩ cm−2 at this concentration. Compared with the coating deposited without NaH2PO2, the corrosion resistance was significantly improved. The plating baths in this work had good stability and were still clear after 210 days. Atomic absorption spectrum showed that the addition of NaH2PO2 made part of the replacement reaction replaced by the reduction reaction. Profit from this, the structure and corrosion resistance of the coatings were better. Quantum chemistry calculations showed that hypophosphite adsorbed on Au surface in a weak interaction manner, and Au was inactive for the catalysis of hypophosphite. In general, this study has successfully demonstrated the great potential of new paths for the realization of cyanide-free electroless gold plating.
Conflicts of interest
There are no conflicts to declare.
Supplementary Material
Acknowledgments
We greatly acknowledge the financial support from the National Natural Science Foundation of China (Grant No. 22178071). We also thank GHTECH (China) for providing commercial plating baths.
Electronic supplementary information (ESI) available. See DOI: 10.1039/d1ra07952b
References
- Dimitrijević S. Rajčić-Vujasinović M. Trujić V. Int. J. Electrochem. Sci. 2013;8:6620–6646. [Google Scholar]
- Bahramian A. Eyraud M. Vacandio F. Knauth P. Microelectron. Eng. 2019;206:25–44. doi: 10.1016/j.mee.2018.12.008. [DOI] [Google Scholar]
- Ming S. Pecht M. Natishan M. A. E. Microelectron. J. 1999;30:217–222. doi: 10.1016/S0026-2692(98)00109-8. [DOI] [Google Scholar]
- Bahramian A. Eyraud M. Maria S. Vacandio F. Djenizian T. Knauth P. Corros. Sci. 2019;149:75–86. doi: 10.1016/j.corsci.2018.12.026. [DOI] [Google Scholar]
- Murugan V. K. Jia Z. G. Syaranamual G. J. Gan C. L. Huang Y. Z. Chen Z. Microelectron. Reliab. 2016;60:84–92. doi: 10.1016/j.microrel.2016.02.014. [DOI] [Google Scholar]
- Osaka T. Misato T. Sato J. Akiya H. Homma T. Kato M. Okinaka Y. Yoshioka O. J. Electrochem. Soc. 2000;147:1059. doi: 10.1149/1.1393313. [DOI] [Google Scholar]
- Okinaka Y. Gold Bull. 2000;33:117–127. doi: 10.1007/BF03215489. [DOI] [Google Scholar]
- Kato M. Sato J. Otani H. Homma T. Okinaka Y. Osaka T. Yoshioka O. J. Electrochem. Soc. 2002;149:C164. doi: 10.1149/1.1448502. [DOI] [Google Scholar]
- Honma H. Kagaya Y. J. Electrochem. Soc. 1993;140:L135. doi: 10.1149/1.2220894. [DOI] [Google Scholar]
- Honma H. Hagiwara K. J. Electrochem. Soc. 1995;142:81. doi: 10.1149/1.2043948. [DOI] [Google Scholar]
- Okinaka Y. Hoshino M. Gold Bull. 1998;31:3–13. doi: 10.1007/BF03215469. [DOI] [Google Scholar]
- Osaka T. Kato M. Sato J. Yoshizawa K. Homma T. Okinaka Y. Yoshioka O. J. Electrochem. Soc. 2001;148:C659. doi: 10.1149/1.1399276. [DOI] [Google Scholar]
- Osaka T. Kodera A. Misato T. Homma T. Okinaka Y. Yoshioka O. J. Electrochem. Soc. 1997;144:3462. doi: 10.1149/1.1838033. [DOI] [Google Scholar]
- Green T. A. Roy S. J. Electrochem. Soc. 2006;153:C157. doi: 10.1149/1.2164724. [DOI] [Google Scholar]
- Li B. Li N. Luo G. Tian D. Surf. Coat. Technol. 2016;302:202–207. doi: 10.1016/j.surfcoat.2016.05.086. [DOI] [Google Scholar]
- De Monlevade E. F. Peng W. J. Electron. Mater. 2007;36:783–797. doi: 10.1007/s11664-006-0062-8. [DOI] [Google Scholar]
- Schlesinger M. and Paunovic M., Modern electroplating, John Wiley & Sons, 2011 [Google Scholar]
- Wu B. Huang J. M. Lv Z. M. Cui Z. Y. Hu G. H. Luo J. Y. Selim M. S. Hao Z. F. RSC Adv. 2020;10:9768–9776. doi: 10.1039/D0RA00925C. [DOI] [PMC free article] [PubMed] [Google Scholar]
- Jin L. Yang J. Q. Yang F. Z. Zhan D. P. Wu D. Y. Tian Z. Q. ACS Sustainable Chem. Eng. 2020;8:14274–14279. doi: 10.1021/acssuschemeng.0c04438. [DOI] [Google Scholar]
- Lewis G. Shaw III C. F. Inorg. Chem. 1986;25:58–62. doi: 10.1021/ic00221a016. [DOI] [Google Scholar]
- Luo G. Yuan G. H. Li N. RSC Adv. 2016;6:61341–61345. doi: 10.1039/C6RA10418E. [DOI] [Google Scholar]
- Ren X. F. An M. Z. RSC Adv. 2018;8:2667–2677. doi: 10.1039/C7RA13115A. [DOI] [PMC free article] [PubMed] [Google Scholar]
- Tu X. Q. Zhang Y. H. Wang D. An M. Z. Liu A. M. Zhang J. Q. Yang P. X. J. Electrochem. Soc. 2020;167:22506. doi: 10.1149/1945-7111/ab6974. [DOI] [Google Scholar]
- Huang F. F. Huang M. L. J. Electrochem. Soc. 2018;165:D152. doi: 10.1149/2.0721803jes. [DOI] [Google Scholar]
- Jin L. Liu C. Yang F. Z. Wu D. Y. Tian Z. Q. Electrochim. Acta. 2019;304:168–174. doi: 10.1016/j.electacta.2019.02.118. [DOI] [Google Scholar]
- Chen J. S. Fang Y. M. Qiu Q. Y. You L. X. Song J. Zhang G. M. Chen G. N. Sun J. J. Green Chem. 2011;13:2339–2343. doi: 10.1039/C1GC15066A. [DOI] [Google Scholar]
- Jin L. Yang J. Q. Yang F. Z. Wu D. Y. Tian Z. Q. J. Electrochem. Soc. 2020;167:22511. doi: 10.1149/1945-7111/ab6b07. [DOI] [Google Scholar]
- Oyaizu K. Ohtani Y. Shiozawa A. Sugawara K. Saito T. Yuasa M. Inorg. Chem. 2005;44:6915–6917. doi: 10.1021/ic050515x. [DOI] [PubMed] [Google Scholar]
- Yang X. W. An M. Z. Zhang Y. W. Zhang L. Electrochim. Acta. 2011;58:516–522. doi: 10.1016/j.electacta.2011.09.078. [DOI] [Google Scholar]
- Krishnan K. H. John S. Srinivasan K. N. Praveen J. Ganesan M. Kavimani P. M. Metall. Mater. Trans. A. 2006;37:1917–1926. doi: 10.1007/s11661-006-0134-7. [DOI] [Google Scholar]
- Milad G., Circuit World, 2010 [Google Scholar]
- Wang Y. R. Cao X. Y. Wang W. C. Mitsuzak N. Chen Z. D. Surf. Coat. Technol. 2015;265:62–67. doi: 10.1016/j.surfcoat.2015.01.062. [DOI] [Google Scholar]
- Shaigan N. Ashrafizadeh S. N. Bafghi M. Rastegari S. J. Electrochem. Soc. 2005;152:C173. doi: 10.1149/1.1862269. [DOI] [Google Scholar]
- Iacovangelo C. D. J. Electrochem. Soc. 1991;138:976. doi: 10.1149/1.2085756. [DOI] [Google Scholar]
- Iacovangelo C. D. Zarnoch K. P. J. Electrochem. Soc. 1991;138:983. doi: 10.1149/1.2085757. [DOI] [Google Scholar]
- Yao W. J. Wu D. X. Xiao Z. L. Wang Y. W. Yang R. H. Int. J. Electrochem. Sci. 2019;14:9633–9646. doi: 10.20964/2019.10.05. [DOI] [Google Scholar]
- Bonin L. Vitry V. Delaunois F. Surf. Coat. Technol. 2020;401:126276. doi: 10.1016/j.surfcoat.2020.126276. [DOI] [Google Scholar]
- Creus J. Mazille H. Idrissi H. Surf. Coat. Technol. 2000;130:224–232. doi: 10.1016/S0257-8972(99)00659-3. [DOI] [Google Scholar]
- Neese F. Wiley Interdiscip. Rev.: Comput. Mol. Sci. 2012;2:73–78. [Google Scholar]
- Neese F. Wiley Interdiscip. Rev.: Comput. Mol. Sci. 2018;8:e1327. [Google Scholar]
- Marenich A. V. Cramer C. J. Truhlar D. G. J. Phys. Chem. B. 2009;113:6378–6396. doi: 10.1021/jp810292n. [DOI] [PubMed] [Google Scholar]
- Andrae D. Haeussermann U. Dolg M. Stoll H. Preuss H. Theor. Chim. Acta. 1990;77:123–141. doi: 10.1007/BF01114537. [DOI] [Google Scholar]
- Weigend F. Ahlrichs R. Phys. Chem. Chem. Phys. 2005;7:3297–3305. doi: 10.1039/B508541A. [DOI] [PubMed] [Google Scholar]
- Adamo C. Barone V. J. Chem. Phys. 1999;110:6158–6170. doi: 10.1063/1.478522. [DOI] [Google Scholar]
- Grimme S. Ehrlich S. Goerigk L. J. Comput. Chem. 2011;32:1456–1465. doi: 10.1002/jcc.21759. [DOI] [PubMed] [Google Scholar]
- Lu T. Chen F. W. J. Comput. Chem. 2012;33:580–592. doi: 10.1002/jcc.22885. [DOI] [PubMed] [Google Scholar]
- Humphrey W. Dalke A. Schulten K. J. Mol. Graph. 1996;14:33–38. doi: 10.1016/0263-7855(96)00018-5. [DOI] [PubMed] [Google Scholar]
- Wang Y. R. Cao X. Y. Wang Z. M. Chen Z. D. Mitsuzaki N. Int. J. Electrochem. Sci. 2019;14:8185–8194. doi: 10.20964/2019.08.12. [DOI] [Google Scholar]
- Xiao K. Bai Z. H. Yan L. D. Yi P. Dong C. F. Wu J. S. Hu Y. T. Xiong R. L. Li X. G. J. Mater. Sci.: Mater. Electron. 2018;29:8877–8885. doi: 10.1007/s10854-018-8905-7. [DOI] [Google Scholar]
- Won Y. S. Park S. S. Lee J. Kim J. Y. Lee S. J. Appl. Surf. Sci. 2010;257:56–61. doi: 10.1016/j.apsusc.2010.06.033. [DOI] [Google Scholar]
- Lin J. D. Chou C. T. Surf. Coat. Technol. 2019;368:126–137. doi: 10.1016/j.surfcoat.2019.04.009. [DOI] [Google Scholar]
- Gould A. J. Boden P. J. Harris S. J. Surf. Technol. 1981;12:93–102. doi: 10.1016/0376-4583(81)90140-0. [DOI] [Google Scholar]
- Lelevic A. Walsh F. C. Surf. Coat. Technol. 2019;369:198–220. doi: 10.1016/j.surfcoat.2019.03.055. [DOI] [Google Scholar]
- Kim K. H. Yu J. Kim J. H. Scr. Mater. 2010;63:508–511. doi: 10.1016/j.scriptamat.2010.05.015. [DOI] [Google Scholar]
- Wang Y. Liu H. P. Bi S. F. He M. X. Wang C. Y. Cao L. X. RSC Adv. 2016;6:9656–9662. doi: 10.1039/C5RA17975K. [DOI] [Google Scholar]
- Liu D. G. Tian H. Lin L. J. Shi W. C. Surf. Eng. 2019;35:913–918. doi: 10.1080/02670844.2018.1548537. [DOI] [Google Scholar]
- Li J. K. Sun C. Roostaei M. Mahmoudi M. Fattahpour V. Zeng H. B. Luo J. L. Mater. Chem. Phys. 2021;267:124618. doi: 10.1016/j.matchemphys.2021.124618. [DOI] [Google Scholar]
- Keong K. G. Sha W. Malinov S. J. Alloys Compd. 2002;334:192–199. doi: 10.1016/S0925-8388(01)01798-4. [DOI] [Google Scholar]
- Abdi Alghanab K. Seifzadeh D. Rajabalizadeh Z. Habibi Yangjeh A. Surf. Coat. Technol. 2020;397:125979. doi: 10.1016/j.surfcoat.2020.125979. [DOI] [Google Scholar]
- Zhou J. Z. Liu P. Liu Z. Y. Zhang J. Huang X. Chem. Eng. J. 2020;381:122702. doi: 10.1016/j.cej.2019.122702. [DOI] [Google Scholar]
- Valiulienė G. Žielienė A. Jasulaitienė V. Trans. IMF. 2006;84:162–167. doi: 10.1179/174591906X123994. [DOI] [Google Scholar]
- Sotskaya N. V. Dolgikh O. V. Russ. J. Electrochem. 2005;41:1336–1340. doi: 10.1007/s11175-005-0223-8. [DOI] [Google Scholar]
- Murugan V. K. Jia Z. G. Syaranamual G. J. Huang Y. Z. Chen Z. J. Mater. Sci. 2017;52:9834–9849. doi: 10.1007/s10853-017-1120-8. [DOI] [Google Scholar]
- Liu X. B. Liu H. Q. Liu Y. F. He X. M. Sun C. F. Wang M. D. Yang H. B. Qi L. H. Composites, Part B. 2013;53:347–354. doi: 10.1016/j.compositesb.2013.05.032. [DOI] [Google Scholar]
- Latthe S. S. Sudhagar P. Devadoss A. Kumar A. M. Liu S. Terashima C. Nakata K. Fujishima A. J. Mater. Chem. A. 2015;3:14263–14271. doi: 10.1039/C5TA02604K. [DOI] [Google Scholar]
- Gong Y. Geng J. W. Huang J. Chen Z. Wang M. L. Chen D. Wang H. W. Surf. Coat. Technol. 2021;417:127208. doi: 10.1016/j.surfcoat.2021.127208. [DOI] [Google Scholar]
- Zhu Y. X. Jiang J. J. Yang L. J. Xu C. Zhang Q. K. Zhu X. L. Li X. Jin J. Zhou Q. Song Z. L. Surf. Coat. Technol. 2021:127415. doi: 10.1016/j.surfcoat.2021.127415. [DOI] [Google Scholar]
- Ehsan M. A. Kumar A. M. Suleiman R. K. Hakeem A. S. Surf. Coat. Technol. 2021;418:127253. doi: 10.1016/j.surfcoat.2021.127253. [DOI] [Google Scholar]
- Wang X. J. Cao Y. J. Ind. Eng. Chem. 2020;82:324–332. doi: 10.1016/j.jiec.2019.10.030. [DOI] [Google Scholar]
- Vorobyova T. N. Poznyak S. K. Rimskaya A. A. Vrublevskaya O. N. Surf. Coat. Technol. 2004;176:327–336. doi: 10.1016/S0257-8972(03)00744-8. [DOI] [Google Scholar]
- Kunimoto M. Shimada T. Odagiri S. Nakai H. Homma T. J. Electrochem. Soc. 2011;158:D585. doi: 10.1149/1.3609000. [DOI] [Google Scholar]
- Onabuta Y. Kunimoto M. Nakai H. Homma T. Electrochim. Acta. 2019;307:536–542. doi: 10.1016/j.electacta.2019.03.150. [DOI] [Google Scholar]
- Ghosh S. Thin Solid Films. 2019;669:641–658. doi: 10.1016/j.tsf.2018.11.016. [DOI] [Google Scholar]
- Kunimoto M. Endo K. Nakai H. Homma T. Electrochim. Acta. 2013;100:311–316. doi: 10.1016/j.electacta.2012.09.070. [DOI] [Google Scholar]
- Lefebvre C. Rubez G. Khartabil H. Boisson J. C. Contreras García J. Hénon E. Phys. Chem. Chem. Phys. 2017;19:17928–17936. doi: 10.1039/C7CP02110K. [DOI] [PubMed] [Google Scholar]
- Lu T. Chen Q. X., Independent gradient model based on Hirshfeld partition (IGMH): A new method for visual study of interactions in chemical systems 2021, https://chemrxiv.org/engage/chemrxiv/article-details/619e3e807c89166dba431bd0 [DOI] [PubMed]
Associated Data
This section collects any data citations, data availability statements, or supplementary materials included in this article.


