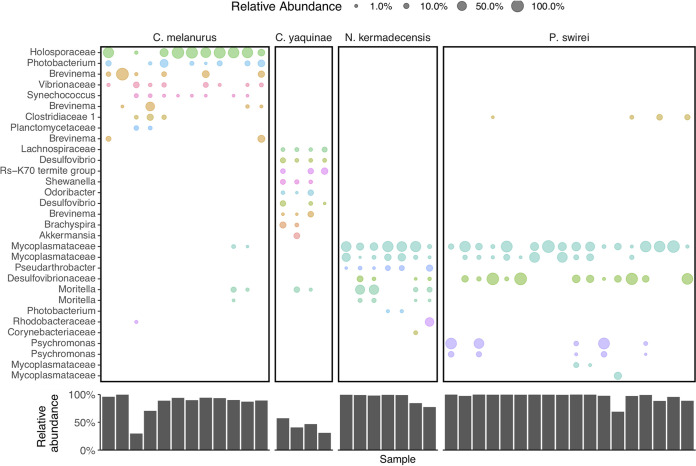
FIG 3.
(Top) The most abundant ASVs present within each fish species, colored and labeled by their lowest identifiable taxonomic rank. ASVs are shown only if they reach relative abundances greater than 0.5% in a given sample. (Bottom) The total, summed relative abundance of the taxa shown above within each sample.

