Abstract
Functional near infrared spectroscopy (fNIRS) is a valuable tool for assessing oxy- and deoxyhemoglobin concentration changes (Δ[HbO] and Δ[HbR], respectively) in the human brain. To this end, photon pathlengths in tissue are needed to convert from light attenuation to Δ[HbO] and Δ[HbR]. Current techniques describe the human head as a homogeneous medium, in which case these pathlengths are easily computed. However, the head is more appropriately described as a layered medium; hence, the partial pathlengths in each layer are required. The current way to do this is by means of Monte Carlo (MC) simulations, which are time-consuming and computationally expensive. In this work, we introduce an approach to theoretically calculate these partial pathlengths, which are computed several times faster than MC simulations. Comparison of our approach with MC simulations show very good agreement. Results also suggest that these analytical expressions give much more specific information about light absorption in each layer than in the homogeneous case.
1. Introduction
In the past few decades, functional Near Infrared Spectroscopy (fNIRS) has achieved increasing attention in the fields of Neurology and Neuroscience, due to its ability to noninvasively measure brain hemodynamics in the human head [1]. Nowadays, fNIRS covers a wide range of clinical applications, such as the study of neurological disorders [2]; speech development in newborns and children [3]; movement science [4]; and sports and high-performance physical exercise [5], among others. By placing NIR light sources and detectors (usually called optodes) on a subject’s scalp and measuring how light is attenuated, it is possible to infer changes in the concentration of blood chromophores, such as oxyhemoglobin (HbO) and deoxyhemoglobin (HbR), and hence detect cortical activation and correlate it with external stimuli or tasks performance [6].
The great majority of the commercially available fNIRS devices, which work in the continuous wave (CW) mode, rely on measuring the attenuation, , of light signals at different wavelengths, , and at a given interoptode distance, [6]. If the human head is to be modelled as a medium formed by a number of layers —such as scalp, skull, cerebrospinal fluid (CSF), gray matter, white matter—, the relationship between and the absorption change in each layer is expressed as [7,8]:
| (1) |
where represents the absorption change in layer (of ) and is the mean partial pathlength (MPPL) of photons in the same layer. If the absorption process during a measurement at wavelength is supposed to be ruled only by HbO and HbR concentration changes, then for layer it is possible to write [9]:
| (2) |
where ( ) is the molar extinction coefficient of HbO (HbR) at that wavelength and ( ) is the concentration change of HbO (HbR) in that layer. Thus, given these two equations and applying appropriate inversion techniques, one can retrieve HbO and HbR concentration changes from attenuation measurements. To this end, understanding the role of the MPPLs is crucial, since the measured attenuation will depend on the path traveled by light in each layer.
At this point it is important to remark that the MPPLs cannot be directly measured, neither in phantoms, nor in living tissue, and thus some kind of assumptions must be made in order to compute them. The simplest approach assumes a homogeneous model of the human head, i.e., in Eq. (1). In that case, the MPPL is expressed as the product between and the differential pathlength factor (DPF), which takes into account the geometry of the head and the multiple scattering processes involved [10]. However, this is a rather strong assumption, since in a real situation absorption changes do not take place uniformly throughout the whole head. Some authors apply a partial volume correction (PVC) to compute the so-called partial pathlength factor (PPF), in order to discard the contribution of the extracerebral tissue volume and consider only the brain cortex [11]. Nevertheless, all these quantities are usually set to constant values for all types of subjects and measurement configurations [11–14], which is an unrealistic premise. Hence, more complex models accounting for multiple layers are required.
When considering more layers, the DPF approach is no longer valid, since it is impossible to know a priori the proportion of photons that would travel in the different layers. Here a vast amount of the available literature makes use of Monte Carlo (MC) simulations to compute the MPPLs [7,8,15–18]. In the field of Optics of Turbid Media, MC simulations are used as an stochastic method for solving the Radiative Transfer Equation (RTE), which governs photon migration in the most general case where light can be not only absorbed, but also scattered in an anisotropically manner [19]. MC simulations stand, then, as the gold standard for mimicking real experiments, due to their capability to precisely control all the parameters involved in the process of photon migration in turbid media [19,20], which are (besides ) the scattering coefficient ( ), the anisotropy factor ( ) and the refractive index ( ) . By means of this tool, it is possible to keep track of each photon’s history (when it leaves the detector, where and when it hits a specific point of the medium, where and when it undergoes a scattering event, whether it reaches the detector or is absorbed before doing it, and so on). In CW-based MC simulations, the MPPL in layer can be obtained by deriving the total diffuse reflectance with respect to [17]:
| (3) |
Hence, using MC simulations it would be possible to perform an exhaustive and detailed study of the MPPLs as a function of the different optical and geometrical parameters in a medium with an arbitrary number of layers, a task that turns out to be unattainable in an experimental setup. However, the main drawbacks of MC simulations are their high computational cost and time consumption, which are consequently associated with the need of high performance computing servers. Therefore, although MPPLs analyses such as the one mentioned before would result interesting and even necessary, it would become highly impracticable.
These problems can be overcome by replacing the simulated in Eq. (3) by equivalent analytical expressions. In most cases, light propagation in biological tissue achieves a diffusive regime, where scattering processes dominate over absorption processes; under this condition, the RTE can be approximated by the diffusion equation (DE), which provides analytical solutions for layered media that require less hardware resources [21,22]. In this way, the MPPLs can be correctly described by all the optical and geometrical parameters of the medium of interest, at low computational and time costs and without further assumptions. Despite the advantages provided by analytical solutions of the DE when focused on the MPPLs, the few studies that have been reported only deal with homogeneous media [22,23].
In this work we use previously obtained analytical solutions of the DE in layered turbid media [24] to compute theoretical expressions for each of the MPPLs. This way of modeling the human head —as a stack of layers with different optical properties and thicknesses— results in a set of partial pathlengths inside the different layers, which is much closer to reality than what can be obtained by a purely homogeneous model, and is also fast enough as to allow its incorporation in real time fitting routines. Another advantage of this approach is that it allows to independently resolve the activity on both, the extracerebral and the cerebral tissue. Thus (and contrary to what happens with the current methods) it is higly unlikely that the retrieved cerebral activity is polluted with the more superficial signal.
The present paper is structured as follows: in Section 2 we first introduce the method that is used to calculate the MPPLs; in Section 3 we provide details on the MC simulations used to validate our approach; Section 4 presents the results of this validation as well as a detailed analysis of how the MPPLs are affected by the different optical and geometrical parameters that characterize the media under study; and finally, in Section 5 we summarize the main conclusions of the paper.
2. Theory
2.1. Solution of the diffusion equation in multi-layered media
Light propagation in the human head can be modelled by assuming that the source-detector pair is positioned on top of a bounded cylindrical geometry of radius consisting of layers, each of them with thickness , plus a last, infinitely thick layer placed at the bottom (Fig. 1). The diffusion equation that models this system has the form [24]:
| (4) |
being ( ) the fluence in layer 1 ( ) detected at the radial position and at depth , and the diffusion coefficient, where is the reduced scattering coefficient in layer . In this equation we have assumed a beam-like source that impinges the medium at the cylindrical coordinates , so that light propagation becomes completely isotropic at the point , with . Note that, due to the azimuthal symmetry of the problem, there is no angular dependence in .
Fig. 1.
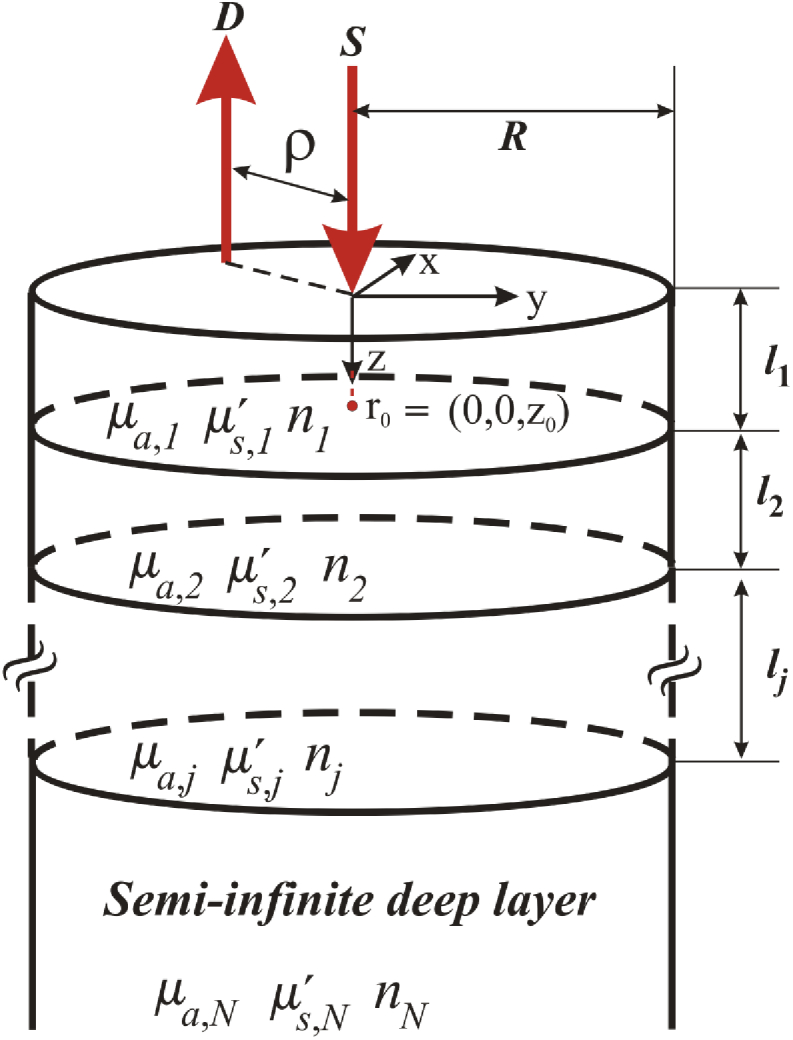
Scheme of light propagation in a semiinfinite multilayered turbid cylinder. The radial extension can be considered large enough as to avoid the influence of the lateral bounds.
Following the steps shown in Ref. [24], the diffuse reflectance at the surface for an arbitrary number of layers can be obtained from Eq. (4) in terms of the fluence (we omit the dependence with the optical properties and the layers’ thicknesses):
| (5) |
where is a factor that depends on the mismatch in refractive indices between the media and the environment; is the extrapolated radius for which , with [25]; and and the spherical Bessel functions of the first species and orders 0 and 1, respectively. In this equation, represents the Green’s function for layer 1 at , given by:
| (6) |
being , with and a factor that satisfies the relationship . The quantities and are obtained by the following recurrence relations:
| (7) |
| (8) |
for which the starting values and :
| (9) |
| (10) |
are needed. In particular, for two-layered media, .
2.2. Theoretical approach for the mean partial pathlengths
For the sake of brevity, here we will only show the calculations for the MPPLs in two-layered media. The reader can find the corresponding expressions for three and four-layered media in the Supplement 1 (954.1KB, pdf) .
As expressed by Eq. (3), derivatives of the reflectance (with respect to the different absorption coefficients ) are needed in order to compute the MPPLs. From Eq. (5) if follows that only the Green’s function depends on ; then:
| (11) |
A closer inspection to Eq. (6) suggests that the Green’s function can be rewritten as:
| (12) |
where , and are
| (13) |
| (14) |
| (15) |
The derivatives of are, thus:
| (16) |
with:
| (17) |
Let
| (18) |
| (19) |
| (20) |
For the MPPL in layer 1, we need the following quantities:
| (21) |
| (22) |
| (23) |
On the other hand, for the MPPL in the second layer we only need:
| (24) |
Once we obtain the MPPLs in each layer, we can compute the mean total pathlength (MTPL) in any N-layered medium by summing up all the MPPLs:
| (25) |
As a last remark, it is worth mentioning that a typical calculation for four-layered media takes about a few milliseconds to be completed on an Intel Core i5 with 16GB RAM, without any parallel implementation.
3. Monte Carlo simulations
In order to validate our theoretical approach, continuous wave MC simulations, based on the variance reduction technique, were performed using MCX, a free voxel based Monte Carlo toolkit integrated with MATLAB and implemented under CUDA architecture [26,27]. For each parameters combination, twenty simulations were run in order to compute the mean partial pathlengths with their associated standard deviations. Each run consisted in launching photon packets with a unitary initial weight, from an isotropic source placed at at time ; although a more realistic implementation would require the use of a pencil beam source, we chose the isotropic source type to better compare with our approach, which is based on the DE [22]. After propagation in tissue, photons are collected by detectors of radius placed at the surface of two, three and four-layered media. For every detected photon, its trajectory, number of collisions and total weight loss are recorded. A single simulation, running on the same CPU as the one used for the theoretical calculations, and with an NVIDIA GeForce Titan Xp GPU, takes approximately 15 seconds, depending on the optical properties of the different layers, the total number of voxels and their size. Two, three and four-layered media consisting in stacks of cylinders of 200 mm in diameter, and with voxel size of 1 were considered. This choice ensures that there is negligible light intensity reaching the lateral faces of the cylinders, while keeping a reasonable spatial resolution. Eight source-detector distances ( ), with values between 5 mm and 40 mm in 5 mm steps, were used.
4. Results and discussion
4.1. Validation with MC simulations and dependence with and layers thicknesses
Due to the fact that the MPPLs (hereinafter directly referred to as ) depend on a large number of parameters —being this number increased with the amount of layers as —, together with the high computation times of all MC simulations, we limit the comparison to variations of only a certain set of parameters that represent situations of clinical interest. In fNIRS, this means that the absorption coefficient of the upper layer and that of the one mimicking the cortex are varied, while the of the other layers remains fixed. Besides, the thicknesses of the layers associated to the extracerebral tissue are also modified; this accounts for variations not only within the same subject (depending on the area of the head to be studied [28]), but also between subjects. Regarding the reduced scattering coefficient and the refractive index, we set the same values ( 1 and ) for every layer.
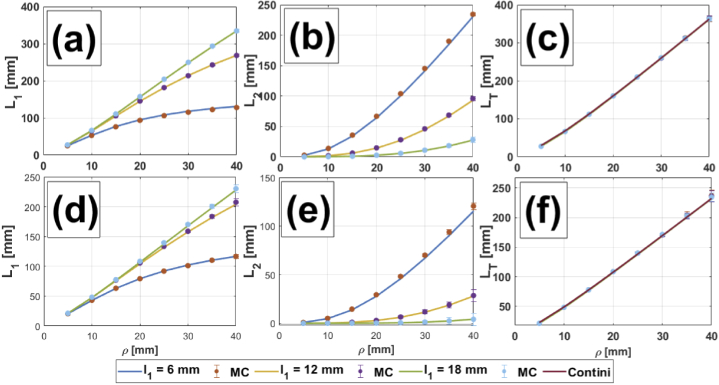
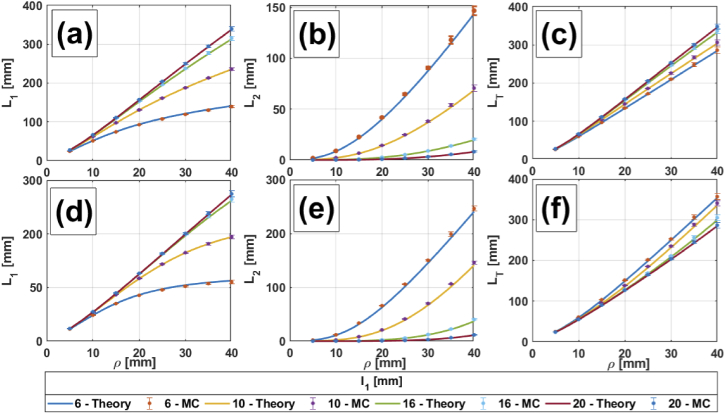
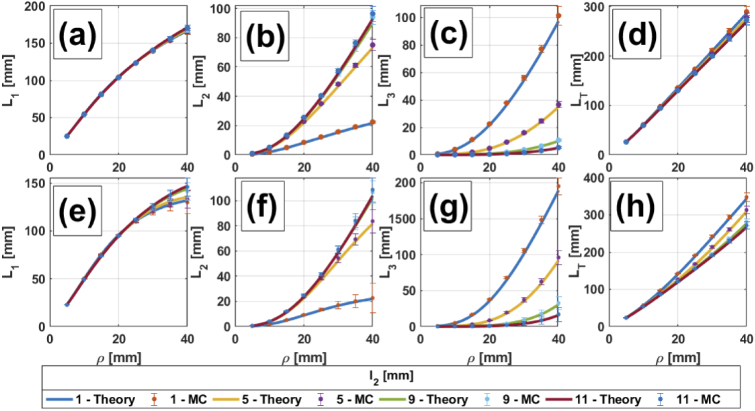
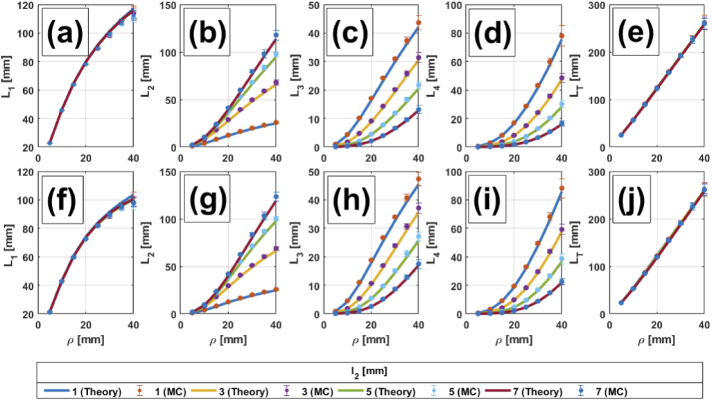
Figures 2, 3, 4 and 5 show comparisons between MC simulations and the analytical mean partial pathlengths presented in Section 2, for a homogeneous medium and for two-, three- and four-layer media, respectively. These comparisons are plotted against the source-detector distance , for different values of the upper layers’ thicknesses ( in Fig. 2 and 3; in Fig. 4, 5) and for different combinations of the absorption coefficients in the scalp and the gray matter layers; the details are listed in the corresponding captions. In general, it can be said that the analytical model shows very good agreement with the MC simulations. Errors are bounded to (in the worst case), so error bars are barely seen in the Figures. A description of percentage errors is given later on, in Section 4.1.4, for all the cases presented in this work.
Fig. 2.
Comparison between the analytical two-layered model and MC simulations for (a, d), (b, e) and (c, f) in a homogeneous medium, for three thicknesses of layer 1: 6 mm, 12 mm and 18 mm. In the latter (c, f), the theoretical model for a completely homogeneous medium (taken from Ref. [22]) is also shown. Upper row: 0.0067 . Lower row: 0.018 .
Fig. 3.
, and in a two-layered medium vs. for different thicknesses of layer 1. (a) to (c): 0.0067 0.0125 ; (d) to (f): 0.0125 0.0067 . 1 (for all layers).
Fig. 4.
, , and in a three-layered medium vs. for different thicknesses of layer 2. (a) to (d): 0.0067 0.0125 ; (e) to (h): 0.0125 0.0067 . The rest of the parameters are: 0.016 , (for all layers), 7 mm.
Fig. 5.
, , , and in a four-layered medium vs. for different thicknesses of layer 2. (a) to (e): . (f) to (j): . The rest of the parameters are: , (for all layers), mm, mm.
4.1.1. Two-layered media
The very first comparison consists in testing our two-layered theory in a homogeneous situation (i.e., when the optical parameters in both layers are the same) against MC simulations. Figure 2 shows the plots corresponding to (Fig. 2(a), (d)), (Fig. 2(b), (e)) and (Fig. 2(c), (f)), for three thicknesses of the upper layer and two different values of the absorption coefficient. In the last subset of plots we also added the analytical directly computed for homogeneous media (Eq. (47) in Ref. [22]). Here it is worth to note the following: although the medium itself is homogeneous, using a two-layered model with the same set of optical properties between layers (instead of a homogeneous one) provides additional information regarding the trajectory of photons in upper and lower regions. This can be clearly seen, for example, as we increase the thickness of the first layer. presents an asymptotic behavior as a function of for = 6 mm, while tends to increase in an exponential fashion, and for 30 mm its contribution to becomes more important; however, both curves compensate with each other, resulting in a curve for that seems to behave in a linear way. On the other hand, when we increase up to 18 mm, provides all the contribution to (now both of them behaving almost like linear functions of ), while , although still growing exponentially with the interoptode distance, barely contributes. Of course, this analysis can also be done for a higher number of layers, which is equivalent to increasing the resolution of the stacked regions of the homogeneous medium being studied; but, in the end, the partial pathlengths once again compensate to give the same linear behavior already observed for .
We turn now to the two-layered heterogeneous situation. We consider thickness variations in the layer mimicking the extracerebral tissue (in this case only ). Figure 3 shows , and for 0.0067 0.0125 (Fig. 3(a), (b), (c)), and 0.0125 0.0067 (Fig. 3(d), (e), (f)). Once again, we observe that increases linearly and presents an exponential behavior for small values of , while for larger values, the behaviors tend to become horizontally asymptotic and linear, respectively. The resulting is an almost linear function of , due to the compensation between both partial pathlengths. An interesting fact can be observed here when we switch the absorption coefficients between layers: although always increases and always decreases with , increases as is increased for , while it decreases with for . This is related to the size of the region with the higher absorption coefficient: independently of which the layer with the higher is, the thicker this layer, the smaller becomes .
4.1.2. Three-layered media
For this configuration we consider variations in the absorption coefficient of the third layer, that mimics cerebral tissue, as well as in the first layer, here representing the scalp. Also variations in the thickness of the second layer (representing the skull) are included to take into account possible differences between areas of the head and/or variations among subjects.
In Fig. 4, the asymptotic behavior of (for large ) and the exponential behavior of (for small ) are also present. However, in the case of and (Fig. 4(a)) the curves for different thicknesses of the second layer are practically identical; on the other hand, for and (Fig. 4(e)), these curves become distinguishable for mm. Hence, in the first situation it would be impossible to infer the thickness of the first layer just by means of , while in the second situation this could be done, but large interoptode distances are required, something which is not recommended if high photon counts are needed to keep an acceptable signal-to-noise ratio.
Regarding , the situation in which for the lowest value of (Fig. 4(f)) shows a curve with a sigmoidal shape. This means there are few photons in the second layer, and also that these photons barely spend time in this region, when the source-detector distance is less than 10 mm; then, the increase in the traveled path becomes steeper, until 30 mm, when the curve tends to flatten. At this point, it does not matter how large becomes, since most photons will go directly to the deepest layer. Conversely, when is increased, this plateau is moved toward larger values, meaning that a high proportion of the detected photons can still travel long distances in layer 2, while layer 1 remains relatively unexplored.
The overall contribution of each on the total pathlength is again compensated, giving as a result a quasi-linear behavior with . Contrary to the two-layered case, here the relationship between and does not affect the fact that, the thinner is, the larger becomes . Nevertheless, when , (Fig. 4(h)) reaches higher values than on the other situation; this also helps to better discriminate between the different thicknesses of layer 2.
4.1.3. Four-layered media
For the case of four-layered media we consider variations in the absorption coefficient of the third layer (mimicking the gray matter), as well as that of the first layer, representing the scalp; the deepest layer is now associated to white matter and its optical properties remain constant. The thickness of the second layer, acting as the skull, is also varied.
In the case of four layered media (Fig. 5), the behaviors already described for the partial pathlengths in the first and the last layers are not only repeated, but somehow accentuated. Actually, in the case of (Fig. 5(a),(f))), it is impossible to tell the differences among curves corresponding to different values of .
In the case of with 1 mm (Fig. 5(b), (g)), we still observe a sigmoidal behavior, which quickly disappears for larger thicknesses of the second layer. As for (Fig. 5(c), (h)), this behavior (a quick increase for small and a slower one for high ) can be observed for ; it disappears once again for higher values of but, contrary to the case of , this time decreases with . presents the same tendency with as , although it reaches higher values, which is to be expected if we consider that the last layer is semiinfinite.
In the end, the mean total pathlength (Fig. 5(e),(j)) is exactly the same, no matter the relation between and or the thickness of layer 2. In opposition to the previous cases, this quantity cannot tell anything about the optical and geometrical details of the medium, hence this information can be obtained only by means of the partial pathlengths.
4.1.4. Error considerations
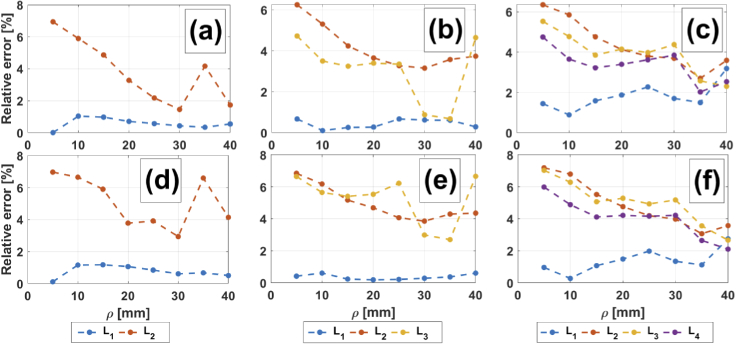
Figure 6 shows the relative errors (absolute values) resulting from the comparison between theory and the MC simulations for the three situations described above. Figures 6(a) and (d) correspond to the two-layered medium, (b) and (e) to the three-layered medium, and (c) and (f) to the four-layered medium. In the upper row, the extracerebral absorption coefficient is lower than the cerebral one and in the lower row the reciprocal situation is shown. In all cases, errors are bounded to . Two main sources can be identified for these discrepancies, namely: i) Both the analytical reflectance and its derivatives are obtained by computing the finite Hankel transform, which needs the use of enough Bessel zeroes in order to achieve the desired accuracy; the use of high precision arithmetic can lead to greater accuracy [29], but increasing computational costs. ii) A larger amount of Bessel zeroes could be used (in our computations, the first 5000 Bessel zeroes were employed); this seems to be more important when considering short distances, where the relative differences tend to be larger than for higher interoptode distances. Once again, doing this would increase the computation times.
Fig. 6.
Percentage relative errors for theoretical mean partial pathlengths compared with MC-simulated ones, as a function of , for the two-layered medium (left column), three-layered medium (middle column) and four-layered medium (right column). (a) to (c): 0.0067 0.0125 . (d) to (f): 0.0125 0.0067 .
A third source of error could be the medium discretization. Indeed, for domains of arbitrary geometries, reducing the voxel size will help increasing the accuracy with which the pathlengths are considered to belong to a specific layer. However, in our case the geometry of the medium is relatively simple, while the amount of voxels included in every layer is an integer number; hence, here a higher discretization would not imply a significant improvement.
4.2. Dependence of the mean partial and total pathlengths in two-layered media with and
Modeling the human head as a two-layered medium is a fairly desirable practice, because it is complex enough to discriminate between systemic and cerebral signals but also sufficiently simple to avoid dealing with higher number of layers, which unnecessarily increases computation times. In two-layered media, the absorption coefficients of both the superficial and the deepest layers may change independently from each other; thus, it is interesting to pay some attention to what happens with the mean partial and total pathlengths when these changes take place.
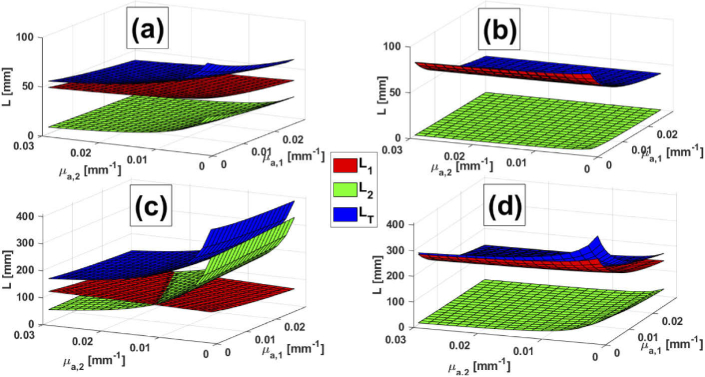
Figure 7 presents surface plots of , and in a two layered medium vs. and , for four combinations of and : 10 mm and 5 mm (Fig. 7(a)); 10 mm and 15 mm (Fig. 7(b)); 30 mm and 5 mm (Fig. 7(c)) and 30 mm and 15 mm (Fig. 7(d)). Except for the third case, and show a stronger dependence with rather than with . This behavior is to be expected if we consider that, for the corresponding combinations of and , photons tend to travel larger distances in the first layer. In the case of the shortest interoptode distance and the thicker first layer (Fig. 7(b)), is almost negligible and barely contributes to . The remaining case, with 30 mm and 5 mm, shows a strong decrease of (together with ) for 0.002 0.015 , while increases in an approximately linear way. This behavior takes place since, for this combination of and , photons can easily reach the second layer, something that does not happen in the other situations. Note that, for low absorption values in the second layer, is greater than in all the range.
Fig. 7.
Surface plots of , and vs. and for a two-layered medium. a) 10 mm and 5 mm; b) 10 mm and 15 mm; c) 30 mm and 5 mm; d) 30 mm and 15 mm.
Here the following remark (which may seem obvious at first sight but implies profound consequences) must be noted: the dependence of and with and is anything but constant, i.e., and . This means that the attenuation, when computed with the help of Eq. (1), requires the knowledge of the absolute absorption coefficients of the first and the second layer (actually, that is the meaning of in the argument of ). However, current data processing methods for CW fNIRS rely on absorption changes ( in Eq. (1)) with respect to a baseline situation, rather than on absolute absorption values, and in fact they ignore any dependence with , either for homogeneous or layered media. Hence, this is a rather strong assumption that does not represent reality.
This problem may be overcome in two ways. First, we could fall into the temptation of assuming that and are sufficiently small, so that and are approximately constant. Although many works assume this [8], we must be careful with the meaning of "small". Taking as example Fig. 7(c), the variation of in the whole range [0.002,0.03] is negligible compared to the variation of in the same range. Hence, before assuming smallness in and , we need to be aware about the way and depends on the absorption coefficients.
Second, solutions to the RTE and the DE in media without absorption can be rescaled to cases with nonzero absorption properties [30]; these rescaling factors appear both in the numerator and the denominator of Eq. (3), and hence cancel out, meaning that one could, in principle, assume any pair of absorption coefficients for each layer. In any case, since we are interested in absorption changes relative to a baseline situation, the result of not setting the precise absorption coefficients to compute and might be, in the end, just a multiplication factor, which is not a defining component when deciding whether there is activation or not in an specific brain region. This argument is also valid for models with a higher number of layers.
5. Conclusions
In this work, analytical expressions for the mean partial and total pathlenghts in multilayered media were introduced. These expressions allow to easily and rapidly (within milliseconds) discriminate the path traveled by photons in layered media such as the human head, something which has direct impact on fNIRS applications. Comparisons with Monte Carlo simulations show very good agreement. Differences between MC and theory for the mean partial pathlengths of the first layer remain rather low, while discrepancies of less than 8% were found for the other layers; these discrepancies could be further reduced in two ways: by using higher precision arithmetic in the theoretical computations, and by using a larger number of Bessel zeroes in order to achieve a better accuracy.
The dependence of the mean partial pathlengths with the source-detector separation shows that the distances traveled by photons depend on the position of the layer relative to the surface. For example, in all the studied cases (two-, three- and four-layered media), the deepest layer shows no limit for the reached value of the corresponding partial pathlength. On the other hand, the most superficial layer and the intermediate ones present an asymptotic behavior close to saturation for large values of . Nevertheless, 40 mm is not practical in real situations, since the amount of detected photons, together with the signal-to-noise ratio, is highly reduced.
The particular case of two-layered media shows that and depend on each layer’s absorption coefficient in a non-constant manner. This may be counterproductive for processing CW fNIRS data, since this means that and are needed to compute the mean partial pathlengths, while current methods only require relative absorption changes; however, certain measures could be taken to overcome this issue, such as assuming that and are sufficiently small, so that and take constant values (at least for those specific ranges of and ); and also the rescaling properties of the solutions to the RTE and the DE might reduce this problem to a scaling factor in the overall retrieved HbO and HbR concentration changes.
This paper describes results obtained for up to four-layered media in planar geometries. However, the human head may be better described as a layered sphere. Therefore, mean and total partial pathlengths could also be computed for the corresponding analytical solutions by replacing the resulting diffuse reflectance in Eq. (3). This method may be also applicable to situations where the DE does not hold; a very well known example of this is the presence of the CSF, for which and are very low [15,31]; here, higher order solutions to the RTE must be used [32–35].
Extra information from the pathlengths might be also obtained when taking into account the distributions of times of flight (DTOFs) of photons in turbid media [8,17]. Although CW fNIRS devices cannot provide temporal information about photon migration in living tissue, a proper analysis considering the time as a factor may contribute with useful details. We will address some of these points in future works under development.
Acknowledgements
Authors would like to thank NVIDIA for the donation of a GeForce Titan Xp GPU card.
Funding
Agencia Nacional de Promoción Científica y Tecnológica10.13039/501100003074 (PICT 2018 N° 1295, PICT Start Up 2018 N° 4709).
Disclosures
The authors declare no conflicts of interest.
Data availability
Data underlying the results presented in this paper are not publicly available at this time but may be obtained from the authors upon reasonable request.
Supplemental document
See Supplement 1 (954.1KB, pdf) for supporting content.
References
- 1.Boas D., Elwell C. E., Ferrari M., Taga G., “Twenty years of functional near-infrared spectroscopy: introduction for the special issue,” NeuroImage 85, 1–5 (2014). 10.1016/j.neuroimage.2013.11.033 [DOI] [PubMed] [Google Scholar]
- 2.Rahman A., Siddik A. B., Ghosh T. K., Khanam F., Ahmad M., “A narrative review on clinical applications of fnirs,” J. Digit Imaging 33(5), 1167–1184 (2020). 10.1007/s10278-020-00387-1 [DOI] [PMC free article] [PubMed] [Google Scholar]
- 3.Gervain J., Berent I., Werker J. F., “Binding at birth: the newborn brain detects identity relations and sequential position in speech,” J. Cogn. Neurosci. 24(3), 564–574 (2012). 10.1162/jocn_a_00157 [DOI] [PMC free article] [PubMed] [Google Scholar]
- 4.Herold F., Wiegel P., Scholkmann F., Thiers A., Hamacher D., Schega L., “Functional near-infrared spectroscopy in movement science: a systematic review on cortical activity in postural and walking tasks,” Neurophotonics 4(4), 041403 (2017). 10.1117/1.NPh.4.4.041403 [DOI] [PMC free article] [PubMed] [Google Scholar]
- 5.Seidel O., Carius D., Roediger J., Rumpf S., Ragert P., “Changes in neurovascular coupling during cycling exercise measured by multi-distance fNIRS: a comparison between endurance athletes and physically active controls,” Exp. Brain Res. 237(11), 2957–2972 (2019). 10.1007/s00221-019-05646-4 [DOI] [PMC free article] [PubMed] [Google Scholar]
- 6.Scholkmann F., Kleiser S., Metz A. J., Zimmermann R., Pavia J. M., Wolf U., Wolf M., “A review on continuous wave functional near-infrared spectroscopy and imaging instrumentation and methodology,” NeuroImage 85, 6–27 (2014). 10.1016/j.neuroimage.2013.05.004 [DOI] [PubMed] [Google Scholar]
- 7.Hiraoka M., Firbank M., Essenpreis M., Cope M., Arridge S., van der Zee P., Delpy D., “A monte carlo investigation of optical pathlength in inhomogeneous tissue and its application to near-infrared spectroscopy,” Phys. Med. Biol. 38(12), 1859–1876 (1993). 10.1088/0031-9155/38/12/011 [DOI] [PubMed] [Google Scholar]
- 8.Steinbrink J., Wabnitz H., Obrig H., Villringer A., Rinneberg H., “Determining changes in nir absorption using a layered model of the human head,” Phys. Med. Biol. 46(3), 879–896 (2001). 10.1088/0031-9155/46/3/320 [DOI] [PubMed] [Google Scholar]
- 9.Tak S., Ye J. C., “Statistical analysis of fNIRS data: a comprehensive review,” NeuroImage 85, 72–91 (2014). 10.1016/j.neuroimage.2013.06.016 [DOI] [PubMed] [Google Scholar]
- 10.Huppert T., Diamond S., Franceschini M., Boas D., “Homer: a review of time-series analysis methods for near-infrared spectroscopy of the brain,” Appl. Opt. 48(10), D280–D298 (2009). 10.1364/AO.48.00D280 [DOI] [PMC free article] [PubMed] [Google Scholar]
- 11.Whiteman A., Santosa H., Chen D., Perlman S., Huppert T., “Investigation of the sensitivity of functional near-infrared spectroscopy brain imaging to anatomical variations in 5- to 11-year-old children,” Neurophotonics 5(1), 011009 (2017). 10.1117/1.NPh.5.1.011009 [DOI] [PMC free article] [PubMed] [Google Scholar]
- 12.Duncan A., Meek J., Clemence M., Elwell C., Tyszczuk L., Cope M., Delpy D., “Optical pathlength measurements on adult head, calf and forearm and the head of the newborn infant using phase resolved optical spectroscopy,” Phys. Med. Biol. 40(2), 295–304 (1995). 10.1088/0031-9155/40/2/007 [DOI] [PubMed] [Google Scholar]
- 13.Pinti P., Scholkmann F., Hamilton A., Burgess P., Tachtsidis I., “Current status and issues regarding pre-processing of fnirs neuroimaging data: an investigation of diverse signal filtering methods within a general linear model framework,” Front. Hum. Neurosci. 12, 505 (2019). 10.3389/fnhum.2018.00505 [DOI] [PMC free article] [PubMed] [Google Scholar]
- 14.de Souza Rodrigues J., Ribeiro F., Sato J., Mesquita R., Júnior C. B., “Identifying individuals using fNIRS-based cortical connectomes,” Biomed. Opt. Express 10(6), 2889 (2019). 10.1364/BOE.10.002889 [DOI] [PMC free article] [PubMed] [Google Scholar]
- 15.Okada E., Delpy D. T., “Near-infrared light propagation in an adult head model. i. modeling of low-level scattering in the cerebrospinal fluid layer,” Appl. Opt. 42(16), 2906–2914 (2003). 10.1364/AO.42.002906 [DOI] [PubMed] [Google Scholar]
- 16.Okada E., Delpy D. T., “Near-infrared light propagation in an adult head model. ii. effect of superficial tissue thickness on the sensitivity of the near-infrared spectroscopy signal,” Appl. Opt. 42(16), 2915–2921 (2003). 10.1364/AO.42.002915 [DOI] [PubMed] [Google Scholar]
- 17.Zucchelli L., Contini D., Re R., Torricelli A., Lorenzo S., “Method for the discrimination of superficial and deep absorption variations by time domain fNIRS,” Biomed. Opt. Express 4(12), 2893–2910 (2013). 10.1364/BOE.4.002893 [DOI] [PMC free article] [PubMed] [Google Scholar]
- 18.Re R., Contini D., Zucchelli L., Torriccelli A., Spinelli L., “Effect of a thin superficial layer on the estimate of hemodynamic changes in a two-layer medium by time domain NIRS,” Biomed. Opt. Express 7(2), 264 (2016). 10.1364/BOE.7.000264 [DOI] [PMC free article] [PubMed] [Google Scholar]
- 19.Wang L. H., Jacques S. L., Zheng L. Q., “MCML Monte Carlo modeling of light transport in multilayered tissues,” Comput. Methods Programs Biomed. 47(2), 131–146 (1995). 10.1016/0169-2607(95)01640-F [DOI] [PubMed] [Google Scholar]
- 20.Fang Q., Boas D. A., “Monte Carlo simulation of photon migration in 3D turbid media accelerated by graphics processing units,” Opt. Express 17(22), 20178–20190 (2009). 10.1364/OE.17.020178 [DOI] [PMC free article] [PubMed] [Google Scholar]
- 21.Patterson M. S., Chance B., Wilson B. C., “Time resolved reflectance and transmittance for the noninvasive measurement of tissue optical properties,” Appl. Opt. 28(12), 2331–2336 (1989). 10.1364/AO.28.002331 [DOI] [PubMed] [Google Scholar]
- 22.Contini D., Martelli F., Zaccanti G., “Photon migration through a turbid slab described by a model based on diffusion approximation. i. theory,” Appl. Opt. 36(19), 4587–4599 (1997). 10.1364/AO.36.004587 [DOI] [PubMed] [Google Scholar]
- 23.Bianco S. D., Martelli F., Zaccanti G., “Penetration depth of light re-emitted by a diffusive medium: theoretical and experimental investigation,” Phys. Med. Biol. 47(23), 4131–4144 (2002). 10.1088/0031-9155/47/23/301 [DOI] [PubMed] [Google Scholar]
- 24.García H. A., Iriarte D. I., Pomarico J. A., Grosenick D., Macdonald R., “Retrieval of the optical properties of a semi infinite compartment in a layered scattering medium by single-distance, time-resolved diffuse reflectance measurements,” J. Quant. Spectrosc. Radiat. Transfer 189, 66–74 (2017). 10.1016/j.jqsrt.2016.11.018 [DOI] [Google Scholar]
- 25.Haskell R. C., Svaasand L. O., Tsay T.-T., Feng T.-C., McAdams M. S., Tromberg B., “Boundary conditions for the diffusion equation in radiative transfer,” J. Opt. Soc. Am. A 11(10), 2727–2741 (1994). 10.1364/JOSAA.11.002727 [DOI] [PubMed] [Google Scholar]
- 26.Fang Q., Yan S., “Graphics processing unit-accelerated mesh-based Monte Carlo photon transport simulations,” J. Biomed. Opt. 24(11), 1–6 (2019). 10.1117/1.JBO.24.11.115002 [DOI] [PMC free article] [PubMed] [Google Scholar]
- 27.Yan S., Fang Q., “A hybrid mesh and voxel based Monte Carlo algorithm for accurate and efficient photon transport modeling in complex bio-tissues,” bioRxiv (2020). [DOI] [PMC free article] [PubMed]
- 28.Brigadoi S., Cooper R. J., “How short is short? optimum source-detector distance for short-separation channels in functional near-infrared spectroscopy,” Neurophotonics 2(2), 025005 (2015). 10.1117/1.NPh.2.2.025005 [DOI] [PMC free article] [PubMed] [Google Scholar]
- 29.Arridge S., Cope M., Deply T., “The theoretical basis for the determination of optical pathlengths in tissue: temporal and frequency analysis,” Phys. Med. Biol. 37(7), 1531–1560 (1992). 10.1088/0031-9155/37/7/005 [DOI] [PubMed] [Google Scholar]
- 30.Martelli F., Del Bianco S., Ismaelli A., Zaccanti G., “Light propagation through biological tissue and other diffusive media: theory,” Solutions, and Software (SPIE Press, 2009) (2010). [Google Scholar]
- 31.Okada E., Firbank M., Schweiger M., Arridge S. R., Cope M., Delpy D. T., “Theoretical and experimental investigation of the effect of sulci on light propagation in brain tissue,” in Photon Propagation in Tissues , vol. 2626 Chance B., Delpy D. T., Mueller G. J., eds., International Society for Optics and Photonics (SPIE, 1995), pp. 2–8. [Google Scholar]
- 32.Boas D. A., Liu H., O’Leary M. A., Chance B., Yodh A. G., “Photon migration within the P3 approximation,” in Optical Tomography, Photon Migration, and Spectroscopy of Tissue and Model Media: Theory, Human Studies, and Instrumentation , vol. 2389 Chance B., Alfano R. R., eds., International Society for Optics and Photonics (SPIE, 1995), pp. 240–247. [Google Scholar]
- 33.Brantley P. S., Larsen E. W., “The simplified p3 approximation,” Nucl. Sci. Eng. 134(1), 1–21 (2000). 10.13182/NSE134-01 [DOI] [Google Scholar]
- 34.Hull E. L., Foster T. H., “Steady-state reflectance spectroscopy in the p3 approximation,” J. Opt. Soc. Am. A 18(3), 584–599 (2001). 10.1364/JOSAA.18.000584 [DOI] [Google Scholar]
- 35.Geiger S., Reitzle D., Liemert A., Kienle A., “Determination of the optical properties of three-layered turbid media in the time domain using the p3 approximation,” OSA Continuum 2(6), 1889–1899 (2019). 10.1364/OSAC.2.001889 [DOI] [Google Scholar]
Associated Data
This section collects any data citations, data availability statements, or supplementary materials included in this article.
Data Availability Statement
Data underlying the results presented in this paper are not publicly available at this time but may be obtained from the authors upon reasonable request.


