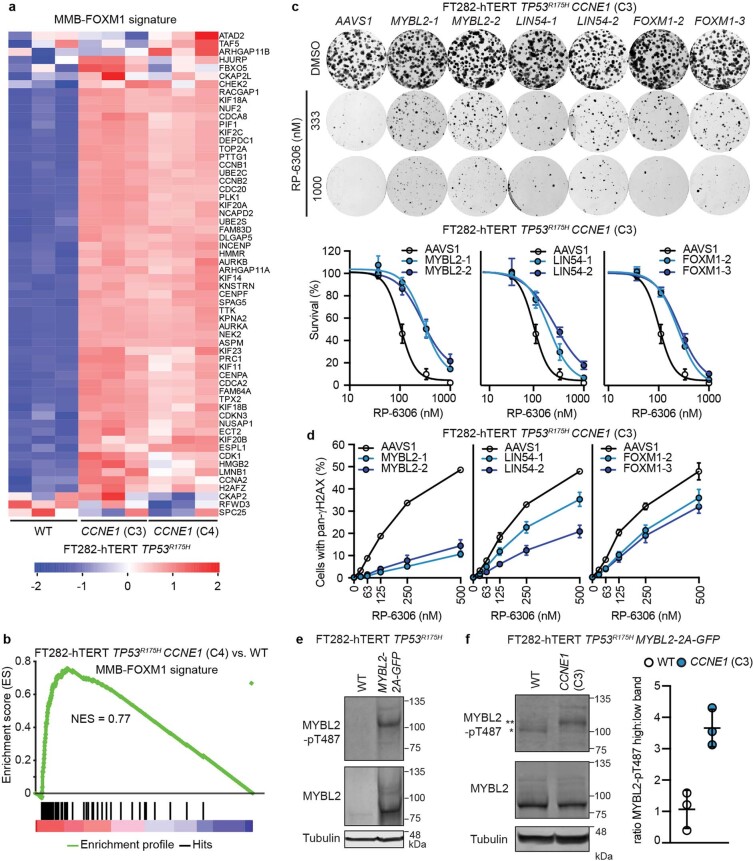
Extended Data Fig. 6. MMB-FOXM1 is hyperactivated in CCNE1-high cells.
a,b, heat map (a) and gene set enrichment analysis (GSEA) (b) of differential gene expression in FT282 parental (WT) vs CCNE1-high (C3 and C4 for heat map, C4 for GSEA) cells for a gene set comprising genes co-regulated by MMB-FOXM1. Development of the co-regulated MMB-FOXM1 gene list is available in Methods and the list of genes is available in Extended Data Table 3. c, Clonogenic survival of CCNE1-high FT282-hTERT TP53R175H cells nucleofected with Cas9 ribonucleoproteins assembled with the indicated sgRNAs. Shown on top are representative images of plates stained with crystal violet and below is the quantitation. Data are shown as mean ± s.d. (n = 3). d, QIBC quantitation of cells with pan-γH2AX as a function of RP-6306 dose of CCNE1-high FT282-hTERT TP53R175H cells nucleofected with Cas9 ribonucleoproteins assembled with the indicated sgRNAs. Data are shown as mean ± s.d. (n = 3). e,f, Whole cell lysates of FT282-hTERT TP53R175H parental and MYBL2-2A-GFP expressing (e) and FT282-hTERT TP53R175H MYBL2-2A-GFP WT and CCNE1-high cells (f, left) were immunoblotted with MYBL2, MYBL2-pT487 and Tubulin specific antibodies. (f, left) * and ** denote the lower and upper phosphorylated MYBL2 bands respectively. (f, right) Quantitation of upper to lower band intensity. Data are shown as mean ± s.d. (n = 3). (e) Representative of two immunoblots. For gel source data, see Supplementary Fig. 1.

