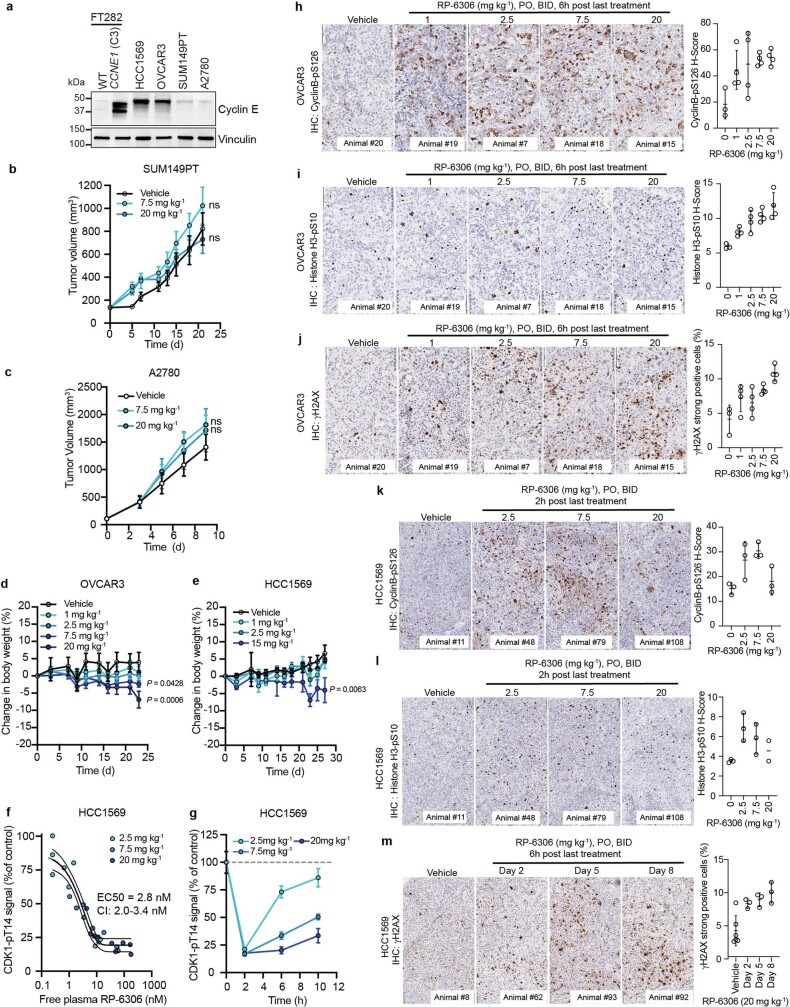
Extended Data Fig. 9. Characterization of CCNE1-normal and CCNE1-amplifed CDX models.
a, Whole cell lysates of the indicated cell lines were immunoblotted with antibodies against cyclin E and vinculin. Representative of two immunoblots. b–e, RP-6306 was administered orally BID at the indicated doses for the duration of the experiment. b, c, Tumor growth of SUM149PT (b) and A27080 (c) xenografts in NOD-SCID mice treated with either RP-6306 or vehicle BID for the duration of the experiment. Results are expressed as mean tumor volume ± s.e.m. (n = 8). P values relative to vehicle were determined by a one-way ANOVA. n.s. = non-significant P value d, e Changes in body weight in tumor-bearing OVCAR3 (d) and HCC1569 (e) CB-17 SCID and SCID-beige mice treated with either RP-6306 or vehicle. Results are expressed as mean % body weight change ± s.e.m. (OVCAR3 n = 8 (vehicle), 7 (1 mg kg−1), 8 (2.5 mg kg−1), 7 (7.5 mg kg−1), 8 (20 mg kg−1); HCC1569 n = 8 (vehicle),7 (1 mg kg−1), 8 (2.5 mg kg−1), 6 (15 mg kg−1)). P values relative to vehicle were determined by a one-way ANOVA. f, g Mice bearing HCC1569 tumors were treated with RP-6306 at the indicated doses BID for 1.5 days and tumor tissue and whole blood sampled at 2, 6 and 10 h post last dose. f, Data represent the free (unbound to plasma protein) blood concentration of RP-6306 for mouse relative to tumor CDK1-pT14 signal inhibition quantified by ELISA relative to vehicle-treated control tumors (N = 3/group/time point). The tumor EC50 was determined by a non-linear least square’s regression to a normalized dose-response model with 95% confidence intervals. g, Kinetics of CDK1-pThr14 inhibition with time. Data presented as the mean ± s.e.m. (n = 3). h–m, OVCAR3 (h-j) and HCC1569 (k-m) tumor-bearing mice were administered the indicated dose of RP-6306 orally BID for 8 days and sacrificed at 6 h post last treatment (h-j) or administered the indicated dose of RP-6306 orally BID 1.5 days and sacrificed at 2 h post last treatment (k,l) and tumor tissue prepared for FFPE. HCC1569 tumors (m) were treated with 20 mg kg−1 RP-6306 BID for 2, 5 or 8 days and tumor tissue harvested 6 h post last treatment. Tumor tissues were stained with cyclin B-pS126 (h,k), histone H3-pS10 (i,l) or γH2AX (j,m) antibodies and the H-score (h,i,k,l) or percentage of strong positive γH2AX cells present in the tumor area (j,m) was quantified by HALO software. Results are expressed as mean ± s.e.m. (h-j: n = 3,4,4,4; k: n = 3,3,3,3; l: n = 3,3,3,2; m: n = 6,3,3,3).

