

Abstract
Through imputation of genotypes, genome‐wide association study (GWAS) and genomic prediction (GP) using whole‐genome sequencing (WGS) data are cost‐efficient and feasible in aquaculture breeding schemes. The objective was to dissect the genetic architecture of growth traits under chronic heat stress in rainbow trout (Oncorhynchus mykiss) and to assess the accuracy of GP based on imputed WGS and different preselected single nucleotide polymorphism (SNP) arrays. A total of 192 and 764 fish challenged to a heat stress experiment for 62 days were genotyped using a customized 1 K and 26 K SNP panels, respectively, and then, genotype imputation was performed from a low‐density chip to WGS using 102 parents (36 males and 66 females) as the reference population. Imputed WGS data were used to perform GWAS and test GP accuracy under different preselected SNP scenarios. Heritability was estimated for body weight (BW), body length (BL) and average daily gain (ADG). Estimates using imputed WGS data ranged from 0.33 ± 0.05 to 0.55 ± 0.05 for growth traits under chronic heat stress. GWAS revealed that the top five cumulatively SNPs explained a maximum of 0.94%, 0.86% and 0.51% of genetic variance for BW, BL and ADG, respectively. Some important functional candidate genes associated with growth‐related traits were found among the most important SNPs, including signal transducer and activator of transcription 5B and 3 (STAT5B and STAT3, respectively) and cytokine‐inducible SH2‐containing protein (CISH). WGS data resulted in a slight increase in prediction accuracy compared with pedigree‐based method, whereas preselected SNPs based on the top GWAS hits improved prediction accuracies, with values ranging from 1.2 to 13.3%. Our results support the evidence of the polygenic nature of growth traits when measured under heat stress. The accuracies of GP can be improved using preselected variants from GWAS, and the use of WGS marginally increases prediction accuracy.
Keywords: accuracy, genomic predictions, GWAS, heat stress, rainbow trout, whole‐genome sequence
1. INTRODUCTION
Climate change, including rising sea levels, changes in water temperatures and increasing frequency and severity of extreme events, will affect fisheries and aquaculture in different ways (Shelton, 2014). The increase in water temperature is one of the most concerning climate change‐related threats for global cold‐water aquaculture species (Callaway et al., 2012; Shelton, 2014). It is expected that aquaculture will face significant challenges, which may affect the stability and sustainability of this business (Callaway et al., 2012). Aquaculture breeding programmes have been extensively focused on the enhancement of growth rate in different species that directly contribute to increased production, but the current fish broodstocks used for aquaculture purposes are adapted to the prevailing environmental conditions and may be suboptimal under future conditions (Sae‐Lim et al., 2017).
Rainbow trout have a narrow optimal temperature that ranges from 12°C to 18°C, with 25°C the upper limit for suitable trout rearing (Raleigh, 1984). Adaptability to increased temperature levels is a result of natural (Chen & Narum, 2020; Chen et al., 2015) and artificial selection (Ineno et al., 2005). In previous studies, performance under increased thermal stress was evaluated in different rainbow trout populations. The presence of additive genetic variation for heat tolerance and growth under heat stress, with heritability values ranging from 0.24 to 0.41 and temperatures from 10°C to 25.7°C (Gallardo‐Hidalgo et al., 2020; Janhunen et al., 2016; Perry et al., 2005), indicates that it is possible to genetically improve these traits in rainbow trout. However, if growth under thermal stress is included in the breeding goal, the phenotypes can only be measured by means of sib testing, and not directly on the selection candidates, similar to disease resistance and carcass quality traits. Thus, genomic information is key for the identification of the genetic architecture and loci involved in the effect of increased thermal stress on growth rate. Genomic tools already available for rainbow trout can be used to better understand the molecular basis and incorporation of genomic information for selective breeding of more robust rainbow trout to future environmental changes (Lhorente et al., 2019).
Genome‐wide association studies (GWASs) are commonly used to dissect the genetic architecture of disease resistance (Correa et al., 2016; Geng et al., 2015; Rodríguez et al., 2019; Tsai et al., 2016; Yáñez et al., 2019) and growth‐related traits (Gonzalez‐Pena et al., 2016; Gutierrez et al., 2015; Reis Neto et al., 2019; Tsai et al., 2015; Wringe et al., 2010; Yoshida et al., 2017) in different aquaculture species. The polygenic genetic architecture of some economic traits was observed, with no major single nucleotide polymorphism (SNP) surpassing the genome‐wide significance threshold and many markers explaining a small proportion of the genetic variance. The use of whole‐genome sequence (WGS) data is expected to improve the detection of quantitative trait loci (QTLs), because such data should contain most causal mutations, providing a much higher resolution (Sanchez et al., 2017; Van Den Berg et al., 2019). However, it is expensive to sequence a large number of animals; therefore, genotype imputation from low density to WGS would be a cost‐effective approach. Using WGS as a reference population, studies have reported an imputation accuracy higher than 0.80 for cattle (Bouwman & Veerkamp, 2014; Fernandes Júnior et al., 2021) and pigs (Van Den Berg et al., 2019).
Information from thousands of markers can be incorporated into genetic evaluations to estimate genomic breeding values (GEBVs) through genomic prediction (GP) schemes, including traits controlled by a high number of quantitative trait loci (QTLs) with small effects, such as growth‐related traits. GP strategies have revolutionized most breeding schemes globally, including aquaculture species, particularly for traits that are expensive or impossible to measure in selection candidates (Sonesson et al., 2009). Previous studies have compared the use of GP with the conventional pedigree‐based best linear unbiased prediction (PBLUP) for different aquaculture species, and found an increase in relative accuracy for GP, independent of the trait, SNP density or statistical method used (Bangera et al., 2017; Barría et al., 2018; Correa et al., 2017; Tsai et al., 2016; Yoshida, Bangera et al., 2018, Yoshida, Carvalheiro et al., 2018; Yoshida, Carvalheiro et al., 2019, Yoshida, Lhorente et al., 2019). To further increase the accuracy of GP, recent studies have suggested the use of WGS data, due to the potential incorporation of causal mutations (Ni et al., 2017; Wiggans et al., 2017). However, it has been shown that marginal or no increase in prediction accuracy is obtained when comparing the use of WGS to high‐density (HD) SNP panels in Drosophila melanogaster, cattle, chicken and simulation studies (van Binsbergen et al., 2015; Brøndum et al., 2015; Hayes et al., 2014; Heidaritabar et al., 2016; Ni et al., 2017; Ober et al., 2012; Pérez‐Enciso et al., 2015). In contrast, the prioritization of SNPs, by preselection them from WGS data, could be an option to significantly increase GP prediction accuracy (Moghaddar et al., 2019; Raymond et al., 2018; van den Berg et al., 2016).
The objectives of this study were to (i) perform a genome‐wide association study to dissect the genetic architecture, and identify molecular markers and candidate genes associated with growth traits in rainbow trout; and (ii) investigate the accuracy of genomic predictions based on imputed WGS, using different scenarios of preselected variants from GWAS for growth traits under chronic heat stress in rainbow trout.
2. MATERIALS AND METHODS
2.1. Upper‐thermal challenge test and phenotypes
In this study, we used rainbow trout from the 2016 year class of the breeding nucleus owned by Effigen S.A. A detailed description of the origin and management for the population is presented in previous studies (Barria et al., 2019; Yoshida, Carvalheiro et al., 2018, 2019). The upper‐thermal challenge was performed at Aquainnovo's Aquaculture Technology Center Patagonia, Puerto Montt, Chile. A total of 1829 animals from 119 families (average of 15 fish/family and a range from 12 to 16 fish/family) were acclimated in a single tank with fresh water for 17 days (~14°C), and then, fish were equally distributed into three tanks of 7 m3, with a similar representation of each family per tank. The temperature was increased gradually (1°C/day) until the 9th day and then kept between 18 and 22°C for 62 days. Water flow was maintained at a rate of 1 to 1.5 L per hour and the oxygen saturation in the water was kept above 80% during the experiment. The fish received two weekly treatments of seawater at 10 ppt to avoid opportunistic bacterial infections and the challenge test spanned 62 days, with mortality recorded daily. More details about the breeding programme and the upper‐thermal challenge were described by Yoshida, Bangera et al. (2018) and Gallardo‐Hidalgo et al. (2020), respectively.
We used body length (BL, in cm) and body weight (BW, in g) after the challenge as growth traits for further genetic evaluation, and the initial body length (IBL, in cm) and initial body weight (IBW, in g) at the beginning of the challenge as covariates, respectively. Additionally, we also used the average daily gain (ADG, in g) = (BW − IBW)/(final age − initial age) as the growth trait measured during the challenge test.
2.2. Genotypes and imputation to whole‐genome sequences
Genomic DNA was extracted and purified from fin clip samples of 956 fish using the DNeasy Blood & Tissue Kit (Qiagen) according to the manufacturer's protocol. A total of 764 and 192 samples were genotyped with a customized 1 K and 26 K SNP panels (SeqSNP), respectively. The SNPs were selected from a denser SNP panel (Gao et al., 2018; Palti et al., 2015) to be evenly distributed across the Omyk_1.0 reference genome for Oncorhynchus mykiss (GenBank Assembly Accession GCA_013265735.3 USDA_OmykA_1.1). The samples were genotyped using the targeted genotyping by sequencing SeqSNP technology (Zhang et al., 2020) developed by LGC (Biosearch Technologies Genomic Analysis by LGC). Samples genotyped with both 1 K and 26 K SNP panels were sequenced using the NextSeq 500 system and 75‐bp single‐read run mode, resulting in ~137 million reads (average of ~180.5 K reads per sample) and ~660 million reads (~3.4 million reads per sample), and averaged an effective target SNPs covered of 161x and 102x for 1 K and 26 K, respectively. The final VCF file was filtered separately for the samples genotyped with the 1 K and 26 K SNP panels using Plink v1.90 (Purcell et al., 2007), and the exclusion criteria are as follows: Hardy–Weinberg equilibrium (HWE, p‐value 10−6), minor allele frequency (MAF) <0.01, and genotyping call rate for SNPs and samples of <0.70. A total of 0.37 K and ~10 K SNPs from 613 and 192 animals were retained, respectively.
Genomic DNA was extracted from fin clips of 102 parents (36 males and 66 females) from the challenged population using the DNeasy Blood & Tissue Kit (Qiagen) according to the manufacturer's instructions and submitted to the Beijing Genomics Institute (BGI, China) for whole‐genome sequencing using DNBseq technology. Raw sequencing data were aligned to the O. mykiss genome (GenBank Assembly Accession GCA_013265735.3 USDA_OmykA_1.1) consisting of 2.18 GB of total sequence comprising 1228 contigs with a contig N50 of 15.5 Mb. The Burrows–Wheeler Aligner (BWA) analysis tools (Li & Durbin, 2010) were used to map the reads of each sample to the reference genome resulting in a mapping rate of samples ranging from 97.51% to 98.16%, and effective mapping depth between 10.31x and 17.65x. For SNP calling, the standard protocol implemented in the Genome Analysis Toolkit (GATK, https://www.broadinstitute.org/gatk/) was used. The final VCF file consisted of a set of 22.6 million nonredundant variants from 102 rainbow trout. Quality control was performed with Plink v1.90 (Purcell et al., 2007) using the following thresholds: HWE (p‐value 10−8), MAF <0.01 and call rate for SNPs <0.80, retaining a total of ~3.2 million SNPs from 102 samples.
To assess the overall imputation accuracy (r 2 = squared correlation between true and imputed genotypes) and remove variants with low imputation accuracy, we randomly divided the resequenced animals into five cross‐validation sets: five exclusive reference sets with 80% of animals genotyped with ~3.2 million SNPs and validation sets with 20% of animals genotyped with 10 K SNPs masking the remaining SNPs from WGS genotypes. After imputation, a total of 1,821,336 SNPs with r 2 value greater than 0.80 were retained as the reference data set for the final imputation.
Stepwise genotype imputation was used to perform the final imputation from 613 animals genotyped with 0.37 K SNPs to 10 K SNPs using 192 animals as the reference data set (step 1), and 805 individuals (613 + 192 animals) with 10 K SNPs were imputed to ~1.8 million SNPs using 102 animals as the reference (step 2). FImpute v. 3.0 (Sargolzaei et al., 2014) was used to perform all genotype imputations. A postimputation quality control (HWE <p‐value 10−8 and MAF <0.05) resulted in a total of 1,390,748 imputed SNPs available for 850 individuals denoted as imputed WGS genotypes.
Rainbow trout sampling procedures were approved by the Comité de Bioética Animal from the Facultad de Ciencias Veterinarias y Pecuarias, Universidad de Chile (Certificate No. 19270‐VET‐UCH).
2.3. Genome‐wide association analysis
The GWAS was performed using the weighted single‐step genomic best linear unbiased prediction (wssGBLUP) method (Wang et al., 2012) implemented in BLUPF90 family programmes (Misztal et al., 2018). The following model was used:
| (1) |
where is a vector of phenotypes (ADG, BL or BW); β is a vector of tank as fixed effect for all traits and body length and body weight at initial challenge test for BL and BW as covariate, respectively; a is a vector of additive genetic effects that follows a normal distribution , where is the additive variance and H is the kinship matrix (Aguilar et al., 2010); and are incidence matrices for β and a effects, respectively; and is the vector of random error with a distribution , where is the identity matrix and is the residual variance. In the wssGBLUP, the pedigree relationship matrix A−1 is replaced by matrix H−1 (Aguilar et al., 2010), which combines genotype and pedigree relationship coefficients:
| (2) |
where is the inverse of a pedigree‐based relationship matrix for genotyped animals and is the inverse genomic relationship matrix. In the wssGBLUP, the marker variances were estimated from allele frequencies and used as weights, which were updated at each iteration (Wang et al., 2014). In the first iteration, all weights assumed an initial value of one, which corresponds to the single‐step genomic BLUP (ssGBLUP, Figure S1) method (Misztal et al., 2009). As suggested by Wang et al. (2012) and Zhang et al. (2016), we used the second iteration of wssGBLUP to get final SNP effect estimates. For GWAS analysis, we included all animals imputed to WGS, all the phenotyped fish present in Table 1, and pedigree information from 115,647 animals.
TABLE 1.
Descriptive statistics for growth‐related traits under chronic upper‐thermal stress in rainbow trout
| Traits | N | Mean | Min | Max | SD | CV (%) |
|---|---|---|---|---|---|---|
| Genotyped animals | ||||||
| Age (days) | 805 | 544 | 529.00 | 553.00 | 7.89 | 1.45 |
| ADG (g) | 805 | 3.40 | −0.11 | 7.84 | 1.26 | 22.76 |
| BL (cm) | 804 | 29.58 | 18.00 | 41.30 | 2.24 | 7.56 |
| BW (g) | 805 | 409.42 | 165.00 | 645.00 | 93.17 | 36.98 |
| Phenotyped animals | ||||||
| Age (days) | 1024 | 536 | 473.00 | 563.00 | 17.04 | 3.18 |
| ADG (g) | 1024 | 3.17 | −1.51 | 9.80 | 1.33 | 25.58 |
| BL (cm) | 1024 | 28.61 | 19.00 | 41.30 | 2.50 | 8.74 |
| BW (g) | 1024 | 370.44 | 136.00 | 636.00 | 94.74 | 41.96 |
| ALL | ||||||
| Age (days) | 1829 | 539 | 473.00 | 563.00 | 14.34 | 2.66 |
| ADG (g) | 1829 | 3.27 | −1.51 | 9.80 | 1.30 | 24.77 |
| BL (cm) | 1828 | 29.04 | 18.00 | 41.30 | 2.44 | 8.39 |
| BW (g) | 1829 | 387.60 | 136.00 | 645.00 | 96.00 | 39.84 |
Abbreviations: ADG, average daily gain; BL, body length; BW, body weight.
The top five SNPs that explain the largest proportion of genetic variance for each trait were selected as the lead SNP and used to search for candidate genes based on a window within 100 kb upstream and downstream of each lead SNPs to be considered putative candidate genes associated with the trait. The gene search was performed using BLAST (Basic Local Alignment Search Tool) against the Oncorhynchus mykiss reference genome (Omyk_1.0, GenBank Assembly Accession GCA_002163495.1).
2.4. Genetic parameters and heritability
The total additive genetic variance () and residual variance () were estimated using the kinship matrices A and H for pedigree‐based BLUP (PBLUP) and ssGBLUP using imputed WGS, respectively. The following equation was used to compute the heritability for each growth‐related trait:
| (3) |
2.5. Genomic prediction
Genomic prediction was evaluated using four different scenarios with different SNP densities and strategies for marker selection. The objective was to test the best scenario in terms of accuracy of prediction. In the WGS scenario (WGS), all available markers from imputed WGS genotypes were used. The 50 K pruned scenario (50K_pruned) was selected to produce a subset of markers proportionally distributed across the genome according to chromosome size, as evenly spaced as possible and in similar levels of linkage disequilibrium (LD) with each other SNP (Cleveland & Hickey, 2014). Thus, the SNPs were selected based on the option ‐‐indep‐pairwise of Plink v1.90 software (Purcell et al., 2007) using the following parameters: a window size of 40 kb, a step of one SNPs and a variable linkage disequilibrium according to the chromosome. Additionally, the GWAS results were used to select the most important 50 K and 1 K SNPs based on the descending order of the estimated genetic variance explained by each SNP from wssGBLUP analysis per trait (scenario 50K_wssGBLUP and 1K_wsGBLUP). To reduce the potential biases in accuracy of genomic prediction in these scenarios, the GWAS analysis to preselected SNPs was based on five repetitions of a fivefold cross‐validation scheme to estimate SNP effects.
We used the BLUPF90 family of programmes (Misztal et al., 2018) to perform the genetic evaluations using pedigree‐based information (PBLUP) and the genomic relationship matrix BLUP (GBLUP) (VanRaden, 2008). The statistical models fitted were the same as Equation 1, except for the vector a of random additive genetic polygenic effects that follows a normal distribution or , for, respectively, pedigree relationship matrix A in PBLUP and genomic relationship matrix G in GBLUP, as described by VanRaden (2008).
The predictive abilities of pedigree‐ and genomic‐based models were assessed using the same subgrouping of the fivefold cross‐validation used to select the most important SNPs in scenarios 50K_wssGBLUP and 1K_wsGBLUP. All genotyped and phenotyped animals (n = 805) were randomly divided into five exclusive data sets, determined one at a time, where 80% of the animals were used as the training data set to estimate the SNP effects, and the phenotypes of the remaining 20% of the animals were masked and used as the validation set.
To evaluate the performance of each scenario and model, the accuracies were measured in the validation sets using the following equation (Ødegård et al., 2014):
| (4) |
where is the correlation between the EBV or GEBV of a given model (predicted for the validation set using information from the training set) and the phenotype, while is the square root of heritability.
3. RESULTS
3.1. Phenotypes, genotypes and genetic parameters
A total of 1829 fish were phenotyped, and 805 were genotyped. The average age was 539 days at the end of the challenge for all phenotyped fish, the ADG was 3.3 g (SD = 1.3 g), BL was 29 cm (SD = 2.4 cm) and BW was 388 g (SD = 96 g) (Table 1).
For WGS genotype data, the call‐rate parameter excluded the highest number of SNPs (~16.8 million), and for 26 K and 1 K SNP panels ~3.3 K and 94 SNPs were discarded, respectively (Table 2). The HWE filtered the lower number of markers: 40 from the 1 K SNP panel and ~638.6 K from WGS. All fish samples passed call‐rate quality control for WGS data and 26 K SNP panel. For the 1 K SNP panel, 613 samples remained for final analysis.
TABLE 2.
Summary results from genotype quality control of whole‐genome sequence (WGS) data, imputed WGS data, and 26 K and 1 K single nucleotide polymorphism (SNP) panels for rainbow trout
| Parameters | Genotype data sets | |||
|---|---|---|---|---|
| WGSa | Imputed WGSb | 26Kc | 1Kc | |
| Initial samples | 102 | 102 | 192 | 764 |
| Initial SNPs | 22,649,022 | 1,821,336 | 26,000 | 1000 |
| Minor allele frequency | 2,045,912 | 245,564 | 12,520 | 496 |
| Call rate | 16,771,535 | – | 3358 | 94 |
| Hardy–Weinberg equilibrium | 638,649 | 185,024 | 364 | 40 |
| Final samples | 102 | 102 | 192 | 613 |
| Final SNPs | 3,192,926 | 1,390,748 | 9758 | 370 |
Minor allele frequency (MAF) <0.01, call rate <0.80 and Hardy–Weinberg equilibrium (HWE) <1e−8.
MAF <0.05 and HWE <1e−8.
MAF <0.01, call rate <0.70 and HWE <1e−6.
A uniform MAF distribution and a right‐skewed distribution were observed for imputed WGS genotypes (MAF average = 0.23) and the 50K_pruned scenario (MAF average = 0.21), respectively (Figure S2). In contrast, for both 50K_wssGBLUP and 1K_wssGBLUP, for all growth traits, the MAF histograms showed a left‐skewed distribution (Figures [Link], [Link], [Link]). The distribution of 50K_wssGBLUP MAF is similar among the traits, considering the average of five repetitions of a fivefold cross‐validation scheme more than 75% of SNPs presented MAF value higher than 0.27, and a mean value of 0.34, whereas the MAF distribution of SNPs in 1K_wssGBLUP scenarios differed from 50K_wssGBLUP due to the absence of SNPs with MAF lower than 0.12, a larger number of SNPs with MAF higher than 0.31, and mean MAF higher than 0.37.
The additive genetic variance and heritability were slightly higher when using the pedigree‐based method compared with the imputed WGS. For instance, heritability values using PBLUP and ssGBLUP, respectively, were 0.40 and 0.36 for ADG, 0.39 and 0.33 for BL, and 0.59 and 0.55 for BW, with a reduction in the standard error of heritability for ssGBLUP compared with PBLUP (Table 3).
TABLE 3.
Estimates of variance components and heritability values for growth traits in rainbow trout estimated by pedigree‐based BLUP (PBLUP) and single‐step GBLUP (ssGBLUP)
| Traits |
|
|
h 2 |
|
|
h 2 | ||||
|---|---|---|---|---|---|---|---|---|---|---|
| PBLUP | ssGBLUP | |||||||||
| ADG | 0.703 | 1.053 | 0.400 (0.065) | 0.623 | 1.131 | 0.355 (0.053) | ||||
| BL | 1.738 | 2.753 | 0.387 (0.065) | 1.447 | 2.975 | 0.327 (0.054) | ||||
| BW | 5935.10 | 4049.80 | 0.594 (0.074) | 5525.20 | 4557.10 | 0.548 (0.055) | ||||
Abbreviations: ADG, average daily gain; BL, body length; BW, body weight.
: additive genetic variance; : residual variance; h 2: heritability (standard error).
3.2. Genome‐wide association analysis
Manhattan plots for the proportion of genetic variance explained by each SNP estimated using imputed WGS data for growth‐related traits under chronic thermal stress are shown in Figure 1. After the second iteration of wssGBLUP, the top five SNPs explained a total genetic variance ranging from 0.51 to 0.95% (Table 4).
FIGURE 1.
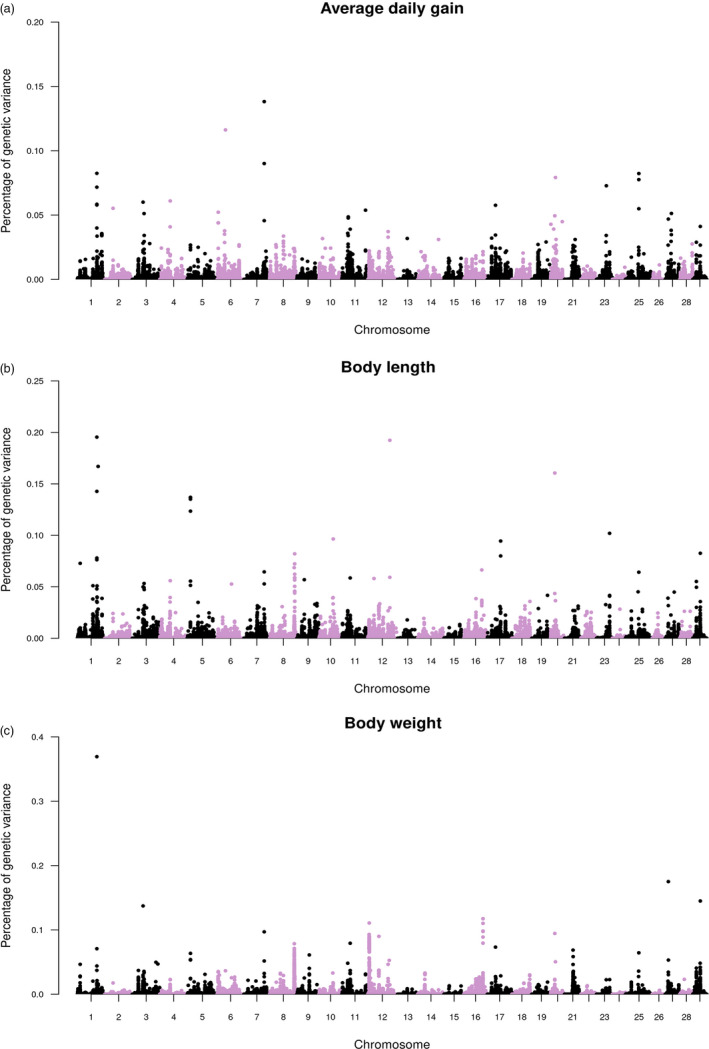
Manhattan plot of percentage of genetic variance explained by each SNP using the wssGBLUP approach for (a) average daily gain, (b) body length and (c) body weight under chronic upper‐thermal stress in rainbow trout
TABLE 4.
Top five ranked SNPs explaining the largest proportion of genetic variance and the closest candidate genes associated with growth‐related traits under chronic upper‐thermal stress based on wssGBLUP in rainbow trout
| Chra | Position | Pvarb | Candidate genesc |
|---|---|---|---|
| Average daily gain | |||
| 07 | 62669267 | 0.1382 | RHOA, CISH, FBXO42, SLC25A34, TMEM82, SPEN, GDI1, TWF2, RPUSD1, QRICH1, TMCC1, LOC110528409, LOC110528419, LOC110527144 |
| 06 | 25326130 | 0.1162 | LOC110525677d, UBE2D4, TCF7L1B, TGOLN2, ZGC:153044 |
| 07 | 62654174 | 0.0901 | PRKAR2Ad, CISH, RHOA, FBXO42, SLC25A34, TMEM82, SPEN, GDI1, TWF2, RPUSD1, QRICH1, TMCC1, LOC110528409, LOC110527144, LOC110528419 |
| 01 | 59530229 | 0.0824 | DNTTd |
| 25 | 40665614 | 0.0823 | – |
| Body length | |||
| 01 | 59514997 | 0.1954 | DNTTd |
| 12 | 67283722 | 0.1923 | STAT5Bd, STAT3, PLCL2, LOC110538193, LOC110538955 |
| 01 | 63435956 | 0.1669 | PYGB, ABHD12, APMAP, ACSS1, VSX1, ENTPD6, BANF1 |
| 20 | 12073241 | 0.1605 | FRA10AC1d, RBP4, MYOF, PLCE1, SLC35G1, LGI1, CEP55L, NUDT13, PDE6C |
| 01 | 59513201 | 0.1427 | DNTTd, BLNK |
| Body weight | |||
| 01 | 59513201 | 0.3693 | DNTTd, BLNK |
| 27 | 9075818 | 0.1751 | IRF2BP2e, POLR1Gd, PRX, PLD3, FOXA2, NOVA1, GPR4, HIPK4, LOC110507470, LOC110507475 |
| 29 | 22572225 | 0.1449 | SMYD1, FABP1, PRRC2B, EDF1, LZTS3, FASTKD5, DQX1, SPR, LOC110509833, LOC110509836, LOC110509837 |
| 03 | 33016645 | 0.1373 | – |
| 16 | 58446630 | 0.1174 | SLC17A9d, TASOR, ASB14B, DNAH12, RPS23, GID8, BIRC7, YTHDF1, LOC110492512 |
Chromosome.
Percentage of genetic variance.
Based on Omyk_1.0 as reference genome for Oncorhynchus mykiss.
Gene intercepted by SNP on intronic region.
Gene intercepted by SNP on exonic region.
Some genes were found to be intercepted by the top five SNPs for each growth traits, located in exonic or intronic regions (Table 4), as cAMP‐dependent protein kinase type II‐alpha regulatory subunit (PRKAR2A) for ADG: signal transducer and activator of transcription 5B (STAT5B) for BL, and RNA polymerase I subunit G (POLR1G), interferon regulatory factor 2‐binding protein 2 (IRF2BP2) and solute carrier family 17 member 9 (SLC17A9) for BW. A top SNP for ADG and BW, and two top SNPs for BL on Omy01 intercept the gene DNA nucleotidylexotransferase (DNTT or TDT) on intronic regions. Also, some biologically relevant genes located within 100 kb upstream and downstream of each top five SNP are available in Table 4. These genes are potential candidate genes associated with growth‐related traits under chronic thermal stress, including ras homolog family member A (RHOA) and cytokine‐inducible SH2‐containing protein (CISH) both located on chromosome Omy07, and associated with ADG. For BL, we identified signal transducer and activator of transcription 3 (STAT3) on Omy12, glycogen phosphorylase brain form (PYGB) and lysophosphatidylserine lipase ABHD12 (ABHD12) both on Omy01, and retinol‐binding protein 4 (RBP4) and myoferlin (MYOF) on Omy20. Both the fatty acid‐binding protein (FABP1) and histone‐lysine N‐methyltransferase Smyd1 (SMYD1) on Omy29 were associated with BW.
3.3. Prediction accuracy
The summary statistics and sum of the proportion of genetic variance captured by each marker were estimated separately for each trait in different scenarios based on wssGBLUP (Table 5). The 50K_pruned scenario resulted in the lowest sum of the proportion of genetic variance captured by the selected SNPs, with sum values ranging from 10.2% to 14.2% for ADG and HW, respectively. In contrast, the selection of the most important 50K_wssGBLUP SNPs captured more than 78% of the proportion of genetic variance, while the 1K_wssGBLUP SNPs captured at least 15.4%, but notably increased the mean of the percentage of genetic variance explained, for example from 0.0016 to 0.0154 in 50K_wssGBLUP and 1K_wssGBLUP scenarios, respectively for ADG.
TABLE 5.
Summary statistics for the percentage of genetic variance explained by SNPs selected in each genotype scenario for growth‐related traits under chronic upper‐thermal stress in rainbow trout
| Genotype scenarios | Traits | Suma | Mean | Min | Max |
|---|---|---|---|---|---|
| Percentage of genetic variance | |||||
| 50K_pruned | ADG | 10.18 | 0.0002 | 0.0000 | 0.1382 |
| BL | 11.60 | 0.0002 | 0.0000 | 0.1954 | |
| BW | 14.23 | 0.0003 | 0.0000 | 0.3693 | |
| 50K_wssGBLUP | ADG | 78.26 | 0.0016 | 0.0004 | 0.3806 |
| BL | 80.97 | 0.0016 | 0.0003 | 0.3603 | |
| BW | 87.33 | 0.0017 | 0.0002 | 0.4931 | |
| 1K_wssGBLUP | ADG | 15.44 | 0.0154 | 0.0078 | 0.3806 |
| BL | 18.63 | 0.0186 | 0.0090 | 0.3603 | |
| BW | 24.70 | 0.0247 | 0.0101 | 0.4931 | |
Abbreviations: ADG, average daily gain; BL, body length; BW, body weight.
Sum of the estimated genetic variance captured in descending order for each genotype subset.
Based on the five repetitions of fivefold cross‐validation, the prediction accuracy for GEBV from genomic methods outperformed the accuracy for EBV from PBLUP, independent of the genotype scenario (Figure 2a,b). The accuracy of predicted GEBV was slightly higher for WGS and 50K_pruned than for PBLUP, with values ranging from 3.12% to 4.59% and 1.29% to 4.87%, respectively. Compared to PBLUP, the relative increase in accuracy for 50K_wssGBLUP was at least 10.1% for all traits and ranged from 1.2 to 11.2% for 1K_wssGBLUP (Figure 2b). For ADG and BW, the accuracy values were similar for both 50K_wssGBLUP and 1K_wssGBLUP, whereas for BL, the accuracy was considerably higher for 50K_wssGBLUP compared with 1K_wssGBLUP.
FIGURE 2.
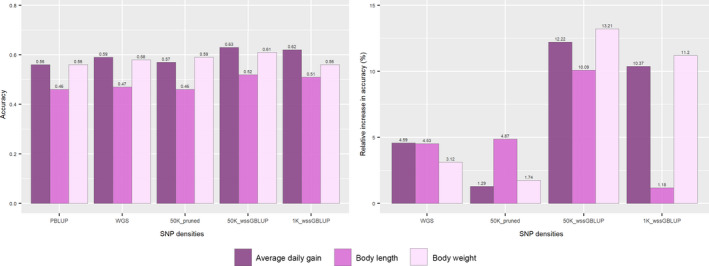
(a) Accuracy of selection using pedigree BLUP (PBLUP), whole‐genome sequence (WGS) and different densities of genotype subsets (50K_pruned, 50K_wssGBLUP and 1K_wssGBLUP). (b) Relative increase in accuracy (%) of genomic selection using imputed WGS and different densities of genotype subsets (50K_pruned, 50K_wssGBLUP and 1K_wssGBLUP) compared with PBLUP for growth traits under chronic upper‐thermal stress in rainbow trout
4. DISCUSSION
4.1. Phenotypes and genetic parameters
Salmonids have adapted to cold water and, in the case of rainbow trout, are optimally reared at temperatures up to 20°C (Mäkinen, 1994; Wurtsbaugh & Davis, 1977). A lower feed intake, faster growth and better feed conversion ratio at lower temperature (14°C and 15°C) compared with high temperature (20°C) were reported by Janhunen et al. (2016) and Codabaccus et al. (2013) in rainbow trout. The optimum temperature for growth performance is 17°C with a fast decline in growth rate at temperatures higher than 20°C (Mäkinen, 1994; Wurtsbaugh & Davis, 1977). Furthermore, the water temperature must be considered an important parameter in meat quality. There is higher adipose deposition when fish are reared at high temperatures (>18°C) and fatty acid bioconversion capacity is reduced (Johnston et al., 2000; Mellery et al., 2016).
However, rainbow trout can adapt to increased temperatures as a result of natural (Chen et al., 2015) or artificial selection (Ineno et al., 2005), suggesting the presence of additive genetic variation for thermal tolerance in trout populations. A rainbow trout strain that can feed actively and grow normally at 24°C was established after 14 generations of selection at Miyazaki Prefecture in Japan (Ineno et al., 2005). In addition, a recent study compared growth rate of rainbow trout exposed to an upper‐thermal challenge (between 20°C and 22°C) to fish reared at lower temperatures (approximately 7°C), and a significant difference of ~100 g (t test; p < 0.05) was found in favor of fish reared at increased temperatures (Gallardo‐Hidalgo et al., 2020). They also reported the heritability of 0.41 (±0.15) for body weight using PBLUP for fish under increased thermal challenge and 0.59 (±0.17) for fish at low water temperature conditions. The genetic correlation was 0.76 (±0.07) between these two traits. The authors suggested that in both temperature conditions there was significant genetic variation with a slight effect of heat stress in the quantitative genetic basis of growth traits in this particular population of rainbow trout. In addition, in some studies where rainbow trout were evaluated under normal water temperature conditions, the estimated heritability values for growth traits using a pedigree‐based method ranged from 0.35 to 0.43 (Janhunen et al., 2016; Leeds et al., 2016), whereas estimated heritability using genomic information was reported to range from 0.30 to 0.62 (Ali et al., 2020; Gonzalez‐Pena et al., 2016; Reis Neto et al., 2019). Our heritability estimates are within the range of values previously reported, suggesting a significant additive genetic variation for growth traits under chronic heat stress in rainbow trout.
4.2. GWAS analysis
Growth‐related traits including body weight and average daily gain are among the most important economic traits in selective breeding for aquaculture species. Genetic improvement, by means of artificial selection, can reduce time and cost to produce market‐size fish. However, these traits are complex in nature and are generally controlled by several genes (Goddard & Hayes, 2009). Dissecting the genetic architecture of the target traits is important to define the best genomic methods to apply in commercial breeding programmes (i.e. genomic selection or marker‐assisted selection). Most GWASs have identified the polygenic nature of growth traits in fish, as in Atlantic salmon (Gutierrez et al., 2015; Tsai et al., 2015; Yoshida et al., 2017), rainbow trout (Gonzalez‐Pena et al., 2016; Reis Neto et al., 2019; Wringe et al., 2010), Nile tilapia (Yoshida, Carvalheiro et al., 2019, Yoshida, Lhorente et al., 2019; Yoshida & Yáñez, 2020) and catfish (Li et al., 2018). We increased the number of variants from low density to 1.39 million SNPs through genotype imputation aimed to achieve a better GWAS resolution. The use of imputed SNPs to WGS in cattle was effective at detecting significant peaks not previously found when high‐density chip was used in GWAS analyses (Sanchez et al., 2020; Wang et al., 2020), but in our case, no significant SNP was found when we used the ssGBLUP method (Figure S1). Furthermore, we found numerous markers in almost all chromosomes explaining a small percentage of the genetic variance through wssGBLUP (Figure 1a–c), with no evidence of major QTL for the three growth traits studied here in rainbow trout. Thus, our results support the evidence of the polygenic architecture of these traits.
Based on the top five SNPs that explained the highest proportion of genetic variance, we found several genes that could potentially be involved in ADG, BL and BW. For instance, two SNPs associated with ADG and located in Omy07 were found to be close to the RHOA and CISH genes. The RHOA gene has been shown to mediate transforming growth factor‐β (TGF‐β) activity, a potent regulator of cell growth and differentiation in many cell types (Chen et al., 2006). RHOA signalling is critical to TGF‐β‐induced smooth muscle cell differentiation (Chen et al., 2006) and is important for the regulation of cytoskeletal dynamics in numerous cell types (Tzima, 2006). microRNA 133 (miR133) negatively interacts with RHOA, affecting skeletal muscle functions in pearl oyster (Pinctada martensii) (Zheng et al., 2016), whereas the upregulation of CISH in white muscle was reported in a selectively bred line for fast growth in rainbow trout (Cleveland et al., 2020), suggesting that the expression of CISH was induced by immune stimulants and is a negative feedback regulator of growth hormone (GH) signalling (Maehr et al., 2014).
The second most important SNP associated with BL was found on Omy12, in an intronic region of STAT5B and close to the STAT3 gene. STAT5B is suggested to be an important modulator of GH, GH receptor, insulin‐like growth factor I (IGF‐I), prolactin and the insulin signalling pathway, which are involved in growth and reproduction traits (Ji et al., 1999; Kloth et al., 2002; Sadeghi et al., 2012; Woelfle et al., 2003). Mutations in the STAT5B gene may result in primary IGF‐I deficiency and GH insensitivity (Rosenfeld et al., 2007). In chicken, two SNPs in STAT5B were found to be associated with early body weight and egg weight, suggesting a promising marker for use in marker‐assisted selection in this species (Sadeghi et al., 2012). In Nile tilapia, the overexpression of STAT5B can neutralize the effects of GH overexpression, suggesting the partial role of STAT5B on the deleterious effects of GH overexpression observed in genetically selected fish (Marins et al., 2002).
The requirement of STAT5B for sexual dimorphism of body growth rate was reported in mice and zebrafish (Huang et al., 2018; Udy et al., 1997; Zhang et al., 2012). The disruption of STAT5B affects the expression of a subset of sex‐dependent genes in the liver of male zebrafish, compared with female, reducing the number of male‐ and female‐biased genes in STAT5B mutant zebrafish. Significant growth inhibition was observed when targeting the STAT3 gene using antisense oligonucleotides directed against the translation initiation site (Rubin Grandis et al., 1998). In juvenile STAT3 mutant zebrafish, a dramatic alteration in the number of genes involved in immune and infection response, skeletal development, somatic cell growth and downregulated expression of the collagen gene family was observed. In addition, STAT3 mutant zebrafish showed severe lateral and vertical curvature of the spine, spine fracture and incomplete bone joints with a narrower junction between vertebrae at an early juvenile stage (Xiong et al., 2017).
On Omy20, a SNP associated with BL was found close to both RBP4 and MYOF. RBP4 is involved in the regulation of insulin and insulin resistance, which would affect fetal growth (Chan et al., 2011; Yang et al., 2020). Zebrafish exposed to aromatase inhibitor prochloraz presented significantly downregulated mRNA expression of RBP4 and changed protein concentrations related to mitochondrial energy metabolism in ova, leading to the subsequent decrease in body length of larval offspring (Dang et al., 2018). In Berkshire pigs, RBP4 was suggested to be a candidate gene for production traits, due to its significant effect on ADG and back fat thickness (Do et al., 2012). In addition, the presence of two SNPs in RBP4 might negatively influence the birth weight, BW and ADG in 6‐ and 12‐month‐old Chinese cattle (Wang et al., 2010).
MYOF is important for muscle development and regeneration, and might reduce muscle mass and MYOF null mice suggesting a defect in muscle growth similar to that produced from manipulation of IGF‐I or its receptor (Doherty et al., 2005). MYOF is a critical mediator of postnatal muscle growth mediated by IGF‐I in mice, and the loss of functional MYOF can retard muscle growth, by a IGF‐I nonresponse (Demonbreun et al., 2010). In grass carp (Ctenopharyngodon idellus), MYOF, along with other genes, may play an important role in muscle hardening (Larsson et al., 2012; Xu et al., 2020; Yu et al., 2014).
We found a SNP associated with BW on Omy27 intercepting an exonic region of the IRF2BP2 gene. This gene is a skeletal and cardiac muscle‐expressed ischaemia‐inducible activator of vascular endothelial growth factor A (VEGFA) that may contribute to revascularization of ischaemic cardiac and skeletal muscles (Teng et al., 2010). IRF2BP2 controls osteoclast and osteoblast differentiation via Kruppel‐like factor 2 (KLF2) in mice (Kim et al., 2019). SMYD1 found on Omy29 is also associated with BW and plays a role in myogenesis. Deletion of SMYD1 impaired myoblast differentiation resulting in fewer myofibres and decreased expression of muscle‐specific genes in zebrafish (Nagandla et al., 2016). In Xenopus laevis, the expression of SMYD1 is necessary for muscle cell formation (Kawamura et al., 2008).
Some SNPs were found in intronic regions of PRKAR2A, DNTT, FRA10AC1, POLR1G and SLC17A9 genes (Table 4). The function of these genes has not been clearly reported to be involved with growth‐related traits; therefore, the function of the associated SNPs and genes must be better characterized in salmonids. PRKAR2A has been associated with some types of cancer, such as lung adenocarcinoma (Bidkhori et al., 2013), breast, colorectal and various human nonendocrine cancers (Vincent‐Dejean et al., 2008). Three different SNPs on chromosome Omy01 intercepted the DNTT gene, that is associated with DNA repair and the random addition of a small number of nucleotides to unpaired DNA regions during V(D)J recombination (Fowler et al., 2013; Sarac & Hollenstein, 2019). In mice, DNTT has been suggested to participate in memory and learning processes (Peña De Ortiz et al., 2003). SLC17A9 is thought to be a disease‐related gene associated with disseminated superficial actinic porokeratosis, a rare autosomal dominant genodermatosis (Cui et al., 2014), gastric carcinoma (Li et al., 2019) and colorectal cancer (Yang et al., 2019).
4.3. Genomic prediction
Genomic prediction is currently implemented in several aquaculture breeding programmes for different species. Previous studies reported the benefits of genomic predictions in terms of increased accuracy of selection ranging from 4% to 20% over pedigree‐based selection for growth traits (Palaiokostas et al., 2018; Tsai et al., 2015, 2017; Yoshida, Bangera et al., 2018, Yoshida, Carvalheiro et al., 2018; Yoshida, Carvalheiro et al., 2019, Yoshida, Lhorente et al., 2019). Our results show that the use of genomic information for estimating breeding values increased accuracy from 1.18% to 13.21% compared with only using pedigree information, varying by trait and the genotype scenario (Figure 2). In addition, a slight increase in genomic prediction accuracy was observed when comparing WGS‐imputed genotyped data and the 50K_pruned scenario. In simulation studies, it was suggested that WGS data could improve the accuracy of genomic prediction by up to 31%, depending on heritability, statistical method, MAF and QTL density (Druet et al., 2014; Iheshi ulor et al., 2016). Increased predictive ability is expected due to the inclusion of most of the causal mutations in WGS data, and decreased limitation due to LD between SNPs and causal mutations in the predictions (Meuwissen & Goddard, 2010). However, as in the present study, previous works in cattle (Frischknecht et al., 2018; Hayes et al., 2014; Raymond et al., 2018; van Binsbergen et al., 2015), sheep (Moghaddar et al., 2019) and chicken (Heidaritabar et al., 2016; Ni et al., 2017) suggest none to marginal increase in genomic prediction accuracy when comparing the use of WGS vs. a dense SNP panel. This supports the hypothesis that whole‐genome sequence data for genomic prediction may be unnecessary for genomic prediction.
There are plausible explanations for the results of genomic prediction using WGS data. First, when WGS data are used most of the SNPs are in LD with a large number of noncausal mutations, which do not allow for the capture of genetic variance in genomic regions that control the target trait (Van Den Berg et al., 2017; van Binsbergen et al., 2015). Second, the genotype imputation may generate some false‐positive associations. The redundant information for two or more SNPs in high LD may generate noise (Song et al., 2019) affecting the accuracy of genomic prediction (van Binsbergen et al., 2015). Furthermore, the accuracy of imputation can be low for some chromosomes or regions, due to incorrect anchoring of SNPs or errors in the physical map, which can reduce the detection of causal mutations and affect the accuracy of prediction (Dufflocq et al., 2019; Yoshida, Bangera et al., 2018, Yoshida, Carvalheiro et al., 2018). Or third, the small number of animals in the training set for genomic prediction is not enough to estimate the SNP effects and achieve the highest accuracies. For high densities SNP chips, the accuracy of genomic prediction would keep increasing as the number of records increases, making the use of large data sets to estimate the markers effects necessary to fully take advantage of high‐density SNPs (Meuwissen, 2009).
We also created a 50K_pruned scenario, in which SNPs are in approximated LD with each other, and two other scenarios which incorporated only the most important SNPs selected a priori from WGS imputed data. SNPs were chosen based on the level of genetic variance explained for each of the three traits, better exploiting the potential direct or indirect relationship with causal mutations. Our results demonstrate that 50K_pruned is actually a selection of WGS imputed data with 10% to 14% of genetic variance explained, and much lower average and minimum value of percentage of genetic variance compared with 50K_wssGBLUP. These results suggest that the pruned selection of a 50 K SNP panel leads to the inclusion of SNPs with importance equal or near zero (Table 4), generating noise that ultimately affects the accuracy of genomic prediction. In contrast, genomic prediction accuracies increased when using the 50K_wssGBLUP and 1K_wssGBLUP scenarios, compared with WGS imputed data, 50K_pruned and PBLUP. Similar results were found in real and simulated data for dairy cattle and sheep (Moghaddar et al., 2019; Raymond et al., 2018; van den Berg et al., 2016), reinforcing that the use of SNPs in LD with potential causal loci was more efficient in genomic prediction than the use of all markers together or randomly selected SNPs. Using a similar approach to preselect SNPs from GWAS performed with WGS data, Song et al. (2019), Calus et al. (2016), Veerkamp et al. (2016) and Lu et al. (2020) reported no increase in accuracy of genomic predictions for pig, dairy cattle or Japanese flounder (Paralichthys olivaceus), probably due to the genetic architecture of traits, limited ability to correctly estimate QTL or used more independent populations for preselected SNPs and genomic predictions. Furthermore, in some populations with small effective population size and long‐range LD, it might be difficult to increase the accuracy of genomic prediction, as in Holstein cattle (MacLeod et al., 2014) and some species and breeds, which have been under strong selection (Druet et al., 2014).
Variation in accuracy between ADG, BL and BW was expected, especially due to the different heritability values of the traits. For ADG and BW, within‐trait differences observed for the 50K_wssGBLUP and 1K_wssGBLUP scenarios were almost nonexistent. However, within‐trait differences were significantly higher for BL in 50K_wssGBLUP versus 1K_wssGBLUP. Including more genetic variants is expected to increase the fraction of genetic variation explained (Table 4), resulting in higher prediction accuracy until a plateau is reached. For both ADG and BW, a similar change in accuracy was observed when using 1K_wssGBLUP or 50K_wssGBLUP. In the case of BL, filtering the most important 1 K SNPs would not benefit accuracy. These results highlight that the SNP density needed to achieve accuracy plateaus is dependent on the scenario used to select the SNPs and the genetic architecture of the trait. Previous studies for disease resistance in aquaculture species assessed genomic prediction accuracy using low marker density, randomly selected from denser SNP panels (ranging from 27 K to 50 K) (Bangera et al., 2017; Correa et al., 2017; Yoshida, Bangera et al., 2018, Yoshida, Carvalheiro et al., 2018). Results indicate that a 3 K to 20 K SNP array is necessary to achieve similar accuracy values to those obtained when using a denser SNP panel. In the present study, selecting markers that are most likely to be in high LD with causal mutations facilitated the reduction in SNP density while maintaining the accuracy of genomic predictions close to the 50K_wssGBLUP values. Furthermore, VanRaden et al. (2011) suggested that the differences in genomic accuracy between low and high‐density SNPs may be more evident with increased sample size.
Some studies have suggested an inverse relationship between the SNP effect and allele frequencies (Abdollahi‐Arpanahi et al., 2014; Park et al., 2011). Park et al. (2011) reported that in humans about 50% of the genetic variance for height was captured by SNPs with a MAF value higher than 0.10. However, in dairy cattle the proportion of genetic variance captured using 50 K SNPs was approximately 80%, with a high proportion of QTL with moderate frequency affecting milk yield traits (Haile‐Mariam et al., 2013). In our study, the comparison between the mean MAF value for both 50 K scenarios suggested that the proportion of genetic variance is better captured by common variants than for rare variants. Furthermore, Druet et al. (2014) and Van Den Berg et al. (2016) reported that an increase in the prediction accuracy is expected for WGS data if causative mutations are primarily rare variants.
GWAS of rainbow trout using imputed WGS data confirmed the polygenic architecture of growth traits under increased thermal stress. Interestingly, we identified candidate genes related to ADG, BL or BW under increased thermal stress in rainbow trout, providing a better understanding of the molecular basis of growth under heat stress. Accuracy was not greatly improved when using imputed WGS data to perform genomic prediction compared with 50K_pruned. In contrast, a considerable increase in the accuracy of genomic predictions was observed when 50 K and 1 K SNPs were preselected based on GWAS and compared to PBLUP, WGS data and 50K_pruned. Our results may be associated with the same population used to select SNPs and for genomic predictions. Even using a cross‐validation strategy, fish from the training and validation set are probably related. Therefore, further studies using different population sets would be useful to further validate the use of preselected SNPs from GWAS for genomic predictions.
CONFLICT OF INTEREST
Both authors declare no conflict of interest.
AUTHOR CONTRIBUTIONS
GMY designed the study, performed the analyses and wrote the manuscript. JMY designed the study and contributed to the analysis. Both authors have reviewed and approved the manuscript.
Supporting information
Fig S1
Fig S2
Fig S3
Fig S4
Fig S5
ACKNOWLEDGEMENTS
We are grateful to financially supported by FONDECYT Regular (No. 1171720) and FONDECYT/CONICYT Postdoctoral Grant (No. 3190553). GMY is supported by FONDECYT/CONICYT Postdoctoral Grant (No. 3190553), and JMY is grant supported by Núcleo Milenio INVASAL funded by Chile's Government Programme, Iniciativa Cientifica Milenio from Ministerio de Economia, Fomento y Turismo. We thank Effigen S.A. for providing the rainbow trout data set.
Yoshida GM, Yáñez JM. Increased accuracy of genomic predictions for growth underchronic thermal stress in rainbow trout by prioritizing variants from GWAS using imputed sequence data. Evol Appl. 2022;15:537–552. 10.1111/eva.13240
DATA AVAILABILITY STATEMENT
The data that support the findings of this study are openly available in the Figshare Repository at https://doi.org/10.6084/m9.figshare.13482564. The Oncorhynchus mykiss reference genome is publicly available at NCBI (Omyk_1.0, GenBank Assembly Accession GCA_002163495.1, https://www.ncbi.nlm.nih.gov/genome/?term=GCA_002163495.1).
REFERENCES
- Abdollahi‐Arpanahi, R. , Nejati‐Javaremi, A. , Pakdel, A. , Moradi‐Shahrbabak, M. , Morota, G. , Valente, B. D. , Kranis, A. , Rosa, G. J. M. , & Gianola, D. (2014). Effect of allele frequencies, effect sizes and number of markers on prediction of quantitative traits in chickens. Journal of Animal Breeding and Genetics, 131(2), 123–133. 10.1111/jbg.12075 [DOI] [PubMed] [Google Scholar]
- Aguilar, I. , Misztal, I. , Johnson, D. L. , Legarra, A. , Tsuruta, S. , & Lawlor, T. J. (2010). Hot topic: A unified approach to utilize phenotypic, full pedigree, and genomic information for genetic evaluation of Holstein final score. Journal of Dairy Science, 93(2), 743–752. 10.3168/jds.2009-2730 [DOI] [PubMed] [Google Scholar]
- Ali, A. , Al‐Tobasei, R. , Lourenco, D. , Leeds, T. , Kenney, B. , & Salem, M. (2020). Genome‐wide identification of loci associated with growth in rainbow trout. BMC Genomics, 21(1), 1–16. 10.1186/s12864-020-6617-x [DOI] [PMC free article] [PubMed] [Google Scholar]
- Bangera, R. , Correa, K. , Lhorente, J. P. , Figueroa, R. , & Yáñez, J. M. (2017). Genomic predictions can accelerate selection for resistance against Piscirickettsia salmonis in Atlantic salmon (Salmo salar). BMC Genomics, 18(1), 121. 10.1186/s12864-017-3487-y [DOI] [PMC free article] [PubMed] [Google Scholar]
- Barría, A. , Christensen, K. A. , Yoshida, G. M. , Correa, K. , Jedlicki, A. , Lhorente, J. P. , Davidson, W. S. , & Yáñez, J. M. (2018). Genomic predictions and genome‐wide association study of resistance against Piscirickettsia salmonis in Coho salmon (Oncorhynchus kisutch) using ddRAD sequencing. G3: Genes, Genomes, Genetics, 8, 1183–1194. [DOI] [PMC free article] [PubMed] [Google Scholar]
- Barria, A. , Marín‐Nahuelpi, R. , Cáceres, P. , López, M. E. , Bassini, L. N. , Lhorente, J. P. , & Yáñez, J. M. (2019). Single‐step genome‐wide association study for resistance to Piscirickettsia salmonis in Rainbow Trout (Oncorhynchus mykiss). G3: Genes, Genomes, Genetics, 9, 3833–3841. 10.1534/g3.119.400204 [DOI] [PMC free article] [PubMed] [Google Scholar]
- Bidkhori, G. , Narimani, Z. , Hosseini Ashtiani, S. , Moeini, A. , Nowzari‐Dalini, A. , & Masoudi‐Nejad, A. (2013). Reconstruction of an integrated genome‐scale co‐expression network reveals key modules involved in lung adenocarcinoma. PLoS One, 8(7), e67552. 10.1371/journal.pone.0067552 [DOI] [PMC free article] [PubMed] [Google Scholar]
- Bouwman, A. C. , & Veerkamp, R. F. (2014). Consequences of splitting whole‐genome sequencing effort over multiple breeds on imputation accuracy. BMC Genetics, 15(1), 105. 10.1186/s12863-014-0105-8 [DOI] [PMC free article] [PubMed] [Google Scholar]
- Brøndum, R. F. , Su, G. , Janss, L. , Sahana, G. , Guldbrandtsen, B. , Boichard, D. , & Lund, M. S. (2015). Quantitative trait loci markers derived from whole genome sequence data increases the reliability of genomic prediction. Journal of Dairy Science, 98(6), 4107–4116. 10.3168/JDS.2014-9005 [DOI] [PubMed] [Google Scholar]
- Callaway, R. , Shinn, A. P. , Grenfell, S. E. , Bron, J. E. , Burnell, G. , Cook, E. J. , Crumlish, M. , Culloty, S. , Davidson, K. , Ellis, R. P. , Flynn, K. J. , Fox, C. , Green, D. M. , Hays, G. C. , Hughes, A. D. , Johnston, E. , Lowe, C. D. , Lupatsch, I. , Malham, S. , … Shields, R. J. (2012). Review of climate change impacts on marine aquaculture in the UK and Ireland. Aquatic Conservation: Marine and Freshwater Ecosystems, 22(3), 389–421. 10.1002/aqc.2247 [DOI] [Google Scholar]
- Calus, M. P. L. , Bouwman, A. C. , Schrooten, C. , & Veerkamp, R. F. (2016). Efficient genomic prediction based on whole‐genome sequence data using split‐and‐merge Bayesian variable selection. Genetics Selection Evolution, 48(1), 49. 10.1186/s12711-016-0225-x [DOI] [PMC free article] [PubMed] [Google Scholar]
- Chan, T.‐F. , Tsai, Y.‐C. , Wu, C.‐H. , Lee, C.‐H. , Wang, S.‐H. , & Su, J.‐H. (2011). The positive correlation between cord serum retinol‐binding protein 4 concentrations and fetal growth. Gynecologic and Obstetric Investigation, 72(2), 98–102. 10.1159/000323965 [DOI] [PubMed] [Google Scholar]
- Chen, S. , Crawford, M. , Day, R. M. , Briones, V. R. , Leader, J. E. , Jose, P. A. , & Lechleider, R. J. (2006). RhoA modulates Smad signaling during transforming growth factor‐β‐induced smooth muscle differentiation. Journal of Biological Chemistry, 281(3), 1765–1770. 10.1074/jbc.M507771200 [DOI] [PMC free article] [PubMed] [Google Scholar]
- Chen, Z. , & Narum, S. R. (2020). Whole genome resequencing reveals genomic regions associated with thermal adaptation in redband trout. Molecular Ecology, 30, 162–174. 10.1111/mec.15717 [DOI] [PubMed] [Google Scholar]
- Chen, Z. , Snow, M. , Lawrence, C. S. , Church, A. R. , Narum, S. R. , Devlin, R. H. , & Farrell, A. P. (2015). Selection for upper thermal tolerance in rainbow trout (Oncorhynchus mykiss Walbaum). Journal of Experimental Biology, 218(5), 803–812. 10.1242/jeb.113993 [DOI] [PubMed] [Google Scholar]
- Cleveland, B. M. , Gao, G. , & Leeds, T. D. (2020). Transcriptomic response to selective breeding for fast growth in rainbow trout (Oncorhynchus mykiss). Marine Biotechnology, 22(4), 539–550. 10.1007/s10126-020-09974-3 [DOI] [PubMed] [Google Scholar]
- Cleveland, M. A. , & Hickey, J. M. (2014). Practical implementation of cost‐effective genomic selection in commercial pig breeding using imputation 1. Journal of Animal Science, 91, 3583–3592. 10.2527/jas2013-6270 [DOI] [PubMed] [Google Scholar]
- Codabaccus, M. B. , Ng, W. K. , Nichols, P. D. , & Carter, C. G. (2013). Restoration of EPA and DHA in rainbow trout (Oncorhynchus mykiss) using a finishing fish oil diet at two different water temperatures. Food Chemistry, 141(1), 236–244. 10.1016/j.foodchem.2013.02.032 [DOI] [PubMed] [Google Scholar]
- Correa, K. , Bangera, R. , Figueroa, R. , Lhorente, J. P. , & Yáñez, J. M. (2017). The use of genomic information increases the accuracy of breeding value predictions for sea louse (Caligus rogercresseyi) resistance in Atlantic salmon (Salmo salar). Genetics Selection Evolution, 49(1), 15. 10.1186/s12711-017-0291-8 [DOI] [PMC free article] [PubMed] [Google Scholar]
- Correa, K. , Lhorente, J. P. , Bassini, L. , López, M. E. , Di Genova, A. , Maass, A. , Davidson, W. S. , & Yáñez, J. M. (2016). Genome wide association study for resistance to Caligus rogercresseyi in Atlantic salmon (Salmo salar L.) using a 50K SNP genotyping array. Aquaculture, 472, 61–65. 10.1016/j.aquaculture.2016.04.008 [DOI] [Google Scholar]
- Cui, H. , Li, L. , Wang, W. , Shen, J. , Yue, Z. , Zheng, X. , Zuo, X. , Liang, B. , Gao, M. , Fan, X. , Yin, X. , Shen, C. , Yang, C. , Zhang, C. , Zhang, X. , Sheng, Y. , Gao, J. , Zhu, Z. , Lin, D. , … Zhang, X. (2014). Exome sequencing identifies SLC17A9 pathogenic gene in two Chinese pedigrees with disseminated superficial actinic porokeratosis. Journal of Medical Genetics, 51(10), 699–704. 10.1136/jmedgenet-2014-102486 [DOI] [PubMed] [Google Scholar]
- Dang, Y. , Sun, Q. , Letcher, R. J. , & Liu, C. (2018). Unexpected observations: Exposure to aromatase inhibitor prochloraz did not alter the vitellogenin content of zebrafish ova but did inhibit the growth of larval offspring. Environmental Science and Technology Letters, 5(11), 629–634. 10.1021/acs.estlett.8b00486 [DOI] [Google Scholar]
- Demonbreun, A. R. , Posey, A. D. , Heretis, K. , Swaggart, K. A. , Earley, J. U. , Pytel, P. , & McNally, E. M. (2010). Myoferlin is required for insulin‐like growth factor response and muscle growth. The FASEB Journal, 24(4), 1284–1295. 10.1096/fj.09-136309 [DOI] [PMC free article] [PubMed] [Google Scholar]
- Do, C. H. , Cho, B. W. , & Lee, D. H. (2012). Study on the prolactin receptor 3 (PRLR3) gene and the retinol‐binding protein 4 (RBP4) gene as candidate genes for production traits in Berkshire pigs. Asian‐Australasian Journal of Animal Sciences, 25(2), 183–188. 10.5713/ajas.2011.11216 [DOI] [PMC free article] [PubMed] [Google Scholar]
- Doherty, K. R. , Cave, A. , Davis, D. B. , Delmonte, A. J. , Posey, A. , Early, J. U. , Hadhazy, M. , & McNally, E. M. (2005). Normal myoblast fusion requires myoferlin. Development, 132(24), 5565–5575. 10.1242/dev.02155 [DOI] [PMC free article] [PubMed] [Google Scholar]
- Druet, T. , Macleod, I. M. , & Hayes, B. J. (2014). Toward genomic prediction from whole‐genome sequence data: Impact of sequencing design on genotype imputation and accuracy of predictions. Heredity, 112(1), 39–47. 10.1038/hdy.2013.13 [DOI] [PMC free article] [PubMed] [Google Scholar]
- Dufflocq, P. , Pérez‐Enciso, M. , Lhorente, J. P. , & Yáñez, J. M. (2019). Accuracy of genomic predictions using different imputation error rates in aquaculture breeding programs: A simulation study. Aquaculture, 503, 225–230. 10.1016/J.AQUACULTURE.2018.12.061 [DOI] [Google Scholar]
- Fernandes Júnior, G. A. , Carvalheiro, R. , de Oliveira, H. N. , Sargolzaei, M. , Costilla, R. , Ventura, R. V. , Fonseca, L. F. S. , Neves, H. H. R. , Hayes, B. J. , & de Albuquerque, L. G. (2021). Imputation accuracy to whole‐genome sequence in Nellore cattle. Genetics Selection Evolution, 53(1), 27. 10.1186/s12711-021-00622-5 [DOI] [PMC free article] [PubMed] [Google Scholar]
- Fowler, K. E. , Pong‐Wong, R. , Bauer, J. , Clemente, E. J. , Reitter, C. P. , Affara, N. A. , Waite, S. , Walling, G. A. , & Griffin, D. K. (2013). Genome wide analysis reveals single nucleotide polymorphisms associated with fatness and putative novel copy number variants in three pig breeds. BMC Genomics, 14(1), 784. 10.1186/1471-2164-14-784 [DOI] [PMC free article] [PubMed] [Google Scholar]
- Frischknecht, M. , Meuwissen, T. H. E. , Bapst, B. , Seefried, F. R. , Flury, C. , Garrick, D. , Signer‐Hasler, H. , Stricker, C. , Bieber, A. , Fries, R. , Russ, I. , Sölkner, J. , Bagnato, A. , & Gredler‐Grandl, B. (2018). Genomic prediction using imputed whole‐genome sequence variants in Brown Swiss Cattle. Journal of Dairy Science, 101(2), 1292–1296. 10.3168/jds.2017-12890 [DOI] [PubMed] [Google Scholar]
- Gallardo‐Hidalgo, J. , Barría, A. , Yoshida, G. M. , & Yáñéz, J. M. (2020). Genetics of growth and survival under chronic heat stress and trade‐offs with growth‐ and robustness‐related traits in rainbow trout. Aquaculture, 531, 735685. 10.1016/j.aquaculture.2020.735685 [DOI] [Google Scholar]
- Gao, G. , Nome, T. , Pearse, D. E. , Moen, T. , Naish, K. A. , Thorgaard, G. H. , Lien, S. , & Palti, Y. (2018). A new single nucleotide polymorphism database for rainbow trout generated through whole genome resequencing. Frontiers in Genetics, 9, 147. 10.3389/fgene.2018.00147 [DOI] [PMC free article] [PubMed] [Google Scholar]
- Geng, X. , Sha, J. , Liu, S. , Bao, L. , Zhang, J. , Wang, R. , Yao, J. , Li, C. , Feng, J. , Sun, F. , Sun, L. , Jiang, C. , Zhang, Y. , Chen, A. , Dunham, R. , Zhi, D. , & Liu, Z. (2015). A genome‐wide association study in catfish reveals the presence of functional hubs of related genes within QTLs for columnaris disease resistance. BMC Genomics, 16(1), 196. 10.1186/s12864-015-1409-4 [DOI] [PMC free article] [PubMed] [Google Scholar]
- Goddard, M. , & Hayes, B. (2009). Mapping genes for complex traits in domestic animals and their use in breeding programmes. Nature Reviews Genetics, 10, 381–391. [DOI] [PubMed] [Google Scholar]
- Gonzalez‐Pena, D. , Gao, G. , Baranski, M. , Moen, T. , Cleveland, B. M. , Brett Kenney, P. , Vallejo, R. L. , Palti, Y. , & Leeds, T. D. (2016). Genome‐wide association study for identifying loci that affect fillet yield, carcass, and body weight traits in rainbow trout (Oncorhynchus mykiss). Frontiers in Genetics, 7, 203. 10.3389/fgene.2016.00203 [DOI] [PMC free article] [PubMed] [Google Scholar]
- Gutierrez, A. P. , Yáñez, J. M. , Fukui, S. , Swift, B. , & Davidson, W. S. (2015). Genome‐wide association study (GWAS) for growth rate and age at sexual maturation in Atlantic salmon (Salmo salar). PLoS One, 10(3), e0119730. 10.1371/journal.pone.0119730 [DOI] [PMC free article] [PubMed] [Google Scholar]
- Haile‐Mariam, M. , Nieuwhof, G. J. , Beard, K. T. , Konstatinov, K. V. , & Hayes, B. J. (2013). Comparison of heritabilities of dairy traits in Australian Holstein‐Friesian cattle from genomic and pedigree data and implications for genomic evaluations. Journal of Animal Breeding and Genetics, 130(1), 20–31. 10.1111/j.1439-0388.2013.01001.x [DOI] [PubMed] [Google Scholar]
- Hayes, B. J. , MacLeod, I. M. , Daetwyler, H. D. , Bowman, P. J. , Chamberlain, A. J. , vander Jagt, C. J. , Capitan, A. , Pausch, H. , Stothard, P. , Liao, X. , Schrooten, C. , Mullaart, E. , Fries, R. , Guldbrandtsen, B. , Lund, M. S. , Boichard, D. , Veerkamp, R. F. , Van Tassell, C. , Gredler, B. , … Goddard, M. E. (2014). Genomic Prediction from Whole Genome Sequence in Livestock: the 1000 Bull Genomes Project. Proceedings, 10th World Congress of Genetics Applied to Livestock Production Genomic, 10, 1–3. https://www.asas.org/docs/default‐source/wcgalp‐proceedings‐oral/183_paper_10441_manuscript_1644_0.pdf?sfvrsn=2 [Google Scholar]
- Heidaritabar, M. , Calus, M. P. L. , Megens, H.‐J. , Vereijken, A. , Groenen, M. A. M. , & Bastiaansen, J. W. M. (2016). Accuracy of genomic prediction using imputed whole‐genome sequence data in white layers. Journal of Animal Breeding and Genetics, 133(3), 167–179. 10.1111/jbg.12199 [DOI] [PubMed] [Google Scholar]
- Huang, P. , Xiong, S. , Kang, J. , Mei, J. , & Gui, J. F. (2018). Stat5b regulates sexually dimorphic gene expression in zebrafish liver. Frontiers in Physiology, 9, 676. 10.3389/fphys.2018.00676 [DOI] [PMC free article] [PubMed] [Google Scholar]
- Iheshiulor, O. O. M. , Woolliams, J. A. , Yu, X. , Wellmann, R. , & Meuwissen, T. H. E. (2016). Within‐ and across‐breed genomic prediction using whole‐genome sequence and single nucleotide polymorphism panels. Genetics Selection Evolution, 48(1), 15. 10.1186/s12711-016-0193-1 [DOI] [PMC free article] [PubMed] [Google Scholar]
- Ineno, T. , Tsuchida, S. , Kanda, M. , & Watabe, S. (2005). Thermal tolerance of a rainbow trout Oncorhynchus mykiss strain selected by high‐temperature breeding. Fisheries Science, 71(4), 767–775. 10.1111/j.1444-2906.2005.01026.x [DOI] [Google Scholar]
- Janhunen, M. , Koskela, J. , Ninh, N. H. , Vehviläinen, H. , Koskinen, H. , Nousiainen, A. , & Thoa, N. P. (2016). Thermal sensitivity of growth indicates heritable variation in 1‐year‐old rainbow trout (Oncorhynchus mykiss). Genetics Selection Evolution, 48(1), 94. 10.1186/s12711-016-0272-3 [DOI] [PMC free article] [PubMed] [Google Scholar]
- Ji, S. , Guan, R. , Frank, S. J. , & Messina, J. L. (1999). Insulin inhibits growth hormone signaling via the growth hormone receptor/JAK2/STAT5B pathway. Journal of Biological Chemistry, 274(19), 13434–13442. 10.1074/jbc.274.19.13434 [DOI] [PubMed] [Google Scholar]
- Johnston, I. A. , McLay, H. A. , Abercromby, M. , & Robins, D. (2000). Phenotypic plasticity of early myogenesis and satellite cell numbers in Atlantic salmon spawning in upland and lowland tributaries of a river system. The Journal of Experimental Biology, 203(Pt 17), 2539–2552. [DOI] [PubMed] [Google Scholar]
- Kawamura, S. , Yoshigai, E. , Kuhara, S. , & Tashiro, K. (2008). smyd1 and smyd2 are expressed in muscle tissue in Xenopus laevis . Cytotechnology, 57(2), 161–168. 10.1007/s10616-008-9128-1 [DOI] [PMC free article] [PubMed] [Google Scholar]
- Kim, I. , Kim, J. H. , Kim, K. , Seong, S. , & Kim, N. (2019). The IRF2BP2‐KLF2 axis regulates osteoclast and osteoblast differentiation. BMB Reports, 52(7), 469–474. 10.5483/BMBRep.2019.52.7.104 [DOI] [PMC free article] [PubMed] [Google Scholar]
- Kloth, M. T. , Catling, A. D. , & Silva, C. M. (2002). Novel activation of STAT5b in response to epidermal growth factor. Journal of Biological Chemistry, 277(10), 8693–8701. 10.1074/jbc.M111884200 [DOI] [PubMed] [Google Scholar]
- Larsson, T. , Mørkøre, T. , Kolstad, K. , Østbye, T.‐K. , Afanasyev, S. , & Krasnov, A. (2012). Gene expression profiling of soft and firm Atlantic salmon fillet. PLoS One, 7(6), e39219. 10.1371/journal.pone.0039219 [DOI] [PMC free article] [PubMed] [Google Scholar]
- Leeds, T. D. , Vallejo, R. L. , Weber, G. M. , Gonzalez‐Pena, D. , & Silverstein, J. T. (2016). Response to five generations of selection for growth performance traits in rainbow trout (Oncorhynchus mykiss). Aquaculture, 465, 341–351. 10.1016/j.aquaculture.2016.08.036 [DOI] [Google Scholar]
- Lhorente, J. P. , Araneda, M. , Neira, R. , & Yáñez, J. M. (2019). Advances in genetic improvement for salmon and trout aquaculture: The Chilean situation and prospects. Reviews in Aquaculture, 11(2), 340–353. 10.1111/raq.12335 [DOI] [Google Scholar]
- Li, H. , & Durbin, R. (2010). Fast and accurate long‐read alignment with Burrows‐Wheeler transform. Bioinformatics, 26(5), 589–595. 10.1093/bioinformatics/btp698 [DOI] [PMC free article] [PubMed] [Google Scholar]
- Li, J. , Su, T. , Yang, L. , Deng, L. , Zhang, C. , & He, Y. (2019). High SLC17A9 expression correlates with poor survival in gastric carcinoma. Future Oncology, 15(36), 4155–4166. 10.2217/fon-2019-0283 [DOI] [PubMed] [Google Scholar]
- Li, N. , Zhou, T. , Geng, X. , Jin, Y. , Wang, X. , Liu, S. , Xu, X. , Gao, D. , Li, Q. , & Liu, Z. (2018). Identification of novel genes significantly affecting growth in catfish through GWAS analysis. Molecular Genetics and Genomics, 293(3), 587–599. 10.1007/s00438-017-1406-1 [DOI] [PubMed] [Google Scholar]
- Lu, S. , Liu, Y. , Yu, X. , Li, Y. , Yang, Y. , Wei, M. , Zhou, Q. , Wang, J. , Zhang, Y. , Zheng, W. , & Chen, S. (2020). Prediction of genomic breeding values based on pre‐selected SNPs using ssGBLUP, WssGBLUP and BayesB for Edwardsiellosis resistance in Japanese flounder. Genetics Selection Evolution, 52(1), 49. 10.1186/s12711-020-00566-2 [DOI] [PMC free article] [PubMed] [Google Scholar]
- MacLeod, I. M. , Hayes, B. J. , & Goddard, M. E. (2014). The effects of demography and long‐term selection on the accuracy of genomic prediction with sequence data. Genetics, 198(4), 1671–1684. 10.1534/genetics.114.168344 [DOI] [PMC free article] [PubMed] [Google Scholar]
- Maehr, T. , Vecino, J. L. G. , Wadsworth, S. , Wang, T. , & Secombes, C. J. (2014). Four CISH paralogues are present in rainbow trout Oncorhynchus mykiss: Differential expression and modulation during immune responses and development. Molecular Immunology, 62(1), 186–198. 10.1016/j.molimm.2014.06.021 [DOI] [PubMed] [Google Scholar]
- Mäkinen, T. (1994). Effect of temperature and feed ration on energy utilization in large rainbow trout, Oncorhynchus mykiss (Walbaum). Aquaculture Research, 25(2), 213–232. 10.1111/j.1365-2109.1994.tb00575.x [DOI] [Google Scholar]
- Marins, L. F. , Iyengar, A. , McLean, N. , Levy, J. A. , & Sohm, F. (2002). Simultaneous overexpression of GH and STAT5b genes inhibits the STAT5 signalling pathway in tilapia (Oreochromis niloticus) embryos. Genetics and Molecular Biology, 25(3), 293–298. 10.1590/S1415-47572002000300007 [DOI] [Google Scholar]
- Mellery, J. , Geay, F. , Tocher, D. R. , Kestemont, P. , Debier, C. , Rollin, X. , & Larondelle, Y. (2016). Temperature increase negatively affects the fatty acid bioconversion capacity of rainbow trout (Oncorhynchus mykiss) fed a linseed oil‐based diet. PLoS One, 11(10), e0164478. 10.1371/journal.pone.0164478 [DOI] [PMC free article] [PubMed] [Google Scholar]
- Meuwissen, T. H. (2009). Accuracy of breeding values of “unrelated” individuals predicted by dense SNP genotyping. Genetics Selection Evolution, 41(1), 35. 10.1186/1297-9686-41-35 [DOI] [PMC free article] [PubMed] [Google Scholar]
- Meuwissen, T. , & Goddard, M. (2010). Accurate prediction of genetic values for complex traits by whole‐genome resequencing. Genetics, 185(2), 623–631. 10.1534/genetics.110.116590 [DOI] [PMC free article] [PubMed] [Google Scholar]
- Misztal, I. , Legarra, A. , & Aguilar, I. (2009). Computing procedures for genetic evaluation including phenotypic, full pedigree, and genomic information. Journal of Dairy Science, 92(9), 4648–4655. 10.3168/jds.2009-2064 [DOI] [PubMed] [Google Scholar]
- Misztal, I. , Tsuruta, S. , Lourenco, D. , Aguilar, I. , Legarra, A. , & Vitezica, Z. (2018). Manual for BLUPF90 family of programs (p. 125). University of Georgia. http://nce.ads.uga.edu/wiki/lib/exe/fetch.php?media=blupf90_all2.pdf [Google Scholar]
- Moghaddar, N. , Khansefid, M. , Van Der Werf, J. H. J. , Bolormaa, S. , Duijvesteijn, N. , Clark, S. A. , Swan, A. A. , Daetwyler, H. D. , & MacLeod, I. M. (2019). Genomic prediction based on selected variants from imputed whole‐genome sequence data in Australian sheep populations. Genetics Selection Evolution, 51(1), 72. 10.1186/s12711-019-0514-2 [DOI] [PMC free article] [PubMed] [Google Scholar]
- Nagandla, H. , Lopez, S. , Yu, W. , Rasmussen, T. L. , Tucker, H. O. , Schwartz, R. J. , & Stewart, M. D. (2016). Defective myogenesis in the absence of the muscle‐specific lysine methyltransferase SMYD1. Developmental Biology, 410(1), 86–97. 10.1016/j.ydbio.2015.12.005 [DOI] [PubMed] [Google Scholar]
- Ni, G. , Cavero, D. , Fangmann, A. , Erbe, M. , & Simianer, H. (2017). Whole‐genome sequence‐based genomic prediction in laying chickens with different genomic relationship matrices to account for genetic architecture. Genetics Selection Evolution, 49(1), 8. 10.1186/s12711-016-0277-y [DOI] [PMC free article] [PubMed] [Google Scholar]
- Ober, U. , Ayroles, J. F. , Stone, E. A. , Richards, S. , Zhu, D. , Gibbs, R. A. , Stricker, C. , Gianola, D. , Schlather, M. , Mackay, T. F. C. , & Simianer, H. (2012). Using whole‐genome sequence data to predict quantitative trait phenotypes in Drosophila melanogaster . PLoS Genetics, 8(5), e1002685. 10.1371/journal.pgen.1002685 [DOI] [PMC free article] [PubMed] [Google Scholar]
- Ødegård, J. , Moen, T. , Santi, N. , Korsvoll, S. A. , Kjøglum, S. , & Meuwisse, T. H. E. (2014). Genomic prediction in an admixed population of Atlantic salmon (Salmo salar). Frontiers in Genetics, 5, 1–8. 10.3389/fgene.2014.00402 [DOI] [PMC free article] [PubMed] [Google Scholar]
- Palaiokostas, C. , Kocour, M. , Prchal, M. , & Houston, R. D. (2018). Accuracy of genomic evaluations of juvenile growth rate in common carp (Cyprinus carpio) using genotyping by sequencing. Frontiers in Genetics, 9, 82. 10.3389/fgene.2018.00082 [DOI] [PMC free article] [PubMed] [Google Scholar]
- Palti, Y. , Gao, G. , Liu, S. , Kent, M. P. , Lien, S. , Miller, M. R. , Rexroad, C. E. , & Moen, T. (2015). The development and characterization of a 57K single nucleotide polymorphism array for rainbow trout. Molecular Ecology Resources, 15(3), 662–672. 10.1111/1755-0998.12337 [DOI] [PubMed] [Google Scholar]
- Park, J. H. , Gail, M. H. , Weinberg, C. R. , Carroll, R. J. , Chung, C. C. , Wang, Z. , Chanock, S. J. , Fraumeni, J. F. , & Chatterjee, N. (2011). Distribution of allele frequencies and effect sizes and their interrelationships for common genetic susceptibility variants. Proceedings of the National Academy of Sciences of the United States of America, 108(44), 18026–18031. 10.1073/pnas.1114759108 [DOI] [PMC free article] [PubMed] [Google Scholar]
- Peña De Ortiz, S. , Colón, M. , Carrasquillo, Y. , Padilla, B. , & Arshavsky, Y. I. (2003). Experience‐dependent expression of terminal deoxynucleotidyl transferase in mouse brain. NeuroReport, 14(8), 1141–1144. 10.1097/00001756-200306110-00008 [DOI] [PubMed] [Google Scholar]
- Pérez‐Enciso, M. , Rincón, J. C. , & Legarra, A. (2015). Sequence‐ vs. chip‐assisted genomic selection: Accurate biological information is advised. Genetics Selection Evolution, 47(1), 43. 10.1186/s12711-015-0117-5 [DOI] [PMC free article] [PubMed] [Google Scholar]
- Perry, G. M. L. , Martyniuk, C. M. , Ferguson, M. M. , & Danzmann, R. G. (2005). Genetic parameters for upper thermal tolerance and growth‐related traits in rainbow trout (Oncorhynchus mykiss). Aquaculture, 250(1), 120–128. 10.1016/j.aquaculture.2005.04.042 [DOI] [Google Scholar]
- Purcell, S. , Neale, B. , Todd‐Brown, K. , Thomas, L. , Ferreira, M. A. R. , Bender, D. , Maller, J. , Sklar, P. , de Bakker, P. I. W. , Daly, M. J. , & Sham, P. C. (2007). PLINK: A tool set for whole‐genome association and population‐based linkage analyses. American Journal of Human Genetics, 81(3), 559–575. [DOI] [PMC free article] [PubMed] [Google Scholar]
- Raleigh, R. F. (1984). Habitat suitability information: Rainbow trout. Western Energy and Land Use Team, Division of Biological Services, Research and Development, Fish and Wildlife Service, U.S. Dept. of the Interior. [Google Scholar]
- Raymond, B. , Bouwman, A. C. , Schrooten, C. , Houwing‐Duistermaat, J. , & Veerkamp, R. F. (2018). Utility of whole‐genome sequence data for across‐breed genomic prediction. Genetics Selection Evolution, 50(1), 27. 10.1186/s12711-018-0396-8 [DOI] [PMC free article] [PubMed] [Google Scholar]
- Reis Neto, R. V. , Yoshida, G. M. , Lhorente, J. P. , & Yáñez, J. M. (2019). Genome‐wide association analysis for body weight identifies candidate genes related to development and metabolism in rainbow trout (Oncorhynchus mykiss). Molecular Genetics and Genomics, 294, 563–571. 10.1007/s00438-018-1518-2 [DOI] [PubMed] [Google Scholar]
- Rodríguez, F. H. , Flores‐Mara, R. , Yoshida, G. M. , Barría, A. , Jedlicki, A. M. , Lhorente, J. P. , Reyes‐López, F. , & Yáñez, J. M. (2019). Genome‐wide association analysis for resistance to infectious pancreatic necrosis virus identifies candidate genes involved in viral replication and immune response in rainbow trout (Oncorhynchus mykiss). G3: Genes, Genomes, Genetics, 9, 2897–2904. 10.1534/g3.119.400463 [DOI] [PMC free article] [PubMed] [Google Scholar]
- Rosenfeld, R. G. , Belgorosky, A. , Camacho‐Hubner, C. , Savage, M. O. , Wit, J. M. , & Hwa, V. (2007). Defects in growth hormone receptor signaling. Trends in Endocrinology and Metabolism, 18(4), 134–141. 10.1016/j.tem.2007.03.004 [DOI] [PubMed] [Google Scholar]
- Rubin Grandis, J. , Drenning, S. D. , Chakraborty, A. , Zhou, M. Y. , Zeng, Q. , Pitt, A. S. , & Tweardy, D. J. (1998). Requirement of Stat3 but not Stat1 activation for epidermal growth factor receptor‐mediated cell growth in vitro. Journal of Clinical Investigation, 102(7), 1385–1392. 10.1172/jci3785 [DOI] [PMC free article] [PubMed] [Google Scholar]
- Sadeghi, M. , Niknafs, S. , Moradi Shahrbabak, H. , & Fatemi, S. A. (2012). Two SNP in STAT5B gene and their association with breeding value of growth and egg production traits in Mazandaran Indigenous Chicken. Livestock Science, 147(1–3), 198–202. 10.1016/j.livsci.2012.04.015 [DOI] [Google Scholar]
- Sae‐Lim, P. , Kause, A. , Mulder, H. A. , & Olesen, I. (2017). Breeding and genetics symposium: Climate change and selective breeding in aquaculture 1. Journal of Animal Science, 95(4), 1801–1812. 10.2527/jas.2016.1066 [DOI] [PubMed] [Google Scholar]
- Sanchez, M. P. , Govignon‐Gion, A. , Croiseau, P. , Fritz, S. , Hozé, C. , Miranda, G. , Martin, P. , Barbat‐Leterrier, A. , Letaïef, R. , Rocha, D. , Brochard, M. , Boussaha, M. , & Boichard, D. (2017). Within‐breed and multi‐breed GWAS on imputed whole‐genome sequence variants reveal candidate mutations affecting milk protein composition in dairy cattle. Genetics Selection Evolution, 49(1), 1–16. 10.1186/s12711-017-0344-z [DOI] [PMC free article] [PubMed] [Google Scholar]
- Sanchez, M. P. , Guatteo, R. , Davergne, A. , Saout, J. , Grohs, C. , Deloche, M. C. , Taussat, S. , Fritz, S. , Boussaha, M. , Blanquefort, P. , Delafosse, A. , Joly, A. , Schibler, L. , Fourichon, C. , & Boichard, D. (2020). Identification of the ABCC4, IER3, and CBFA2T2 candidate genes for resistance to paratuberculosis from sequence‐based GWAS in Holstein and Normande dairy cattle. Genetics Selection Evolution, 52(1), 14. 10.1186/s12711-020-00535-9 [DOI] [PMC free article] [PubMed] [Google Scholar]
- Sarac, I. , & Hollenstein, M. (2019). Terminal deoxynucleotidyl transferase in the synthesis and modification of nucleic acids. ChemBioChem, 20(7), 860–871. 10.1002/cbic.201800658 [DOI] [PubMed] [Google Scholar]
- Sargolzaei, M. , Chesnais, J. P. , & Schenkel, F. S. (2014). A new approach for efficient genotype imputation using information from relatives. BMC Genomics, 15(1), 478. 10.1186/1471-2164-15-478 [DOI] [PMC free article] [PubMed] [Google Scholar]
- Shelton, C. (2014). Climate change adaptation in fisheries and aquaculture compilation of initial examples. FAO Fisheries and Aquaculture Circular No. 1088, 45. www.fao.org/icatalog/inter‐e.htm [Google Scholar]
- Sonesson, A. K. , Meuwissen, T. H. , Figueroa, R. , Lhorente, J. P. , Yáñez, J. M. , & Gilbey, J. (2009). Testing strategies for genomic selection in aquaculture breeding programs. Genetics Selection Evolution, 41(1), 37. 10.1186/1297-9686-41-37 [DOI] [PMC free article] [PubMed] [Google Scholar]
- Song, H. , Ye, S. , Jiang, Y. , Zhang, Z. , Zhang, Q. , & Ding, X. (2019). Using imputation‐based whole‐genome sequencing data to improve the accuracy of genomic prediction for combined populations in pigs. Genetics Selection Evolution, 51(1), 58. 10.1186/s12711-019-0500-8 [DOI] [PMC free article] [PubMed] [Google Scholar]
- Teng, A. C. T. , Kuraitis, D. , Deeke, S. A. , Ahmadi, A. , Dugan, S. G. , Cheng, B. L. M. , Crowson, M. G. , Burgon, P. G. , Suuronen, E. J. , Chen, H.‐H. , & Stewart, A. F. R. (2010). IRF2BP2 is a skeletal and cardiac muscle‐enriched ischemia‐inducible activator of VEGFA expression. The FASEB Journal, 24(12), 4825–4834. 10.1096/fj.10-167049 [DOI] [PubMed] [Google Scholar]
- Tsai, H.‐Y. , Hamilton, A. , Tinch, A. E. , Guy, D. R. , Bron, J. E. , Taggart, J. B. , Gharbi, K. , Stear, M. , Matika, O. , Pong‐Wong, R. , Bishop, S. C. , & Houston, R. D. (2016). Genomic prediction of host resistance to sea lice in farmed Atlantic salmon populations. Genetics Selection Evolution, 48(1), 47. 10.1186/s12711-016-0226-9 [DOI] [PMC free article] [PubMed] [Google Scholar]
- Tsai, H. Y. , Hamilton, A. , Tinch, A. E. , Guy, D. R. , Gharbi, K. , Stear, M. J. , Matika, O. , Bishop, S. C. , & Houston, R. D. (2015). Genome wide association and genomic prediction for growth traits in juvenile farmed Atlantic salmon using a high density SNP array. BMC Genomics, 16(1), 1–9. 10.1186/s12864-015-2117-9 [DOI] [PMC free article] [PubMed] [Google Scholar]
- Tsai, H.‐Y. , Matika, O. , Edwards, S. M. , Antolín‐Sánchez, R. , Hamilton, A. , Guy, D. R. , Tinch, A. E. , Gharbi, K. , Stear, M. J. , Taggart, J. B. , Bron, J. E. , Hickey, J. M. , & Houston, R. D. (2017). Genotype imputation to improve the cost‐efficiency of genomic selection in farmed Atlantic salmon. G3: Genes, Genomes, Genetics, 7(4), 1377–1383. http://www.g3journal.org/content/7/4/1377 [DOI] [PMC free article] [PubMed] [Google Scholar]
- Tzima, E. (2006). Role of small GTPases in endothelial cytoskeletal dynamics and the shear stress response. Circulation Research, 98(2), 176–185. 10.1161/01.RES.0000200162.94463.d7 [DOI] [PubMed] [Google Scholar]
- Udy, G. B. , Towers, R. P. , Snell, R. G. , Wilkins, R. J. , Park, S. H. , Ram, P. A. , Waxman, D. J. , & Davey, H. W. (1997). Requirement of STAT5b for sexual dimorphism of body growth rates and liver gene expression. Proceedings of the National Academy of Sciences of the United States of America, 94(14), 7239–7244. 10.1073/pnas.94.14.7239 [DOI] [PMC free article] [PubMed] [Google Scholar]
- van Binsbergen, R. , Calus, M. P. L. , Bink, M. C. A. M. , van Eeuwijk, F. A. , Schrooten, C. , & Veerkamp, R. F. (2015). Genomic prediction using imputed whole‐genome sequence data in Holstein Friesian cattle. Genetics Selection Evolution, 47(1), 71. 10.1186/s12711-015-0149-x [DOI] [PMC free article] [PubMed] [Google Scholar]
- Van Den Berg, I. , Boichard, D. , Guldbrandtsen, B. , & Lund, M. S. (2016). Using sequence variants in linkage disequilibrium with causative mutations to improve across‐breed prediction in dairy cattle: A simulation study. G3: Genes, Genomes, Genetics, 6(8), 2553–2561. 10.1534/g3.116.027730 [DOI] [PMC free article] [PubMed] [Google Scholar]
- Van Den Berg, I. , Bowman, P. J. , MacLeod, I. M. , Hayes, B. J. , Wang, T. , Bolormaa, S. , & Goddard, M. E. (2017). Multi‐breed genomic prediction using Bayes R with sequence data and dropping variants with a small effect. Genetics Selection Evolution, 49(1), 70. 10.1186/s12711-017-0347-9 [DOI] [PMC free article] [PubMed] [Google Scholar]
- Van Den Berg, S. , Vandenplas, J. , Van Eeuwijk, F. A. , Bouwman, A. C. , Lopes, M. S. , & Veerkamp, R. F. (2019). Imputation to whole‐genome sequence using multiple pig populations and its use in genome‐wide association studies. Genetics Selection Evolution, 51(1), 2. 10.1186/s12711-019-0445-y [DOI] [PMC free article] [PubMed] [Google Scholar]
- VanRaden, P. M. (2008). Efficient methods to compute genomic predictions. Journal of Dairy Science, 91(11), 4414–4423. 10.3168/jds.2007-0980 [DOI] [PubMed] [Google Scholar]
- VanRaden, P. M. , O’Connell, J. R. , Wiggans, G. R. , & Weigel, K. A. (2011). Genomic evaluations with many more genotypes. Genetics Selection Evolution, 43(1), 10. 10.1186/1297-9686-43-10 [DOI] [PMC free article] [PubMed] [Google Scholar]
- Veerkamp, R. F. , Bouwman, A. C. , Schrooten, C. , & Calus, M. P. L. (2016). Genomic prediction using preselected DNA variants from a GWAS with whole‐genome sequence data in Holstein‐Friesian cattle. Genetics Selection Evolution, 48(1), 1–14. 10.1186/s12711-016-0274-1 [DOI] [PMC free article] [PubMed] [Google Scholar]
- Vincent‐Dejean, C. , Cazabat, L. , Groussin, L. , Perlemoine, K. , Fumey, G. , Tissier, F. , Bertagna, X. , & Bertherat, J. (2008). Identification of a clinically homogenous subgroup of benign cortisol‐secreting adrenocortical tumors characterized by alterations of the protein kinase A (PKA) subunits and high PKA activity. European Journal of Endocrinology, 158(6), 829–839. 10.1530/EJE-07-0819 [DOI] [PubMed] [Google Scholar]
- Wang, H. , Misztal, I. , Aguilar, I. , Legarra, A. , Fernando, R. L. , Vitezica, Z. , Okimoto, R. , Wing, T. , Hawken, R. , & Muir, W. M. (2014). Genome‐wide association mapping including phenotypes from relatives without genotypes in a single‐step (ssGWAS) for 6‐week body weight in broiler chickens. Frontiers in Genetics, 5, 1–10. 10.3389/fgene.2014.00134 [DOI] [PMC free article] [PubMed] [Google Scholar]
- Wang, H. , Misztal, I. , Aguilar, I. , Legarra, A. , & Muir, W. M. (2012). Genome‐wide association mapping including phenotypes from relatives without genotypes. Genetics Research, 94(2), 73–83. 10.1017/S0016672312000274 [DOI] [PubMed] [Google Scholar]
- Wang, M. , Lai, X. , Yu, H. , Wang, J. , Chen, Z. Q. , Lan, X. Y. , Lei, C. Z. , & Chen, H. (2010). Two novel single nucleotide polymorphisms (SNPs) and 4‐bp deletion mutation of RBP4 gene in Chinese cattle. Journal of Genetics, 89(2), 233–236. 10.1007/s12041-010-0031-0 [DOI] [PubMed] [Google Scholar]
- Wang, Y. , Zhang, F. , Mukiibi, R. , Chen, L. , Vinsky, M. , Plastow, G. , Basarab, J. , Stothard, P. , & Li, C. (2020). Genetic architecture of quantitative traits in beef cattle revealed by genome wide association studies of imputed whole genome sequence variants: II: Carcass merit traits. BMC Genomics, 21(1), 38. 10.1186/s12864-019-6273-1 [DOI] [PMC free article] [PubMed] [Google Scholar]
- Wiggans, G. R. , Cole, J. B. , Hubbard, S. M. , & Sonstegard, T. S. (2017). Genomic selection in dairy cattle: The USDA experience. Annual Review of Animal Biosciences, 5(1), 309–327. 10.1146/annurev-animal-021815-111422 [DOI] [PubMed] [Google Scholar]
- Woelfle, J. , Billiard, J. , & Rotwein, P. (2003). Acute control of insulin‐like growth factor‐I gene transcription by growth hormone through Stat5b. Journal of Biological Chemistry, 278(25), 22696–22702. 10.1074/jbc.M301362200 [DOI] [PubMed] [Google Scholar]
- Wringe, B. F. , Devlin, R. H. , Ferguson, M. M. , Moghadam, H. K. , Sakhrani, D. , & Danzmann, R. G. (2010). Growth‐related quantitative trait loci in domestic and wild rainbow trout (Oncorhynchus mykiss). BMC Genetics, 11(1), 63. 10.1186/1471-2156-11-63 [DOI] [PMC free article] [PubMed] [Google Scholar]
- Wurtsbaugh, W. A. , & Davis, G. E. (1977). Effects of temperature and ration level on the growth and food conversion efficiency of Salmo gairdneri, Richardson. Journal of Fish Biology, 11(2), 87–98. 10.1111/j.1095-8649.1977.tb04101.x [DOI] [Google Scholar]
- Xiong, S. , Wu, J. , Jing, J. , Huang, P. , Li, Z. , Mei, J. , & Gui, J. F. (2017). Loss of stat3 function leads to spine malformation and immune disorder in zebrafish. Science Bulletin, 62(3), 185–196. 10.1016/j.scib.2017.01.008 [DOI] [PubMed] [Google Scholar]
- Xu, W. H. , Guo, H. H. , Chen, S. J. , Wang, Y. Z. , Lin, Z. H. , Huang, X. D. , Tang, H. J. , He, Y. H. , Sun, J. J. , & Gan, L. (2020). Transcriptome analysis revealed changes of multiple genes involved in muscle hardness in grass carp (Ctenopharyngodon idellus) fed with faba bean meal. Food Chemistry, 314, 126205. 10.1016/j.foodchem.2020.126205 [DOI] [PubMed] [Google Scholar]
- Yáñez, J. M. , Yoshida, G. M. , Parra, Á. , Correa, K. , Barría, A. , Bassini, L. N. , Christensen, K. A. , López, M. E. , Carvalheiro, R. , Lhorente, J. P. , & Pulgar, R. (2019). Comparative genomic analysis of three salmonid species identifies functional candidate genes involved in resistance to the intracellular bacterium Piscirickettsia salmonis . Frontiers in Genetics, 10, 665. 10.3389/fgene.2019.00665 [DOI] [PMC free article] [PubMed] [Google Scholar]
- Yang, L. , Chen, Z. , Xiong, W. , Ren, H. , Zhai, E. , Xu, K. , Yang, H. , Zhang, Z. , Ding, L. , He, Y. , Song, X. , & Liu, J. (2019). High expression of SLC17A9 correlates with poor prognosis in colorectal cancer. Human Pathology, 84, 62–70. 10.1016/j.humpath.2018.09.002 [DOI] [PubMed] [Google Scholar]
- Yang, M.‐N. , Zhang, G.‐H. , Du, K. , Wang, W.‐J. , Dong, Y. , He, H. , Chiu, H.‐C. , Guo, Y.‐N. , Ouyang, F. , Zhang, J. , Hua, X.‐L. , Luo, Z.‐C. , Shen, X. , Huang, H. , Sun, K. , Zhang, J. , Wang, W. , Xu, W. , Ouyang, F. , … Cohort, for the S. B . (2020). Retinol‐binding protein 4, fetal overgrowth and fetal growth factors. Pediatric Research, 87(5), 946–951. 10.1038/s41390-019-0685-0 [DOI] [PubMed] [Google Scholar]
- Yoshida, G. M. , Bangera, R. , Carvalheiro, R. , Correa, K. , Figueroa, R. , Lhorente, J. P. , & Yáñez, J. M. (2018). Genomic prediction accuracy for resistance against Piscirickettsia salmonis in farmed rainbow trout. G3: Genes, Genomes, Genetics, 8(2), 719–726. 10.1534/g3.117.300499 [DOI] [PMC free article] [PubMed] [Google Scholar]
- Yoshida, G. M. , Carvalheiro, R. , Lhorente, J. P. , Correa, K. , Figueroa, R. , Houston, R. D. , & Yáñez, J. M. (2018). Accuracy of genotype imputation and genomic predictions in a two‐generation farmed Atlantic salmon population using high‐density and low‐density SNP panels. Aquaculture, 491, 147–154. 10.1016/j.aquaculture.2018.03.004 [DOI] [Google Scholar]
- Yoshida, G. , Carvalheiro, R. , Rodríguez, F. H. , Lhorente, J. P. , & Yáñez, J. M. (2019). Single‐step genomic evaluation improves accuracy of breeding value predictions for resistance to infectious pancreatic necrosis virus in rainbow trout. Genomics, 111(2), 127–132. 10.1016/j.ygeno.2018.01.008 [DOI] [PubMed] [Google Scholar]
- Yoshida, G. M. , Lhorente, J. P. , Carvalheiro, R. , & Yáñez, J. M. (2017). Bayesian genome‐wide association analysis for body weight in farmed Atlantic salmon (Salmo salar L.). Animal Genetics, 48(6), 698–703. 10.1111/age.12621 [DOI] [PubMed] [Google Scholar]
- Yoshida, G. , Lhorente, J. , Correa, K. , Soto, J. , Salas, D. , & Yáñez, J. (2019). Genome‐wide association study and cost‐efficient genomic predictions for growth and fillet yield in Nile tilapia (Oreochromis niloticus). G3: Genes, Genomes, Genetics, 9(8), 2597–2607. 10.1534/g3.119.400116 [DOI] [PMC free article] [PubMed] [Google Scholar]
- Yoshida, G. , & Yáñez, J. (2020). Multi‐trait GWAS using high‐density genotypes identifies genes associated with body traits in Nile tilapia. 10.21203/RS.3.RS-48903/V1 [DOI] [PMC free article] [PubMed]
- Yu, E. , Xie, J. , Wang, G. , Yu, D. , Gong, W. , Li, Z. , Wang, H. , Xia, Y. , & Wei, N. (2014). Gene expression profiling of grass carp (Ctenopharyngodon idellus) and crisp grass carp. International Journal of Genomics, 2014, 639687. 10.1155/2014/639687 [DOI] [PMC free article] [PubMed] [Google Scholar]
- Zhang, J. , Yang, J. , Zhang, L. , Luo, J. , Zhao, H. , Zhang, J. , & Wen, C. (2020). A new SNP genotyping technology target SNP‐seq and its application in genetic analysis of cucumber varieties. Scientific Reports, 10(1), 5623. 10.1038/s41598-020-62518-6 [DOI] [PMC free article] [PubMed] [Google Scholar]
- Zhang, X. , Lourenco, D. , Aguilar, I. , Legarra, A. , & Misztal, I. (2016). Weighting strategies for single‐step genomic BLUP: An iterative approach for accurate calculation of GEBV and GWAS. Frontiers in Genetics, 7, 151. 10.3389/fgene.2016.00151 [DOI] [PMC free article] [PubMed] [Google Scholar]
- Zhang, Y. , Laz, E. V. , & Waxman, D. J. (2012). Dynamic, sex‐differential STAT5 and BCL6 binding to sex‐biased, growth hormone‐regulated genes in adult mouse liver. Molecular and Cellular Biology, 32(4), 880–896. 10.1128/mcb.06312-11 [DOI] [PMC free article] [PubMed] [Google Scholar]
- Zheng, Z. , Huang, R. L. , Tian, R. R. , Jiao, Y. , & Du, X. (2016). Pm‐miR‐133 hosting in one potential lncRNA regulates RhoA expression in pearl oyster Pinctada martensii. Gene, 591(2), 484–489. 10.1016/j.gene.2016.06.051 [DOI] [PubMed] [Google Scholar]
Associated Data
This section collects any data citations, data availability statements, or supplementary materials included in this article.
Supplementary Materials
Fig S1
Fig S2
Fig S3
Fig S4
Fig S5
Data Availability Statement
The data that support the findings of this study are openly available in the Figshare Repository at https://doi.org/10.6084/m9.figshare.13482564. The Oncorhynchus mykiss reference genome is publicly available at NCBI (Omyk_1.0, GenBank Assembly Accession GCA_002163495.1, https://www.ncbi.nlm.nih.gov/genome/?term=GCA_002163495.1).