

Abstract
Background
Regulations in many countries worldwide prescribe that peanut must be listed on food labels as a cause of food allergies. Re-evaluated voluntary incidental trace allergen labelling (VITAL) values for peanut revealed the eliciting dose (ED01) value—at which 99% of all peanut-allergic individuals will not react—is 0.2 mg peanut protein.
Objective
Validation of a sandwich ELISA based on monoclonal antibodies to detect peanut proteins.
Methods
Non-processed and processed samples are extracted by an easy procedure at 60°C within 10 min. The measurement range is between 0.75 and 6 mg/kg peanut using a national institute of standards and technology (NIST) reference material as calibrator.
Results
The system shows no cross-reactivity against 91 different food commodities. The LOD was 0.15 mg/kg for food matrixes such as cookies, milk chocolate, ice cream, trail mix, puffed rice cereal, and granola bar. LOQ was verified at a level of 0.75 mg/kg. Recovery studies with incurred milk chocolate and ice cream revealed consistent recoveries between 67 and 85%. Mean recoveries for incurred cookies depend on the baking temperature and time and ranged from 60 to 109%. Repeatability was between 5.2 and 12.3%, whereas relative intermediate precision was between 6.4 and 13.0%. The results for incurred cookies and milk chocolate in the independent laboratory study showed mean recoveries between 99 and 104% with RSDs between 3.56 and 19.5% under repeatability conditions.
Conclusion
The results from the in-house validation study and the independent lab confirmed that the method is accurate and in accordance with requirements laid down in Standard Method Performance Requirement 2017.020.
Highlights
RIDASCREEN® Peanut quantifies proteins from peanut in a wide range of food categories.
General Information
Peanut can be present either as an ingredient or as contamination. Regulation (EU) No 1169/2011 (1) prescribes that peanut must be listed on food labels as a cause of food allergies. Comparable legal regulations are in place in the United States, Canada, Australia, China, New Zealand, and many other countries. Peanuts contain approximately 25% protein. Of the 17 recognized peanut allergens, Ara h 1, Ara h 2, Ara h 3 and Ara h 6 are considered the major allergens because they are abundant and recognized by serum IgE in >50% of peanut-allergic individuals (2). In 2019, Taylor et al. re-evaluated the voluntary incidental trace allergen labelling (VITAL) values for peanut (3). They found that the eliciting dose (ED01) value—where 99% of peanut-allergic individuals will not react—is 0.2 mg peanut protein. The ED05 value—the dose where 95% of peanut-allergic individuals will not react—is 2.1 mg peanut protein.
Principle
The principle of the test is the antigen–antibody reaction. The wells of the microtiter plate are coated with monoclonal antibodies against peanut proteins. By adding the standard or sample solution to the wells, peanut proteins will bind to the specific antibodies. The result is an antibody–antigen complex. Compounds not bound are washed and removed. Then a second monoclonal antibody conjugated to peroxidase (enzyme conjugate) is added. This antibody conjugate binds to the antibody–antigen complex to form an antibody–antigen–antibody complex (sandwich). Substrate/chromogen is added after any unbound enzyme conjugate is removed in a washing step. Bound enzyme conjugate converts the chromogen into a blue product. The addition of the stop solution leads to a color change from blue to yellow. The measurement is made photometrically at 450 nm against air. The absorption is proportional to the peanut protein concentration in the sample.
Scope of Method
Analyte(s).—The pair of monoclonal antibodies reacts specifically with proteins from peanuts (Arachis hypogea) with no cross-reactivity towards important food commodities.
Matrixes.—In course of this validation, RIDASCREEN® Peanut was tested with the following matrixes: cookies, milk chocolate, trail mix, puffed rice cereal, ice cream, and granola bar.
Summary of validated performance claims.—The system showed no cross-reactivity to 91 different food commodities. LOD was found to be 0.15 mg/kg for food matrixes such as cookies (wheat flour, margarine, sugar, semolina, skim milk powder, vanilla sugar, sodium chloride), milk chocolate, ice cream (skim milk, cream, glucose–fructose syrup, sugar, emulsifiers, vanilla), trail mix (almonds with skin, cashews, blanched almonds without skin, sultanas, cranberries, black currants), puffed rice cereal (rice, sugar, salt, malt flavor, vitamins and minerals), and granola bar (whole-grain oat flakes, sugar, sunflower oil, honey, salt, molasses, sunflower oil lecithin emulsifier, sodium hydrogen carbonate). LOQ was verified at a level of 0.75 mg/kg. Recovery studies with incurred milk chocolate and vanilla ice cream revealed consistent mean recoveries between 67 and 85%. Mean recoveries for incurred cookies depend on the baking temperature and baking time. They ranged from 60 to 109%. Spiking of the claimed matrixes showed mean recoveries between 65 and 97% whereas recovery of peanut from trail mix is around 60%. Spiking of the claimed matrixes showed mean recoveries between 65 and 97% whereas recovery of peanut from trail mix is around 60%. Repeatability (including inhomogeneity of the incurred matrixes used) was between 5.2 and 12.3%. Depending on the sample type, relative intermediate precision was between 6.4 and 13.0%. A ruggedness study revealed no critical parameters for the extraction or ELISA procedure except the ELISA incubation temperature for which a significant increase in recoveries was observed when incubating at 30°C. The results for incurred cookies and milk chocolate repeated in the independent laboratory showed mean recoveries between 99 and 104% with RSDs between 3.56 and 12.2%. It was therefore concluded that the independent laboratory was able to confirm the claims of the method developer.
Definitions
Ruggedness.—A set of experiments that characterizes the ability of the method to respond to intentional slight perturbations of the procedure such as incubation time, incubation temperature, extraction conditions, pipetting velocity, etc.
Dilutability.—The capability of a sample extract with an analyte concentration above the measurement range to yield accurate results upon dilution to concentrations within the measurement range.
LOD.—An LOD is an estimate of the concentration at or above which a sample is positive but not quantifiable. Test portions of each claimed analyte-free matrix are extracted and measured; LOD is calculated as the mean of these concentrations plus 3.3 times the standard deviation.
LOQ.—A concentration at which results of a measurement system will be accurate in terms of recovery and precision.
Incurred sample.—Analyte is added to a food matrix before any processing step such as kneading, cooking or baking takes place; by doing this the analyte will pass through all processing steps.
Spiked sample. —A sample to which the analyte is directly added before extraction.
Repeatability.—Precision under repeatability conditions where independent test results are obtained with the same method on identical test items in the same laboratory by the same operator using the same equipment within short intervals of time; if incurred samples are used for this experiment, a possible inhomogeneity would increase the value for repeatability.
Intermediate precision.—Three people analyze a set of samples on different days using three different test kit lots. Each person extracts the set of samples.
Materials and Methods
Test Kit Information
Kit name.—RIDASCREEN Peanut
Catalog number.—R6811
-
Ordering information.—
-
USA.—R-Biopharm Inc., 870 Vossbrink Dr, Washington, MO 63090
Phone (877)-789-3033; fax (269)-789-3070
E-mail sales@r-biopharm.com
-
Worldwide.—R-Biopharm AG, An der neuen Bergstrasse 17, D-64297 Darmstadt, Germany
Phone +49-(0)6151-8102-0; fax +49-(0)6151-8102-20
E-mail sales@r-biopharm.de
-
Test Kit Components
All reagents are stable as indicated on the label at 2–8°C (36–46°F).
Antibody-coated microwell strips.—96 wells
Allergen extraction buffer.—One bottle (100 mL, 10-fold concentrate)
Standards.—Five vials (1.3 mL each, ready to use) peanut proteins in aqueous solution.
Conjugate.—One vial (11 mL, ready to use), peroxidase-conjugated antibody solution.
Red Chromogen Pro (substrate/chromogen).—One vial (13 mL, stained red).
Stop solution.—One vial (14 mL, contains 1 N sulfuric acid).
Wash buffer.—One bottle (100 mL, 10-fold concentrate).
Additional Supplies and Reagents
Variable micropipettes (20–200 µL and 200–1000 µL).
Multistepper pipette and tips for 100 µL.
Eight-channel pipette and tips for 100 µL and 250 µL.
Graduated pipettes.
Graduated cylinders (plastic- or glassware).
Centrifugal glass or plastic vials with a screw top.
Fluted paper filter (e.g., Munktell Grade 3 hw 150 mm diameter by Ahlstrom-Munksjö).
Distilled water.
Skim milk powder (SMP: food quality; peanut-free).
If necessary: an uncoated microtiter plate (e.g., Greiner Bio-One, Cat. No. 655101).
Apparatus
Microtiter plate spectrophotometer (450 nm).
Scale (upper measurement range at least 50 g; precision ±0.01 g).
Laboratory mincer/grinder, pestle and mortar, or Ultra-Turrax.
Shaker (e.g., Roto Shaker Genie, Scientific Industries Inc., Bohemia, NY, USA).
Centrifuge (e.g., Minifuge RF, Kendro, Hanau, Germany).
Temperature controlled water bath 60°C/140°F (e.g., GFL, Burgwedel, Germany).
Reference Materials
Standard Reference Material (SRM ) 2387.—Peanut Butter for Allergen Detection (National Institute of Standards and Technology, NIST); certified for total protein content of 22.2 ± 0.5 g/100 g determined by nitrogen content and a conversion factor of 5.46 to calculate the total protein content.
Standard Solutions and Spiking Solutions
The starting material for spiking consists of NIST SRM 2387. It was stored at −20°C. For spiking purposes, the SRM is suspended with diluted allergen extraction buffer (AEP). Briefly, 20 mL AEP is added to 20 mg NIST SRM 2387 and shaken at room temperature for 30 min. This solution is further diluted with AEP to the desired concentration. All solutions should be prepared daily.
Standard solutions were also prepared from the NIST materials.
All final solutions were made as a colored stabilization buffer solution.
Safety Precautions
Carefully read safety data sheet of each component and wear eye protection, gloves, and a laboratory coat when using this test kit.
General Preparation
This test should only be carried out by trained laboratory personnel. The instructions for use must be strictly followed. No quality guarantee is accepted after expiry of the kit (see expiry label).
Store the kit at 2–8°C (36–46°F). Let all kit components come to room temperature 20–25°C (68–77°F) before use. Do not freeze any of the kit components.
Any unused microwells must be returned to their original foil bag, resealed together with the desiccant provided and further stored at 2–8°C (36–46°F). The substrate/chromogen is light sensitive, therefore, exposure to direct light must be avoided.
Some components included in the kit are concentrates and must be carefully diluted and contamination by airborne dust or dirty laboratory equipment must be avoided. Gloves must be worn during the preparation and performance of the assay. Working surfaces, glass vials, mincers, and other equipment must be cleaned and all sample preparation procedures must be conducted in a room isolated from the ELISA procedure.
Separate pipette tips must be used for each standard and each sample extract to avoid cross-contamination and the pipette tips must be pre-flushed before pipetting standard or sample extract. A multistepper or multichannel pipette must be used for adding the conjugate, substrate/chromogen and stop solution and a single tip must always be used for each of those components. Additionally, ready-to-use standards must be used for each diluted sample extract and standards and samples must be run in duplicate. Do not reuse plate wells.
In case more than three microtiterplate strips (24 wells) are necessary, a second uncoated plate should be used as a pre-plate. Standards and samples must be quickly transferred to the coated microtiter plate with an eight-channel pipette.
Components and procedures of the test kit have been standardized for use in this procedure. Do not interchange components between kits of different batches (lot numbers).
Store samples in a cold and dry room protected from light. Ensure that no cross-contamination takes place.
Because solid samples can be heterogeneous, grind a representative part of the samples very well and homogenize before weighting.
The AEP (see Test Kit Components (b)) is a 10-fold concentrated solution. It must be brought to room temperature (20–25°C; 68–77°F) before use. Before use, the buffer has to be diluted 10-fold (1 + 9) with distilled water (i.e., 100 mL buffer concentrate + 900 mL distilled water). Prior to dilution, dissolve any crystals by incubating the buffer in a water bath at 37°C (99°F). The diluted buffer is stable at 20–25°C (68–77°F) for 4 weeks or 12 weeks at 2–8°C. Make sure that the buffer is not contaminated with peanut during use.
The washing buffer is provided as a 10-fold concentrated solution [see Test Kit Components (g)]. Before use, the buffer has to be diluted 10-fold (1 + 9) with distilled water (i.e., 100 mL buffer concentrate + 900 mL distilled water). Prior to dilution, dissolve any crystals by incubating the buffer in a water bath at 37°C (99°F). The diluted buffer is stable at 20–25°C (68–77°F) for 4 weeks.
Sample Preparation
Take a representative amount of sample and homogenize.
Weigh 1 g ± 0.01 g homogenized sample and add to a 50 mL centrifuge tube. Add 1 g SMP and 20 mL AEP. [AEP should be at a temperature of about 60°C (140°F).] For liquid samples, mix 1 mL sample with 1 g SMP and add 19 mL AEP.
Mix thoroughly and incubate for 10 min at 60°C (140°F), shaking occasionally. Cool (e.g., in a water bath with ice).
Centrifuge: 10 min at 2500 × g preferably at 4°C (39°F) or filter with a 150 mm diameter filter (e.g., Munktell Grade 3hw by Ahlstrom-Munksjö; retention: 10 µm, paper weight: 65 g/m2)
If this centrifuge step does not produce a particle-free supernatant, the supernatant will need to be filtered through a 150 mm diameter filter (e.g., Munktell Grade 3 hw by Ahlstrom-Munksjö); Alternatively, 2 mL extract can be transferred to a reaction vial and centrifuged in a microcentrifuge for 10 min at 10 000 × g.
As an alternative to weighing the SMP to each sample, the SMP can be added to the AEP (1 g per 20 mL AEP). The shelf life of the buffer with SMP is one day.
The AEP extracts can be stored for 1 day at 20–25°C (68–77°F), 2 days at 2°C–8°C or for 1 month at −20°C (−4°F). If additional dilutions are necessary, they should be made with the AEP with SMP (1 g per 20 mL AEP).
Use 100 μL particle-free supernatant or filtrate for each well in the test.
Analysis
Bring all reagents to room temperature (20–25°C; 68–77°F) before use. Carefully follow the recommended washing procedure. Do not allow microwells to dry between working steps.
Do not use more than three strips (24 wells) at a time. In the case of more than three strips, a second uncoated plate (e.g., Greiner Bio-One, Cat. No. 655101) should be used as a pre-plate to avoid a time shift over the microtiter plate. All standards and samples are pipetted into the uncoated plate (at least 150 µL per well) and then quickly transferred to the coated microtiter plate with an eight-channel pipette (exactly 100 µL).
It is recommended to pipette the conjugate, the substrate/chromogen and the stop solution with a multichannel or stepper pipette to avoid a time shift over the plate.
Insert a sufficient number of wells into the microwell holder for all standards and samples to be run in duplicate. Record standard and sample positions in the wells.
Add 100 μL of each standard solution [see Test Kit Components (c)] or prepared sample to separate duplicate wells and incubate for 20 min at room temperature (20–25°C; 68–77°F).
Pour the liquid out of the wells and tap the microwell holder upside down vigorously (three times in a row) against absorbent paper to ensure complete removal of liquid from the wells. Fill all the wells with 250 μL washing buffer [see General Preparation (k)] and pour out the liquid again. Repeat this process another three times.
Add 100 μL of the ready-to-use enzyme conjugate [see Test Kit Components (d)] to each well and incubate for 20 min at room temperature (20–25°C; 68–77°F).
Pour the liquid out of the wells and tap the microwell holder upside down vigorously (three times in a row) against absorbent paper to ensure complete removal of liquid from the wells. Fill all the wells with 250 μL washing buffer [see General Preparation (k)] and pour out the liquid again. Repeat this process another three times.
Add 100 μL of the reddish substrate/chromogen solution [see Test Kit Components (e)] to each well and incubate for 10 min at room temperature (20–25°C; 68–77°F) in the dark.
Add 100 μL of the stop solution [see Test Kit Components (f)] to each well. Mix gently by shaking the plate manually.
Read the results with a microtiter plate reader. Measure the absorbance at 450 nm. Read within 30 min after addition of stop solution.
Calculations, Interpretation and Test Result Report
The dilution factor 20, which results after sample preparation, has already been considered for the standard concentrations. The concentration of the sample can be read directly from the standard curve.
For samples with absorbance readings >standard 5 at 450 nm, a further dilution and re-analysis of samples is required if a quantitative result is wanted for these samples. Please follow instructions given in section (g) under Sample Preparation.
Determine the peanut content of each duplicate sample well by reference to a calibration curve measured by the actual test run utilizing special computer software; plot the absorbance of standards versus the peanut content of standards. Use of RIDASOFT® Win.NET (R-Biopharm AG, Z9996FF) with 4-parameter logistic regression analysis is recommended (4).
A graphical profile of the standard curve is shown in the quality assurance certificate enclosed in the test kit. Absolute absorbances may vary between different runs (e.g., due to different temperatures or analysts). However, the shape of the standard curve should be similar to the one given in the quality assurance certificate. Minimum requirements are:
Optical densitiy (OD) at 450 nm for standard 5 higher than 1.2
OD values for standards should continuously increase with higher concentrations, especially when comparing standard 1 (0 mg/kg) and standard 2 (0.75 mg/kg)
An OD value for standard 1 which is much higher than the OD value stated in the certificate, could be an indication of errors during pipetting or incubation or contamination.
For a trained analyst, RSDs for duplicates of standards and samples on the plate are usually less than 10% except for standard 1 (0 mg/kg) where RSDs up to 30% can frequently occur.
All requirements should not be judged in isolation but as a whole; if one criterion does not fit to the above-mentioned criteria, it is recommended not to repeat the analytical run directly but to check for pipetting errors and results from control samples first.
Confirmation
No confirmatory or reference method was available at the time this method was being written.
Validation Study
Method Developer Studies
The manufacturer’s in-house validation scheme followed the AOAC INTERNATIONAL Standard Method Performance Requirement (SMPR®) 2018.012 (5), AOAC Appendix M (6), CLSI guideline EP25-A for stability testing of in-vitro diagnostics (7), and long-standing practical experiences of the method developers from other AOAC approvals such as AOAC Performance Tested MethodSM 101501 for RIDASCREEN®FAST Milk (8).
Selectivity study: cross-reactivities.—The cross-reactivity panel was established by AOACI and published as Appendix M (2012) is presented in Tables 1 and 2. This list includes some additional commodities based on some long-lasting experiences of the test kit manufacturer. In total, 91 commodities that were tested are listed in Tables 1 and 2. For analysis, food matrices or substances are extracted as a sample described in chapter sample preparation. Tables 1 and 2 shows that a few commodities showed extrapolated concentration values above the LOD of 0.15 mg/kg but there was no ELISA reactivity (OD of sample more than OD of standard 2) to the 91 tested commodities.
Ruggedness study.—Ruggedness experiments were undertaken to show the influence of deliberate perturbations on test kit results. These parameters are known to be subject to variation during use of the test kit. The perturbations explored to evaluate the ruggedness of the method were: (1) extraction time at 60°C, (2) water bath temperature, (3) pipetted volumes for standards and samples, (4) incubation time for ELISA steps, (5) incubation temperature of the ELISA procedure, and (6) plate shift due to pipetting velocity. Details for each experiment are given in the table heading.
Table 1.
Compounds tested for cross-reactivity and results of OD readings of these extracts compared to standard 1 (0 mg/kg peanut) and standard 2 (0.75 mg/kg peanut)a
| Category | Matrix/substance | OD |
|||
|---|---|---|---|---|---|
| Standard 1 | Standard 2 | Sample | c (extrapolated)b mg/kg | ||
| Cereals/ | Amaranth | 0.120 | 0.476 | 0.095 | < Standard 1 |
| pseudocereals | Barley | 0.120 | 0.476 | 0.097 | < Standard 1 |
| Buckwheat flour | 0.120 | 0.476 | 0.080 | < Standard 1 | |
| Corn flour | 0.120 | 0.476 | 0.105 | < Standard 1 | |
| Kamut | 0.120 | 0.476 | 0.099 | < Standard 1 | |
| Millet flour | 0.120 | 0.476 | 0.106 | < Standard 1 | |
| Oat flour | 0.120 | 0.476 | 0.088 | < Standard 1 | |
| Quinoa | 0.120 | 0.476 | 0.090 | < Standard 1 | |
| Rice flour | 0.120 | 0.476 | 0.091 | < Standard 1 | |
| Rye | 0.120 | 0.476 | 0.095 | < Standard 1 | |
| Semolina (soft wheat) | 0.126 | 0.508 | 0.119 | < Standard 1 | |
| Spelt | 0.120 | 0.476 | 0.080 | < Standard 1 | |
| Teff flour | 0.120 | 0.476 | 0.102 | < Standard 1 | |
| Wheat | 0.120 | 0.476 | 0.094 | < Standard 1 | |
| Beans/lentils/peas | Chickpeas | 0.120 | 0.476 | 0.096 | < Standard 1 |
| Green bean | 0.120 | 0.476 | 0.090 | < Standard 1 | |
| Green peas | 0.120 | 0.476 | 0.088 | < Standard 1 | |
| Kidney beans | 0.120 | 0.476 | 0.104 | < Standard 1 | |
| Lentils | 0.120 | 0.476 | 0.095 | < Standard 1 | |
| Lima beans | 0.120 | 0.476 | 0.086 | < Standard 1 | |
| Pinto beans | 0.195 | 0.586 | 0.147 | < Standard 1 | |
| Soy milk | 0.126 | 0.508 | 0.109 | < Standard 1 | |
| Soya flour | 0.120 | 0.476 | 0.113 | < Standard 1 | |
| White beans | 0.139 | 0.494 | 0.136 | < Standard 1 | |
| Nuts | Brazil nut | 0.139 | 0.494 | 0.136 | < Standard 1 |
| Cashew | 0.139 | 0.494 | 0.123 | < Standard 1 | |
| Cashew (roasted) | 0.195 | 0.586 | 0.142 | < Standard 1 | |
| Chestnut | 0.195 | 0.586 | 0.123 | < Standard 1 | |
| Macadamia | 0.139 | 0.494 | 0.102 | < Standard 1 | |
| Pecan nut | 0.139 | 0.494 | 0.105 | < Standard 1 | |
| Pistachio nut | 0.139 | 0.494 | 0.119 | < Standard 1 | |
| Walnut | 0.139 | 0.494 | 0.118 | < Standard 1 | |
| Walnut (roasted) | 0.139 | 0.494 | 0.129 | < Standard 1 | |
| Hazelnut raw | 0.145 | 0.536 | 0.223 | < LOD | |
| Hazelnut 10 min/130°C | 0.145 | 0.536 | 0.214 | < LOD | |
| Hazelnut 10 min/150°C | 0.145 | 0.536 | 0.192 | < LOD | |
| Hazelnut 10 min/180°C | 0.145 | 0.536 | 0.181 | < LOD | |
| Hazelnut 10 min/200°C | 0.145 | 0.536 | 0.165 | < LOD | |
| Almond raw | 0.145 | 0.536 | 0.182 | < LOD | |
| Almond 10 min/130°C | 0.145 | 0.536 | 0.176 | < LOD | |
| Almond 10 min/150°C | 0.145 | 0.536 | 0.167 | < LOD | |
| Almond 10 min/180°C | 0.145 | 0.536 | 0.169 | < LOD | |
| Almond 10 min/200°C | 0.145 | 0.536 | 0.177 | < LOD | |
Extraction was performed with AEP/SMP.
c = Concentration.
Table 2.
Compounds tested for cross-reactivity and results of OD readings of these extracts compared to standard 1 (0 mg/kg) and standard 2 (0.75 mg/kg)a
| Category | Matrix/substance | OD |
|||
|---|---|---|---|---|---|
| Standard 1 | Standard 2 | Sample | c (extraplotated)b mg/kg | ||
| Spices | Aniseed | 0.139 | 0.494 | 0.144 | < LOD |
| Basil | 0.139 | 0.494 | 0.159 | < LOD | |
| Caraway | 0.139 | 0.494 | 0.119 | < Standard 1 | |
| Cardamom | 0.139 | 0.494 | 0.115 | < Standard 1 | |
| Celery (powder) | 0.139 | 0.494 | 0.106 | < Standard 1 | |
| Chili | 0.139 | 0.494 | 0.208 | < LOD | |
| Cinnamon | 0.139 | 0.494 | 0.100 | < Standard 1 | |
| Cloves | 0.139 | 0.494 | 0.130 | < Standard 1 | |
| Cumin | 0.195 | 0.586 | 0.162 | < Standard 1 | |
| Curcuma | 0.195 | 0.586 | 0.164 | < Standard 1 | |
| Curry | 0.195 | 0.586 | 0.151 | < Standard 1 | |
| Fennel seed | 0.195 | 0.586 | 0.141 | < Standard 1 | |
| Fenugreek | 0.195 | 0.586 | 0.132 | < Standard 1 | |
| Garlic | 0.195 | 0.586 | 0.154 | < Standard 1 | |
| Ginger | 0.126 | 0.508 | 0.132 | < LOD | |
| Marjoram | 0.195 | 0.586 | 0.146 | < Standard 1 | |
| Mustard seeds (black-brown) | 0.195 | 0.586 | 0.207 | < LOD | |
| Mustard seeds (yellow) | 0.195 | 0.586 | 0.214 | < LOD | |
| Nutmeg | 0.195 | 0.586 | 0.187 | < Standard 1 | |
| Onion (powder) | 0.195 | 0.586 | 0.174 | < Standard 1 | |
| Paprika (sweet) | 0.145 | 0.536 | 0.340 | 0.37 | |
| Pepper (black) | 0.195 | 0.586 | 0.151 | < Standard 1 | |
| Pepper (white) | 0.195 | 0.586 | 0.149 | < Standard 1 | |
| Meat | Beef (cooked) | 0.126 | 0.508 | 0.118 | < Standard 1 |
| Chicken (cooked) | 0.126 | 0.508 | 0.163 | < LOD | |
| Pork (cooked) | 0.126 | 0.508 | 0.186 | < LOD | |
| Turkey (cooked) | 0.126 | 0.508 | 0.135 | < LOD | |
| Various | Apple juice | 0.126 | 0.508 | 0.128 | < LOD |
| Bovine gelatin | 0.125 | 0.525 | 0.255 | 0.27 | |
| Bovine serum albumin | 0.126 | 0.508 | 0.142 | < LOD | |
| Cocoa (powder) | 0.126 | 0.508 | 0.113 | < Standard 1 | |
| Coconut | 0.126 | 0.508 | 0.140 | < LOD | |
| Fetal calf serum | 0.126 | 0.508 | 0.128 | < LOD | |
| Fish gelatin | 0.126 | 0.508 | 0.137 | < LOD | |
| Orange juice | 0.126 | 0.508 | 0.139 | < LOD | |
| Porcine gelatin | 0.125 | 0.525 | 0.251 | 0.26 | |
| Raisins | 0.126 | 0.508 | 0.135 | < LOD | |
| Skim milk (powder) | 0.126 | 0.508 | 0.133 | < LOD | |
| Soya lecithin | 0.126 | 0.508 | 0.152 | < LOD | |
| Wheat starch | 0.126 | 0.508 | 0.147 | < LOD | |
| Whole egg (powder) | 0.126 | 0.508 | 0.145 | < LOD | |
| Seeds/stones/kernel | Linseed | 0.195 | 0.586 | 0.196 | < LOD |
| Pine kernel | 0.139 | 0.494 | 0.140 | < Standard 1 | |
| Poppy seeds | 0.139 | 0.494 | 0.121 | < Standard 1 | |
| Pumpkin kernels | 0.139 | 0.494 | 0.123 | < Standard 1 | |
| Rape seed | 0.195 | 0.586 | 0.135 | < Standard 1 | |
| Sesame | 0.195 | 0.586 | 0.123 | < Standard 1 | |
| Sunflower kernels | 0.139 | 0.494 | 0.120 | < Standard 1 | |
Extraction was performed with AEP/SMP.
c = Concentration.
Table 3 shows the results of the ruggedness study where the extraction temperature was varied from 50 to 70°C and the extraction time was varied from 8 to 12 min. Neither decreasing nor increasing the extraction temperature or varying the extraction time from the nominal values showed a significant effect (P-values >0.05).
Table 3.
Robustness of sample extraction to temperature and time; reference conditions are extraction for 10 min at 60°C; three different incurred samples were tested in two test portions each.
| Temperature |
Time |
||||||||
|---|---|---|---|---|---|---|---|---|---|
| Sample | Target | Reference | 50°C | 70°C | ANOVA | Reference | 8 min | 12 min | ANOVA |
| mg/kg | mg/kg | mg/kg | mg/kg | P-value | mg/kg | mg/kg | mg/kg | P-value | |
| Cookie | 3.29 | 2.76 | 3.08 | 2.61 | 0.167 | 2.76 | 2.77 | 2.79 | 0.451 |
| 3.11 | 2.84 | 2.43 | 3.11 | 2.66 | 2.85 | ||||
| Chocolate | 1.50 | 1.22 | 1.08 | 1.05 | 0.300 | 1.22 | 1.35 | 1.07 | 0.334 |
| 1.09 | 1.09 | 1.06 | 1.09 | 1.15 | 1.08 | ||||
| Ice cream | 1.00 | 0.79 | 0.79 | 0.74 | 0.345 | 0.79 | 0.84 | 0.81 | 0.502 |
| 0.83 | 0.88 | 0.78 | 0.83 | 0.84 | 0.85 | ||||
Table 4 shows the results of the ruggedness study when the pipetting volumes were varied from 90 to 110 µL and the samples were incubated for three different time periods and three different temperatures. Changing volumes and times resulted in non-significant differences between the different conditions. Varying the incubation temperature for the ELISA plate incubation up to 30°C resulted in significant differences (P = 0.004). The kit’s instructions for use already state that the incubation temperature and all reagents required for the ELISA procedure should have a temperature between 20 and 25°C.
Table 4.
Robustness of the ELISA procedure to variation of volumes; seven different spiked samples were tested in duplicate
| Sample | Target | Reference (100 µL) | 90 µL | 110 µL | ANOVA |
|---|---|---|---|---|---|
| mg/kg | Recovery, % | Recovery, % | Recovery, % | P-value | |
| Ice cream | 0.00 | — | — | — | — |
| Ice cream | 0.75 | 79 | 86 | 87 | 0.0725 |
| Ice cream | 1.50 | 89 | 87 | 95 | |
| Milk chocolate | 3.00 | 74 | 73 | 82 | |
| Cookie | 1.50 | 73 | 73 | 83 | |
| Cookie | 3.00 | 82 | 78 | 90 | |
| Cookie | 6.00 | 88 | 84 | 92 | |
|
| |||||
| Incubation time (ELISA) | |||||
|
| |||||
| Sample | Target mg/kg | Reference (20 min) Recovery, % | 18 min Recovery, % | 22 min Recovery, % | ANOVA P-value |
|
| |||||
| Ice cream | 0.00 | — | — | — | — |
| Ice cream | 0.75 | 88 | 92 | 100 | 0.707 |
| Ice cream | 1.50 | 89 | 95 | 93 | |
| Milk chocolate | 3.00 | 85 | 84 | 80 | |
| Cookie | 1.50 | 81 | 85 | 81 | |
| Cookie | 3.00 | 87 | 89 | 85 | |
| Cookie | 6.00 | 90 | 90 | 84 | |
|
| |||||
| Incubation temperature (ELISA) | |||||
|
| |||||
| Sample | Target | Reference (23°C) | 18°C | 30°C | ANOVA |
| mg/kg | mg/kg | mg/kg | mg/kg | P-value | |
|
| |||||
| Ice cream | 0.00 | — | — | — | — |
| Ice cream | 0.75 | 76 | 69 | 89 | 0.004 |
| Ice cream | 1.50 | 82 | 79 | 87 | |
| Milk chocolate | 3.00 | 76 | 73 | 80 | |
| Cookie | 1.50 | 71 | 69 | 81 | |
| Cookie | 3.00 | 77 | 75 | 80 | |
| Cookie | 6.00 | 80 | 81 | 89 | |
The reaction of every sandwich ELISA starts with the addition of the first standard/sample. In the case where many samples are pipetted onto the same plate, a considerable time shift (different effective incubation times on the plate) can occur between the first well and the last well. To demonstrate that the time shift effect between pipetting the first and the final samples is not significant if proper precautionary measures are taken, standards and one sample extract (pooled sample extracts from the incurred cookie at a level of 1.64 mg/kg) were pipetted using a normal pipet. The tip for the pipet was exchanged and flushed after every two wells simulating the pipetting of different sample extracts and standards in duplicate (see Table 5).
Table 5.
Pipetting scheme (vertical) for characterization of a shift of results due to pipetting velocity
| 1 | 2 | 3 | 4 | ….a | 12 | |
|---|---|---|---|---|---|---|
| A | STD 1 | STD 1 | sample 4 | sample 4 | ….. | sample 36 |
| B | STD 2 | STD 2 | sample 5 | sample 5 | …. | sample 37 |
| C | STD 3 | STD 3 | sample 6 | sample 6 | …. | sample 38 |
| D | STD 4 | STD 4 | sample 7 | sample 7 | …. | sample 39 |
| E | STD 5 | STD 5 | sample 8 | sample 8 | …. | sample 40 |
| F | sample 1 | sample 1 | sample 9 | sample 9 | …. | sample 41 |
| G | sample 2 | sample 2 | sample 10 | sample 10 | …. | sample 42 |
| H | sample 3 | sample 3 | sample 11 | sample 11 | …. | sample 43 |
Column represents columns 5 to 11 of an ELISA plate.
Figure 1 shows the graphical analysis of the plate shift experiment. Overall, the plate shift due to the pipetting velocity was low and after 43 replicates the concentration decreased by only 20%. Since the method developers advise use of a pre-plate in the case of more than three strips (which corresponds to seven samples in this setup) the plate shift effect is negligible in any case.
Estimation of LOD.—To estimate an overall LOD, 10 test portions for cookies, milk chocolate, ice cream, trail mix (almonds with skin, cashew, blanched almonds without skin, sultanas, cranberries, black currant), puffed rice cereal (rice, sugar, salt, malt flavor, vitamins and minerals), and granola bar (whole-grain oat flakes, sugar, sunflower oil, honey, salt, molasses, emulsifier sun flower oil lecithin, sodium hydrogen carbonate) were extracted according to the described procedure and analyzed using three different test kit lots. The results are shown in Table 6 and are used in the following to estimate an LOD across matrixes and lots (Table 7) from the average variances from each matrix.
Figure 1.

Results (mg/kg) from vertical pipetting scheme for one sample extract in 43 duplicates using a micropipette with tip exchange and tip flushing before each duplicate; mean ± SD of six MTPs (two technicians analyzed each one microtiter plate (MTP) from three different MTP lots).
Table 6.
Results for six different blank matrixes in three different test kit lots with 10 replicates for each lot
| Cookies |
Milk chocolate |
||||||
|---|---|---|---|---|---|---|---|
| TC 1 | TC 2 | TC 3 | TC 1 | TC 2 | TC 3 | ||
| Replicate | mg/kg | mg/kg | mg/kg | Replicate | mg/kg | mg/kg | mg/kg |
| 1 | −0.02 | 0.03 | 0.01 | 1 | −0.02 | −0.03 | 0.11 |
| 2 | −0.01 | 0.02 | 0.00 | 2 | 0.00 | −0.04 | 0.11 |
| 3 | −0.03 | 0.01 | −0.03 | 3 | 0.01 | −0.03 | 0.10 |
| 4 | 0.07 | 0.09 | 0.09 | 4 | 0.01 | −0.06 | 0.06 |
| 5 | 0.08 | 0.11 | 0.14 | 5 | −0.04 | −0.05 | 0.03 |
| 6 | 0.04 | 0.06 | 0.08 | 6 | 0.02 | −0.01 | 0.05 |
| 7 | 0.06 | 0.07 | 0.07 | 7 | 0.02 | −0.02 | 0.08 |
| 8 | 0.04 | 0.05 | 0.05 | 8 | −0.04 | 0.01 | 0.07 |
| 9 | 0.06 | 0.06 | 0.10 | 9 | 0.02 | −0.02 | 0.05 |
| 10 | 0.06 | 0.06 | 0.07 | 10 | 0.02 | −0.02 | 0.05 |
| Mean | 0.03 | 0.06 | 0.06 | Mean | 0.00 | −0.03 | 0.07 |
| SD (all TCs) | 0.0408 | SD (all TCs) | 0.0481 | ||||
| SD2 (variance) | 0.00166 | SD2 (variance) | 0.00232 | ||||
| Ice cream |
Trail mix |
||||||
|---|---|---|---|---|---|---|---|
| TC 1 | TC 2 | TC 3 | TC 1 | TC 2 | TC 3 | ||
| Replicate | mg/kg | mg/kg | mg/kg | Replicate | mg/kg | mg/kg | mg/kg |
| 1 | 0.00 | −0.04 | 0.07 | 1 | −0.03 | −0.02 | 0.01 |
| 2 | −0.01 | −0.04 | 0.09 | 2 | −0.05 | −0.04 | −0.03 |
| 3 | 0.00 | −0.02 | 0.07 | 3 | −0.05 | −0.05 | −0.04 |
| 4 | −0.01 | −0.01 | 0.09 | 4 | −0.06 | −0.05 | −0.02 |
| 5 | 0.01 | −0.04 | 0.09 | 5 | −0.06 | −0.04 | −0.04 |
| 6 | 0.00 | −0.01 | 0.07 | 6 | −0.06 | −0.03 | −0.03 |
| 7 | −0.01 | −0.04 | 0.04 | 7 | −0.07 | −0.05 | −0.04 |
| 8 | 0.01 | −0.02 | 0.07 | 8 | −0.04 | −0.04 | −0.02 |
| 9 | 0.00 | 0.02 | 0.09 | 9 | −0.02 | −0.03 | −0.02 |
| 10 | −0.01 | −0.03 | 0.09 | 10 | −0.05 | −0.06 | −0.03 |
| Mean | 0.00 | −0.02 | 0.08 | Mean | −0.05 | −0.04 | −0.03 |
| SD (all TCs) | 0.0461 | SD (all TCs) | 0.0170 | ||||
| SD2 (variance) | 0.00213 | SD2 (variance) | 0.000287 | ||||
| Puffed rice cereals |
Granola bar |
||||||
|---|---|---|---|---|---|---|---|
| TC 1 | TC 2 | TC 3 | TC 1 | TC 2 | TC 3 | ||
| Replicate | mg/kg | mg/kg | mg/kg | Replicate | mg/kg | mg/kg | mg/kg |
| 1 | −0.02 | −0.01 | 0.07 | 1 | 0.02 | 0.03 | 0.02 |
| 2 | −0.03 | −0.01 | 0.05 | 2 | 0.02 | 0.04 | 0.05 |
| 3 | −0.04 | −0.02 | 0.06 | 3 | 0.01 | 0.05 | 0.03 |
| 4 | −0.04 | −0.02 | 0.09 | 4 | 0.03 | 0.06 | 0.05 |
| 5 | −0.04 | 0.01 | 0.06 | 5 | 0.00 | 0.03 | 0.01 |
| 6 | −0.02 | −0.01 | 0.05 | 6 | 0.06 | 0.08 | 0.11 |
| 7 | −0.04 | −0.04 | 0.04 | 7 | 0.04 | 0.07 | 0.11 |
| 8 | −0.01 | 0.01 | 0.06 | 8 | 0.04 | 0.06 | 0.11 |
| 9 | 0.00 | 0.00 | 0.08 | 9 | 0.03 | 0.05 | 0.10 |
| 10 | 0.00 | −0.03 | 0.06 | 10 | 0.03 | 0.06 | 0.09 |
| Mean | −0.02 | −0.01 | 0.06 | Mean | 0.03 | 0.05 | 0.07 |
| SD (all TCs) | 0.0414 | SD (all TCs) | 0.0311 | ||||
| SD2 (variance) | 0.00171 | SD2 (variance) | 0.000964 | ||||
|
| |||||||
Table 7.
Estimation of an overall LOD across six different matrixes and three different test kit lots
| Matrix | SD2 (variance), mg/kg |
|---|---|
| Cookies | 0.00166 |
| Milk chocolate | 0.00232 |
| Ice cream | 0.00213 |
| Trail mix | 0.00029 |
| Puffed rice cereals | 0.00171 |
| Granola bar | 0.00096 |
| Mean variance | 0.00151 |
| Mean SD | 0.039 |
| Mean (mg/kg, all matrixes and lots) | 0.017 |
| LOD [mean + (3.3 × SD)] | 0.15 |
| LOQ (3 × LOD) | 0.45 |
Table 7 summarizes the estimation of an overall LOD and resulted in a value of 0.15 mg/kg including a mean concentration across all matrixes and lots of 0.017 mg/kg. By multiplying this LOD concentration with three, an LOQ of 0.45 mg/kg is obtained.
Verification of LOQ.—The claimed LOQ was verified by a spiking experiment at 0.75 mg/kg peanut using all three lots. Ten test portions of each claimed matrix were spiked using the spiking solution described in Standard Solutions and Spiking Solutions. As shown in Table 8, at the spiking level of 0.75 mg/kg peanut, the mean recoveries were in the acceptable range between 66 and 106% with RSDs at or below 9% in all cases. The only exception was the trail mix, which showed recoveries between 51 and 67% while RSDs were below 12%. Overall, quantification at 0.75 mg/kg was observed to deliver results with acceptable precision (Table 9). However, due to the recovery values observed with these food matrixes, calculation of quantitative values required extrapolation below the lowest positive calibration standard, which is not recommended. If an unknown sample with an actual concentration of 0.75 mg/kg peanut was analyzed according to the kit insert instructions, a result of <LOQ may be reported. The table summarizes the LOQs determined in cookies, ice cream, puffed rice cereals, granola bar, milk chocolate, and trail mix analyzed using all three test kit lots.
Evaluation of the recovery in incurred cookies.—For characterization of recovery from naturally incurred and processed samples, cookies, milk chocolate, and ice cream were produced and contaminated at different peanut levels. The contaminating peanut preparation is the NIST SRM 2387 peanut butter (see Materials and Methods).
Table 8.
LOQ in cookies, milk chocolate, ice cream, trail mix, puffed rice cereal and granola bar by spiking at 0.75 mg/kg peanut; for each matrix and test kit lot the mean concentration, SD and RSD is calculated
| Cookies |
Milk chocolate |
||||||
|---|---|---|---|---|---|---|---|
| TC 1 | TC 2 | TC 3 | TC 1 | TC 2 | TC 3 | ||
| Replicate | mg/kg | mg/kg | mg/kg | Replicate | mg/kg | mg/kg | mg/kg |
| 1 | 0.59 | 0.59 | 0.66 | 1 | 0.53 | 0.50 | 0.62 |
| 2 | 0.62 | 0.63 | 0.68 | 2 | 0.53 | 0.48 | 0.59 |
| 3 | 0.67 | 0.60 | 0.67 | 3 | 0.51 | 0.47 | 0.56 |
| 4 | 0.76 | 0.74 | 0.76 | 4 | 0.49 | 0.49 | 0.58 |
| 5 | 0.67 | 0.65 | 0.75 | 5 | 0.52 | 0.49 | 0.61 |
| 6 | 0.65 | 0.63 | 0.73 | 6 | 0.50 | 0.47 | 0.53 |
| 7 | 0.67 | 0.64 | 0.75 | 7 | 0.54 | 0.54 | 0.60 |
| 8 | 0.64 | 0.65 | 0.71 | 8 | 0.53 | 0.51 | 0.62 |
| 9 | 0.65 | 0.63 | 0.70 | 9 | 0.51 | 0.48 | 0.57 |
| 10 | 0.65 | 0.64 | 0.73 | 10 | 0.50 | 0.50 | 0.57 |
| Mean | 0.66 | 0.64 | 0.71 | Mean | 0.52 | 0.49 | 0.58 |
| SD | 0.04 | 0.04 | 0.04 | SD | 0.02 | 0.02 | 0.03 |
| RSD, % | 6.8 | 6.1 | 5.0 | RSD, % | 3.0 | 4.4 | 4.9 |
| Mean recovery, % | 87 | 85 | 95 | Mean recovery, % | 69 | 66 | 78 |
|
|
|||||||
| Ice cream |
Trail mix |
||||||
|---|---|---|---|---|---|---|---|
| TC 1 | TC 2 | TC 3 | TC 1 | TC 2 | TC 3 | ||
| Replicate | mg/kg | mg/kg | mg/kg | Replicate | mg/kg | mg/kg | mg/kg |
| 1 | 0.58 | 0.56 | 0.64 | 1 | 0.43 | 0.41 | 0.53 |
| 2 | 0.56 | 0.54 | 0.68 | 2 | 0.41 | 0.44 | 0.52 |
| 3 | 0.54 | 0.49 | 0.65 | 3 | 0.36 | 0.38 | 0.47 |
| 4 | 0.51 | 0.51 | 0.62 | 4 | 0.36 | 0.35 | 0.46 |
| 5 | 0.52 | 0.50 | 0.64 | 5 | 0.45 | 0.50 | 0.62 |
| 6 | 0.53 | 0.50 | 0.60 | 6 | 0.38 | 0.43 | 0.51 |
| 7 | 0.52 | 0.50 | 0.61 | 7 | 0.29 | 0.37 | 0.45 |
| 8 | 0.52 | 0.53 | 0.64 | 8 | 0.40 | 0.43 | 0.51 |
| 9 | 0.63 | 0.63 | 0.70 | 9 | 0.38 | 0.38 | 0.49 |
| 10 | 0.62 | 0.60 | 0.66 | 10 | 0.36 | 0.39 | 0.47 |
| Mean | 0.55 | 0.53 | 0.64 | Mean | 0.38 | 0.41 | 0.50 |
| SD | 0.04 | 0.05 | 0.03 | SD | 0.04 | 0.04 | 0.05 |
| RSD, % | 7.8 | 8.8 | 4.9 | RSD, % | 11.7 | 10.7 | 9.8 |
| Mean recovery, % | 74 | 71 | 86 | Mean recovery, % | 51 | 54 | 67 |
|
|
|||||||
| Puffed rice cereals |
Granola bar |
||||||
|---|---|---|---|---|---|---|---|
| TC 1 | TC 2 | TC 3 | TC 1 | TC 2 | TC 3 | ||
| Replicate | mg/kg | mg/kg | mg/kg | Replicate | mg/kg | mg/kg | mg/kg |
| 1 | 0.70 | 0.65 | 0.79 | 1 | 0.61 | 0.58 | 0.71 |
| 2 | 0.78 | 0.78 | 0.84 | 2 | 0.57 | 0.63 | 0.73 |
| 3 | 0.73 | 0.64 | 0.76 | 3 | 0.59 | 0.65 | 0.73 |
| 4 | 0.69 | 0.68 | 0.79 | 4 | 0.60 | 0.66 | 0.73 |
| 5 | 0.69 | 0.62 | 0.80 | 5 | 0.61 | 0.65 | 0.64 |
| 6 | 0.72 | 0.63 | 0.78 | 6 | 0.72 | 0.70 | 0.71 |
| 7 | 0.66 | 0.61 | 0.77 | 7 | 0.67 | 0.63 | 0.70 |
| 8 | 0.69 | 0.66 | 0.80 | 8 | 0.64 | 0.62 | 0.71 |
| 9 | 0.69 | 0.66 | 0.80 | 9 | 0.65 | 0.63 | 0.70 |
| 10 | 0.68 | 0.65 | 0.79 | 10 | 0.65 | 0.62 | 0.68 |
| Mean | 0.70 | 0.66 | 0.79 | Mean | 0.63 | 0.64 | 0.70 |
| SD | 0.03 | 0.05 | 0.02 | SD | 0.04 | 0.03 | 0.03 |
| RSD, % | 4.5 | 7.1 | 2.7 | RSD, % | 7.1 | 4.8 | 3.9 |
| Mean recovery, % | 94 | 88 | 106 | Mean recovery, % | 84 | 85 | 93 |
|
| |||||||
Table 9.
Summary for LOQ data in six different matrixes (cookies, milk chocolate, ice cream, trail mix, puffed rice cereal, and granola bar) in three different test kit lots
| TC 1 |
TC 2 |
TC 3 |
||||
|---|---|---|---|---|---|---|
| Matrix | mg/kg | Rec., % | mg/kg | Rec., % | mg/kg | Rec., % |
| Cookies | 0.66 | 87 | 0.64 | 85 | 0.71 | 95 |
| Milk chocolate | 0.48 | 69 | 0.50 | 66 | 0.55 | 78 |
| Ice cream | 0.53 | 74 | 0.55 | 71 | 0.54 | 86 |
| Trail mixes | 0.38 | 51 | 0.41 | 54 | 0.50 | 67 |
| Puffed rice cereal | 0.70 | 94 | 0.66 | 88 | 0.79 | 106 |
| Granola bar | 0.63 | 84 | 0.64 | 85 | 0.70 | 93 |
-
Instructions for preparation of incurred cookies.—NIST peanut butter suspension: 50 mg NIST SRM 2387 peanut butter in 10 mL AEP (corresponds to 5 mg peanut per mL suspension).
Ingredients.—Margarine, sugar, vanilla sugar, sodium chloride, wheat flour, semolina, skim milk powder, water, and NIST SRM 2387 peanut butter in AEP suspension
Peanut concentration (before baking).—22 mg peanut in 732 g dough, equivalent to 30.05 mg peanut per kg of dough.
Baking procedure.—Preparation of three cookies per baking condition with approximately 50 g and 1 cm height each. Four different baking conditions were applied:
15 min at 150°C (302°F)
35 min at 120°C (248°F)
25 min at 150°C (302°F)
15 min at 180°C (356°F)
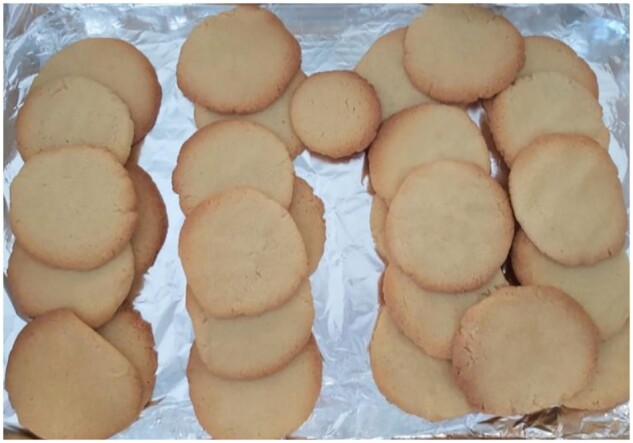
Peanut concentration (after baking).—Table 10 summarizes the different weights for each cookie preparation before and after baking to calculate the peanut content of each preparation. Figures 2 and 3 show the different cookie preparations.
Preparation of blank cookies.—Ingredients for blank cookies were as described above for incurred cookies but without addition of peanut. Cookies were baked at 150°C (302°F) for 25 min. Cookies were ground after baking and tested for a peanut concentration below LOQ before using these cookies to deplete the incurred cookies.
Preparation of incurred cookie samples and analysis.—The contaminated incurred material and the blank material were mixed to obtain concentrations of approximately 1.6 mg/kg and 3.2 mg/kg peanut (mixtures 1 + 9 and 1 + 19; see Table 11). Six test portions were analyzed per material and test kit lot. Table 12 shows the results for cookies baked at 150°C for 15 min. These materials were also used for characterization of repeatability, intermediate precision, and robustness. Recoveries were uniformly between 81 and 92%. There is a hint that the lower concentration cookies show a lower level of precision and/or higher inhomogeneity which might be the reason why differences between lots are not significant any longer. Since the highest observed RSD was 11%, this is acceptable. The higher concentration cookies exhibited RSDs of about 4.5%. Nevertheless, when comparing results for the analysis of variance (ANOVA) statistics between Tables 12–15, there is no clear answer to one of the three lots being different from the other two lots.
Table 10.
Summary of weighing results before and after baking for the four different cookie preparations and calculation of peanut content
| Baking |
Peanut |
||
|---|---|---|---|
| Baking condition | Before, g | After, g | mg/kg |
| 35 min at 120°C | 150.67 | 137.77 | 32.9 |
| 25 min at 150°C | 150.19 | 132.83 | 34.0 |
| 15 min at 150°C | 150.34 | 137.53 | 32.8 |
| 15 min at 180°C | 150.92 | 133.31 | 34.0 |
Figure 2.

Different cookie preparation and their appearance after baking at different temperatures and times.
Figure 3.
Blank cookie preparation and their appearance after baking at 150°C for 25 min.
Table 11.
Peanut concentrations after mixing different incurred cookie preparations with cookie blank material
| Cookie |
Peanut | ||
|---|---|---|---|
| Baking condition | Incurred | Blank | mg/kg |
| 15 min at 150°C | 1 part | 9 parts | 3.28 |
| 1 part | 19 parts | 1.64 | |
| 35 min at 120°C | 1 part | 9 parts | 3.29 |
| 25 min at 150°C | 1 part | 9 parts | 3.40 |
| 15 min at 180°C | 1 part | 9 parts | 3.40 |
Table 12.
Recovery experiment for cookies baked at 150°C for 15 min incurred with around 33 mg/kg peanut and mixed 1 + 9 and 1 + 19 with blank cookie material to target concentrations of around 3.3 and 1.6 mg/kg peanut; six extractions per lot and sample
| Incurred cookies 150°C, 15 min (3.28 mg/kg) | ||||||
|---|---|---|---|---|---|---|
| TC1 |
TC2 |
TC3 |
||||
| Replicate | mg/kg | Rec., % | mg/kg | Rec., % | mg/kg | Rec., % |
| 1 | 3.25 | 99 | 2.94 | 90 | 2.84 | 87 |
| 2 | 2.91 | 89 | 2.88 | 88 | 2.82 | 86 |
| 3 | 2.89 | 88 | 2.63 | 80 | 2.60 | 79 |
| 4 | 2.96 | 90 | 2.76 | 84 | 2.68 | 82 |
| 5 | 2.95 | 90 | 2.68 | 82 | 2.60 | 79 |
| 6 | 3.07 | 94 | 2.69 | 82 | 2.62 | 80 |
| Mean | 3.01 | 92 | 2.76 | 84 | 2.69 | 82 |
| SD | 0.14 | 0.12 | 0.11 | |||
| RSD (%) | 4.5 | 4.4 | 4.1 | |||
| ANOVA P-value | 0.00135 | |||||
| Incurred cookies 150 °C, 15 min (1.64 mg/kg) | ||||||
|---|---|---|---|---|---|---|
| TC1 |
TC2 |
TC3 |
||||
| Replicate | mg/kg | Rec., % | mg/kg | Rec., % | mg/kg | Rec., % |
| 1 | 1.22 | 74 | 1.17 | 71 | 1.25 | 76 |
| 2 | 1.60 | 98 | 1.49 | 91 | 1.55 | 95 |
| 3 | 1.54 | 94 | 1.36 | 83 | 1.46 | 89 |
| 4 | 1.58 | 96 | 1.44 | 88 | 1.49 | 91 |
| 5 | 1.33 | 81 | 1.29 | 79 | 1.31 | 80 |
| 6 | 1.34 | 82 | 1.21 | 74 | 1.35 | 82 |
| Mean | 1.44 | 88 | 1.33 | 81 | 1.40 | 85 |
| SD | 0.16 | 0.13 | 0.12 | |||
| RSD (%) | 11 | 9.5 | 8.3 | |||
| ANOVA P-value | 0.386 | |||||
|
| ||||||
Table 13 shows that baking cookies at 120°C for 35 min resulted in excellent recoveries between 95 and 109%, while higher baking temperatures (180°C) and increased baking times (25 min at 150°C) resulted in lower but still acceptable recoveries between 60 and 69%.
Evaluation of the recovery in incurred milk chocolate
Table 13.
Recovery experiment for three different cookies (150°C for 25 min, 120°C for 35 min, 180°C for 15 min) incurred with around 34 mg/kg peanut and mixed 1 + 9 with blank cookie material to a target concentration of around 3.4 mg/kg peanut; six extractions per lot and sample
| Incurred cookies 150°C, 25 min (3.4 mg/kg) | ||||||
|---|---|---|---|---|---|---|
| TC1 |
TC2 |
TC3 |
||||
| Replicate | mg/kg | Rec., % | mg/kg | Rec., % | mg/kg | Rec., % |
| 1 | 2.62 | 77 | 2.53 | 74 | 2.31 | 68 |
| 2 | 2.25 | 66 | 2.25 | 66 | 2.01 | 59 |
| 3 | 2.48 | 73 | 2.49 | 73 | 2.23 | 66 |
| 4 | 2.51 | 74 | 2.51 | 74 | 2.25 | 66 |
| 5 | 2.14 | 63 | 2.18 | 64 | 1.95 | 57 |
| 6 | 2.41 | 71 | 2.29 | 67 | 2.15 | 63 |
| Mean | 2.40 | 71 | 2.38 | 70 | 2.15 | 63 |
| SD | 0.18 | 0.15 | 0.14 | |||
| RSD (%) | 7.4 | 6.4 | 6.6 | |||
| ANOVA P-value | 0.0279 | |||||
| Incurred cookies 120°C, 35 min (3.29 mg/kg) | ||||||
|---|---|---|---|---|---|---|
| TC1 |
TC2 |
TC3 |
||||
| Replicate | mg/kg | Rec., % | mg/kg | Rec., % | mg/kg | Rec., % |
| 1 | 4.31 | 131 | 4.24 | 129 | 3.76 | 114 |
| 2 | 4.06 | 123 | 4.07 | 124 | 3.64 | 111 |
| 3 | 3.26 | 99 | 3.22 | 98 | 2.84 | 86 |
| 4 | 3.16 | 96 | 2.74 | 83 | 2.67 | 81 |
| 5 | 2.89 | 88 | 2.59 | 79 | 2.43 | 74 |
| 6 | 3.93 | 119 | 3.61 | 110 | 3.34 | 102 |
| Mean | 3.60 | 109 | 3.41 | 104 | 3.11 | 95 |
| SD | 0.57 | 0.68 | 0.54 | |||
| RSD (%) | 16 | 20 | 18 | |||
| ANOVA P-value | 0.391 | |||||
| Incurred cookies 180°C, 15 min (3.4 mg/kg) | ||||||
|---|---|---|---|---|---|---|
| TC1 |
TC2 |
TC3 |
||||
| Replicate | mg/kg | Rec., % | mg/kg | Rec., % | mg/kg | Rec., % |
| 1 | 2.02 | 59 | 1.91 | 56 | 1.81 | 53 |
| 2 | 2.49 | 73 | 2.24 | 66 | 2.06 | 61 |
| 3 | 2.46 | 72 | 2.37 | 70 | 2.20 | 65 |
| 4 | 2.35 | 69 | 2.49 | 73 | 2.06 | 61 |
| 5 | 2.43 | 71 | 2.23 | 66 | 2.17 | 64 |
| 6 | 2.23 | 66 | 2.05 | 60 | 1.86 | 55 |
| Mean | 2.33 | 69 | 2.22 | 65 | 2.03 | 60 |
| SD | 0.18 | 0.21 | 0.16 | |||
| RSD (%) | 7.7 | 9.5 | 7.9 | |||
| ANOVA P-value | 0.0365 | |||||
|
| ||||||
Instructions for preparation of incurred milk chocolate.—Ingredients.—Commercial peanut-free milk chocolate, NIST SRM 2387 peanut butter in AEP suspension After contamination of the milk chocolate with peanut, the milk chocolate was heated up to 80°C (176°F) and stirred for 1 h. Peanut concentration: 0.45 mg in 300 g, equivalent to 1.5 mg/kg.
Analysis of incurred milk chocolate.—Table 14 shows the results for this incurred milk chocolate material at a level of 1.50 mg/kg. Recoveries varied between 67 and 74% which is acceptable according to SMPR 2018.012. RSDs were 8.3% or lower which is good for a complicated matrix like chocolate. All three test kit lots delivered comparable results but significantly higher results in the pilot scale lot (TC) 3 (P = 0.04).
Evaluation of the recovery in incurred ice Cream
Table 14.
Recovery experiment for incurred milk chocolate with peanut at a level of 1.5 mg/kg; six extractions per lot and sample
| TC1 |
TC2 |
TC3 |
||||
|---|---|---|---|---|---|---|
| Replicate | mg/kg | Rec., % | mg/kg | Rec., % | mg/kg | Rec., % |
| 1 | 1.00 | 67 | 0.97 | 65 | 1.07 | 71 |
| 2 | 0.96 | 64 | 0.95 | 63 | 1.04 | 69 |
| 3 | 1.01 | 67 | 1.02 | 68 | 1.11 | 74 |
| 4 | 1.01 | 67 | 0.98 | 65 | 1.08 | 72 |
| 5 | 1.08 | 72 | 0.98 | 65 | 1.10 | 73 |
| 6 | 1.14 | 76 | 1.11 | 74 | 1.30 | 87 |
| Mean | 1.03 | 69 | 1.00 | 67 | 1.12 | 74 |
| SD | 0.06 | 0.06 | 0.09 | |||
| RSD (%) | 6.2 | 5.2 | 8.3 | |||
| ANOVA P-value | 0.0429 | |||||
Instructions for preparation of incurred ice cream.—Ingredients.—Commercial peanut-free ice cream, NIST SRM 2387 peanut butter in AEP suspension. Melted ice cream was stirred at room temperature, incurred with a peanut butter suspension, aliquoted and re-frozen. Peanut concentration: 0.40 mg in 400 g, equivalent to 1.0 mg/kg.
Analysis of incurred ice cream.—Table 15 shows the results for this incurred ice cream material at a level of 1.00 mg/kg. Recoveries varied between 73 and 85% which is as good as RSDs at 7.9% or lower. All three test kit lots delivered comparable results but significantly higher results in TC 3 (P <0.001).
Table 15.
Recovery experiment for incurred ice cream with peanut at a level of 1.0 mg/kg; six extractions per lot and sample
| TC1 |
TC2 |
TC3 |
||||
|---|---|---|---|---|---|---|
| Replicate | mg/kg | Rec., % | mg/kg | Rec., % | mg/kg | Rec., % |
| 1 | 0.73 | 73 | 0.68 | 68 | 0.82 | 82 |
| 2 | 0.72 | 72 | 0.65 | 65 | 0.81 | 81 |
| 3 | 0.81 | 81 | 0.71 | 71 | 0.89 | 89 |
| 4 | 0.74 | 74 | 0.79 | 79 | 0.87 | 87 |
| 5 | 0.74 | 74 | 0.79 | 79 | 0.81 | 81 |
| 6 | 0.74 | 74 | 0.75 | 75 | 0.87 | 87 |
| Mean | 0.74 | 75 | 0.73 | 73 | 0.85 | 85 |
| SD | 0.03 | 0.06 | 0.03 | |||
| RSD (%) | 4.2 | 7.9 | 4.1 | |||
| ANOVA P-value | 0.000641 | |||||
(h) Additional recovery study using spiked cookie, milk chocolate, ice cream, trail mix, puffed rice cereal, and granola bar
Six different commercial matrixes from local retailers were obtained. These were cookies, milk chocolate, ice cream, trail mixes (almonds with skin, cashews, blanched almonds without skin, sultanas, cranberries, black currants), puffed rice cereal (rice, sugar, salt, malt flavor, vitamins and minerals), and granola bar (whole-grain oat flakes, sugar, sunflower oil, honey, salt, molasses, sun flower oil lecithin emulsifier, sodium hydrogen carbonate) were spiked in two test portions using two independent stock solutions for spiking (see Standard Solutions and Spiking Solutions). The spiking levels were identical to the concentration of each standard. Additionally, a level of 12 mg/kg was included to check for dilutability. These samples were diluted 10-fold with buffer according to the instructions for use. The lowest spike level of 0.75 mg/kg peanut is covered by LOQ characterization, section (d).
Table 16 shows the results for spiked cookies, where recoveries between 75 and 96% were observed. There is no tendency towards differences between lots or spiking levels. Results for spiked milk chocolate are depicted in Table 17; recoveries between 55 and 83% were observed. Mean recoveries were between 65 and 76% which is acceptable for a difficult matrix and is in accordance with results for incurred milk chocolate (Table 14). Table 18 shows the results for spiked ice cream. When comparing different spiking levels and lots, recoveries varied from 72 to 98%.
Table 16.
Results from spiking experiments of cookies at four different levels with two test portions per concentration and lot including a blank samplea
| Spike | TC1 |
TC2 |
TC3 |
|||
|---|---|---|---|---|---|---|
| mg/kg | mg/kg | Rec., % | mg/kg | Rec., % | mg/kg | Rec., % |
| 0 | <S 1 | – | <S 1 | – | 0.00 | – |
| <S 1 | – | 0.00 | – | 0.01 | – | |
| 1.5 | 1.41 | 94 | 1.31 | 87 | 1.19 | 79 |
| 1.23 | 82 | 1.13 | 75 | 1.17 | 78 | |
| 3 | 2.87 | 96 | 2.60 | 87 | 2.70 | 90 |
| 2.70 | 90 | 2.72 | 91 | 2.50 | 83 | |
| 6 | 5.51 | 92 | 5.34 | 89 | 5.67 | 95 |
| 5.31 | 89 | 5.43 | 91 | 5.48 | 91 | |
| 12 | 10.4 | 87 | 9.61 | 80 | 10.5 | 88 |
| 9.56 | 80 | 9.36 | 78 | 9.19 | 77 | |
<S1 means an OD value smaller than the OD value of standard 1.
Table 17.
Results from spiking experiments of milk chocolate at four different levels with two test portions per concentration and lot including a blank samplea
| Spike | TC1 |
TC2 |
TC3 |
|||
|---|---|---|---|---|---|---|
| mg/kg | mg/kg | Rec., % | mg/kg | Rec., % | mg/kg | Rec., % |
| 0 | <S1 | – | <S1 | – | <S1 | – |
| <S1 | – | <S1 | – | <S1 | – | |
| 1.5 | 1.08 | 72 | 0.84 | 56 | 1.09 | 73 |
| 0.99 | 66 | 0.83 | 55 | 0.97 | 65 | |
| 3 | 2.34 | 78 | 2.15 | 72 | 2.18 | 73 |
| 2.28 | 76 | 2.42 | 81 | 2.33 | 78 | |
| 6 | 4.80 | 80 | 4.72 | 79 | 4.63 | 77 |
| 4.83 | 81 | 3.76 | 63 | 4.35 | 73 | |
| 12 | 9.92 | 83 | 7.48 | 62 | 8.74 | 73 |
| 9.21 | 77 | 6.54 | 55 | 8.52 | 71 | |
<S1 means an OD value smaller than the OD value of standard 1.
Table 18.
Results from spiking experiments of ice cream at four different levels with two test portions per concentration and lot including a blank samplea
| Spike | TC1 |
TC2 |
TC3 |
|||
|---|---|---|---|---|---|---|
| mg/kg | mg/kg | Rec., % | mg/kg | Rec., % | mg/kg | Rec., % |
| 0 | <S1 | – | <S1 | – | 0.00 | – |
| <S1 | – | <S1 | – | 0.00 | – | |
| 1.5 | 1.29 | 86 | 1.22 | 81 | 1.24 | 83 |
| 1.22 | 81 | 1.26 | 84 | 1.26 | 84 | |
| 3 | 2.70 | 90 | 2.45 | 82 | 2.58 | 86 |
| 2.70 | 90 | 2.46 | 82 | 2.37 | 79 | |
| 6 | 5.22 | 87 | 5.35 | 89 | 5.51 | 92 |
| 5.09 | 84 | 5.10 | 85 | 5.12 | 85 | |
| 12 | 9.89 | 82 | 9.61 | 80 | 8.63 | 72 |
| 9.45 | 79 | 11.8 | 98 | 9.84 | 82 | |
<S1 means an OD value smaller than the OD value of standard 1
In case of trail mix, recoveries were remarkably lower (Table 19) and ranged from 54 to 73%. There are no differences between lots. For these analyses, a walnut-free mixture of nuts and raisins was used. The presence of walnuts can reduce the recoveries down to approximately 40% (data not shown).
Table 19.
Results from spiking experiments of trail mix at four different levels with two test portions per concentration and lot including a blank samplea
| Spike | TC1 |
TC2 |
TC3 |
|||
|---|---|---|---|---|---|---|
| mg/kg | mg/kg | Rec., % | mg/kg | Rec., % | mg/kg | Rec., % |
| 0 | <S1 | – | 0.00 | – | <S1 | – |
| <S1 | – | 0.00 | – | 0.03 | – | |
| 1.5 | 0.93 | 62 | 0.85 | 57 | 0.88 | 59 |
| 0.99 | 66 | 0.91 | 61 | 1.00 | 67 | |
| 3 | 1.93 | 64 | 1.62 | 54 | 1.70 | 57 |
| 1.97 | 67 | 1.77 | 59 | 1.76 | 59 | |
| 6 | 3.86 | 64 | 3.66 | 61 | 3.61 | 60 |
| 4.36 | 73 | 3.89 | 65 | 4.06 | 68 | |
| 12 | 6.92 | 58 | 6.88 | 57 | 7.34 | 61 |
| 7.22 | 60 | 7.13 | 59 | 7.00 | 58 | |
<S1 means an OD value smaller than the OD value of standard 1.
Table 20 shows the results for spiked puffed rice cereal with spiking concentration between 1.5 and 12 mg/kg. The variation in recovery is from 80 to 108% when considering all single spiking levels and lots. Table 21 shows the results for spiked granola bar with recoveries between 74 and 92% for spiking concentration between 1.5 and 12 mg/kg.
Table 20.
Results from spiking experiments of puffed rice cereal at four different levels with two test portions per concentration and lot including a blank samplea
| Spike | TC1 |
TC2 |
TC3 |
|||
|---|---|---|---|---|---|---|
| mg/kg | mg/kg | Rec., % | mg/kg | Rec., % | mg/kg | Rec., % |
| 0 | <S1 | – | <S1 | – | <S1 | – |
| <S1 | – | <S1 | – | < 0.00 | – | |
| 1.5 | 1.54 | 103 | 1.47 | 98 | 1.48 | 99 |
| 1.38 | 92 | 1.20 | 80 | 1.29 | 86 | |
| 3 | 3.23 | 108 | 2.89 | 96 | 3.02 | 101 |
| 3.17 | 106 | 2.63 | 88 | 2.83 | 94 | |
| 6 | 6.15 | 103 | 5.50 | 92 | 6.00 | 100 |
| 5.68 | 95 | 5.53 | 92 | 5.38 | 90 | |
| 12 | 10.8 | 90 | 10.5 | 87 | 11.1 | 92 |
| 9.98 | 83 | 10.0 | 83 | 10.8 | 90 | |
<S1 means an OD value smaller than the OD value of standard 1.
Table 21.
Results from spiking experiments of granola bar at four different levels with two test portions per concentration and lot including a blank sample
| Spike | TC1 |
TC2 |
TC3 |
|||
|---|---|---|---|---|---|---|
| mg/kg | mg/kg | Rec., % | mg/kg | Rec., % | mg/kg | Rec., % |
| 0 | 0.00 | – | 0.05 | – | 0.08 | – |
| 0.01 | – | 0.06 | – | 0.07 | – | |
| 1.5 | 1.38 | 92 | 1.22 | 81 | 1.29 | 86 |
| 1.32 | 88 | 1.25 | 83 | 1.23 | 82 | |
| 3 | 2.73 | 91 | 2.42 | 81 | 2.43 | 81 |
| 2.58 | 86 | 2.21 | 74 | 2.38 | 79 | |
| 6 | 5.20 | 87 | 4.95 | 83 | 4.84 | 81 |
| 5.11 | 85 | 4.85 | 81 | 4.50 | 75 | |
| 12 | 9.94 | 83 | 9.13 | 76 | 9.58 | 80 |
| 8.93 | 74 | 9.06 | 76 | 8.89 | 74 | |
To summarize results for recoveries from Tables 16–21 across spiking levels and lots by matrix, a regression analysis was performed. The graphical output is shown in Figure 4 while Table 22 summarizes slopes, recoveries, intercepts, coefficient of determination (R2) and standard errors for slopes and intercepts. To characterize consistencies of recovery within the measurement range, a residual analysis was done where the predicted mean is subtracted from the observed mean (Table 23). There is a slight overestimation at the higher levels of 3 and 6 mg/kg while there is a slight underestimation at levels measured below 1.5 mg/kg. Samples spiked at 12 mg/kg were diluted 10-fold before measurement which means that they will have OD values between standard 2 (0.75 mg/kg) and standard 3 (1.5 mg/kg).
Figure 4.
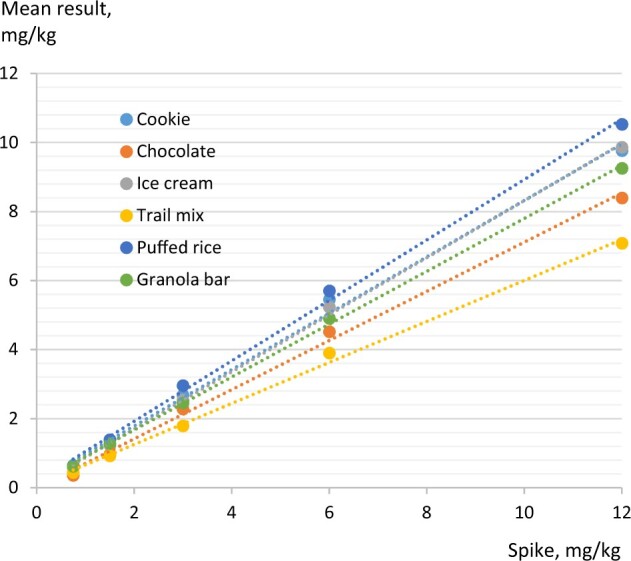
Graphical output of the regression analysis for all six matrixes across lots: dotted lines represent the linear regression for each matrix; slopes are equivalent to matrix-specific recoveries; see Table 22.
Table 22.
Summary of regression statistics (slope, intercept, R2) with a recovery estimate for each matrix across lots and levels; standard errors (SE) for slopes and intercepts are also shown
| Matrix | Slope | Recovery | Intercept | R2 | SE of slope | SE of Intercept |
|---|---|---|---|---|---|---|
| Cookie | 0.8169 | 82 | 0.1565 | 0.9957 | 0.0310 | 0.1917 |
| Milk chocolate | 0.7123 | 71 | −0.0062 | 0.9967 | 0.0238 | 0.1477 |
| Ice cream | 0.8269 | 83 | 0.0500 | 0.9988 | 0.0166 | 0.1026 |
| Trail mix | 0.5940 | 59 | 0.0684 | 0.9967 | 0.0197 | 0.1222 |
| Puffed rice cereal | 0.8758 | 88 | 0.1755 | 0.9974 | 0.0166 | 0.1608 |
| Granola bar | 0.7659 | 77 | 0.1447 | 0.9991 | 0.0132 | 0.0815 |
Table 23.
Summary of residual analysis for each matrix; mean result of concentration across three lots per level is given together with the residual in brackets
| Spike | Mean result (and residuals) across three lots, mg/kg |
|||||||||||
|---|---|---|---|---|---|---|---|---|---|---|---|---|
| mg/kg | Cookie | Milk chocolate | Ice cream | Trail mix | Puffed rice cereal | Granola bar | ||||||
| 0.75 | 0.63 | (−0.14) | 0.36 | (−0.17) | 0.58 | (−0.09) | 0.44 | (−0.07) | 0.65 | (−0.19) | 0.63 | (−0.09) |
| 1.5 | 1.24 | (−0.14) | 0.97 | (−0.09) | 1.25 | (−0.04) | 0.93 | (−0.03) | 1.39 | (−0.10) | 1.28 | (−0.01) |
| 3 | 2.68 | (+0.07) | 2.28 | (+0.15) | 2.54 | (+0.01) | 1.79 | (−0.06) | 2.96 | (+0.16) | 2.46 | (+0.02) |
| 6 | 5.46 | (+0.40) | 4.52 | (+0.25) | 5.23 | (+0.22) | 3.91 | (+0.27) | 5.71 | (+0.28) | 4.91 | (+0.16) |
| 12 | 9.77 | (−0.19) | 8.40 | (−0.14) | 9.87 | (−0.10) | 7.08 | (−0.11) | 10.53 | (−0.15) | 9.26 | (−0.08) |
Dilutability was shown for all four matrixes by analyzing the 12 mg/kg level, so at least samples with concentrations between 0.75 and 12 mg/kg peanut can be quantified with the RIDASCREEN Peanut [results for the 0.75 mg/kg level are given in section (d)].
After submitting the in-house report to AOAC, the question arose why for trail mix, granola bar, and puffed rice cereal only 2 replicates were provided (cookies, milk chocolate and ice cream had additional replicates from the experiments with the incurred materials). It was decided to repeat the recovery experiment for these matrixes using the correct number of replicates (Table 24) in test kit lot 3 (the other two test kit lots were expired at that point in time). Recoveries were comparable to those given in Table 22. With one exception, all RSDs were below 20% and only puffed rice cereals spiked at 1.5 mg/kg showed higher values of 29.1%. The other concentrations for puffed rice showed RSDs below 13%. Furthermore, the other two matrixes spiked at 1.5 mg/kg showed RSDs of 17%. We conclude that the high RSD of 29.1% is an outlier resulting from the one replicate with a concentration of 0.81 mg/kg.
Table 24.
Results from spiking experiments of three different matrixes; mean recoveries from five test portions from all spiking levels (1.5 to 12 mg/kg) within one lot
| Spike | Trail mix |
Granola bar |
Puffed rice cereal |
||||
|---|---|---|---|---|---|---|---|
| mg/kg | Replicate | mg/kg | Rec., % | mg/kg | Rec., % | mg/kg | Rec., % |
| 1.5 | 1 | 0.69 | 46 | 1.57 | 105 | 0.81 | 54 |
| 2 | 1.05 | 70 | 1.57 | 105 | 1.83 | 122 | |
| 3 | 0.95 | 63 | 1.62 | 108 | 1.58 | 105 | |
| 4 | 0.79 | 53 | 1.64 | 109 | 1.75 | 117 | |
| 5 | 0.80 | 53 | 1.68 | 112 | 1.23 | 82 | |
| Mean | 0.86 | 57 | 1.62 | 108 | 1.44 | 96 | |
| SD | 0.14 | 0.05 | 0.42 | ||||
| RSD, % | 16.5 | 2.9 | 29.1 | ||||
| 3 | 1 | 1.93 | 64 | 3.33 | 111 | 3.36 | 112 |
| 2 | 2.02 | 67 | 3.2 | 107 | 3.27 | 109 | |
| 3 | 1.87 | 62 | 3.23 | 108 | 2.83 | 94 | |
| 4 | 1.88 | 63 | 3.2 | 107 | 3.69 | 123 | |
| 5 | 1.88 | 63 | 3.23 | 108 | 2.65 | 88 | |
| Mean | 1.92 | 64 | 3.24 | 108 | 3.16 | 105 | |
| SD | 0.06 | 0.05 | 0.42 | ||||
| RSD, % | 3.3 | 1.7 | 13.3 | ||||
| 6 | 1 | 4 | 67 | 6.18 | 103 | 7.06 | 118 |
| 2 | 3.95 | 66 | 6.03 | 101 | 6.71 | 112 | |
| 3 | 3.82 | 64 | 6.15 | 103 | 7.47 | 125 | |
| 4 | 3.96 | 66 | 6.61 | 110 | 6.71 | 112 | |
| 5 | 4.94 | 82 | 6.08 | 101 | 6.07 | 101 | |
| Mean | 4.13 | 69 | 6.21 | 104 | 6.80 | 113 | |
| SD | 0.46 | 0.23 | 0.52 | ||||
| RSD, % | 11.0 | 3.7 | 7.6 | ||||
| 12 | 1 | 11.11 | 93 | 11.91 | 99 | 14.57 | 121 |
| 2 | 8.88 | 74 | 11.88 | 99 | 18.45 | 154 | |
| 3 | 8.7 | 73 | 11.91 | 99 | 15.63 | 130 | |
| 4 | 6.49 | 54 | 12.4 | 103 | 14.64 | 122 | |
| 5 | 8.28 | 69 | 12.11 | 101 | 15.53 | 129 | |
| Mean | 8.69 | 72 | 12.04 | 100 | 15.76 | 131 | |
| SD | 1.65 | 0.22 | 1.58 | ||||
| RSD, % | 19.0 | 1.8 | 10.0 | ||||
(i) Studies on precision
Repeatability.—To characterize for repeatability each incurred sample (cookies, milk chocolate, and ice cream) was extracted six times independently (test portions) and pipetted onto plates from one test kit lot. The experiment was repeated on two more days in the same test kit lot by one technician. For calculation, the average variance for each material was calculated and further used as can be seen in Table 25. Repeatability was between 5.2% for milk chocolate and 12.3% for ice cream. This high value is mainly driven by the testing on Day 2 with a quite high standard deviation and the fact that inhomogeneity is part of repeatability in this analytical setup with incurred matrixes.
Intermediate precision (RSDi).—Table 26 shows the results of an experiment to characterize the intermediate precision. Each sample was extracted six times each by three different persons and tested in three different lots on three different days (in total 18 test portions per sample material). The RSDis were between 6.4 and 13.0% with the lowest value for the milk chocolate sample.
Table 25.
Characterization of repeatability by analysis of three different incurred samples in one test kit lot by one person on three different days; each sample was extracted as six-fold replicate
| Incurred cookie (3.28 mg/kg) | |||
|---|---|---|---|
| Day 1 | Day 2 | Day 3 | |
| Replicate | mg/kg | mg/kg | mg/kg |
| 1 | 3.15 | 2.88 | 2.50 |
| 2 | 3.49 | 3.05 | 1.90 |
| 3 | 3.25 | 3.05 | 2.39 |
| 4 | 2.89 | 3.25 | 2.39 |
| 5 | 2.77 | 2.89 | 2.03 |
| 6 | 3.09 | 2.90 | 2.15 |
| Mean | 3.11 | 3.00 | 2.23 |
| Average mean | 2.78 | ||
| SD | 0.26 | 0.14 | 0.24 |
| SD2 (variance) | 0.066 | 0.021 | 0.056 |
| Average SD2 | 0.0475 | ||
| SDr | 0.22 | ||
| RSDr (%) | 7.85 | ||
| Incurred milk chocolate (1.50 mg/kg) | |||
|---|---|---|---|
| Day 1 | Day 2 | Day 3 | |
| Replicate | mg/kg | mg/kg | mg/kg |
| 1 | 1.15 | 1.05 | 0.88 |
| 2 | 1.18 | 1.05 | 0.85 |
| 3 | 1.23 | 1.02 | 0.90 |
| 4 | 1.27 | 1.09 | 0.84 |
| 5 | 1.17 | 1.09 | 0.92 |
| 6 | 1.12 | 1.20 | 0.95 |
| Mean | 1.19 | 1.08 | 0.89 |
| Average mean | 1.05 | ||
| SD | 0.055 | 0.063 | 0.043 |
| SD2 (variance) | 0.0030 | 0.0040 | 0.0018 |
| Average SD2 | 0.0029 | ||
| SDr | 0.05 | ||
| RSDr (%) | 5.15 | ||
| Incurred ice cream (1.00 mg/kg) | |||
|---|---|---|---|
| Day 1 | Day 2 | Day 3 | |
| Replicate | mg/kg | mg/kg | mg/kg |
| 1 | 0.89 | 0.88 | 0.93 |
| 2 | 0.91 | 0.94 | 0.96 |
| 3 | 0.81 | 0.86 | 0.97 |
| 4 | 0.80 | 1.15 | 1.10 |
| 5 | 0.83 | 1.23 | 1.11 |
| 6 | 0.80 | 1.27 | 1.09 |
| Mean | 0.84 | 1.05 | 1.03 |
| Average mean | 0.97 | ||
| SD | 0.051 | 0.184 | 0.081 |
| SD2 (variance) | 0.00257 | 0.03380 | 0.00661 |
| Average SD2 | 0.0143 | ||
| SDr | 0.120 | ||
| RSDr (%) | 12.3 | ||
|
| |||
Table 26.
Intermediate precision by analysis of three incurred samples in three kit lots by three persons on three days; each sample was extract as six-fold biological replicate by each person
| Cookie |
Milk chocolate |
Ice cream |
|||||
|---|---|---|---|---|---|---|---|
| 3 mg/kg |
1.5 mg/kg |
1.0 mg/kg |
|||||
| Replicate | mg/kg | Rec., % | mg/kg | Rec., % | mg/kg | Rec., % | |
| 1 | 2.92 | 97 | 0.96 | 64 | 0.90 | 90 | |
| 2 | 2.94 | 98 | 1.05 | 70 | 0.92 | 92 | |
| Day 1 | 3 | 3.07 | 102 | 1.09 | 73 | 0.82 | 82 |
| Technician 1 | 4 | 3.03 | 101 | 1.08 | 72 | 0.88 | 88 |
| Lot 3 | 5 | 2.87 | 96 | 1.10 | 73 | 0.82 | 82 |
| 6 | 2.88 | 96 | 1.12 | 75 | 0.87 | 87 | |
| Mean | 2.95 | 98 | 1.07 | 71 | 0.87 | 87 | |
| SD | 0.08 | 0.06 | 0.04 | ||||
| RSD, % | 2.8 | 5.4 | 4.9 | ||||
| 1 | 3.24 | 108 | 0.97 | 65 | 0.65 | 65 | |
| 2 | 3.32 | 111 | 1.00 | 66 | 0.67 | 67 | |
| Day 2 | 3 | 3.38 | 113 | 1.01 | 67 | 0.65 | 65 |
| Technician 2 | 4 | 3.26 | 109 | 1.05 | 70 | 0.63 | 63 |
| Lot 2 | 5 | 2.80 | 93 | 1.65* | 110a | 0.70 | 70 |
| 6 | 2.96 | 99 | 1.03 | 69 | 0.71 | 71 | |
| Mean | 3.16 | 105 | 1.12 | 75 | 0.70 | 67 | |
| SD | 0.23 | 0.26 | 0.03 | ||||
| RSD, % | 7.2 | 3.1 | 4.5 | ||||
| 1 | 3.14 | 105 | 1.09 | 73 | 0.75 | 75 | |
| 2 | 3.06 | 102 | 0.98 | 65 | 1.02a | 102a | |
| Day 3 | 3 | 3.20 | 107 | 0.92 | 61 | 0.67 | 67 |
| Technician 3 | 4 | 3.55 | 118 | 1.05 | 70 | 0.75 | 75 |
| Lot 1 | 5 | 3.50 | 117 | 0.95 | 63 | 0.69 | 69 |
| 6 | 3.22 | 107 | 1.15 | 77 | 0.68 | 68 | |
| Mean | 3.28 | 109 | 1.02 | 68 | 0.71 | 71 | |
| SD | 0.20 | 0.09 | 0.04 | ||||
| RSD, % | 6.1 | 8.7 | 5.6 | ||||
| All | Mean | 3.13 | 104 | 1.03 | 69 | 0.75 | 75 |
| SD | 0.22 | 0.07 | 0.10 | ||||
| RSDi, % | 7.0 | 6.4 | 13.0 | ||||
Outlier (Grubbs; p<0.05).
Independent Laboratory Studies
Overview.—The results of the independent validation study conducted for the RIDASCREEN Peanut test kit for the quantification of peanut in cookies and milk chocolate are described in the following sections. The study followed the protocol provided by AOAC, referred to in this document as “Protocol”. The study was conducted between May 18 and June 2, 2021 at the PARERA laboratory (INAF—Université Laval) using the NIST SRM 2387 peanut reference standard.
Preparation of incurred cookies.—Cookie matrix samples (1, 3, and 10 mg/kg peanut) were prepared using the NIST SRM 2387. All ingredients were purchased from a local supermarket. The cookie preparation followed the instructions provided. Blank cookies and cookies with approximately 10 mg/kg peanut were baked according to the instructions provided (150°C, 15 min) and cooled down before being ground. Loss of water due to baking was measured and taken into account for calculation of peanut concentration after baking. Six replicate samples of the blank cookie matrix were analyzed with the RIDASCREEN Peanut kit and verified to be peanut protein-free before depletion of the incurred cookies with blank cookies to the final levels of 1, 3 and 10 mg/kg peanut.
-
Preparation of incurred milk chocolate sample.—Commercial peanut-free milk chocolate bars were used to prepare the milk chocolate matrixes according to the instructions provided, including a heating step for 1 h at 80°C. (Note: The absence of peanut protein in this matrix was verified with the RIDASCREEN Peanut kit before proceeding with the next steps of the study.) In contrast to the cookie levels, all milk chocolate levels were produced independently and not by depletion of one higher level.
To extract the incurred samples for analysis, 1 g SMP was added to each tube instead of putting SMP in the buffer solution as recommended in the protocol. Samples for analysis were weighed and randomly labeled by Analyst 1 and tested by Analyst 2. Ice was used to cool down the samples (after the 10 min treatment with AEP). The time for the cool-down was standardized at 5 min for all samples. The samples were centrifuged at 2500 × g, for 10 min at room temperature instead of filtration. Samples with ODs outside the calibration range that needed further dilution were diluted with freshly prepared AEP and held at room temperature instead of 60°C before being used.
All samples were analyzed manually following the AOAC protocol with the RIDASCREEN Peanut kits provided. Each sample was tested in duplicate wells. A pre-plate was used for each test, including for tests using less than three strips. A multichannel pipette was used to transfer the samples from the pre-plate to the coated wells. Pipetting tubs were used for the addition of the different reagents (one per reagent) in the microplate. Each reagents was added to the plate by using a multichannel pipette.
The incurred cookie samples were tested in a first microplate. Samples with ODs outside the calibration range that needed further dilution were diluted with freshly prepared AEP. The milk chocolate samples were tested in another plate on a different day.
Results of independent laboratory evaluation.—All raw and processed data were submitted by the independent laboratory. The R-Biopharm software RIDASOFT Win.NET was used to process the data. The standard curve was generated by fitting standards OD versus peanut concentrations. Six replicates of the blank cookie matrix sample and six replicates (test portions) of the blank chocolate matrix sample were tested using the RIDASCREEN Peanut kit. All results were negative (below LOD) for peanut protein. A photograph of the baked incurred 10 mg/kg cookies is shown in Figure 5. The results of the peanut concentrations of the incurred cookie matrixes are presented in Tables 27 and 28.
Figure 5.

Photo of baked cookies (approximately 10 mg/kg) after cooling.
Table 27.
Peanut concentrations (mg/kg) of incurred cookie matrixes measured with RIDASCREEN Peanut
| Samplea | Peanut, mg/kg |
Sample weight, g | |
|---|---|---|---|
| Target | Measuredb | ||
| A | 1.04 | 1.05 | 1.0008 |
| B | 3.12 | 3.39 | 1.0069 |
| C | 10.41 | 11.65 | 0.9962 |
| D | 1.04 | 1.11 | 0.9928 |
| E | 10.41 | 12.15 | 1.0072 |
| F | 3.12 | 3.24 | 1.0080 |
| G | 3.12 | 2.83 | 1.0014 |
| H | 1.04 | 1.04 | 1.0053 |
| I | 10.41 | 9.35 | 1.0022 |
| J | 10.41 | 9.60 | 1.0029 |
| K | 3.12 | 2.87 | 1.0093 |
| L | 1.04 | 1.20 | 0.9947 |
| M | 10.41 | 11.25 | 1.0073 |
| N | 1.04 | 0.91 | 1.0014 |
| O | 1.04 | 0.96 | 0.9979 |
| P | 10.41 | 11.05 | 0.9979 |
| Q | 3.12 | 3.32 | 0.9921 |
| R | 3.12 | 3.45 | 0.9996 |
| SMPc | <LOQ | <LOQ | NAd |
Samples C, E, I, J, M and P were diluted 5-fold to obtain OD readings within range.
Mean of duplicate wells.
Skim milk powder (1 g) was tested as negative control.
NA = Not applicable.
Table 28.
Summarized peanut (mg/kg) results—Cookies
| Target | Measureda | Recovery, % | RSD, % |
|---|---|---|---|
| 1.04 | 1.04 ± 0.1053 | 100 | 10.1 |
| 3.12 | 3.18 ± 0.2679 | 102 | 8.42 |
| 10.41 | 10.84 ± 1.1262 | 104 | 10.4 |
Mean ± SD; n = 6.
The highest analytical variability was observed in the 10 mg/kg matrix (Table 28). Peanut concentrations in the incurred milk chocolate samples are reported in Tables 29 and 30. For milk chocolate the highest analytical variability was observed in the target 1.0 mg/kg matrix (Table 30) resulting from one out of six values which was 0.64 mg/kg and therefore increased the RSD to 19.5.
Table 29.
Peanut concentrations (mg/kg) of incurred milk chocolate matrixes measured with RIDASCREEN Peanut
| Samplea | Peanut, mg/kg |
Sample weight, g | |
|---|---|---|---|
| Target | Measuredb | ||
| A | 10.00 | 11.25 | 0.9924 |
| B | 3.00 | 3.12 | 0.9986 |
| C | 10.00 | 11.05 | 0.9966 |
| D | 1.00 | 1.15 | 1.0061 |
| E | 1.00 | 0.64 | 0.9985 |
| F | 3.00 | 3.03 | 1.0079 |
| G | 3.00 | 2.86 | 1.0024 |
| H | 10.00 | 8.60 | 1.0019 |
| I | 1.00 | 1.05 | 1.0052 |
| J | 3.00 | 3.01 | 1.0044 |
| K | 1.00 | 1.07 | 1.0010 |
| L | 3.00 | 2.86 | 0.9955 |
| M | 1.00 | 0.90 | 1.0040 |
| N | 1.00 | 1.15 | 0.9977 |
| O | 10.00 | 8.75 | 0.9905 |
| P | 10.00 | 10.4 | 1.0075 |
| Q | 10.00 | 11.3 | 0.9923 |
| R | 3.00 | 3.06 | 1.0053 |
| SMPc | <LOQ | <LOQ | NA |
Samples A, C, H, O, P and Q were diluted 1:5 to obtain OD readings within range.
Mean of duplicate wells.
Skim milk powder (1 g) was tested as negative control.
Table 30.
Summarized peanut (mg/kg) results—Milk chocolate
| Target | Measureda | Recovery, % | RSD, % |
|---|---|---|---|
| 1.00 | 0.99 ± 0.1935 | 99 | 19.5 |
| 3.00 | 3.02 ± 0.1073 | 101 | 3.56 |
| 10.00 | 10.23 ± 1.2437 | 102 | 12.2 |
Mean ± SD; n = 6.
Observations (feedback) made at the independent laboratory facility.—No major problems were noted during the sample preparation or the test procedure. However, two suggestions were made to the kit manufacturer for clarification of the instructions for use. The kit was found to be easy to use and the packaging is great.
Discussion
The sandwich ELISA RIDASCREEN Peanut (R-Biopharm, R6811) employs the use of two monoclonal antibodies to detect peanut proteins. The extraction method is easy to perform and requires the addition of skim milk powder to all samples. The measurement range is between 0.75 and 6 mg/kg peanut using a NIST reference material as calibrator; a dilution of samples up to at least 12 mg/kg peanut is also possible. The ELISA showed no reactivity to 91 different food commodities. LOD was found to be 0.15 mg/kg across three lots and six matrixes. LOQ was verified at a level of 0.75 mg/kg. Recovery studies with incurred milk chocolate and ice cream revealed consistent mean recoveries between 67 and 85%. Mean recoveries for incurred cookies depend on the baking temperature and baking time and ranged from 60 to 109%. Spiking of the claimed matrixes showed mean recoveries between 65 and 97% whereas recovery of peanut from trail mix is around 60%. In most cases, repeatability (including inhomogeneity of the incurred matrixes used) was between 5.2 and 12.3%. Depending on the sample type, relative intermediate precision is between 6.4 and 13.0%. A ruggedness study revealed no critical parameters for the extraction or ELISA procedure except the ELISA incubation temperature for which a significant increase in recoveries was observed when incubating at 30°C. The results for incurred cookies and milk chocolate repeated in the independent laboratory showed mean recoveries between 99 and 104% with RSDs between 3.56 and 19.5%. Therefore, the independent laboratory was able to confirm the claims of the method developer.
Conclusions
The results of the independent laboratory evaluation together with the in-house validation study confirmed that RIDASCREEN Peanut is accurate and suitable to measure peanut in the claimed matrixes and meets the requirements laid down in SMPR 2018.012. The method developers recommend that the method is suitable as an AOAC Performance Tested MethodSM.
Acknowledgments
Submitting Company
R-Biopharm AG
An der neuen Bergstr. 17
64297 Darmstadt
Germany
Independent Laboratories
PARERA
Institut sur la nutrition et les aliments fonctionnels
Pavillon des services
2440 Hochelaga
Université Laval
Québec
QC, G1V 0A6
Canada
GFoRSS
Pavillon Paul Comtois
2425 Rue De L'Agriculture
Université Laval
Québec
QC, G1V 0A6
Canada
Reviewers
Melanie Downs
Assistant Professor
Department of Food Science & Technology
Food Allergy Research & Resource Program
University of Nebraska-Lincoln
283 Food Innovation Center
1901 North 21st St
Lincoln, NE 68588–6205
USA
Paul Wehling
Principal Consultant
ChemStats Consulting
Minneapolis, MN 55418
USA
Conflict of Interest
There is no conflict of interest.
Contributor Information
Markus Lacorn, R-Biopharm AG, An der Neuen Bergstr. 17, 64297 Darmstadt, Germany.
Tina Dubois, R-Biopharm AG, An der Neuen Bergstr. 17, 64297 Darmstadt, Germany.
Christian Gößwein, R-Biopharm AG, An der Neuen Bergstr. 17, 64297 Darmstadt, Germany.
Rebecca Kredel, R-Biopharm AG, An der Neuen Bergstr. 17, 64297 Darmstadt, Germany.
Bianca Ferkinghoff, R-Biopharm AG, An der Neuen Bergstr. 17, 64297 Darmstadt, Germany.
Sharon Brunelle, Brunelle Biotech Consulting, AOAC Technical Consultant, Corvallis, OR, USA.
Jérémie Théolier, PARERA, Institut sur la Nutrition et les Aliments Fonctionnels, Pavillon des Services, 2440 Hochelaga, Université Laval, QC, G1V 0A6, Canada; GFoRSS, Pavillon Paul Comtois, 2425 Rue De L'Agriculture, Université Laval, QC, G1V 0A6 Canada.
Silvia Dominguez, PARERA, Institut sur la Nutrition et les Aliments Fonctionnels, Pavillon des Services, 2440 Hochelaga, Université Laval, QC, G1V 0A6, Canada; GFoRSS, Pavillon Paul Comtois, 2425 Rue De L'Agriculture, Université Laval, QC, G1V 0A6 Canada.
Thomas Weiss, R-Biopharm AG, An der Neuen Bergstr. 17, 64297 Darmstadt, Germany.
References
- 1.Regulation (EU) No 1169/2011 of the European Parliament and of the Council on the provision of food information to consumers. https://eur-lex.europa.eu/homepage.html
- 2. Meng S., Li J., Chang S., Maleki S.J. (2019) Food Chem. X. 1, 100004.doi: 10.1016/j.fochx.2019.100004 [DOI] [PMC free article] [PubMed] [Google Scholar]
- 3. Taylor S., Baumert J., Crevel R., Houben G., Brooke-Taylor S., Remington B., Blom M., Grinter K. (2019) Summary of the 2019 VITAL Scientific Expert Panel Recommendations, The Allergen Bureau Limited, www.allergenbureau.net (accessed on 11 November 2020)
- 4. Wild D. (2013) The Immunoassay Handbook - Theory and Applications of Ligand Binding, ELISA and Related Technique, 4th Ed., Elsevier Science, Amsterdam, The Netherlands, pp 327 [Google Scholar]
- 5.CLSI guideline (2019) J. AOAC Int. 102, 326–32830594275 [Google Scholar]
- 6. Official Methods of Analysis (2012), AOAC INTERNATIONAL, Gaithersburg, MD, Appendix M: Validation Procedures for Quantitative Food Allergen ELISA Methods: Community Guidance and Best Practices. AOAC. [PubMed]
- 7.CLSI EP25-A (2009) Evaluation of Stability of In-Vitro Diagnostic Reagents, Approved Guideline
- 8. Weiss T., Lacorn M., Flannery J., Benzinger M.J., Bird P., Crowley E.S., Goins D., Agin J., Gilani S., Poepping B., Garber E. (2016) J. AOAC Int. 99, 495–503. doi: 10.5740/jaoacint.15-0290 [DOI] [PubMed] [Google Scholar]