Abstract
Removing excess phosphorus is a highly effective method to prevent eutrophication in contaminated water. However, the design and preparation of an efficient biosorbent for phosphate capture is still a great challenge. We fabricated a novel, and inexpensive nano-biosorbent, L-NH2@Ce, by loading cerium oxide nanoparticles (nano-CeO2) within the aminated lignin using a facile in situ precipitation approach for efficient phosphate removal. The as-designed nano-biosorbent L-NH2@Ce exhibited a BET surface area (SBET) of 89.8 m2 g−1, 3 times that of lignin, and a pore volume (Vp) of 0.23 cm3 g−1. Owing to these results, the adsorption capacity of L-NH2@Ce increased by 14-fold to 27.86 mg g−1 compared with lignin (1.92 mg g−1). Moreover, the L-NH2@Ce can quickly reduce a high phosphate concentration of 10 ppm to well below the discharge standard of 0.5 ppm recommended by the World Health Organization (WHO) for drinking water. Importantly, a study of leaching tests indicated the negligible risk of Ce ion leakage during phosphate adsorption over the wide pH range of 4–9. Moreover, L-NH2@Ce exhibits good reusability and retains 90% of removal efficiency after two adsorption–desorption cycles. The environmentally benignity of the raw material, the simple preparation process, and the high stability and reusability makes L-NH2@Ce a promising nano-biosorbent for phosphate removal.
An inexpensive, high stability, and good reusability nano-biosorbent L-NH2@Ce for efficient phosphate removal was fabricated by a facile method.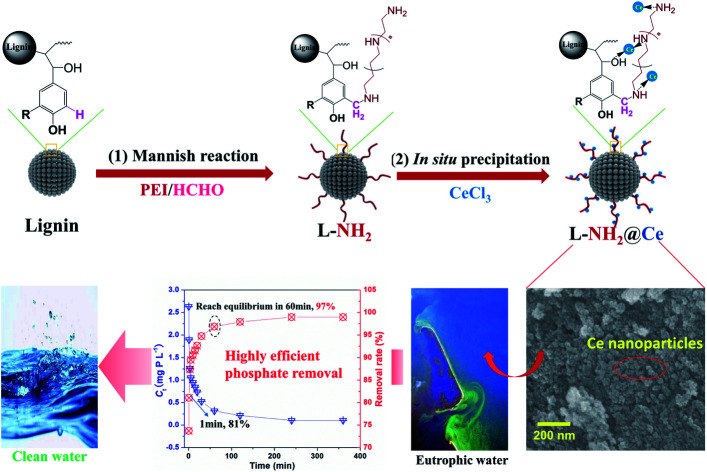
1. Introduction
Phosphorus is an essential nutrient that plays a very significant role in the growth of all living organisms.1 Unfortunately, excess phosphorus in water bodies often causes eutrophication, leading to increase in the growth of algae, known as algal bloom, which may threaten public health and the safety of the living environment.2 Therefore, it is important to develop efficient methods to remove excess phosphate before discharging it into water. Currently, many conventional strategies such as chemical precipitation, biological removal, electrochemical treatment, and adsorption, have been proven effective for removing phosphate from wastewater.3 Nevertheless, these methods suffer from certain drawbacks such as high cost and energy consumption and the requirement of a large number of chemicals, which can lead to the generation of sludge and secondary pollution.4 Thus, it is important to explore a more effective, sustainable, and inexpensive method for removing phosphate from aqueous solutions. Previously, studies have reported bio-sorption as an attractive alternative due to its low cost and high efficiency under very low phosphate concentrations, which is beneficial for treating wastewater.2,4–6 Hence, the development of an inexpensive and highly effective biosorbent using an abundant, sustainable, and environmentally benign material is highly required.
Lignin is the second-most abundant renewable biopolymer behind the cellulose. By one estimate, >7 × 10⁸ tons of lignin is obtained as a waste from papermaking and biorefinery industries every year.7–11 However, only <10% lignin is developed to be a value-added chemical and material,12–19 and the remaining (>90%) is burned as a low-value fuel. Recently, there has been considerable interest for converting lignin into a high-performance biosorbent for removing pollutants from wastewater because of its advantages of being abundance, low cost, sustainability, environmental–friendliness, and rich reactivity.5,18,20–22 Although a number of studies have currently examined the unitization of raw lignin as a biosorbent for capturing dyes and metal ions from wastewater, few studies have focused on exploring the ability of removing phosphate by raw lignin. Nevertheless, the phosphate adsorption capacity of raw lignin was often less because of its lack of active sites and negatively charged surfaces.18 For example, raw lignin produced from biobutanol showed a low adsorption amount of 1.92 mg g−1 for phosphate removal.23 Thus, to improve the adsorption capacity of phosphate, it is very important to modify lignin.
Many studies have demonstrated that metal (hydr)oxides such as ZrO2, TiO2, Fe(OH)3, La(OH)3, and CeO2 can be used to modify adsorbents for improving their specific surface areas and adsorption capacities.24–33 CeO2 is not easily soluble in acid and does not easily leak when harmful ions are removed from wastewater.29 Thus, CeO2 is considered to be one of the most attractive and promising adsorbents for capturing phosphate. For instance, both CeO2-loaded nanofibers and CeO2-covered Fe3O4@SiO2 nano-adsorbents exhibited high adsorption capacity, good adsorption selectivity, and excellent stability for capturing phosphate.30,31 However, compared with the above mentioned materials, lignin was more inexpensive and eco-friendly and could be used as a support for CeO2 to improve adsorption amount of phosphate and avoid agglomeration of nano-CeO2.26 According to the best of our knowledge, the use of lignin and Ce for phosphate capture as the adsorbent is rarely reported. Thus, the effects of phosphate removal by the Ce-based adsorbents using lignin as the support would be necessary to unveil.
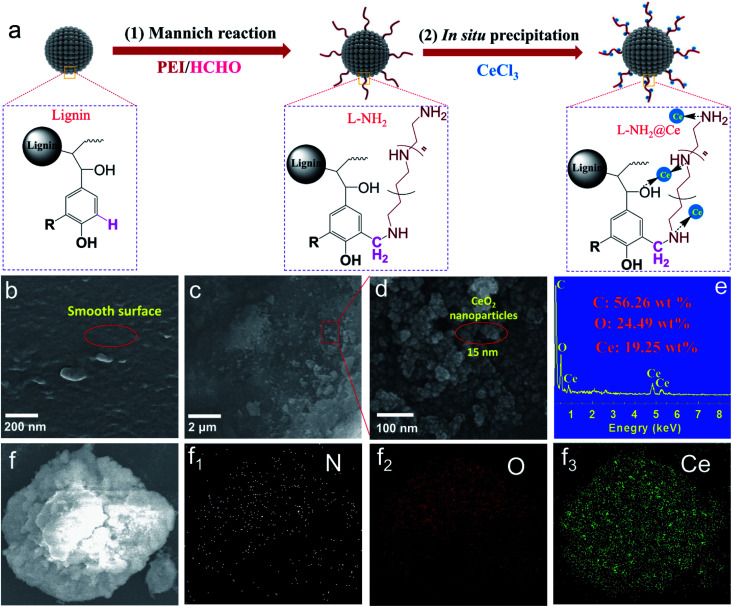
Herein, a novel and inexpensive lignin-based nano-cerium oxide adsorbent (L-NH2@Ce) was first prepared by a facile in situ precipitation approach. To improve the bonding between lignin and cerium oxide, polyethylenimine (PEI) with a number of amino functional groups was grafted onto lignin to form an aminated lignin via the Mannich reaction (Fig. 1a), which can facilitate the loading of nano-CeO2 onto the aminated lignin. Firstly, the nano-biosorbent L-NH2@Ce were systematically characterized by using SEM, TEM, BET, XPS, XRD, and FTIR technologies. The adsorption performances of phosphate were then tested, including the phosphate adsorption isotherms and kinetics, the influence of pH and interfering anions on the phosphate removal efficiency as well as regeneration performance on the L-NH2@Ce. Finally, the stability of Ce ions on L-NH2@Ce and probable adsorption mechanism were studied. The relevant results would establish better understanding of the applicability of adsorption processes from wastewater with regard to phosphate removal by the novel nano-adsorbent L-NH2@Ce.
Fig. 1. (a) Schematic for the facile preparation of biosorbent L-NH2@Ce nanohybrid, and SEM micrograph for (b) L-NH2, (c and d) L-NH2@Ce, and (e) EDX analysis of L-NH2@Ce, and (f) SEM images L-NH2@Ce and (f1–f3) its element mapping of the corresponding N, O, and Ce.
2. Materials and methods
2.1. Materials
Lignin (catalog number 471003) was bought from Sigma-Aldrich Co., Ltd. The element compositions of lignin were 47.74 wt% C, 1.82 wt% H, 47.56 wt% O, 0.14 wt% N, and 2.74 wt% S. Cerium(iii) chloride heptahydrate (catalog number C104761, 99%), poly(ethyleneimine) (catalogue number E107079, 99%), and ammonium molybdate tetrahydrate (catalog number A116375) were supplied by Aladdin Reagent Co., Ltd. Potassium antimonyl tartrate (catalog number XW2830074501), potassium dihydrogen phosphate (catalog number L01159401, ≥ 99.0%), sodium chloride (catalog number 10019318, 99.5%), potassium nitrate (catalog number 10017218, 99.0%), potassium sulfate (catalog number 10017918, 99.0%), potassium hydrogen carbonate (catalog number 20030218, 99.5%), potassium hydroxide (catalog number 10017008, 85%), hydrogen chloride (catalog number 10011061, 36–38%), and formaldehyde (catalog number 10010018, 37–40%) were purchased from Sinopharm Chemical Reagent co., Ltd. Each chemical was used as-obtained.
2.2. Preparation of aminated lignin (L-NH2)
L-NH2 was prepared using a previously reported method.15 In brief, 5.0 g lignin, 4.0 g polyethylenimine (PEI), and 4.0 g formaldehyde were added into a 250 mL three-necked flask with a solvent of 100 mL distilled water and vigorously agitated for 10 min using a magnetic stirrer. Subsequently, 1.0 M NaOH solution was slowly added into the mixture to ensure the pH value reached 10.0. Then, the above reaction mixture was maintained for 8 h at 60 °C. Finally, the resultant product was subsequently precipitated by adjusting the pH to reach 2.0–3.0 using diluted HCl. The final product was collected by suction filtration, washed repeatedly with distilled water, followed by drying in vacuum drier at 60 °C for 24 h. As shown in Fig. 1a, the brownish-black powder was denoted as L-NH2 (9.295 g).
2.3. Preparation of cerium oxide nanoparticles functionalized aminated lignin (L-NH2@Ce)
L-NH2@Ce was fabricated using a facile in situ precipitation approach. Briefly, 2.0 g L-NH2 was added in the 100 mL of deionized water containing 3.726 g of CeCl3·7H2O and stirred for 2 h for absorbing Ce3+ onto the L-NH2 surface. Afterwards, a certain volume of NaOH solution was slowly added into the above mixture and mixed well until the pH value changed to 10.0. After that, the resulting mixture was then conducted at 60 °C in a water bath for 2 h and later reacted at 25 °C for 24 h. Finally, the resulting product was obtained under vacuum filtration and washed repeatedly with distilled water, followed by drying in vacuum drier at 60 °C for 24 h. The obtained grayish-yellow powder was designated as L-NH2@Ce (3.45 g), as shown in Fig. 1a. For comparison purpose, the pure CeO2 was also prepared in the same manner as that of L-NH2@Ce.
2.4. Adsorption experiments
The stock phosphate solution of a concentration of 1000 mg L−1 (computed in P) was obtained by dissolving 4.3940 g anhydrous KH2PO4 into 1.0 L deionized water, and different required concentrations of phosphate solutions were prepared by further diluted with deionized water. To assess the phosphate adsorption behaviors of our nano-biosorbent L-NH2@Ce, a series of batch adsorption experiments has been performed. The batch experiment was conducted in the 40 mL glass vials closed with PTFE-lined screw caps. At the end of adsorption performance test, the solution was first filtered through 0.45 μm membrane filter, and then the residual concentration of phosphate was determined by molybdenum blue using a T6 UV-Vis spectrophotometer. Batch experiments for phosphate adsorption were conducted in duplicate and the average values were obtained. All bath adsorption tests were carried out at 298 K with a pH 6.0 ± 0.2, except pH and temperature effects studies. The uptake amount of phosphate at equilibrium, Qe (mg g−1), was measured using eqn (1):
| Qe = (C0 − Ce)V/m | 1 |
where C0 (mg L−1) corresponds to the initial concentration of phosphate, Ce (mg L−1) refers to the equilibrium concentration of phosphate in the adsorption experiment, V (mL) is total volume of the adsorption solution, and m (g) is the dry weight of the adsorbent L-NH2@Ce.
The removal efficiency of phosphate was determined by eqn (2):
 |
2 |
2.4.1. Adsorption isotherm
Adsorption isotherm experiments for L-NH2@Ce was conducted by adding 50 mg adsorbent into 40 mL phosphate solution with various initial phosphate concentrations in the range of 1.94–43.66 mg L−1. Then, each solution was agitated with an orbital shaker at room temperature at a rate of 200 rpm for 48 h to ensure that equilibrium was reached.
2.4.2. Adsorption kinetics
Adsorption kinetics experiments for L-NH2@Ce were performed with 10 mg L−1 phosphate concentration in a 500 mL flask with magnetic stirring. The 400 mL phosphate solution containing 0.2 g L-NH2@Ce was vigorously agitated in an orbital shaker at 25 °C, and then ∼1.5 mL of solution samples was withdrawn from the flask at various set time intervals from 0.5 to 600 min.
2.4.3. Influence of pH
To investigate the effect of pH on the adsorption performance of phosphate, six 50 mg samples of L-NH2@Ce were immersed in 20 mg L−1 phosphate solutions at initial solution pH range of 4.0 to 9.0, and then agitated on an orbital shaker set at 200 rpm at 25 °C. For adjusting the solution pH values of phosphate adsorption experiments, 0.1 M of both HCl and NaOH solutions were utilized. The leakage concentrations of Ce ions in the solutions after phosphate adsorption under different pH were obtained from Inductively Coupled Plasma-Mass Spectrometry (ICP-MS, Thermo Fisher Scientific Inc.).
2.4.4. Influence of temperature
To evaluate the effect of temperature on the adsorption performance of phosphate, three 50 mg samples of L-NH2@Ce were immersed into 40 mL of phosphate solution at varies solution temperatures (15 °C, 25 °C, 35 °C, and 45 °C) and stirred on an orbital shaker for 24 h.
2.4.5. Influence of coexisting anions
To examine the effect of interfering anions on the phosphate removal performance, three types of interfering anions (SO42−, HCO3−, and NO3−) with initial phosphate concentration of 100 mg L−1 were agitated on an orbital shaker set at 200 rpm for 24 h at 25 °C.
2.4.6. Regeneration study
The two cycles of adsorption–desorption experiments for L-NH2@Ce were investigated. The spent L-NH2@Ce was regenerated by using 0.1 M NaOH solution at 60 °C for 3 h. The regenerated L-NH2@Ce was collected by filtration, washed many times with distilled water, followed by drying in vacuum drier at 60 °C for 24 h, and used in the next adsorption test.
2.5. Characterization
2.5.1. XPS analysis
XPS spectra of lignin, L-NH2@Ce, and L-NH2@Ce after phosphate adsorption were conducted on a PHI 5000 Versa Probe with using Al Kα as the radiation source. For calibrating the binding energy value, the C 1s peak at 284.6 eV was used.
2.5.2. FTIR analysis
Fourier transform infrared (FTIR) spectra of lignin, L-NH2@Ce, and L-NH2@Ce after phosphate adsorption were collected in the range of 4000–400 cm−1 on a Model PerkinElmer 1100 series operated using the KBr pellet technique.
2.5.3. XRD analysis
X-ray diffraction (XRD) spectra of the lignin and L-NH2@Ce were carried out on a Rigaku D/max-RA power diffractometer with using Cu Kα the radiation source (λ = 1.542512 Å) over the 2θ range from 10° to 80° with a scanning rate of 5° min−1. Based on XRD data, the average crystallite diameter of L-NH2@Ce was determined by the Scherrer formula: D = Kλ/β cos θ, where D is the crystallite diameter (nm), β is the line-width at half maximum of the diffraction peak position (FWHM), K is a dimensional shape factor, which is equal to 0.9, λ is the average wavelength of X-ray radiation (Å), and θ is the diffracting angle (radian).
2.5.4. SEM and EDX measurement
Scanning electron microscopy (SEM) images and elemental data of L-NH2 and L-NH2@Ce were assessed using a Hitachi S-4800 field emission microscope attached to an energy-dispersive energy spectrometer (EDX). The images were collected at an accelerating voltage of 15 000 V. Prior to observation, samples were sprayed with a thin layer of gold by a sputter coater. The mean values of C, O, and Ce content (wt%) were determined from EDX by averaging three portions of the sample.
2.5.5. TEM examination
The structure and surface morphologies of L-NH2@Ce were recorded on a JEOL JEM-1230 transmission electron microscopy (TEM) apparatus.
2.5.6. N2 adsorption–desorption analysis
The nitrogen adsorption–desorption isotherms of L-NH2 and L-NH2@Ce were obtained at 77 K using a QuantachromeAutosrob-1 instrument. Before testing, the samples were treated by drying for 12 h at 105 °C. The specific surface area of lignin and L-NH2@Ce were calculated by the Brunauer–Emmett–Teller (BET) model, and the average pore size and pore volume were estimated by the adsorption branch of the isotherm using the Barrett–Joyner–Halenda (BJH) model, respectively.
3. Results and discussion
3.1. Fabrication and characterization of nano-biosorbent (L-NH2@Ce)
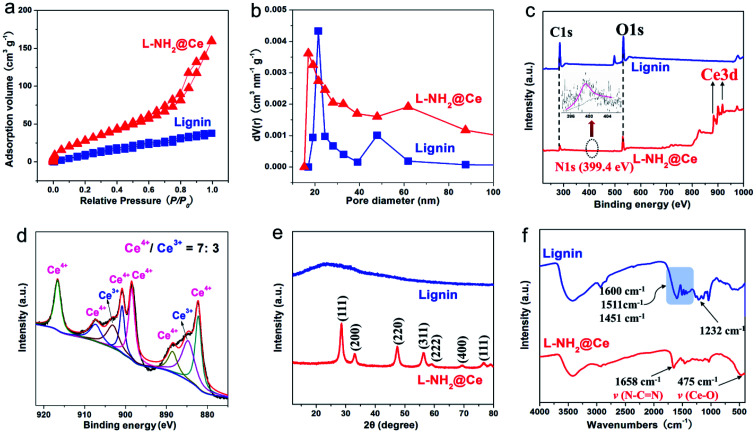
Fig. 1a shows the facile fabrication process of nano-biosorbent (L-NH2@Ce). First, aminated lignin (L-NH2) was obtained by Mannich reaction;15 moreover, a number of positively charged groups (e.g., –NH– and –NH2) were formed in the framework of L-NH2. After CeCl3 was added to the above suspension of L-NH2, Ce3+ ions attached to the L-NH2 surface through coordination, and then CeO2 nanoparticles were in situ deposited on the L-NH2 surface via the hydrolysis of Ce3+ ions. On filtration, CeO2 nanoparticles-decorated L-NH2 assembled into the target product nano-biosorbent (L-NH2@Ce). The nanostructure of the L-NH2@Ce was verified by SEM images (Fig. 1b–d). Compared with the smooth surface of L-NH2, the L-NH2@Ce clearly exhibited a typical nano-crystallite structure (average diameter = 15 nm) formed on its surface, which facilitated the creation of a porous nanostructure. Meanwhile, as shown in Fig. 1e, 56.26 wt% C, 24.49 wt% O, and 19.25 wt% Ce are observed by EDX in L-NH2@Ce. The formation of nanostructure created by CeO2 nanoparticles resulted in an elevation in both SBET and VP. As shown in Fig. 2a, b and Table 1, the SBET of L-NH2@Ce increased by two-fold to 89.8 m2 g−1 and its VP showed a four-fold increase to 0.23 cm3 g−1 compared with that of lignin. The average pore size (15.28 nm) of L-NH2@Ce indicated the coexistence of mesopores. The increased SBET and VP of L-NH2@Ce allowed the homogeneous distribution of CeO2 nanoparticles, which was confirmed by EDX map scanning (Fig. 1f and f1–f3) and was beneficial for phosphate removal from aqueous solutions.
Fig. 2. (a) Nitrogen adsorption/desorption isotherms, (b) pore size distributions, and (c) XPS spectra of lignin and L-NH2@Ce, and (d) XPS spectra of Ce 3d for L-NH2@Ce, and (e) XRD patterns, and (f) FTIR spectra of lignin and L-NH2@Ce.
General characteristic of lignin and L-NH2@Ce.
| S BET (m2 g−1) | V P (cm3 g−1) | d p (nm) | |
|---|---|---|---|
| Lignin | 29.13 | 0.049 | 21.52 |
| L-NH2@Ce | 89.8 | 0.23 | 15.28 |
To confirm that CeO2 was formed when Ce3+ attached on the surface of L-NH2, we utilized BET, XPS, XRD, and FTIR technologies. The XPS investigation was performed to analyze elemental composition of L-NH2@Ce, which provides powerful evidence of the preparation procedure for L-NH2@Ce, especially the attachment of Ce ions. The results are shown in Fig. 2c for both lignin and L-NH2@Ce, containing both C and O. As for the L-NH2@Ce spectrum, N can be seen, indicating that PEI was successfully introduced onto lignin based on Mannich reaction. Importantly, Ce appeared in the spectrum of L-NH2@Ce because of the loaded Ce on the L-NH2 surface. Moreover, as shown in Fig. 2d, the Ce 3d for L-NH2@Ce was decomposed into eight characteristic peaks including 882.3 eV/900.8 eV, 884.5 eV/902.9 eV, 888.7 eV/907.4 eV and 898.3 eV/916.6 eV. The peaks at 882.3 eV/900.8 eV, 888.7 eV/907.4 eV and 898.3 eV/916.6 eV are ascribed to chemical states of Ce4+, and the peaks at 884.5 eV/902.9 eV are due to Ce3+. According to the fitted results, it is confirmed there are a mixed valence state of Ce4+ and Ce3+ on the surface of L-NH2@Ce, and the ratio of Ce4+/Ce3+ was 7 : 3. All these XPS changes confirmed that nano-cerium oxide was successfully loaded on L-NH2. XRD spectra provided robust evidence to support CeO2 created on the surface of L-NH2. For the XRD spectrum of lignin (Fig. 2e), a weak peak located at 2θ = ∼24.2° was observed, suggesting that lignin was largely amorphous structure in nature.32 After lignin was functionalized, the XRD characteristic peaks were located at 2θ values of 28.5° (111), 33.0° (200), 47.4° (220), and 56.2° (311), which was in consistent with the standard pattern of cubic CeO2 (JCPDS card no. 34-0394).29 The crystallite size of these CeO2 nanoparticles obtained from the XRD diffraction pattern is 13 nm, calculated by the Scherrer equation, which is almost in close agreement with the aforementioned SEM result showing the average size of 15 nm. Based on these results, we can deduce that nano-CeO2 formed when Ce3+ attached to the surface of L-NH2. This indicated the successfully formation of the nano-biosorbent L-NH2@Ce. FTIR spectra further confirmed the introduction of CeO2, as shown in Fig. 2f. L-NH2@Ce showed additional FT-IR characteristic peaks at 1658 cm−1 and 475 cm−1 compared with lignin, which can be related to the N–C N and Ce–O stretching vibrations, respectively.30 Thus, we conclude that the nano-biosorbent L-NH2@Ce was successfully prepared.
3.2. Adsorption kinetic
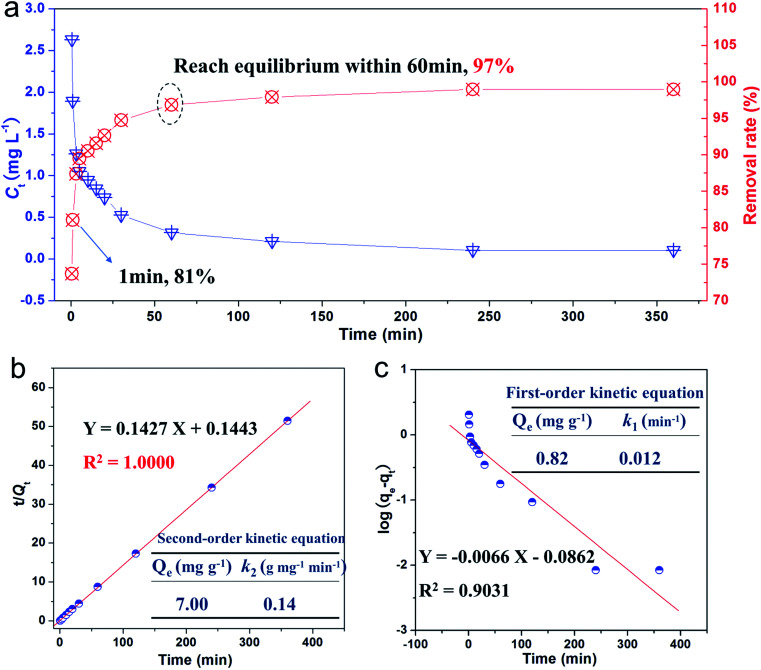
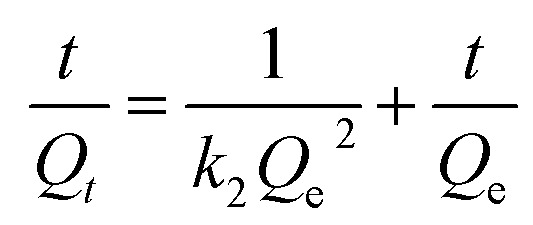
Adsorption kinetic experiment was conducted to evaluate the adsorption rate of phosphate, and the relevant results are presented in Fig. 3a. Note that >80% of the phosphate was removed just after 1 min. After ∼60 min of exposure, we reached adsorption saturation, and 97% of the phosphate ions were removed by L-NH2@Ce. Such a quick removal rate for as-obtained L-NH2@Ce exhibits the attractive and promising potential towards practical application in treating real life and industrial wastewater containing phosphate. Moreover, the adsorption rate of L-NH2@Ce was higher than that of some materials for phosphate adsorption.23,35 More importantly, the residue concentration of phosphate on L-NH2@Ce decreased to 0.1 ppm, far below phosphate discharge recommended by WHO for drinking water,36 further illustrating that the L-NH2@Ce could be effectively and quickly for eliminating phosphate from wastewater. To acquire more information regarding the adsorption behavior, the experimental kinetic data were fitted by using the following linear formulas, such as the pseudo-first-order model (eqn (3)), and pseudo-second-order model (eqn (4)).35,37,38
 |
3 |
 |
4 |
where Qt (mg g−1) is the uptake amount of phosphate at a certain time t; Qe (mg g−1) is the uptake amount of phosphate at equilibrium; t (min) is the contact time; k1 (min−1) is the adsorption rate constant for the first order model; and k2 (g mg−1 min−1) is the adsorption rate constant for the second order model. According to the derived kinetic parameters for eqn (3) and (4) (Fig. 3b and c), note that the adsorption of phosphate on the L-NH2@Ce complied well with the pseudo-second order model due to a high correlation coefficient of 1.0000. Additionally, the equilibrium adsorption amounts (7.00 mg g−1) calculated from fitting result is good agreement with the experimental data (6.99 mg g−1), confirming that the kinetic of phosphate adsorption to L-NH2@Ce follows the pseudo-second order model, indicating a chemisorption process.5
Fig. 3. (a) Adsorption kinetics of phosphate on L-NH2@Ce, and fitting results for (b) pseudo-second-order model and (c) pseudo-first-order model on L-NH2@Ce.
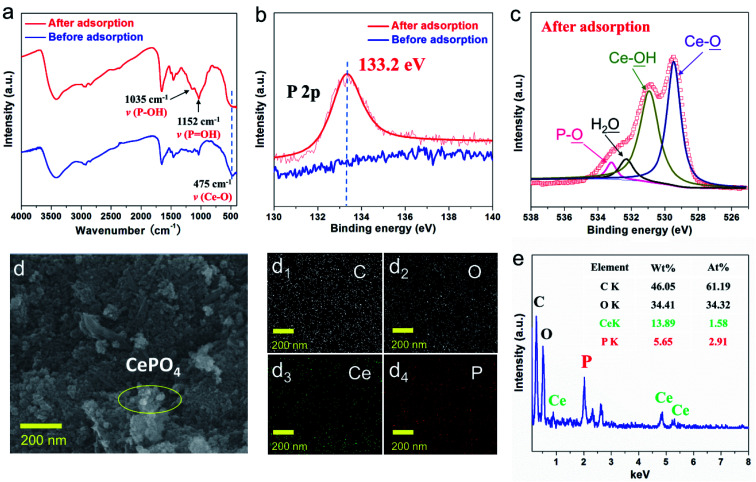
The structures of Ce component in the functionalized composites after adsorption were investigated by FTIR (Fig. 4a). The primary characteristic peaks remained after phosphate adsorption, suggesting the structural integrity of the as-obtained L-NH2@Ce. Moreover, a sharp band was observed at 475 cm−1, which is attributed to the binding vibrations of –OH of CeO2. Moreover, two new absorption peaks at ∼1035 cm−1 (P–OH) and ∼1152 cm−1 (P O) appeared, which strongly confirms the presence of phosphate after phosphate-adsorbed L-NH2@Ce and indicates the reliable complexation between Ce–OH functional groups of L-NH2@Ce and phosphate through the Ce–O–P coordination bonds.36 Meanwhile, XPS spectra provide additional evidence for the adsorption of phosphate on L-NH2@Ce. Compared to the original L-NH2@Ce, the appearance of P 2p peak after phosphate adsorption confirms the successful attachment of phosphate onto L-NH2@Ce (Fig. 4b). Note that phosphate-adsorbed L-NH2@Ce showed a negative shift of ∼0.7 eV compared to the purified NaH2PO4 (ca. 133.9 eV),2 which is indicative of strong coordination bonds between phosphate and L-NH2@Ce and contributes to the formation of CePO4.30 Furthermore, in good agreement with the FT-IR results, after the phosphate adsorption, the high resolution scan of O 1s spectra in Fig. 4c is deconvoluted into four peaks,39 which are attributed to O in P–O (529.5 eV), H2O (530.9 eV), Ce–OH (532.3 eV), and Ce–O (533.2 eV), respectively, thus verifying the strong affinity of Ce–OH toward phosphate through a complexation reaction. The SEM image of phosphate-adsorbed L-NH2@Ce shows the formation of some nanoscale CePO4 crystals (Fig. 4d). Moreover, the SEM-EDX measurements (Fig. 4e) confirm the presence of C, O, Ce, and P. The emergence of phosphorus (5.65 wt%) further validated the occurrence of phosphate attached onto the L-NH2@Ce. Furthermore, EDX map scanning (Fig. 4d1–d4) of phosphate-attached L-NH2@Ce indicates that the P element is evenly dispersed over the sample, verifying that the adsorption occurs in the whole framework of L-NH2@Ce. Therefore, the formation of insoluble CePO4 contributes to the phosphate removal.40
Fig. 4. (a) FTIR spectra and (b) XPSP 2p spectra of L-NH2@Ce before and after phosphate adsorption. (c) XPSO 1s spectra and (d) SEM image and its element mapping of the corresponding C (d1), O (d2), Ce (d3) and P (d4) and (e) EDX spectrum of L-NH2@Ce after adsorption phosphate.
3.3. Adsorption isotherm
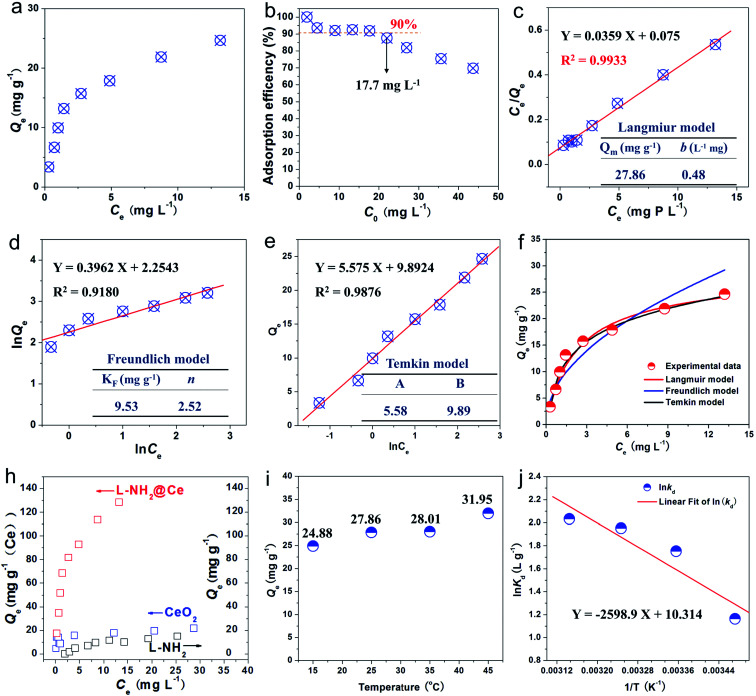
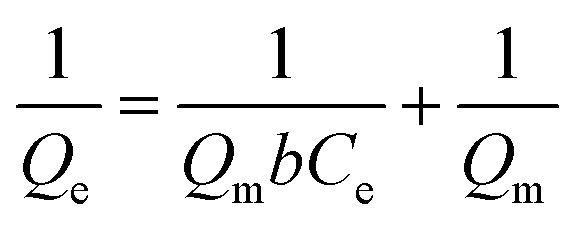
To determine the uptake amount of phosphate on L-NH2@Ce, we obtained adsorption isotherm for a series of different initial phosphate concentrations in the range of 1.94–43.66 mg L−1 at 25 °C (Fig. 5a). When the initial phosphate concentration increased, the uptake amount of phosphate significantly increased and then reached an equilibrium. Moreover, the effect of initial phosphate concentrations on the removal efficiency was also investigated (Fig. 5b). Over 90% adsorption efficiency of phosphate was removed below the concentration of 17.7 mg L−1, indicative of the high efficiency for phosphate removal on L-NH2@Ce. In this study, Freundlich (eqn (5)), Langmuir (eqn (6)), and Temkin models (eqn (7)) were selected to fit our experimental data.18,20,41–44
 |
5 |
 |
6 |
| Qe = A + B ln Ce | 7 |
where Qe (mg g−1) represents adsorption amount at equilibrium; Ce represents the phosphate concentration at equilibrium (mg L−1); Qm (mg g−1) refers to the maximum adsorption capacity of phosphate; KF and n refer to the constants of Freundlich; b (L mg−1) represents the constant of Langmuir model; and A and B refer to the constants of Temkin model.
Fig. 5. (a) Phosphate adsorption isotherms, (b) effect of the initial concentration of phosphate on the adsorption efficiency for L-NH2@Ce, and linear fitting results for (c) Langmuir model, (d) Freundlich model, and (e) Temkin model on L-NH2@Ce, and (f) nonlinear fitting for phosphate adsorption isotherms, (g) Ce content normalized phosphate adsorption isotherms of L-NH2@Ce and pure CeO2, and phosphate adsorption isotherms of L-NH2, (h) effect of the temperature on the uptake amount of phosphate on L-NH2@Ce, and (i) plot of ln kdvs. 1/T for phosphate removal by L-NH2@Ce.
As shown in Fig. 5c, the adsorption isotherm is found to comply well the Langmuir model and exhibits a higher R2 of 0.9933 compared with that fitted by using the Freundlich model (R2 = 0.9180) (Fig. 5d) and Temkin model (R2 = 0.9876) (Fig. 5e), indicating a chemical heterogeneity of the adsorbent.5 Note that the adsorption capacity of phosphate by L-NH2@Ce was calculated to be 27.86 mg g−1 by Langmuir model (Fig. 5c and f), while that of lignin without loading CeO2 showed a poor phosphate adsorption performance of 1.92 mg g−1.23 Meanwhile, aminated lignin (L-NH2) shows a phosphate adsorption capability of 14.90 mg g−1, which is because of the electrostatic interactions between amino groups and phosphate ions (Fig. 5g). Thus, adsorption capability of L-NH2@Ce was over 14 times than that of lignin, and around 2 times that of L-NH2, indicating that the functionalization of CeO2 was a feasible strategy for improving phosphate capture ability of lignin. Moreover, given 19.25 wt% Ce in the L-NH2@Ce, the Ce content-normalized adsorption capacity is calculated to be 145 mg g−1 (Ce), which is much higher than that of pure CeO2 (21 mg g−1 (Ce)) (see Fig. 5g). This is mainly because that well-dispersed CeO2 nanoparticles in the L-NH2 that provides more CeO2 active sites exposed for phosphate adsorption. Furthermore, certain materials have been used for removing phosphate,1,18,23,33–35,45–49 as summarized in Table S1.† As-fabricated L-NH2@Ce exhibited a high adsorption capacity of phosphate than some of the previously reported biosorbents, such as Ce/Fe3O4-BC (18.75 mg g−1), Fe-CL (0.942 mg g−1), LBR-Zr (8.75 mg g−1), ILO (4.785 mg g−1), iron hydroxide eggshell (14.49 mg g−1). However, the adsorption capacity of L-NH2@Ce was not high compared with some reported biosorbent such as Ws-N-Zr (31.9 mg g−1). Ws-N-Zr performed about 1.2 times phosphate adsorption capacity of L-NH2@Ce. Nevertheless, Ws-N-Zr adsorption result was achieved with a long equilibrium time of 120 min under the same initial concentration of around 10 mg L−1. Although the phosphate adsorption capacity of as-fabricated nano-biosorbent L-NH2@Ce was not very significant, the lignin was still the recommended raw material to developing biosorbent for removing phosphate due to its merits of being abundant, low-cost, sustainable and environmentally benign material. Based on above results and analysis, it is promising for the utilization of L-NH2@Ce in the remediation of phosphate from wastewater.
3.4. Effect of temperature
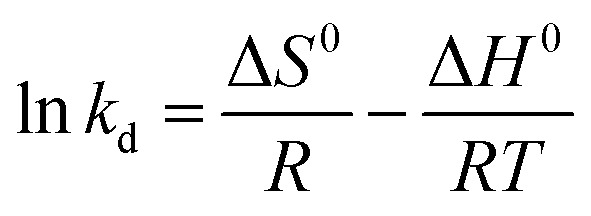
Fig. 5h presents the effect of temperature on the phosphate-uptake by L-NH2@Ce. With the temperature increasing from 15 to 45 °C, the uptake amount of phosphate increased from 24.88 to 31.95 mg g−1, indicative of more efficient for phosphate adsorption at a high temperature. The possible reason for this phenomenon is that the mobility of phosphate molecules increased at a high temperature, thereby increasing collision frequency between L-NH2@Ce and phosphate and improving the adsorption capacity of phosphate.42 Furthermore, the adsorption thermodynamics of phosphate were studied. The related parameters, i.e., standard free energy change (ΔG0), standard enthalpy change (ΔH0), and standard entropy change (ΔS0), can be calculated using the following formulas ((8)–(10)).41,45
| ΔG0 = −RT ln kd | 8 |
| ΔG0 = ΔH0 − TΔS0 | 9 |
 |
10 |
Based on the van't Hoff formula, the equilibrium constant kd is calculated from the slope of the plot ln (Qe/Ce) versus Ce at 288, 298, 308 and 318 K and extrapolating Ce to zero. Note that both ΔH0 and ΔS0 values were obtained from the slope and intercept of a plot of ln kdvs. 1/T (Fig. 5i). Moreover, the values of related parameters are summarized in Table 2. The value of ΔG0 becomes more negative with temperature increases, indicative of the spontaneous nature of phosphate adsorption on L-NH2@Ce. Note that the value of ΔH0 is positive of 21.607 kJ mol−1, which indicates that this adsorption reaction was endothermic in nature. Similarly, the value of ΔS0 is positive of 52 J mol−1 K−1, which suggests an increase in the randomness of the solid/solution system and helps in the adsorption of phosphate on L-NH2@Ce.35
The thermodynamic parameters for adsorption of phosphate onto L-NH2@Ce.
| Temperatures (K) | Thermodynamic parameters | ||
|---|---|---|---|
| ΔG0 (kJ mol−1) | ΔH0 (kJ mol−1) | ΔS0 (J mol−1 K−1) | |
| 288 | −3.089 | 21.607 | 52 |
| 298 | −3.947 | 21.607 | 52 |
| 308 | −4.804 | 21.607 | 52 |
| 318 | −5.662 | 21.607 | 52 |
3.5. Effect of pH values
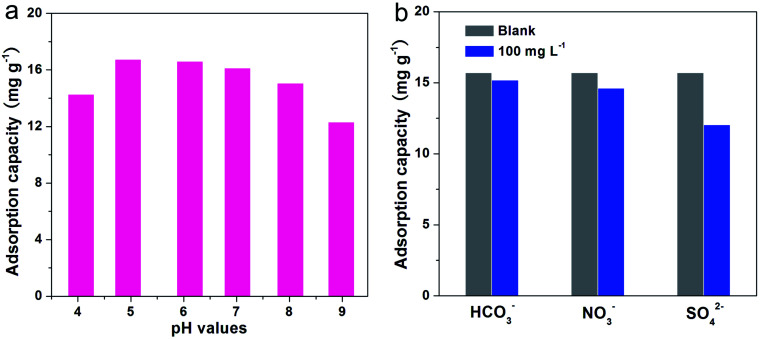
pH value is an extremely important influence on the surface charges of sorbent and existence of phosphate species in aqueous solutions.47,48 Thus, we examined the effect of pH value on the uptake amount of phosphate for L-NH2@Ce, which is presented in Fig. 6a. The adsorption amount of phosphate increased from pH 4 to 5, and then dropped from pH 5 to 9. The highest phosphate adsorption amount of 16.73 mg g−1 was obtained at pH 5, and the adsorption amount of phosphate considerably declined when the pH value increased to 9. This phenomenon was possibly observed because the competitive relationship between the negative OH− and PO43− for the active sites of the L-NH2@Ce becomes stronger,50 resulting in the lower adsorption amount of phosphate at high pH values such as 9. Note that similar adsorption behaviors have been observed by some adsorbents.30,51 Based on these results, as-obtained biosorbent L-NH2@Ce can effectively capture PO43− under mildly acidic, neutral, and mildly alkali conditions within the pH values range of 5–8.
Fig. 6. (a) Effect of solution pH values and (b) coexisting anions on the uptake amount of phosphate for L-NH2@Ce.
3.6. Effect of interfering anions
In water sources, conventional anions such as HCO3−, NO3−, and SO42− usually coexist and compete with PO43− for the active adsorption sites on L-NH2@Ce. Therefore, we examined the effect of interfering anions on the uptake amount of phosphate, which is shown in Fig. 6b. Interference tests were conducted by observing the changes of phosphate-uptake amount in the presence of the coexisting anion concentration at 100 mg L−1; the initial concentration of phosphate was ∼20 mg L−1. Note that the concentration of interfering ion was four times higher than that of phosphate. The introduction of interferents (HCO3− and NO3−) did not generate any great alteration in the adsorption capacity for phosphate, indicating an excellent anti-interference ability of L-NH2@Ce over two coexisting anions. However, the existence of SO42− caused a remarkable reduction in the phosphate adsorption amount from 15.7 mg g−1 to 12.0 mg g−1 because, similar to Ce4+, SO42− could associate with the functional group on the surface of L-NH2@Ce and generate strong surface complexes and decreased surface potential.52 Therefore, the available adsorption active sites of L-NH2@Ce reduced, which restrained the capture ability of phosphate. With these results, the effect of SO42− on adsorption performance was stronger than that of HCO3− and NO3−.
3.7. Regeneration study
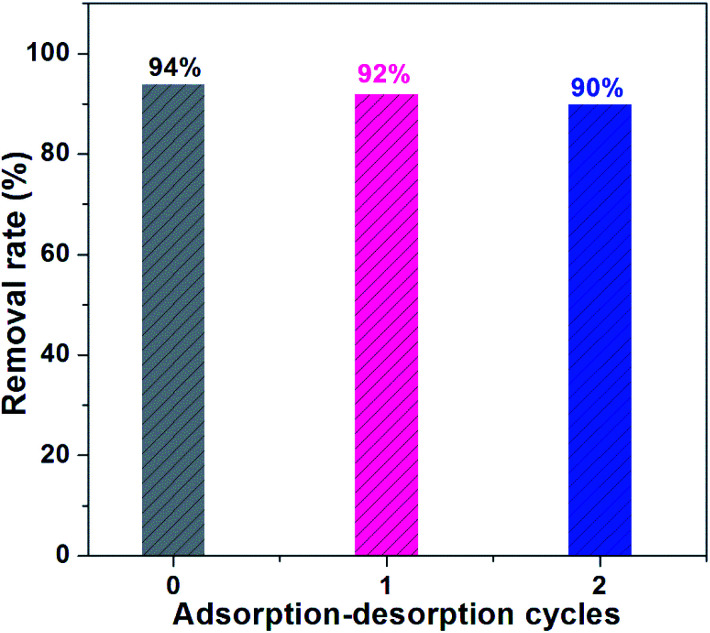
The reusability performance of the adsorbent is very significant for its practical engineering application.53,54 Therefore, adsorption–desorption cycles of bath experiments were performed to investigate the reusability performance of L-NH2@Ce for phosphate removal (Fig. 7). After adsorption, the used absorbent was regenerated by using 0.1 M NaOH solution at 60 °C for two times to remove the adsorbed phosphate. It can be seen that the regenerated L-NH2@Ce reached 92% of phosphate removal efficiency for the first regeneration. For the second regeneration, the removal efficiency of phosphate is still high and remained at ∼90%. The slight decrease from 94% to 90% is probably because of the inevitable loss of the active sites after two regeneration cycles.25
Fig. 7. Cycle adsorption and regeneration of L-NH2@Ce.
3.8. Stability of Ce ions on L-NH2@Ce
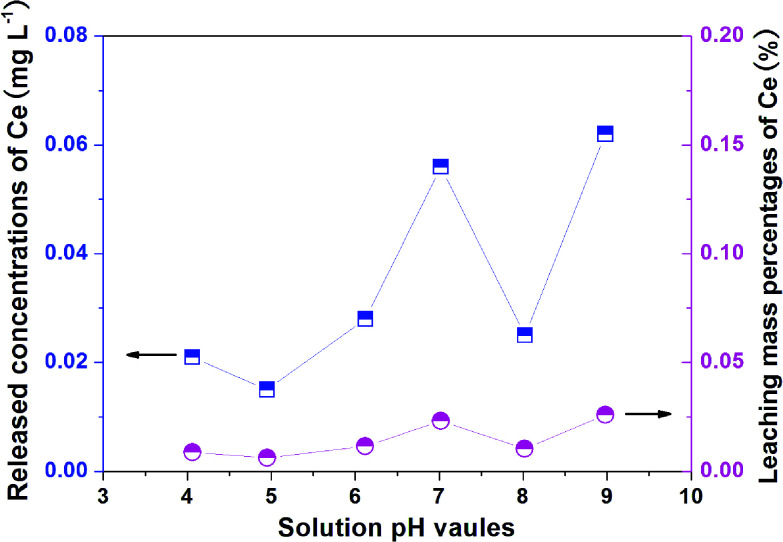
The stability of L-NH2@Ce was studied by detecting Ce leaching during phosphate adsorption at different pH values.54 As shown in Fig. 8, the released concentrations of Ce ions were 0.021, 0.015, 0.028, 0.056, 0.025, and 0.062 mg L−1 at pH 4.0, 5.0, 6.0, 7.0, 8.0, and 9.0, respectively. The calculated leaching mass percentages of Ce were only 0.0087%, 0.0062%, 0.0116%, 0.0232%, 0.0104%, and 0.0258%, respectively, each of which was lower than that of the reported material (0.79%),55 indicating that leaching of Ce from L-NH2@Ce was negligible and most of the Ce in L-NH2@Ce remained after phosphate adsorption over a wide pH range of 4–9. This was mainly because of the strong interactions between the surface groups –NH2/–NH– of L-NH2@Ce and nano-CeO2. This feature indicated the L-NH2@Ce was fairly stable in wastewater treatment.
Fig. 8. The released Ce concentrations and calculated mass percentages of Ce leaching during phosphate adsorption at different pH values.
4. Conclusions
In this study, a novel and inexpensive nano-biosorbent L-NH2@Ce was prepared by loading nano-CeO2 onto the aminated lignin, which is considered to be a promising biosorbent for phosphate capture. The crystallite size of nano-CeO2 obtained from the XRD diffraction pattern is 13 nm, which is almost in close agreement with the SEM result showing the average size of 15 nm. X-ray photoelectron spectroscopy (XPS) analysis indicated 70% of Ce4+ and 30% of Ce3+ were on the surface of L-NH2@Ce. Note that as-fabricated L-NH2@Ce possessed a higher BET surface area of 89.8 m2 g−1 and higher pore volume of 0.23 cm3 g−1 than that of raw material lignin. Moreover, as compared with lignin, the as-obtained L-NH2@Ce exhibits enhanced adsorption capacity of phosphate. The adsorption kinetics of phosphate onto L-NH2@Ce were found to be well described by the pseudo-second-order model, indicative of a chemical interaction between phosphate and L-NH2@Ce. Note that the adsorption isotherm of phosphate onto L-NH2@Ce can be fitted to the Langmuir model. Furthermore, coexisting anions study indicates that the introduction of SO42− has the largest influence on the adsorption performance of phosphate. Moreover, L-NH2@Ce can effectively capture phosphate under mildly acidic, neutral, and mildly alkali conditions in the pH range of 5–8. Based on these results, we can confirm that this study provides a new strategy to develop an efficient nano-biosorbent for phosphate removal.
Author contributions
Xiaohuan Liu, Xia He and Jiantao Zhang contributed equally to this work.
Conflicts of interest
There are no conflicts to declare.
Supplementary Material
Acknowledgments
This study was in part supported by the Zhejiang Provincial Natural Science Foundation of China under Grant No. LQ18B070001, and LY20B070002, by the China Postdoctoral Science Foundation through Grant No. 2017M612000, and 2019M661796, by the National Natural Science Foundation of China through Grant No. 21806142, and 51605446, by the Outstanding Youth Foundation of Taizhou University through Grant No. 2018YQ005, by the Young Elite Scientists Sponsorship Program by CAST through Grant No. 2018QNRC001, by the Undergraduate Research Training Program of Zhejiang A & F University through Grant No. KX20180109, and by the National Undergraduate Training Programs for Innovation and Entrepreneurship through Grant No. 201910341018.
Electronic supplementary information (ESI) available: The phosphate adsorption capacity of L-NH2@Ce in comparison with some biosorbents. See DOI: 10.1039/c9ra09986g
References
- Wang L. Wang J. He C. Lyu W. Zhang W. Yan W. Yang L. Colloids Surf., A. 2019;561:236–243. doi: 10.1016/j.colsurfa.2018.10.082. [DOI] [Google Scholar]
- Zong E. Huang G. Liu X. Lei W. Jiang S. Ma Z. Wang J. Song P. J. Mater. Chem. A. 2018;6:9971–9983. doi: 10.1039/C8TA01449C. [DOI] [Google Scholar]
- Zong E. Liu X. Wang J. Yang S. Jiang J. Fu S. J. Mater. Sci. 2017;52:7294–7310. doi: 10.1007/s10853-017-0966-0. [DOI] [Google Scholar]
- Wang B. Wen J. Sun S. Wang H. Wang S. Liu Q. Charlton A. Sun R. Ind. Crops Prod. 2017;108:72–80. doi: 10.1016/j.indcrop.2017.06.013. [DOI] [Google Scholar]
- Zong E. Wei D. Wan H. Zheng S. Xu Z. Zhu D. Chem. Eng. J. 2013;221:193–203. doi: 10.1016/j.cej.2013.01.088. [DOI] [Google Scholar]
- Wang B. Xia J. Mei L. Wang L. Zhang Q. ACS Sustainable Chem. Eng. 2018;6:1343–1351. doi: 10.1021/acssuschemeng.7b03667. [DOI] [Google Scholar]
- Zong E. Liu X. Liu L. Wang J. Song P. Ma Z. Ding J. Fu S. ACS Sustainable Chem. Eng. 2018;6:337–348. doi: 10.1021/acssuschemeng.7b02599. [DOI] [Google Scholar]
- Qiao X. Zhao C. Shao Q. Hassan M. Energy Fuels. 2018;32:6022–6030. doi: 10.1021/acs.energyfuels.8b00951. [DOI] [Google Scholar]
- Liu L. Qian M. Song P. Huang G. Yu Y. Fu S. ACS Sustainable Chem. Eng. 2016;4:2422–2431. doi: 10.1021/acssuschemeng.6b00112. [DOI] [Google Scholar]
- Yu Y. Song P. Jin C. Fu S. Zhao L. Wu Q. Ye J. Ind. Eng. Chem. Res. 2012;51:12367–12374. doi: 10.1021/ie301953x. [DOI] [Google Scholar]
- Yu Y. Fu S. Song P. Luo X. Jin Y. Lu F. Wu Q. Ye J. Polym. Degrad. Stab. 2012;97:541–546. doi: 10.1016/j.polymdegradstab.2012.01.020. [DOI] [Google Scholar]
- Song P. Cao Z. Meng Q. Fu S. Fang Z. Wu Q. J. Macromol. Sci., Part B: Phys. 2012;51:720. doi: 10.1080/00222348.2011.609794. [DOI] [Google Scholar]
- Song P. Cao Z. Fu S. Fang Z. Wu Q. Ye J. Thermochim. Acta. 2011;518:59–65. doi: 10.1016/j.tca.2011.02.007. [DOI] [Google Scholar]
- Ma Z. Wang J. Zhou H. Zhang Y. Yang Y. Liu X. Ye J. Chen D. Wang S. Fuel Process. Technol. 2018;181:142–156. doi: 10.1016/j.fuproc.2018.09.020. [DOI] [Google Scholar]
- Liu L. Huang G. Song P. Yu Y. Fu S. ACS Sustainable Chem. Eng. 2016;4:4732–4742. doi: 10.1021/acssuschemeng.6b00955. [DOI] [Google Scholar]
- Scarica C. Suriano R. Levi M. Turri S. Griffini G. ACS Sustainable Chem. Eng. 2018;6:3392–3401. doi: 10.1021/acssuschemeng.7b03583. [DOI] [Google Scholar]
- Liu X. Zong E. Hu W. Song P. Wang J. Liu Q. Ma Z. Fu S. ACS Sustainable Chem. Eng. 2019;7:758–768. doi: 10.1021/acssuschemeng.8b04382. [DOI] [Google Scholar]
- Luo X. Liu C. Yuan J. Zhu X. Liu S. ACS Sustainable Chem. Eng. 2017;5:6539–6547. doi: 10.1021/acssuschemeng.7b00674. [DOI] [Google Scholar]
- Liu X. Xu Y. Yu J. Li S. Wang J. Wang C. Chu F. Int. J. Biol. Macromol. 2014;67:483–489. doi: 10.1016/j.ijbiomac.2014.04.005. [DOI] [PubMed] [Google Scholar]
- Li Z. Xiao D. Ge Y. Koehler S. ACS Appl. Mater. Interfaces. 2015;7:15000–15009. doi: 10.1021/acsami.5b03994. [DOI] [PubMed] [Google Scholar]
- Ge Y. Li Z. ACS Sustainable Chem. Eng. 2018;6:7181–7192. doi: 10.1021/acssuschemeng.8b01345. [DOI] [Google Scholar]
- Nair V. Panigrahy A. Vinu R. Chem. Eng. J. 2014;254:491–502. doi: 10.1016/j.cej.2014.05.045. [DOI] [Google Scholar]
- Zong E. Liu X. Jiang J. Fu S. Chu F. Appl. Surf. Sci. 2016;387:419–430. doi: 10.1016/j.apsusc.2016.06.107. [DOI] [Google Scholar]
- Wu B. Fang L. Fortner J. D. Guan X. Lo I. M. C. Water Res. 2017;126:179–188. doi: 10.1016/j.watres.2017.09.034. [DOI] [PubMed] [Google Scholar]
- Dong S. Wang Y. Zhao Y. Zhou X. Zheng H. Water Res. 2017;126:433–441. doi: 10.1016/j.watres.2017.09.050. [DOI] [PubMed] [Google Scholar]
- Feng Y. Lu H. Liu Y. Xue L. Dionysiou D. D. Yang L. Xing B. Chemosphere. 2017;185:816–825. doi: 10.1016/j.chemosphere.2017.07.107. [DOI] [PubMed] [Google Scholar]
- Wang N. Feng J. Chen J. Wang J. Yan W. Chem. Eng. J. 2017;316:33–40. doi: 10.1016/j.cej.2017.01.066. [DOI] [Google Scholar]
- Cui G. Liu M. Chen Y. Zhang W. Zhao J. Carbohydr. Polym. 2016;154:40–47. doi: 10.1016/j.carbpol.2016.08.025. [DOI] [PubMed] [Google Scholar]
- Li R. Li Q. Gao S. Shang J. K. Chem. Eng. J. 2012;185–186:127–135. doi: 10.1016/j.cej.2012.01.061. [DOI] [Google Scholar]
- Ko Y. Do T. Chun Y. Kim C. Choi U. Kim J. J. Hazard. Mater. 2016;307:91–98. doi: 10.1016/j.jhazmat.2015.12.060. [DOI] [PubMed] [Google Scholar]
- Liu J. Cao J. Hu Y. Han Y. Zhou J. Water Sci. Technol. 2017;76:2867–2875. doi: 10.2166/wst.2017.412. [DOI] [PubMed] [Google Scholar]
- Kumar A. K. Parikh B. S. Pravakar M. Environ. Sci. Pollut. Res. 2016;23:9265–9275. doi: 10.1007/s11356-015-4780-4. [DOI] [PubMed] [Google Scholar]
- Nguyen T. Ngo H. Guo W. Zhang J. Liang S. Tung K. Bioresour. Technol. 2013;150:42–49. doi: 10.1016/j.biortech.2013.09.133. [DOI] [PubMed] [Google Scholar]
- Eberhardt T. Min S. Han J. Bioresour. Technol. 2006;97:2371–2376. doi: 10.1016/j.biortech.2005.10.040. [DOI] [PubMed] [Google Scholar]
- Rashid M. Price N. Gracia Pinilla M. O'Shea K. Water Res. 2017;123:353–360. doi: 10.1016/j.watres.2017.06.085. [DOI] [PubMed] [Google Scholar]
- Gu Y. Xie D. Ma Y. Qin W. Zhang H. Wang G. Zhang Y. Zhao H. ACS Appl. Mater. Interfaces. 2017;9:32151–32160. doi: 10.1021/acsami.7b10024. [DOI] [PubMed] [Google Scholar]
- Trivedi H. Patel V. Patel R. Eur. Polym. J. 1973;9:525–531. doi: 10.1016/0014-3057(73)90036-0. [DOI] [Google Scholar]
- Ho Y. McKay G. Process Biochem. 1999;34:451–465. doi: 10.1016/S0032-9592(98)00112-5. [DOI] [Google Scholar]
- Yu Y. Zhang C. Yang L. Paul Chen J. Chem. Eng. J. 2017;315:630–638. doi: 10.1016/j.cej.2016.09.068. [DOI] [Google Scholar]
- He J. Xu Y. Wang W. Hu B. Wang Z. Yang X. Wang Y. Yang L. Chem. Eng. J. 2020;379:122431. doi: 10.1016/j.cej.2019.122431. [DOI] [Google Scholar]
- Lǚ J. Liu H. Liu R. Zhao X. Sun L. Qu J. Powder Technol. 2013;233:146–154. doi: 10.1016/j.powtec.2012.08.024. [DOI] [Google Scholar]
- Vasudevan S. Lakshmi J. RSC Adv. 2012;2:5234–5242. doi: 10.1039/C2RA20270K. [DOI] [Google Scholar]
- Kim K. Kim D. Kim T. Kim B. G. Ko D. Lee J. Han Y. J. Jung J. Na H. RSC Adv. 2019;9:15257–15264. doi: 10.1039/C9RA00895K. [DOI] [PMC free article] [PubMed] [Google Scholar]
- Sun J. Xiu Y. Huang K. Yu J. Alam S. Zhu H. Guo Z. RSC Adv. 2018;8:22276–22285. doi: 10.1039/C8RA03203C. [DOI] [PMC free article] [PubMed] [Google Scholar]
- Mezenner N. Bensmaili A. Chem. Eng. J. 2009;147:87–96. doi: 10.1016/j.cej.2008.06.024. [DOI] [Google Scholar]
- Ray J. Jana S. Tripathy T. Int. J. Biol. Macromol. 2018;109:492–506. doi: 10.1016/j.ijbiomac.2017.12.083. [DOI] [PubMed] [Google Scholar]
- Hui B. Zhang Y. Ye L. Chem. Eng. J. 2014;235:207–214. doi: 10.1016/j.cej.2013.09.045. [DOI] [Google Scholar]
- Qiu H. Liang C. Zhang X. Chen M. Zhao Y. Tao T. Xu Z. Liu G. ACS Appl. Mater. Interfaces. 2015;7:20835–20844. doi: 10.1021/acsami.5b06098. [DOI] [PubMed] [Google Scholar]
- Zhang Y. Li H. Zhang Y. Song F. Cao X. Lyu X. Zhang Y. Crittenden J. Statistical optimization and batch studies on adsorption of phosphate using Al-eggshell. Adsorpt. Sci. Technol. 2018;36:999–1017. doi: 10.1177/0263617417740790. [DOI] [Google Scholar]
- Hao H. Wang Y. Shi B. Water Res. 2019;155:1–11. doi: 10.1016/j.watres.2019.01.049. [DOI] [PubMed] [Google Scholar]
- Zhang Y. Pan B. Shan C. Gao X. Environ. Sci. Technol. 2016;50:1447–1454. doi: 10.1021/acs.est.5b04630. [DOI] [PubMed] [Google Scholar]
- Liu X. Zhang L. Powder Technol. 2015;277:112–119. doi: 10.1016/j.powtec.2015.02.055. [DOI] [Google Scholar]
- Kim M. Kim H. Byeon S. ACS Appl. Mater. Interfaces. 2017;9:40461–40470. doi: 10.1021/acsami.7b13437. [DOI] [PubMed] [Google Scholar]
- Li T. Su X. Yu X. Song H. Zhu Y. Zhang Y. Bioresour. Technol. 2018;263:207–213. doi: 10.1016/j.biortech.2018.04.108. [DOI] [PubMed] [Google Scholar]
- Yang J. Yuan P. Chen H. Zou J. Yuan Z. Yu C. J. Mater. Chem. 2012;22:9983–9990. doi: 10.1039/C2JM16681J. [DOI] [Google Scholar]
Associated Data
This section collects any data citations, data availability statements, or supplementary materials included in this article.


