

ABSTRACT
Background
Little is known regarding the dynamics of antibody and T-cell responses in chronic kidney disease (CKD) following coronavirus disease 2019 (COVID-19) vaccination.
Methods
Prospective observational cohort study including 144 participants on haemodialysis (HD) (n = 52) or peritoneal dialysis (PD) (n = 14), those undergoing kidney transplantation (KT) (n = 30) or those with advanced CKD (ACKD) not on dialysis and healthy controls (n = 18). Anti-Spike (S) antibody and T-cell responses were assessed at 15 days (15D) and 3 months (3M) after complete vaccination schedule. HD, PD and KT patients received mRNA vaccines (mRNA-123 and BNT162b2). Most ACKD patients received BNT162b2 (n = 23), or Ad26.COV.2.S (4). Most controls received BNT162b2 (n = 12), or Ad26.COV.2.S (n = 5).
Results
Anti-S antibodies at 15D and 3M were detectable in 95% (48/50)/98% (49/50) of HD patients, 93% (13/14)/100% of PD patients, 67% (17/26)/75% (21/28) of KT patients and 96% (25/26)/100% (24/24) of ACKD patients. Rates for healthy controls were 81% (13/16)/100% (17/17). Previous severe acute respiratory syndrome coronavirus 2 (SARS-CoV-2-S) infection was documented in four (7.7%) HD patients, two (14.3%) PD patients, two (6.7%) KT patients, one (5.55%) healthy control and in no ACKD patient. Antibody levels decreased at 3M in HD (P = .04), PD (P = .008) and ACKD patients (P = .0009). In KT patients, levels increased (P = .04) between 15D and 3M, although they were low at both time points.
T-cell responses were detected in HD patients in 37 (80%) at baseline, 35 (70%) at 15D and 41 (91%) at 3M. In PD patients, T-cell responses appeared in 8 (67%) at baseline, 13 (93%) at 15D and 9 (100%) at 3M. In KT patients, T-cell responses were detected in 12 (41%) at baseline, 22 (84%) at 15D and 25 (96%) at 3M. In ACKD patients, T-cell responses were detected in 13 (46%) at baseline, 20 (80%) at 15D and 17 (89%) at 3M. None of healthy controls showed T-cell response at baseline, 10 (67%) at 15D and 8 (89%) at 3M.
Conclusions
Most HD, PD and ACKD patients develop SARS-CoV-2-S antibody responses comparable to that of healthy controls, in contrast to KT recipients. Antibody waning at 3M was faster in HD, PD and ACKD patients. No differences in SARS-CoV-2 T-cell immunity responses were noticed across study groups.
Keywords: chronic kidney disease, dialysis, kidney transplantation, SARS-CoV-2-S antibodies, SARS-CoV-2-S T-cells
Graphical Abstract
Graphical Abstract.

INTRODUCTION
Patients with chronic kidney disease (CKD), including those on haemodialysis (HD) or peritoneal dialysis (PD), those with advanced chronic renal disease not undergoing replacement therapy (ACKD) and kidney transplant recipients (KT) have been prioritized for access to coronavirus disease 2019 (COVID-19) vaccination due to their increased risk of developing severe forms of the disease [1]. A large number of studies have assessed the immunogenicity of different COVID-19 vaccine platforms in CKD patients, focussing on the Spike (S) seroconversion rate [2–21] and less commonly on evaluating S-reactive antibody and T-cell responses in combination [22–34], returning variable and, not uncommonly, divergent results. Most of these studies usually targeted one or two of the above CKD patient populations and used a variety of immunological methods for measuring antibody and T-cell responses, thus hampering direct comparison of the extent of impairment (if any) of vaccine-elicited immune responses across CKD patients. Given that the immunological assessments were carried out relatively soon after full vaccination (up to 2 months) [2–19, 22–34] clarification of the dynamics of post-vaccination antibody and T-cell responses over time in CKD patients is of paramount clinical relevance, as it would help to determine the most appropriate timing for delivery of a booster dose, if needed. To our knowledge, only the RECOVAC and the SENCOVAC studies comprehensively assessed either vaccine-elicited antibody, T-cell responses or both in multi-centre cohorts including HD, PD, ACKD, KT and healthy controls [29–35]. Nevertheless, immunological investigations were performed rather early after full vaccination with mRNA COVID-19 vaccines. In contrast, this study evaluated the kinetics of severe acute respiratory syndrome coronavirus 2 (SARS-CoV-2) antibody and T-cell responses in HD, PD, ACKD, KT and controls up to 3 months after complete vaccination with different COVID-19 vaccine platforms. Anti-receptor binding domain (RBD) total antibody assay calibrated to the first World Health Organisation (WHO) COVID-19 antibody standard [36] and a whole-blood flow cytometry assay for intracellular cytokine staining for enumeration of S-reactive T cells [37] were used for this purpose.
MATERIALS AND METHODS
Participants and study design
We conducted a prospective, observational cohort study between March and October 2021. It included 144 non-consecutive adults (˃18 years), CKD patients (92 male; median age, 67 years; range, 19–86), on either HD (n = 52) or PD (n = 14), KT (n = 30) and ACKD patients (eGFR <30 mL/min/1.73 m2) not undergoing renal replacement therapy (n = 30). The controls were seemingly healthy individuals (n = 18) without kidney diseases (eGFR ≥60 mL/min/1.72 m2) that completed the COVID-19 vaccination schedule according to the respective manufacturer’s recommendations. The latter group was recruited from among partners, siblings or household members of patients and were matched to patients by age. Participants were enrolled at the Nephrology Service of Hospital Clínico Universitario of Valencia, the Nephrology Service of Hospital Universitario Dr Peset, Valencia and two satellite haemodialysis centres from Valencia (Spain). Current infection, neoplasia or immunosuppressive treatment (except for KT patients) at the time of immunological monitoring and receipt of a solid organ allograft other than the kidney were exclusion criteria. All participants received complete vaccination with the available vaccines: BNT162b2 (Cominarty ®30 mcg 21 days apart), mRNA-1273 (Spikevax® 100 μg 28 days apart) and Ad26.COV.2 (Janssen® 0.5 mL), as per local public health authorities’ prescription. Patients’ flow-chart is available in Supplementary data, Figure S1. Table 1 summarizes the most relevant clinical characteristics of participants in each study group. It is of note that only one participant (HD) acquired SARS-CoV-2 infection between sampling times. The study was approved by the Ethics Committee of Hospital Clínico Universitario of Valencia-INCLIVA (2021/194). Informed consent was obtained from all participants.
Table 1.
Demographic and clinical characteristics of participants at baseline
| Study group (no. of participants) | |||||
|---|---|---|---|---|---|
| Parameter | HC (18) | ACKD (30) | PD (14) | HD (52) | KT (30) |
| Female (%) | 72.2 | 36.7 | 21.4 | 32.7 | 26.7 |
| Age (years) | 63 (58–72) | 66 (53–72) | 69 (58–76) | 72 (59–77) | 59 (52–70) |
| BMI (kg/m2) | 25.29 ± 4.41 | 27.98 ± 5.73 | 28.25 ± 4.6 | 27.17 ± 5.16 | 23.5 ± 8.2 |
| Comorbidities, n (%) | |||||
| Hypertension | 8 (44.4) | 24 (80) | 13 (92.9) | 42 (82.4) | 27 (90) |
| Diabetes | 2 (11.1) | 9 (30) | 7 (50) | 22 (43.1) | 8 (26.7) |
| Previous cardiovascular disease | 1 (5.6) | 6 (20) | 8 (57.1) | 19 (37.3) | 1 (3.3) |
| Chronic liver disease | 0 | 0 | 1 (7.1) | 4 (7.8) | 0 |
| Primary renal diagnosis, n (%) | |||||
| Nephroangioesclerosis | – | 9 (30) | 5 (35.7) | 8 (15.4) | 1 (3.3) |
| Diabetic kidney disease | – | 2 (6.7) | 5 (35.7) | 8 (15.4) | 5 (16.7) |
| Chronic interstitial nephritis | – | 3 (10) | 0 | 3 (5.8) | 3 (10) |
| Cystic disease | – | 6 (20) | 0 | 5 (9.6) | 0 |
| Urologic | – | 0 | 0 | 1 (1.9) | 2 (6.7) |
| Primary glomerulonephritis | – | 9 (10) | 2 (14.3) | 9 (17.3) | 13 (43.4) |
| Unknown | – | 6 (20) | 2 (14.3) | 17 (32.7) | 5 (16.7) |
| Other | – | 1 (3.3) | 0 | 1 (1.9) | 1 (3.3) |
| Vaccine platform, n (%) | |||||
| BNT162b2 | 11 (61) | 23 (77) | 7 (50) | 22 (42) | 3 (10) |
| mRNA-1237 | 1 (5) | 3 (10) | 7 (50) | 30 (58) | 27 (90) |
| Ad26.COV.2.S | 6 (33) | 4 (13) | 0 | 0 | 0 |
| Lab parameters | |||||
| Creatinine (mg/dL) | 0.78 (0.68–1.02) | 2.67 (1.99–3.55) | 4.56 (4.02–6.15) | 8.10 (6.40–9.82) | 1.69 (1.15–2.81) |
| Urea (mg/dL) | 42.0 ± 8.78 | 101.30 ± 35.78 | 125.0 ± 32.27 | 127.10 ± 32.74 | 70.82 ± 28.60 |
| eGFR (mL/min/1.73 m2) | 80.0 (62–86) | 22.0 (15–31) | 9.75 (6.97–28.27) | – | 50.0 (30–71) |
| Serum albumin (g/dL) | 4.20 (4.0-4.30) | 4.10 (3.90-4.30) | 3.45 (3.10-3.70) | 3.60 (3.40-4.0) | 4.35 (4.02–4.50) |
| CRP (mg/dL) | 1.65 (1.00–5.07) | 2.55 (0.95–5.07) | 3.55 (2.12–12.50) | 3.15 (1.80–8.52) | 1.0 (1.0–7.02) |
| Leukocytes (109/L) | 6.88 (5.53–10.50) | 7.43 (6.9–10.04) | 7.63 (6.08–9.20) | 6.25 (5.21–7.75) | 6.60 (5.88–8.24) |
| PMN (109/L) | 3.85 (2.88–5.69) | 4.58 (3.77–5.77) | 4.89 (3.71–7.07) | 4.31 (3.57–5.17) | 4.60 (3.45–5.82) |
| Lymphocytes (109/L) | 1.95 (1.64–2.72) | 2.06 (1.46–2.87) | 1.83 (1.12–11.90) | 1.26 (0.93–1.73) | 1.20 (0.75–1.60) |
| Dialysis vintage (months) | – | – | – | 36 (14–65) | 23.5 (3.5–91) |
| Vascular access n (%) | |||||
| AVF | – | – | – | 32 (69.6) | – |
| CVC | – | 14 (30.4) | |||
| Kidney transplant vintage (months) | – | – | – | – | 27 (14.7–38.2) |
| Immunosuppressive agents, n (%) | |||||
| Steroids | – | – | – | – | 30 (100) |
| Calcineurin inhibitor | – | – | – | – | 26 (86.6) |
| Mycophenolate mofetil | – | – | – | – | 24 (80.0) |
| mTOR inhibitor | – | – | – | – | 26 (86.6) |
Continuous variables displaying a normal distribution are represented as average ± standard deviation. Continuous variables with no normal distribution are represented as medians (interquartile range).
ACKD, advanced chronic kidney disease; AVF, arteriovenous fistula; BMI, body mass index; CRP, C-reactive protein; CVC, central venous catheter; eGFR, estimated glomerular filtration rate; HC, healthy controls; HD, haemodialysis; KT, kidney transplantation; PD, peritoneal dialysis; PMN, polymorphonuclear neutrophil leukocytes.
Immunological testing
SARS-CoV-2-S antibody and T-cell responses were evaluated at baseline (a median of 44 days prior to vaccination; range, 14–120) and at a median of 15D (range, 5–46) and 92 days/3M (range, 37–155) after complete vaccination schedule (two doses). Blood specimens were collected in sodium heparin tubes (Becton Dickinson, UK Ltd, UK). Plasma SARS-CoV-2-S antibodies were quantitated by Roche Elecsys® Anti-SARS-CoV-2 S (Roche Diagnostics, Pleasanton, CA, USA), an electrochemiluminescence sandwich immunoassay (ECLIA) that quantifies total (IgG and IgM) antibodies directed against the receptor-binding domain of the S protein (RBD) and is calibrated with the first WHO International Standard and Reference Panel for anti-SARS-CoV-2 antibody [36], run on cobas® e601 modular analyser (Roche Diagnostics, Rotkreuz, Switzerland). Plasma returning antibody levels above the upper limit of the quantitation (250 U/mL) were diluted up to 1/10 as per manufacturer’s instructions, to maintain the linearity of the assay. Antibody levels are reported in binding antibody units (BAU)/mL throughout the study. Enumeration of SARS-CoV-2-S-reactive IFNγ‐producing‐CD8+ and CD4+ T cells in fresh whole blood was carried out by flow cytometry for intracellular cytokine staining (BD Fastimmune, Becton Dickinson and Company‐Biosciences, San Jose, CA, USA) as previously described [37]. Two sets of 15‐mer overlapping peptides (11‐mer overlap) encompassing the SARS‐CoV‐2 Spike (S) glycoprotein (S1, 158 peptides and S2, 157 peptides) at a concentration of 1 μg/mL per peptide (JPT Peptide Technologies GmbH; Berlin, Germany), in the presence of 1 μg/mL of costimulatory monoclonal antibodies (mAbs) to CD28 and CD49d were used. Stimulated whole blood specimens were treated with BD FACS™ lysing solution for lysing red blood cells and cryopreserved at −80ºC until assayed. On the day of testing, specimens were thawed at 37°C, washed, permeabilized (BD permeabilizing solution) and stained with a combination of labelled mAbs (anti‐IFNγ‐FITC, anti‐CD4‐APC-H7, anti‐CD8‐PerCP‐Cy5.5 and anti‐CD3‐APC) for 1 h at room temperature. Appropriate positive (phytohemagglutinin) and isotype controls were used. Cells were then washed, re-suspended in 200 μL of 1% paraformaldehyde in PBS and analysed within 2 h on a FACSCanto flow cytometer using DIVA v8 software (BD Biosciences Immunocytometry Systems, San Jose, CA, USA). CD3+/CD8+ or CD3+/CD4+ events were gated and then analysed for IFN‐γ production. All data were corrected for background IFN-γ production (FITC-labelled isotype control antibody) and expressed the number of SARS-CoV-2-reactive IFN-γ-producing CD4+ or CD8+ T cells relative to the absolute number of CD4+ and CD8+ T cells, respectively, ×100 (%). Any frequency value of SARS-CoV-2-reactive IFN-γ-producing CD4+ or CD8+ T cells after background subtraction was considered as a positive (detectable) result and used for analysis purposes. Antibody and T-cell assays were run at the Microbiology Service of the Hospital Clínico Universitario of Valencia (HCU) in singlets.
Statistical methods
Frequency comparisons for categorical variables were carried out using the Fisher exact test. Differences between medians were compared using the Mann–Whitney U-test, the Wilcoxon test or the Kruskal–Wallis H test, as appropriate. Two-sided exact P-values were reported. A P-value <0.05 was considered statistically significant. The analyses were performed using SPSS version 20.0 (SPSS, Chicago, IL, USA).
The data underlying this article will be shared on reasonable request to the corresponding author.
RESULTS
SARS-CoV-2-S antibody and T-cell responses in haemodialysis patients
A total of 52 HD patients were included (median age, 72.5 years; range, 35–86). In all, 30 and 22 patients completed the vaccination schedule with mRNA-1273) or BNT162b2, respectively. Out of the 52 patients, 5 had SARS-CoV-2 infection prior to the first vaccine dose (all of them vaccinated with mRNA1273). Overall, most patients had detectable anti-RBD total antibodies at 15D (48/50; 96%) and 3M (49/50; 98%) after complete vaccination (Table 2), with no significant differences across participants vaccinated with mRNA1273 and BNT162b2 (100% versus 91% at 15D, respectively, P = 0.12; 100% versus 95% at 3M, respectively, P = 0.48). Patients not exhibiting detectable anti-RBD antibody responses had been vaccinated with the BNT162b2 COVID-19 vaccine.
Table 2.
SARS-CoV-2 anti-RBD total antibody detection rates and levels in plasma specimens collected prior to vaccination and at different times afterwards
| SARS-CoV-2 RBD total antibody level (BAU/mL) | ||||||
|---|---|---|---|---|---|---|
| Baseline | 15D | 3M | ||||
| Study group | No. of positives/no. tested (%) | Median (range) | No. of positives/no. tested (%) | Median BAU/mL (range) | No. of positives/no. tested (%) | Median BAU/mL (range) |
| HD | 6/48 (12.5) | 0 (0–2.500 | 48/50 (96) | 1.146 (0–2.500) | 49/50 (98) | 388 (0–2.500) |
| PD | 3/12 (27) | 0 (0–250) | 13/14 (93) | 1.313 (16–2.500) | 9/9 (100) | 154 (24–2.500) |
| KT | 5/28 (17) | 0 (0–1.920 | 17/26 (65.3) | 5 (0–2.500) | 21/28 (75) | 58 (0– 2.500 |
| ACKD | 0/30 (0) | 0 | 25/26 (96) | 632 (0–2.500) | 24/24 (100) | 230 (1.3–2.500) |
| Control | 1/14 (7) | 0 (0–114) | 13/16 (81) | 641 (0–2.500) | 17/17 (100) | 477 (5.9–2.500) |
15D, 3M, median of 15 days and 3 months after completion of the vaccination schedule; ACKD, Advanced chronic kidney disease; BAU, binding antibody units; HD, haemodialysis; KT, kidney transplantation; PD, peritoneal dialysis; RBD, receptor-binding domain.
Overall, antibody levels measured at 15D were found to decrease at 3M (P = 0.04) (Figure 1 and Table 2) by a median of 2.5-fold (range, 0.08–16.4). Antibody decline was comparable (P = 0.49) for patients vaccinated with mRNA1273 (median, 2.28-fold) and BNT162b2 (median, 2.66-fold) (Supplementary data, Figure S2).
FIGURE 1:

Box and whisker plots depicting SARS-CoV 2 receptor-binding domain (RBD) total antibodies (in BAU/mL) in patients undergoing haemodialysis (HD), peritoneal dialysis (PD), with advanced chronic kidney disease (ACKD), kidney transplant recipients (KT) and healthy controls at a median of 15 days (15D) and 3 months (3M) after full vaccination with COVID-19 vaccines. P-values for comparisons across study groups are shown.
Patients vaccinated with mRNA1273 displayed higher (P < 0.001) antibody levels at both sampling times compared with those who received the BNT162b2 vaccine (Figure 2), irrespective of pre-vaccination SARS-CoV-2 infection status (Supplementary data, Figure S3).
FIGURE 2:
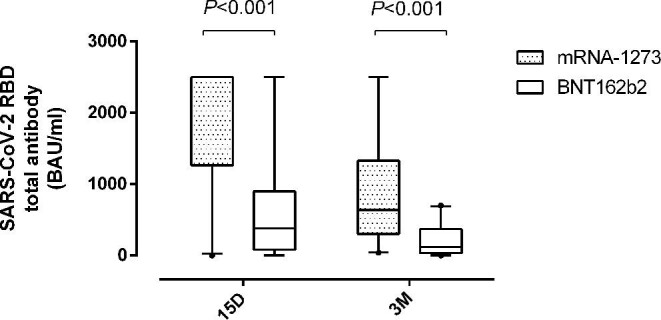
Box and whisker plots depicting SARS-CoV-2-receptor-binding domain (RBD) total antibodies (in BAU/mL) in patients undergoing haemodialysis (HD), at a median of 15 days (15D) and 3 months (3M) after full vaccination according to the COVID-19 vaccine platform used. P-values for comparisons across study groups are shown.
A salient feature regarding SARS-CoV-2-S-reactive T-cell immunity (Table 3) was the documentation of either detectable CD8+ or CD4+ T-cell responses (or both) in most patients at baseline (37/46; 80%), frequencies of both SARS-CoV-2-S-reactive T-cell subsets were below 0.1% (median, 0.03% and 0.06%, respectively). Overall, the rate of detectable T-cell responses slightly declined at 15D and notably increased at 3M, when most patients (41/45; 91%) tested positive. This pattern was similar in patients vaccinated with mRNA1273 and BNT162b2 (P = 0.669). Overall, while the frequency of SARS-CoV-2-S-reactive T CD4+ T cells at 3M was significantly (P < 0.022) increased relative to that found at baseline, that of CD8+ T cells remained unchanged. This observation was made for patients vaccinated with both mRNA1273 and BNT162b2 (Figure 3).
Table 3.
SARS-CoV-2-Spike T- cells detection rates and frequencies levels in whole blood specimens collected prior to vaccination and at different times afterwards
| Study group | |||||||
|---|---|---|---|---|---|---|---|
| Time of assessment | Parameter | KT | HD | PD | ACKD | Control | P-value |
| Baseline | No. of participants (%) with detectable T cells (either CD8+, CD4+ or both) | 12/27 (41) | 37/46 (80) | 8/12 (67) | 13/28 (46) | 0/17 (0) | <.001 |
| Median frequency of CD8+ T cells, % (range) | 0 (0–7.06) | 0.03 (0–3.60) | 0 (0–0.06) | 0 (0–2.54) | 0 | <.001 | |
| Median frequency of CD4+ T cells, % (range) | 0 (0–2.03) | 0.06 (0–2.30) | 0 (0–0.07) | 0 (0–2.86) | 0 | <.001 | |
| 15D | No. of participants (%) with detectable T cells (either CD8+, CD4+ or both) | 22/26 (84) | 35/50 (70) | 13/14 (93) | 20/25 (80) | 10/15 (67) | .26 |
| Median frequency of CD8+ T cells, % (range) | 0.04 (0–1.66) | 0.02 (0– 4.08) | 0.03 (0– 0.62) | 0.06 (0–1.88) | 0.02 (0–1.37) | .94 | |
| Median frequency of CD4+ T cells, % (range) | 0.03 (0–6.05) | 0 (0–0.93) | 0 (0–1.03) | 0.02 (0–0.73) | 0.03 (0–2.51) | .83 | |
| 3M | No. of participants (%) with detectable T cells (either CD8+, CD4+ or both) | 25/26 (96) | 41/45 (91) | 9/9 (100) | 17/19 (89) | 8/9 (89) | .77 |
| Median frequency of CD8+ T cells, % (range) | 0.11 (0–9.89) | 0.2 (0–2.47) | 0.01 (0–0.97) | 0.04 (0–1.07) | 0.25 (0–3.15) | .40 | |
| Median frequency of CD4+ T cells, % (range) | 0.05 (0–11.10) | 0.03 (0–6.21) | 0.04 (0–1.57) | 0.03 (0–0.63) | 0.08 (0–14.90) | .41 | |
15D, 3M, median of 15 days and 3 months after completion of the vaccination schedule; ACKD, advanced chronic kidney disease; HD, haemodialysis; KT, kidney transplantation; PD, peritoneal dialysis.
FIGURE 3:
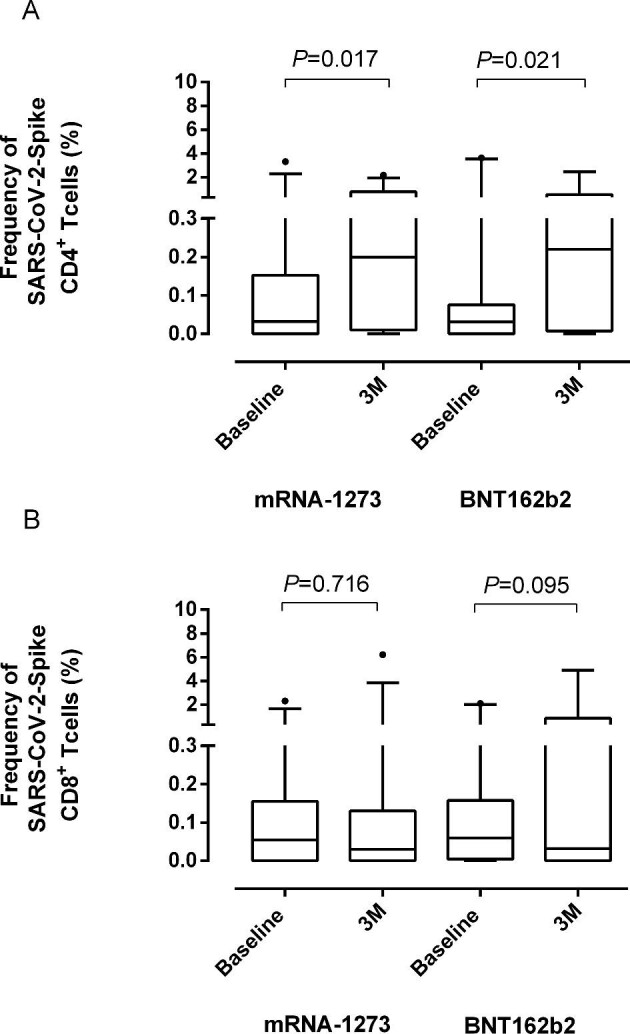
Box and whisker plots depicting SARS-CoV-2-Spike (S)-IFN-γ producing (A) CD4+ and (B) CD8+ T-cell frequencies in patients undergoing haemodialysis at baseline (pre-vaccination) and at a median and 3 months (3M) after full vaccination according to the COVID-19 vaccine platform used (mRNA1273 and BNT162b2). P-values for comparisons across study groups are shown.
SARS-CoV-2-S antibody and T-cell responses in PD patients
Out of the 14 PD patients (11 males; median age, 68 years; range, 41–84), 7 were vaccinated with mRNA1273 and 7 with BNT162b2. Two patients had a record of SARS-CoV-2 infection prior to receiving the first vaccine dose. Overall, 93% (13/14) and 100% of patients had measurable SARS-CoV-2-RBD antibodies at 15D and 3M, respectively (Table 2). Antibody levels significantly waned (median, 3.75-fold; range, 1.0–8.06) at 3M (P = 0.008). Antibody decline was similar (P = 0.53) for patients vaccinated with mRNA1273 (median, 5.0-fold) and BNT162b2 (median, 3.06-fold).
Baseline SARS-CoV-2-S T-cell responses were documented in 67% (8/12) of patients (Table 3). The rate of detectable responses increased by 15D (13/14; 93%) and 3M after vaccination (9/9; 100%), with no differences across patients vaccinated with mRNA1273 and BNT162b2 (not shown). In addition, overall, the frequencies of both SARS-CoV-2-S CD8+ and CD4+ T cells were not significantly different (P = 0.6) at baseline and 3M (Table 3), irrespective of the vaccine platform used (not shown).
SARS-CoV-2-S antibody and T-cell responses in kidney transplant recipients
KT recipients (n = 30; 22 males; median age, 59 years; range, 26–82) mostly received the mRNA1273 vaccine (27/30) and were SARS-CoV-2 naïve (25/30). The remaining three patients had been vaccinated with BNT162b2 COVID-19 vaccine. Transplantation had been performed at a median of 27.0 months (interquartile range, 14.7–38.2) prior to vaccination. Only 6.7% (2/30) were vaccinated in their first-year post-transplantation. Detectable anti-RBD antibodies were found in 67% (17/26) and 75% (21/28) of patients at 15D and 3M after complete vaccination, respectively (Table 2). Antibody levels increased (P = 0.04) between 15D and 3M, although they were rather low at both time points (median of 5 and 58 BAU/mL, respectively; Table 2).
Detectable SARS-CoV-2-S T-cell responses were present in 41% (12/27), 84% (22/26) and 96% (25/26) of patients at baseline, at 15D and 3M after full vaccination (Table 3). Frequencies of both SARS-CoV-2-S CD8+ and CD4+ T cells were found to increase at 3M compared with baseline levels (P = 0.08 and P = 0.01, respectively).
SARS-CoV-2-S antibody and T-cell responses in patients with ACKD not undergoing renal replacement therapy
ACKD patients (n = 30; 19 males; median age, 66.5 years; range, 38–77) had been vaccinated with BNT162b2 (n = 23), mRNA1273 (n = 3) or Ad26.CoV2.S vaccine (n = 4). The vaccine platform used was unknown for one patient. No patients had a record of SARS-CoV-2 infection occurring prior to vaccination. Detectable anti-RBD antibodies were found in 96% (25/26) and 100% (24/24) of patients at 15D and 3M, respectively. Antibody levels at 3M were a median of 2.16-fold lower (P = 0.0009) than those measured at 15D. SARS-CoV-2-S T cells were detected in 46% of patients (13/28) at baseline and the rate of detection increased afterward, reaching 80% (20/25) and 89% (17/19) of patients at 15D and 3M, respectively. As shown in Table 3, the frequency of both SARS-CoV-2-S CD4+ and CD8+ T cells increased at 15D (P = 0.10 and P = 0.03, respectively) as compared with that found at baseline, and remained relatively stable at 3M (P = 0.95 and P = 0.60, respectively).
SARS-CoV-2-S antibody and T-cell responses in healthy controls
Controls (n = 18; 13 females; median, 68.5 years; range 29–77) had been vaccinated with BNT162b2 (n = 11), Janssen Ad26.CoV2.S vaccine (n = 6) or mRNA1273 (n = 1). All, except one patient, were SARS-CoV-2 naïve prior to vaccination. Detectable anti-RBD antibodies were found in 81% (13/16) and 100% (17/17) by 15D and 3M after full vaccination, respectively. Antibody levels waned slightly at 3M (Table 2 and Figure 1) (median, 1.24-fold; range, 0–10; P = 0.57). None of the participants evaluated (n = 12) had detectable SARS-CoV-2-S-detectable T-cell responses at baseline, whereas 67% (10/15) and 89% (8/9) exhibited them at 15D and 3M, respectively (Table 3). SARS-CoV-2-S CD4+ and CD8+ T-cell frequencies were found to increase, albeit not significantly (P = 0.38 and P = 0.080, respectively) between 15D and 3M (Supplementary data, Figure S4).
Comparison of SARS-CoV-2 antibody and T-cell responses across groups according to the vaccine platform used
Due to the limited study sample size, a comparative analysis of the kinetics of SARS-CoV-2-S antibody and T-cell responses following vaccination with mRNA1273 could only be performed for dialysis and KT patients (Table 4). Significant differences were observed across groups regarding both the rate of detection and measurable levels of anti-RBD total antibodies, which were lower in KT as compared with dialysis patients, regardless of whether or not SARS-CoV-2 experienced individuals were included in the analyses (Supplementary data, Table S1). In addition, while the rate of detection and median frequency of SARS-CoV-2-S CD4+ T cells appeared comparable across groups, that of SARS-CoV-2-S CD8+ T cells was substantially higher in PD as compared with HD and KT. SARS-CoV-2-S antibody and T-cell responses in HD, ACKD and controls after vaccination with BNT162b2 could also be compared (Table 5). Notably, we found no significant differences across groups.
Table 4.
SARS-CoV-2-RBD antibody and S-reactive T-cell responses in patients undergoing haemodialysis or peritoneal dialysis and kidney transplant recipients at different time points after full vaccination with the mRNA1273 COVID-19 vaccine
| Anti-SARS-CoV-2-RBD total antibody detection at 15D | Levels of anti-SARS-CoV-2-RBD total antibody at 15D | Anti-SARS-CoV-2-RBD total antibody detection at 3M | Levels of anti-SARS-CoV-2-RBD total antibody at 3M | |||||
|---|---|---|---|---|---|---|---|---|
| Study group (no. of participants) | Rate (%) | P-value | Median BAU/mL (range) | P-value | Rate (%) | P-value | Median BAU/mL (range) | P-value |
| HD (30) | 100 | .08 | 2.500 (0.90–2.500) | .001 | 100 | .40 | 637 (39–2.500) | .04 |
| PD (7) | 100 | 1.120 (65.0–2.500) | 100 | 121 (35.0–2.500) | ||||
| KT (26) | 74 | 7.00 (0.90–2.500) | 84 | 75.6 (0.90–2.500) | ||||
| Anti-SARS-CoV-2-S CD4+ T-cell response detection at 15D | Frequency of SARS-CoV-2-S CD4+ T cells at 15D | Anti-SARS-CoV-2-S CD4+ T-cell response detection at 3M | Frequency of SARS-CoV-2-S CD4+ T cells at 3M | |||||
| Rate (%) | P-value | Median % (range) | P-value | Rate (%) | P-value | Median % (range) | P-value | |
| HD (30) | 84 | .44 | 0.04 (0–2.64) | .72 | 81 | .41 | 0.20 (0.0–2.17) | .91 |
| PD (7) | 71 | 0.02 (0–0.62) | 75 | 0.34 (0.0–0.97) | ||||
| KT (26) | 70 | 0.04 (0–1.62) | 92 | 0.12 (0–9.89) | ||||
| Anti-SARS-CoV-2-S CD8+ T-cell responses detection at 15D | Frequency of SARS-CoV-2-S CD8+ T cells at 15D | Anti-SARS-CoV-2-S CD8+ T-cell responses detection at 3M | Frequency of SARS-CoV-2-S CD8+ T cells at 3M | |||||
| Rate (%) | P-value | Median % (range) | P-value | Rate (%) | P-value | Median % (range) | P-value | |
| HD (30) | 46 | .07 | 0 (0–0.93) | .23 | 63 | .04 | 0.03 (0–6.21) | .07 |
| PD (7) | 71 | 0.30 (0–1.03) | 100 | 0.79 (0.04–1.57) | ||||
| KT (26) | 65 | 0.04 (0.0–6.05) | 71 | 0.05 (0.0–11.1) | ||||
15D, 3M, median of 15 days and 3 months after completion of the vaccination schedule; ACKD, advanced chronic kidney disease; BAU, binding antibody units; HD, haemodialysis; KT, kidney transplantation; PD, peritoneal dialysis.
Table 5.
SARS-CoV-2-RBD antibody and S-reactive T-cell responses in patients undergoing haemodialysis or peritoneal dialysis and kidney transplant recipients at different time points after full vaccination with the BNT162b2 COVID-19 vaccine
| Anti-SARS-CoV-2-RBD total antibody detection at 15D | Levels of anti-SARS-CoV-2-RBD total antibody at 15D | Anti-SARS-CoV-2-RBD total antibody detection at 3M | Levels of anti-SARS-CoV-2-RBD total antibody at 3M | |||||
|---|---|---|---|---|---|---|---|---|
| Study group (no. of participants) | Rate (%) | P-value | Median BAU/mL (range) | P-value | Rate (%) | P-value | Median BAU/mL (range) | P-value |
| HD (22) | 90 | .08 | 381 (0.90–2.500) | .13 | 95 | .92 | 119 (0.90–7.00) | .10 |
| ACKD (22) | 100 | 1075 (39–2500) | 100 | 247 (24–2.500) | ||||
| Healthy controls (12) | 70 | 517 (0.90–2.500) | 100 | 517 (5.90–2.500) | ||||
| Anti-SARS-CoV-2-S CD4+ T-cell responses detection at 15D | Frequency of SARS-CoV-2-S CD4+ T cells at 15D | Anti-SARS-CoV-2-S CD4+ T-cell responses detection at 3M | Frequency of SARS-CoV-2-S CD4+ T cells at 3M | |||||
| Rate (%) | P-value | Median % (range) | P-value | Rate (%) | P-value | Median % (range) | P-value | |
| HD (22) | 68 | .24 | 0.02 (0–4.08) | .61 | 78 | .85 | 0.22 (0–2.47) | .87 |
| ACKD (22) | 63 | 0.05 (0–1.88) | 71 | 0.03 (0–0.92) | ||||
| Healthy controls (12) | 50 | 0.01 (0–1.24) | 75 | 0.19 (0–0.73) | ||||
| Anti-SARS-CoV-2-S CD8+ T-cell responses detection at 15D | Frequency of SARS-CoV-2-S CD8+ T cells at 15D | Anti-SARS-CoV-2-S CD8+ T-cell responses detection at 3M | Frequency of SARS-CoV-2-S CD8+ T cells at 3M | |||||
| Rate (%) | P-value | Median % (range) | P-value | Rate (%) | P-value | Median % (range) | P-value | |
| HD (22) | 50 | .61 | 0.01 (0–0.35) | .21 | 55 | .21 | 0.03 (0–4.89) | .47 |
| ACKD (22) | 58 | 0.03 (0–0.73) | 64 | 0.02 (0–0.63) | ||||
| Healthy controls (12) | 60 | 0.06 (0–1.74) | 75 | 0.21 (0–14.9) | ||||
15D, 3M, median of 15 days and 3 months after completion of the vaccination schedule; ACKD, advanced chronic kidney disease; BAU, binding antibody units; HD, haemodialysis; KT, kidney transplantation; PD, peritoneal dialysis.
DISCUSSION
We examined SARS-CoV-2-S-reactive antibody and T-cell responses in CKD patients, including HD, PD, ACKD, KT and healthy controls early (15D) and at mid-term (3M) following full vaccination with different COVID-19 vaccine platforms, mainly mRNA1273 and BNT162b2. To our knowledge, this is the first study to analyse T-cell response in CKD at 3M. For that purpose we used a SARS-CoV-2-RBD total antibody assay calibrated to the first WHO SARS-CoV-2 antibody standard [36], returning quantitative results that strongly correlate with neutralizing antibody titres measured using wild-type virus neutralization assays [38, 39]. In turn, we employed a whole-blood flow cytometry assay for enumerating peripheral blood SARS-CoV-2-S-reactive CD4+ and CD8+ T cells [37]. It is important to stress that the comparison of immunological data from this study with that reported in other studies, using SARS-CoV-2-S1 or S trimeric chemiluminescent antibody assays or ELISPOT/Quantiferon® assays for assessment of T-cell responses, is not straightforward. There are notable differences in the analytical features of each data set. Also, there is a lack of side-by-side performance comparison studies carried out in the above or other population groups. In addition, when comparing the findings of the current study with those of others studies it is important to note that most patients in our cohort were SARS-CoV-2 naïve at the time of completion of the vaccine schedule. Such participants are known to frequently display less robust post-vaccination immune responses compared with their SARS-CoV-2 experienced counterparts [2]. When taking into consideration all participants irrespective of the COVID-19 vaccine platform used, the rate of detection of anti-RBD antibodies early (15D) following full vaccination was similar for HD (96%), PD (93%) and ACKD (96%) and it was even slightly higher in these groups compared with healthy controls (81%).
Our data concur with that published in other studies [3, 5, 11, 12, 14, 17, 19, 22, 23, 27, 31, 35] and indicate that most patients on dialysis (HD or PD) or with severe kidney disease not undergoing replacement therapy are capable of mounting S-reactive antibody responses within 2–4 weeks after completion of mRNA COVID-19 vaccine schedules. In contrast, a few other studies found lower rates of seroconversion (between 70%–80%) among HD patients vaccinated with mRNA vaccines compared with healthy controls [26, 28, 34]. The reasons for this discrepancy are currently unclear but may relate to differences across cohorts in several parameters, including patient age, dialysis vintage, uraemic status and immunosuppressive treatments. In this sense, it should be emphasized that no patient in our series (except KT patients) were under immunosuppressive treatments. In the current study, the overall median anti-RBD antibody levels at 15D were comparable across HD, PD, ACKD and healthy controls. Our data differ from that published in two large studies examining post-vaccination antibody responses in these population groups at a median of 4 weeks following complete vaccination which showed lower antibody levels in patients on dialysis as compared to controls [24, 29]. Differences across studies regarding demographics, the clinical characteristics of patients and the mRNA vaccine platforms employed across study groups may in part explain the discrepancy. The use of an anti-RBD assay in this study as opposed to S1-based [29] or S-trimeric-based [24] chemiluminescent assays in the above-quoted studies may have also had an impact.
Contradictory data have been published concerning the immunogenicity of mRNA COVID-19 vaccines in CKD patients. As for HD patients, SARS-CoV-2-S antibody levels measured within 2–4 weeks after vaccination were reported to be significantly greater in patients vaccinated with mRNA1273 compared with those with BNT162b2 [10–34], in line with our findings. Other studies, nevertheless, observed no substantial differences across these vaccine platforms [11, 24].
A few studies [20, 21] have assessed antibody responses persisting at mid-term (3M) following full vaccination with mRNA COVID-19 vaccines in dialysis patients. These studies have consistently shown a significant decline in anti-S1-reactive antibody levels. Our data concur with this observation and extend it to ACKD patients. Nevertheless, while antibody levels decreased in all patient groups and controls, the decline was more marked in the former compared with the latter participants, which suggests accelerated kinetics of antibody waning in CKD patients.
KT patients, most of whom were vaccinated with mRNA1273, displayed poorer qualitative (rate of detection) and quantitative (plasma levels) anti-SARS-CoV-2-S antibody responses compared to HD, PD, ACKD and controls. This result is exhaustively documented irrespective of the mRNA COVID-19 vaccine platform used [4, 7–9, 13, 15, 18, 22, 24, 25, 28–30, 32, 35] and is demonstrated at both 15D and 3M. The relatively high rate of seroconversion found in the current study (67% and 75% at 15D and 3M) likely relates to the long time period between transplantation and vaccination, during which immunosuppression had tapered.
Data in the literature regarding SARS-CoV-2-S-reactive T-cell responses in dialysis and ACKD patients are quite divergent. Results of previous studies are summarized in Table 6. When T-cell immunity assessments were performed within the first month after full vaccination with mRNA COVID-19 vaccines the rate of detectable T-cell responses (either CD8+, CD4+ or both) as determined by IGRA assays (ELISPOT, the Quantiferon® or an ‘in-house’ ELISA assay) was found to vary between 40 and 100% in HD, PD or ACKD patients [22, 26, 27, 31, 34]. In another study employing a whole-blood flow cytometry assay, 64% of HD patients had detectable CD4+ T-cell responses [23]. As for KT recipients, the prevalence of detectable T-cell responses early after full vaccination was also reported to vary widely, ranging from <10 to 100% [22, 24, 25, 27, 29, 30, 32], with marked differences depending upon the time between transplantation and vaccination [24]. In our study, the overall prevalence of vaccinated individuals displaying SARS-CoV-2-S T-cell responses at 15D was rather high (between 67 and 93%) and similar in participants across all groups. Moreover, detectable T-cell responses were documented at 3M for the majority of participants with no substantial differences noted across HD, PD, ACKD or KT patients and healthy controls, in terms of neither prevalence nor magnitude. For participants vaccinated with mRNA1273, however, those undergoing PD appeared to display a higher rate of detectable T-cell responses at 3M than did HD and KT patients. Beyond detection rates, the magnitude of T-cell responses has been consistently reported to be lower in dialysis, ACKD and KT patients relative to that of healthy controls [22, 24–27, 29, 31, 32, 34]. This was not the case in the current study for both SARS-CoV-2-S CD4+ and CD8+ T-cell responses, regardless of the COVID-19 vaccine platform used. In this respect, it must be highlighted that a large fraction of presumably non-SARS-CoV-2 experienced patients had detectable SARS-CoV-2-S-cross-reactive (presumably) T cells at baseline (pre-vaccination), likely as a result of previous infections caused by seasonal coronaviruses. Whether this may impact the rate of detection and magnitude of post-vaccination T-cell immune responses is uncertain and warrants further investigations. Unfortunately, no attempt was made to discriminate between vaccine-elicited and pre-existing cross-reactive T-cell immunity, an analysis that is far from straightforward. In this context, most of the above-quoted studies did not provide T-cell immunity data gathered prior to vaccination.
Table 6.
Similar studies published to the date
| Study | n | Type of patients | Type of vaccine | Follow-up | Outcome | Measurement method | Result |
|---|---|---|---|---|---|---|---|
| Broseta et al. [21] | 175 | HD | mRNA1273 (n: 100) BNT162b2 (n: 75) |
3 weeks | Anti-S1-RBD IgG | Siemens Healthineers Atellica IM SARS-CoV-2 IgG (sCOVG) assay | 95.4% |
| 69 | Cells expressing CD69 and intracellular (IFN-γ) | Flow cytometry | 62% | ||||
| Quiroga et al. [35] | 1746 | 1116 HD 171 PD 176 ACKD 283 KT |
mRNA1273 BNT162b2 ChAdOx1-S Ad26.COV.2 |
28 days | Anti-S1-RBD IgG | Chemiluminescence immunoassay (CLIA, Covid-19 Spike Quantitative Virclia® IgG Monotest, Vircell SL, Spain) | HD 98% PD 99% ACKD 100% KT 79% |
| Sanders et al. [29] | 800 | 162 ACKD 159 Dialysis 288 KT 191 HC |
mRNA-1273 | 28 days | Anti-S1-RBD IgG | Fluorescence bead-based multiplex immunoassay | ACKD 100% Dialysis 99.4% KT 56.9% HC 100% |
| 29 KT | Neutralizing antibodies | PRNT | 79.3% | ||||
| 39 ACKD 42 Dialysis 68 KT 46 HC |
T-cell response | Interferon-gamma release assay (IGRA) | ACKD 71.8% Dialysis 64.3% KT 16.2% HC 84.8% |
||||
| Sattler et al. [30] | 104 | 39 HC 39 KT 26 HD |
BNT162b2 | 1 week | SARS-CoV-2 spike S1 domain-specific IgG and IgA | ELISA (EUROINMMUN) SARS-CoV-2 neutralization test (sVNT, GenScript) |
HC 100% HD 84.6% KT 2.6% |
| Spike-specific CD154+ CD137+ Th cells (CD4) | FACS Fortessa X20 (BD) flow cytometer | 92%–100% | |||||
| Activation-dependent co-expression of CD137 and IFN-γ+ (CD8) | HC 45% HD 30% KT <10% |
||||||
| Bertrand et al. [22] | 55 | 45 KT 55 HD |
BNT162b2 | 4 weeks | Anti-spike protein antibodies | ARCHITECT IgG II Quant test (Abbott) | KT 17.8% HD 88.9% |
| SARS-CoV-2-reactive IFN γ -producing T cells | Colorimetric assay (UCytech, Utrecht, The Netherlands) Automated ELISPOT reader (AID, Strassberg, Germany) | KT 57.8% HD 100% |
|||||
| Strengert et al. [31] | 81 | HD (81) HC (34) |
BNT162b2 | 3 weeks | Anti-SARS-CoV-2-RBD Ig G and IgA | Measured by MULTICOV-AB, and further analysed with anti-SARS-CoV-2-QuantiVac-ELISA IgG (EUROINMMUN) ACE2-RBD competition assay |
HC 100% HD 95.08% |
| SARS-CoV-2-specific T-cell responses | SARS-CoV-2 Interferon Gamma Release Assay (Cat #ET-2606- 3003, Euroimmun, Germany) | HC 97.1% HD 71.6% |
|||||
| Van Praet et al. [34] | 618 | HD (543) HC (75) |
mRNA1273 BNT162b2 |
4–5 weeks 8–9 weeks |
Anti-SARS-CoV-2 spike antibodies | ARCHITECT IgG II Quant test (Abbott) | HD 31.8% HC 53.6% |
| SARS-CoV-2-reactive IFN γ -producing T cells | QuantiFERON SARS-CoV-2 test (Qiagen) | HD 46.9% HC 64.4% |
HD, haemodialysis; HC, healthy controls, KT, kidney transplant recipients; RBD, receptor-binding domain; PRNT, plaque reduction neutralization test; ACKD, non-dialysis advanced chronic kidney disease.
The main limitation of our study was the relatively small sample size which most notably precluded a robust assessment of potential differences in immunogenicity between COVID-19 vaccine platforms across all study groups as well as the investigation of demographic and clinical factors associated with impaired antibody responses in KT patients. In addition, dialysis and ACKD patients undergoing immunosuppressive therapy were excluded. Moreover, neither virus neutralization tests nor immune assays exploring functional capabilities of SARS-CoV-2-S T cells other than IFN-γ production were performed.
In conclusion, most SARS-CoV-2-naïve HD, PD and ACKD patients are seemingly capable of developing SARS-CoV-2-S antibody responses comparable to those of healthy controls after full vaccination with different COVID-19 vaccine platforms, in contrast to KT recipients. Nevertheless, the kinetics of antibody waning at 3M, while documented in participants of all study groups, appeared to be faster in HD, PD and ACKD patients compared with controls. Regarding SARS-CoV-2 T-cell immunity, overall, no differences either in the rate of detection or the magnitude of measured responses were noticed across study groups at 15D and 3M. Despite this, the accelerated decline in antibody levels observed in CKD patients at 3M and the suboptimal antibody responses documented in KT recipients lend support to the implementation of a booster dose in the former and perhaps alternative vaccination strategies for the latter.
Supplementary Material
ACKNOWLEDGEMENTS
We thank Claudia Forquet (Clinical Trials Units of Nephrology Service) and Cristela Moncho Ferra (Nephrology Department Nursery supervisor, Clinic University Hospital) for the collaboration in the logistics of carrying out the study and the Valencian Society of Nephrology for the Isabel Burches grant for this project. We thank the Ethics Commitee of Hospital Clinico Universitario de Valencia for project valoration and approval (25 February 2021, number 366).
Contributor Information
Nayara Panizo, Nephrology Service, Hospital Clínico Universitario de Valencia, INCLIVA Health Research Institutue, Valencia, Spain.
Eliseo Albert, Microbiology Service, Hospital Clínico Universitario de Valencia, INCLIVA Health Research Institute, Valencia, Spain.
Elena Giménez-Civera, Nephrology Service, Hospital Clínico Universitario de Valencia, INCLIVA Health Research Institutue, Valencia, Spain.
Maria Jesús Puchades, Nephrology Service, Hospital Clínico Universitario de Valencia, INCLIVA Health Research Institutue, Valencia, Spain.
Luis D'Marco, Universidad Cardenal Herrera-CEU, CEU Universities, Valencia, Spain.
Lorena Gandía-Salmerón, Nephrology Service, Hospital Clínico Universitario de Valencia, INCLIVA Health Research Institutue, Valencia, Spain.
Estela Giménez, Microbiology Service, Hospital Clínico Universitario de Valencia, INCLIVA Health Research Institute, Valencia, Spain.
Ignacio Torre, Microbiology Service, Hospital Clínico Universitario de Valencia, INCLIVA Health Research Institute, Valencia, Spain.
Asunción Sancho, Nephrology Service, Transplant Unit, Hospital Universitario Dr. Peset, Valencia, Spain.
Eva Gavela, Nephrology Service, Transplant Unit, Hospital Universitario Dr. Peset, Valencia, Spain.
Miguel Gonzalez-Rico, Nephrology Service, Hospital Clínico Universitario de Valencia, INCLIVA Health Research Institutue, Valencia, Spain.
Marco Montomoli, Nephrology Service, Hospital Clínico Universitario de Valencia, INCLIVA Health Research Institutue, Valencia, Spain.
Carmen Maria Perez-Baylach, B BraumAvitum Hemodialysis Centres Valnefron Valencia and Massamagrell, Valencia, Spain.
Begoña Bonilla, B BraumAvitum Hemodialysis Centres Valnefron Valencia and Massamagrell, Valencia, Spain.
Camila Solano, Nephrology Service, Hospital Clínico Universitario de Valencia, INCLIVA Health Research Institutue, Valencia, Spain.
Mª Fernanda Alvarado, Nephrology Service, Hospital Clínico Universitario de Valencia, INCLIVA Health Research Institutue, Valencia, Spain.
Isidro Torregrosa, Nephrology Service, Hospital Clínico Universitario de Valencia, INCLIVA Health Research Institutue, Valencia, Spain.
María Jesús Alcaraz, Microbiology Service, Hospital Clínico Universitario de Valencia, INCLIVA Health Research Institute, Valencia, Spain.
José Luis Górriz, Nephrology Service, Hospital Clínico Universitario de Valencia, INCLIVA Health Research Institutue, Valencia, Spain; Department of Medicine, School of Medicine, University of Valencia, Valencia, Spain.
David Navarro, Microbiology Service, Hospital Clínico Universitario de Valencia, INCLIVA Health Research Institute, Valencia, Spain; Department of Microbiology, School of Medicine, University of Valencia, Valencia, Spain.
FUNDING
I.T. (Río Hortega Contract; CM20/00090), E.A. (Juan Rodés Contract; JR20/00011) and E.G. (Juan Rodés Contract, JR18/00053) hold contracts funded by the Health Institute Carlos III (co-financed by the European Regional Development Fund, ERDF/FEDER).
CONFLICT OF INTEREST STATEMENT
The authors declare no conflicts of interest.
DATA AVAILABILITY STATEMENT
The data underlying this article will be shared on reasonable request to the corresponding author.
REFERENCES
- 1. Williamson EJ, Walker AJ, Bhaskaran Ket al. Factors associated with COVID-19-related death using OpenSAFELY. Nature 2020; 584: 430–436 [DOI] [PMC free article] [PubMed] [Google Scholar]
- 2. Hou YC, Lu KC, Kuo KL. The efficacy of COVID-19 vaccines in chronic kidney disease and kidney transplantation patients: a narrative review. Vaccines (Basel) 2021; 9: 885. [DOI] [PMC free article] [PubMed] [Google Scholar]
- 3. Bachelet T, Bourdenx JP, Martinez Cet al. Humoral response after SARS-CoV-2 mRNA vaccines in dialysis patients: Integrating anti-SARS-CoV-2 Spike-Protein-RBD antibody monitoring to manage dialysis centers in pandemic times. PLoS One 2021; 16: e0257646. [DOI] [PMC free article] [PubMed] [Google Scholar]
- 4. Benotmane I, Gautier-Vargas G, Cognard Net al. Low immunization rates among kidney transplant recipients who received 2 doses of the mRNA-1273 SARS-CoV-2 vaccine. Kidney Int 2021; 99: 1498–1500 [DOI] [PMC free article] [PubMed] [Google Scholar]
- 5. Billany RE, Selvaskandan H, Adenwalla SFet al. Seroprevalence of antibody to S1 spike protein following vaccination against COVID-19 in patients receiving hemodialysis: A call to arms. Kidney Int 2021; 99: 1492–1494 [DOI] [PMC free article] [PubMed] [Google Scholar]
- 6. Carr EJ, Wu M, Harvey Ret al. Neutralising antibodies after COVID-19 vaccination in UK haemodialysis patients. Lancet 2021; 398: 1038–1041 [DOI] [PMC free article] [PubMed] [Google Scholar]
- 7. Danthu C, Hantz S, Dahlem Aet al. Humoral response after SARS-CoV-2 mRNA vaccination in a cohort of hemodialysis patients and kidney transplant recipients. J Am Soc Nephrol 2021; 32: 2153–2158 [DOI] [PMC free article] [PubMed] [Google Scholar]
- 8. Firket L, Descy J, Seidel Let al. Serological response to mRNA SARS-CoV-2 BNT162b2 vaccine in kidney transplant recipients depends on prior exposure to SARS-CoV-2. Am J Transplant 2021; 21: 3806–3807 [DOI] [PMC free article] [PubMed] [Google Scholar]
- 9. Hod T, Ben-David A, Olmer Let al. Humoral response of renal transplant recipients to the BNT162b2 SARS-CoV-2 mRNA vaccine using both RBD IgG and neutralizing antibodies. Transplantation 2021; 105: e234–e243 [DOI] [PMC free article] [PubMed] [Google Scholar]
- 10. Kaiser RA, Haller MC, Apfalter Pet al. Comparison of BNT162b2 (Pfizer-BioNtech) and mRNA-1273 (Moderna) SARS-CoV-2 mRNA vaccine immunogenicity in dialysis patients. Kidney Int 2021; 100: 697–698 [DOI] [PMC free article] [PubMed] [Google Scholar]
- 11. Lacson E Jr, Argyropoulos CP, Manley HJet al. Immunogenicity of SARS-CoV-2 vaccine in dialysis. J Am Soc Nephrol 2021; 32: 2735–2742 [DOI] [PMC free article] [PubMed] [Google Scholar]
- 12. Longlune N, Nogier MB, Miedougé Met al. High immunogenicity of a messenger RNA-based vaccine against SARS-CoV-2 in chronic dialysis patients. Nephrol Dial Transplant 2021; 36: 1704–1709 [DOI] [PMC free article] [PubMed] [Google Scholar]
- 13. Prendecki M, Thomson T, Clarke CLet al. Immunological responses to SARS-CoV-2 vaccines in kidney transplant recipients. Lancet 2021; 398: 1482–1484 [DOI] [PMC free article] [PubMed] [Google Scholar]
- 14. Rodríguez-Espinosa D, Broseta JJ, Maduell Fet al. Humoral response of the mRNA-1273 SARS-CoV-2 vaccine in peritoneal dialysis patients. Kidney Int 2021; 100: 476–477 [DOI] [PMC free article] [PubMed] [Google Scholar]
- 15. Rozen-Zvi B, Yahav D, Agur Tet al. Antibody response to SARS-CoV-2 mRNA vaccine among kidney transplant recipients: a prospective cohort study. Clin Microbiol Infect 2021; 27: 1173.e1–1173.e4 [DOI] [PMC free article] [PubMed] [Google Scholar]
- 16. Santos-Araújo C, Veiga PM, Santos MJet al. Time-dependent evolution of IgG antibody levels after first and second dose of mRNA-based SARS-CoV-2 vaccination in hemodialysis patients: a multicenter study. Nephrol Dial Transplant 2021; 37: 375–381 [DOI] [PMC free article] [PubMed] [Google Scholar]
- 17. Yanay NB, Freiman S, Shapira Met al. Experience with SARS-CoV-2 BNT162b2 mRNA vaccine in dialysis patients. Kidney Int 2021; 99: 1496–1498 [DOI] [PMC free article] [PubMed] [Google Scholar]
- 18. Yi SG, Knight RJ, Graviss EAet al. Kidney transplant recipients rarely show an early antibody response following the first COVID-19 vaccine administration. Transplantation 2021; 105: e72–e73 [DOI] [PubMed] [Google Scholar]
- 19. Zitt E, Davidovic T, Schimpf Jet al. The safety and immunogenicity of the mRNA-BNT162b2 SARS-CoV-2 vaccine in hemodialysis patients. Front Immunol 2021; 12: 704773. [DOI] [PMC free article] [PubMed] [Google Scholar]
- 20. Speer C, Schaier M, Nusshag Cet al. Longitudinal humoral responses after COVID-19 vaccination in peritoneal and hemodialysis patients over twelve weeks. Vaccines (Basel) 2021; 9: 1130. [DOI] [PMC free article] [PubMed] [Google Scholar]
- 21. Broseta JJ, Rodríguez-Espinosa D, Bedini JLet al. Antibody maintenance 3 months after complete mRNA COVID-19 vaccination in hemodialysis. Nephrol Dial Transplant 2021; 36: 2340–2341 [DOI] [PMC free article] [PubMed] [Google Scholar]
- 22. Bertrand D, Hamzaoui M, Lemée Vet al. Antibody and T cell response to SARS-CoV-2 messenger RNA BNT162b2 vaccine in kidney transplant recipients and hemodialysis patients. J Am Soc Nephrol 2021; 32: 2147–2152 [DOI] [PMC free article] [PubMed] [Google Scholar]
- 23. Broseta JJ, Rodríguez-Espinosa D, Rodríguez Net al. Humoral and cellular responses to mRNA-1273 and BNT162b2 SARS-CoV-2 vaccines administered to hemodialysis patients. Am J Kidney Dis 2021; 78: 571–581 [DOI] [PMC free article] [PubMed] [Google Scholar]
- 24. Crespo M, Barrilado-Jackson A, Padilla Eet al. Negative immune responses to two-dose mRNA COVID-19 vaccines in renal allograft recipients assessed with simple antibody and interferon gamma release assay cellular monitoring. Am J Transplant 2021; 22: 786–800 [DOI] [PMC free article] [PubMed] [Google Scholar]
- 25. Cucchiari D, Egri N, Bodro Met al. Cellular and humoral response after MRNA-1273 SARS-CoV-2 vaccine in kidney transplant recipients. Am J Transplant 2021; 21: 2727–2739 [DOI] [PMC free article] [PubMed] [Google Scholar]
- 26. Espi M, Charmetant X, Barba Tet al. The ROMANOV study found impaired humoral and cellular immune responses to SARS-CoV-2 mRNA vaccine in virus-unexposed patients receiving maintenance hemodialysis. Kidney Int 2021; 100: 928–936 [DOI] [PMC free article] [PubMed] [Google Scholar]
- 27. Melin J, Svensson MK, Albinsson Bet al. Humoral and cellular response to SARS-CoV-2 BNT162b2 mRNA vaccine in hemodialysis patients. BMC Immunol 2021; 22: 70. [DOI] [PMC free article] [PubMed] [Google Scholar]
- 28. Rincon-Arevalo H, Choi M, Stefanski ALet al. Impaired humoral immunity to SARS-CoV-2 BNT162b2 vaccine in kidney transplant recipients and dialysis patients. Sci Immunol 2021; 6: eabj1031. [DOI] [PubMed] [Google Scholar]
- 29. Sanders JF, Bemelman FJ, Messchendorp ALet al. The RECOVAC Immune-response Study: The Immunogenicity, Tolerability, and Safety of COVID-19 Vaccination in Patients With Chronic Kidney Disease, on Dialysis, or Living With a Kidney Transplant. Transplantation 2021; 106: 821–834 [DOI] [PMC free article] [PubMed] [Google Scholar]
- 30. Sattler A, Schrezenmeier E, Weber UAet al. Impaired humoral and cellular immunity after SARS-CoV-2 BNT162b2 (tozinameran) prime-boost vaccination in kidney transplant recipients. J Clin Invest 2021; 131: e150175. [DOI] [PMC free article] [PubMed] [Google Scholar]
- 31. Strengert M, Becker M, Ramos GMet al. Cellular and humoral immunogenicity of a SARS-CoV-2 mRNA vaccine in patients on haemodialysis. E Bio Medicine 2021; 70: 103524. [DOI] [PMC free article] [PubMed] [Google Scholar]
- 32. Stumpf J, Siepmann T, Lindner Tet al. Humoral and cellular immunity to SARS-CoV-2 vaccination in renal transplant versus dialysis patients: A prospective, multicenter observational study using mRNA-1273 or BNT162b2 mRNA vaccine. Lancet Reg Health Eur 2021; 9: 100178. [DOI] [PMC free article] [PubMed] [Google Scholar]
- 33. Thieme CJ, Blazquez-Navarro A, Safi Let al. Impaired humoral but substantial cellular immune response to variants of concern B1.1.7 and B.1.351 in hemodialysis patients after vaccination with BNT162b2. J Am Soc Nephrol 2021; 32: 2725–2727 [DOI] [PMC free article] [PubMed] [Google Scholar]
- 34. Van Praet J, Reynders M, De Bacquer Det al. Predictors and dynamics of the humoral and cellular immune response to SARS-CoV-2 mRNA vaccines in hemodialysis patients: a multicenter observational study. J Am Soc Nephrol 2021; 32: 3208–3220 [DOI] [PMC free article] [PubMed] [Google Scholar]
- 35. Quiroga B, Soler MJ, Ortiz Aet al. Safety and immediate humoral response of COVID-19 vaccines in chronic kidney disease patients: the SENCOVAC study. Nephrol Dial Transplant 2021; gfab313. [DOI] [PMC free article] [PubMed] [Google Scholar]
- 36. Mattiuzzo G, Bentley EM, Hassall M. Establishment of the WHO International Standard and Reference Panel for anti-SARS-CoV-2 antibody. Lancet Microbe 2022; 3: e235–e240. [DOI] [PMC free article] [PubMed] [Google Scholar]
- 37. Albert E, Burgos JS, Peiró Set al. Immunological response against SARS-CoV-2 following full-dose administration of Comirnaty COVID-19 vaccine in nursing home residents. Clin Microbiol Infect 2021; 28: 279–284 [DOI] [PMC free article] [PubMed] [Google Scholar]
- 38. Higgins V, Fabros A, Kulasingam V. Quantitative measurement of anti-SARS-CoV-2 antibodies: analytical and clinical evaluation. J Clin Microbiol 2021; 59: e03149–20 [DOI] [PMC free article] [PubMed] [Google Scholar]
- 39. Poljak M, OštrbenkValenčak A, Štamol Tet al. Head-to-head comparison of two rapid high-throughput automated electrochemiluminescence immunoassays targeting total antibodies to the SARS-CoV-2 nucleoprotein and spike protein receptor binding domain. J Clin Virol 2021; 137: 104784. [DOI] [PMC free article] [PubMed] [Google Scholar]
Associated Data
This section collects any data citations, data availability statements, or supplementary materials included in this article.
Supplementary Materials
Data Availability Statement
The data underlying this article will be shared on reasonable request to the corresponding author.