Abstract
Understanding blood glucose levels in our body can be a key part in identifying and diagnosing prediabetes. Herein, nickel oxide (NiO) decorated molybdenum disulfide (MoS2) nanosheets have been synthesized via a hydrothermal process to develop a non-enzymatic sensor for the detection of glucose. The surface morphology of the NiO/MoS2 nanocomposite was comprehensively investigated by field-emission scanning electron microscopy (FE-SEM), high-resolution transmission electron microscopy (HR-TEM), powder X-ray diffraction (PXRD), X-ray photoelectron spectroscopy (XPS) and Brunauer–Emmett–Teller (BET) analysis. The electro-catalytic activity of the as-prepared NiO/MoS2 nanocomposite towards glucose oxidation was investigated by cyclic voltammetry, electrochemical impedance spectroscopy (EIS) and amperometry in 0.1 M NaOH. The NiO/MoS2 nanocomposite-based sensor showed outstanding electrocatalytic activity for the direct electro-oxidation of glucose due to it having more catalytic active sites, good conductivity, excellent electron transport and high specific surface area. Meanwhile, the NiO/MoS2 modified glassy carbon electrode (GCE) showed a linear range of glucose detection from 0.01 to 10 mM by amperometry at 0.55 V. The effect of other common interferent molecules on the electrode response was also tested using alanine, l-cysteine, fructose, hydrogen peroxide, lactose, uric acid, dopamine and ascorbic acid. These molecules did not interfere in the detection of glucose. Moreover, this NiO/MoS2/GCE sensor offered rapid response (2 s) and a wide linear range with a detection limit of 1.62 μM for glucose. The reproducibility, repeatability and stability of the sensor were also evaluated. The real application of the sensor was tested in a blood serum sample in the absence and presence of spiked glucose and its recovery values (96.1 to 99.8%) indicated that this method can be successfully applied to detect glucose in real samples.
This study reported that NiO/MoS2 based nanocomposite can be used as an electrocatalytic material to detect glucose with high selectivity in a blood serum.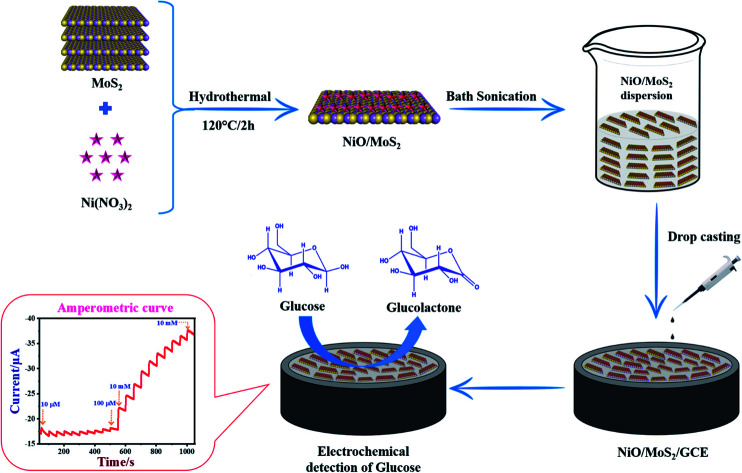
1. Introduction
Glucose is one of the important metabolic intermediate components that can be used to generate energy in the human body. The normal glucose concentration in human blood is in the range of 4.4–6.6 mM. If the glucose levels exceed above or below the normal range, this may lead to metabolic disorders (e.g., diabetes). Glucose levels below 2.8 mM cause hypoglycemia.1,2 The number of adults affected by type 2 diabetes is expected to increase to 511 million in 2030.3 Specifically, as stated by WHO, India had about 69.2 million people with diabetes by 2015, which is also expected to rise over the next 12 years.4 So, it is critically important to accurately detect glucose concentration in biological samples (on an everyday basis) such as blood, urine, etc. Generally, conventional methods such as fluorometry,5 colorimetric,6 spectro-photometric,7 optical,8 acoustic9 and fluorescence10 methods have been used to detect glucose. Meanwhile, electrochemical sensors have been reported, with high selectivity and sensitivity to detect glucose.11,12 Specifically, electrochemical biosensors based on glucose dehydrogenase and glucose oxidase (GOD) have been extensively studied due to their high selectivity and sensitivity towards glucose in medical research.13,14 However, there are some critical disadvantages associated with the preparation of enzymatic biosensors. For example, instability of enzymes (GOD) on the sensor surface due to environmental factors (pH and temperature), which can deteriorate the reproducibility and reliability of sensors.15 In addition, GOD and glucose dehydrogenase enzymes are relatively expensive. To overcome these issues, non-enzymatic glucose sensors have been developed for practical applications.16–18 To develop a non-enzymatic glucose sensor, a large number of transition metal (Pt, Ni, Au, Co, Ru, Cu, In), transition metal oxide (NiO, WO3, RuO2)19,20 and metal alloys (Au–Cu, Au–Ni, Pt–Pd, Ni–Cr, etc.) have been used as electrocatalysts to selectively oxidize glucose to glucolactone.21,22 These catalytic materials showed high electroactivity toward carbohydrates and glucose.23–25 Among them, nickel oxide (NiO) is one of the promising electrocatalysts to use to prepare a non-enzymatic glucose sensor,26,27 due to its stable redox activity (Ni2+/Ni3+), nontoxicity and low cost.28 Because of its unique properties, various NiO nanostructures have been synthesized, such as nanoflowers,29 nanorods,30 nanofibers,31 nanoparticles,32 nanoplates,33 nanoflakes,34 nanosheets35 and hollow porous materials,36 for various applications.
On the other hand, layered two dimensional (2D) transition metal dichalcogenides (TMDs) such as molybdenum disulphide (MoS2),37–40 tungsten disulphide (WS2) and graphene41 have been used to fabricate electrochemical sensors.42 As an important candidate, MoS2 consisting of a S–Mo–S bonded trilayered structure43,44 (with a band gap in the range of 1.2 to 1.8 eV) has shown high catalytic activity, surface area and electrical conductivity.21,45 It was found that MoS2 shows multi-fold enhancement in the sensitivity of electrochemical sensor devices compared to graphene.46 The spacing between the neighbouring layers of MoS2 (0.62 nm)47 is larger than that in graphene (0.35 nm),48 which helps to improve the performance of the electrochemical sensors49 due to the exposed edges similar to in functionalized graphene sheets.50 In order to further improve the catalytic activity of MoS2, various nanoparticles, metal oxides and polymers have been incorporated in layered materials.51,52 For example, MoS2-based nanocomposites such as Cu/MoS2 53 (linear range of detection from 0 to 4 mM), MoS2–TiO2/Au,54 MoS2-graphene,55 CuS/MoS2,56 MoS2–Au/Pt/GCE57 (from 10 μM to 3 mM), MoS2–g-C3N4,58 NiO/multi-walled CNT,59 CuNi/C,60 Pt/Ni/MoS2 61 and nickel/copper/carbon nanotubes62 have been reported to detect glucose. These methods have some disadvantages, such as the use of expensive noble metal catalysts (Au, Pt), bimetallic catalysts and carbon nanotubes, which are relatively expensive. In order to decrease the cost of sensors with improved selectivity and sensitivity, new and simple sensor systems are still in demand for future glucose sensor applications.
In the present work, for the first time, hydrothermally NiO nanoparticles were synthesized on MoS2 nanosheets. The as-prepared, NiO decorated MoS2 nanocomposite was comprehensively characterized by UV-Vis, XRD, HR-TEM, FE-SEM, energy dispersive X-ray spectroscopy (EDX), XPS and BET analysis. Moreover, the electrochemical properties of the NiO/MoS2 hybrid film coated GCE were investigated by cyclic voltammetry (CV), electrochemical impedance spectroscopy (EIS) and amperometric analysis. This NiO/MoS2/GCE sensor showed high electrocatalytic activity towards glucose from 0.01 to 10 mM. The limit of detection (LOD) was found to be 1.62 μM. Herein, we have attempted to use MoS2 layers as a support material to form a composite with NiO. This study revealed that because of a higher loading of NiO, enhanced catalytic activity was observed. It was also used to detect glucose in blood serum with high selectivity. We believe our study could help others to use this nanocomposite to make commercially valuable glucose sensors.
2. Experimental
2.1. Chemicals and reagents
Sodium molybdate dihydrate (Na2MoO4·2H2O), thiourea (H2NCSNH2) and nickel nitrate hexahydrate Ni(NO3)2·6H2O were purchased from Sisco Research Laboratories Pvt. Ltd. (SRL), Maharashtra, India. Sodium hydroxide (NaOH) was purchased from Thermo Fisher Scientific Company (India) and glucose (C6H12O6) was purchased from Loba Chemie Pvt Ltd, Maharashtra, India. All of the purchased chemicals were of analytical grade. The distilled water was obtained from Milli-Q (18.2 MΩ cm @ 25 ± 2 °C) water system. The blood serum was obtained from the SRM Medical College Hospital and Research Centre, Kattankulathur, Tamil Nadu. This experiment was approved by the ethics committee at SRM-IST (no. 002/HYC/IEC/2018).
2.2. Apparatus and equipment
All electrochemical measurements were performed on an electrochemical workstation (Model: CHI-760E), Austin, TX, USA. Electrochemical measurements were carried out using a standard three-electrode system with a modified glassy carbon electrode (NiO/MoS2/GCE) as a working electrode, Ag/AgCl (3 M KCl) as the reference electrode and platinum wire as the counter electrode. The UV-Vis was performed using a Carry 5000, Agilent Spectrophotometer. Powder X-ray diffraction (PXRD) spectra were recorded using a PXRD diffractometer (X'pert PXRD system, Malvern Panalytical India) with CuKα radiation (λ = 0.15406 nm). The particle size and morphology of the nanocomposite were determined by FE-SEM with an attached energy-dispersive X-ray (EDX) spectrometer (for elemental analysis) (FEI Quanta FEG 200) at an accelerating voltage of 20 kV. HR-TEM was carried out using a JEM-2100 Plus, Jeol, operating at 200 kV. The XPS was carried out on a PHI VersaProbe III Scanning XPS Microprobe, (Physical Electronics, USA). BET data was obtained using a Model BELSORP Max; Make-Microtrac BEL, Japan.
2.3. Synthesis of MoS2
MoS2 was synthesized using a hydrothermal method. Briefly, 2.2 g of Na2MoO4·2H2O and 2.0 g of H2NCSNH2 were first dissolved in 80 mL of distilled water and vigorously stirred for 30 min at room temperature. Then, the mixture was transferred to a 100 mL autoclave made of Teflon-lined stainless steel and maintained at 200 °C for 18 h in a hot air oven. Finally, the black precipitate (MoS2) was collected by filtration, followed by washing with water and absolute ethanol several times. The obtained MoS2 precipitate was dried in a hot air oven at 70 °C for 12 h.21,63
2.4. Synthesis of the NiO/MoS2 nanocomposite
0.06 g of MoS2 powder was dispersed in water (20 mL) and 0.03 g of Ni (NO3)2·6H2O was also dissolved in 20 mL of water separately. Then, both solutions were stirred continuously for 30 min using a magnetic stirrer. After that, the Ni (NO3)2·6H2O solution was added dropwise into the MoS2 dispersion under continuous stirring for 10 min. The pH of the mixed solution was adjusted to 11 by adding 25% NH3 under constant stirring at room temperature. The mixture was then transferred to a 100 mL Teflon-lined stainless steel autoclave and was then heated to and maintained at 120 °C for 2 h. After that, the autoclave temperature was allowed to cool down and the solution was collected and centrifuged at 10 500 rpm for 15 min. Finally, the black precipitate (NiO/MoS2) was collected by filtration and washed with water and absolute ethanol several times. Later, it was dried at 70 °C for 12 h (Scheme 1).
Scheme 1. Schematic representation of the synthesis of the NiO/MoS2 nanocomposite via a hydrothermal process.
2.5. Preparation of a NiO/MoS2/GCE-based sensor
The GCE was polished on a micro cloth using an alumina slurry with different particle sizes (of 1, 0.3, and 0.05 μm) and then washed with distilled water, followed by ethanol for few min to obtain a mirror-like surface. After that, the NiO/MoS2 nanocomposite (5 mg) powder was dispersed in 2 mL of water by bath sonication for 30 min. The as-obtained NiO/MoS2 dispersion was then allowed to stand at room temperature for 15 min to settle out bulk particles. Later, the supernatant solution was collected for further use. Finally, 10 μL of the NiO/MoS2 supernatant solution was drop cast onto the surface of the GCE and dried at 50 °C in a hot air oven to obtain a NiO/MoS2 modified GCE. For comparison, MoS2/GCE and NiO/GCE were also prepared under the same conditions.
3. Results and discussion
3.1. UV-Vis, PXRD, FE-SEM and HR-TEM analysis
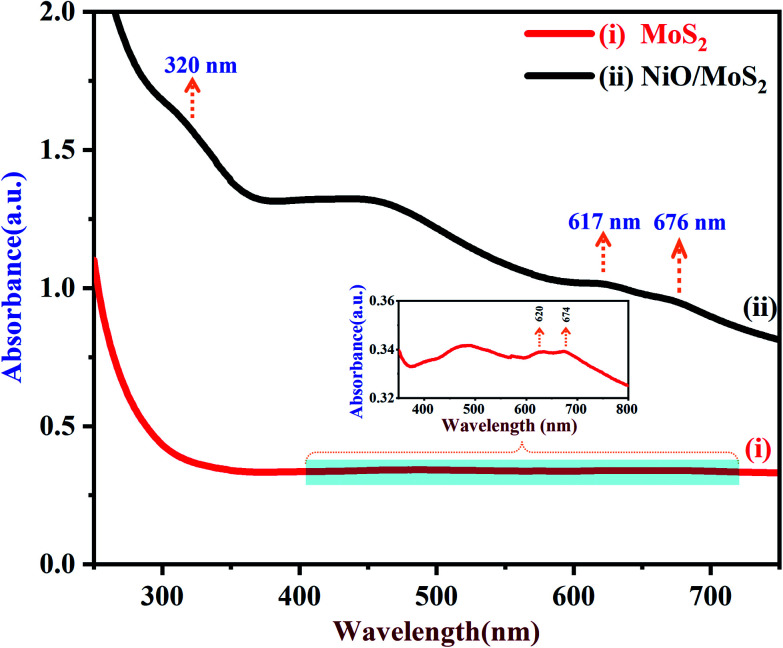
UV-Vis spectra of the MoS2 and NiO/MoS2 nanocomposite dispersions are shown in Fig. 1. It can be seen that the strong absorption peaks of MoS2 appeared at around 620 and 674 nm, which is in agreement with the MoS2 nanosheets reported elsewhere (red curve i).64 The UV-Vis spectrum of the NiO/MoS2 nanocomposite also shows three absorption bands at around 320, 617 and 676 nm. The main absorption peak observed at 320 nm indicates the presence of NiO nanoparticles in the nanocomposite, as shown in Fig. 1 (black curve ii).65 It is worth noting that one of the MoS2 absorption peaks is shifted to a lower wavelength (620 to 617 nm) and another band is shifted to a higher wavelength (674 to 676 nm). This may be due to the interaction between the MoS2 nanosheets and NiO nanoparticles present in the nanocomposite.
Fig. 1. UV-Vis spectra of (i) MoS2 and (ii) NiO/MoS2 nanocomposite dispersions (the inset shows an enlarged portion of the spectrum of the MoS2).
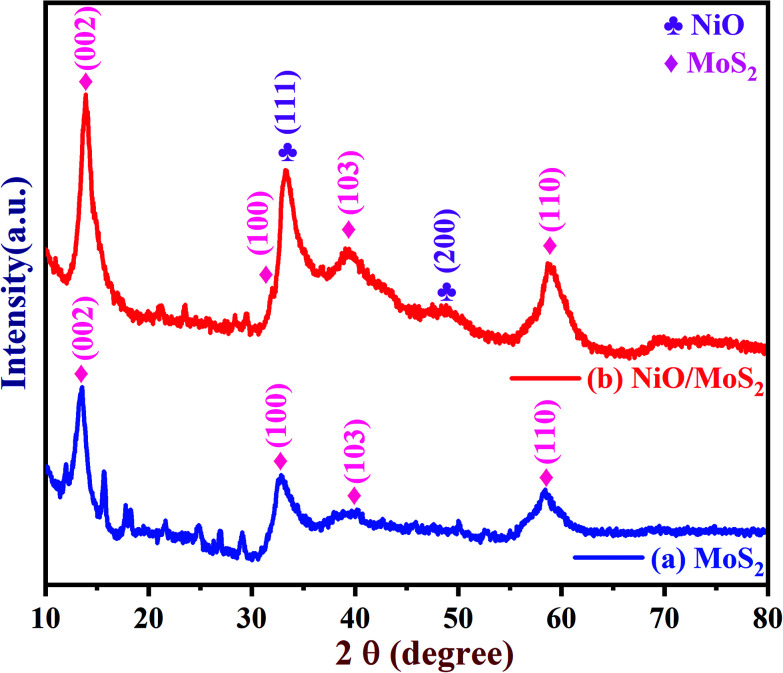
The crystal structure of the MoS2 and NiO/MoS2 nanocomposite were also studied using PXRD (Fig. 2). The PXRD spectrum of MoS2 shows peaks at 14.15, 33.43, 39.95 and 58.63° (curve a). However, for the NiO/MoS2 nanocomposite, major peaks were observed at 2θ = 13.80, 32.23, 33.11 (NiO), 39.26, 48.25 (NiO) and 58.78°. The PXRD peaks at 13.80, 32.23, 39.26 and 58.78° can be attributed to the planes of the hexagonal 2H-MoS2 phase (JCPDS no. 73-1508) (Fig. 2, curve b),47 which confirms the formation of MoS2. In addition, two peaks observed at 2θ angles of 48.25° (200) and 33.11° (111) belong to NiO planes corresponding to the cubic structure (JCPDS card no #47-1049).66 It is clear that the NiO nanoparticles were successfully decorated on the surface of MoS2.
Fig. 2. PXRD spectra of the (a) MoS2 powder and (b) NiO/MoS2 nanocomposite.
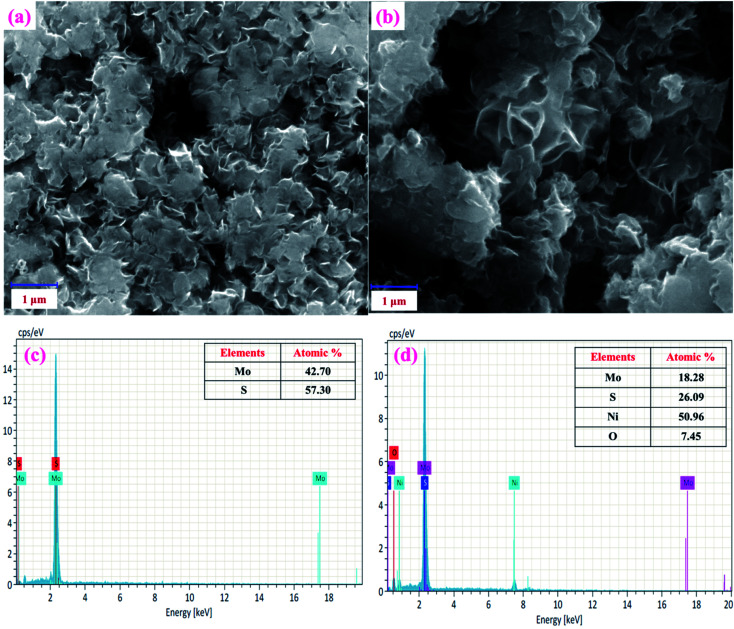
Next, the surface morphologies of MoS2 and NiO/MoS2 nanocomposite were studied by FE-SEM. Fig. 3a shows the FE-SEM image of MoS2 layers illustrating the nanosheet-like structure of MoS2.47Fig. 3b shows the surface morphology of the NiO/MoS2 nanocomposite where NiO nanoparticles are incorporated into the nanocomposite, as it confirmed by EDX (Fig. 3c and d). Elemental and chemical composition analysis of MoS2 confirmed the presence of Mo and S without any other impurities (Fig. 3c). Similarly, Fig. 3d exhibits the EDX spectrum of the NiO/MoS2 nanocomposite, which confirms the presence of Mo, S, Ni and O. The high magnification FE-SEM images of the MoS2 and NiO/MoS2 nanocomposite are also shown in (Fig. S1a and b†). This FE-SEM and EDX analysis proved the successful modification of MoS2 layers with NiO.
Fig. 3. FE-SEM images of the (a) MoS2 and (b) NiO/MoS2 nanocomposite. EDX spectra of the (c) MoS2 and (d) NiO/MoS2 nanocomposite.
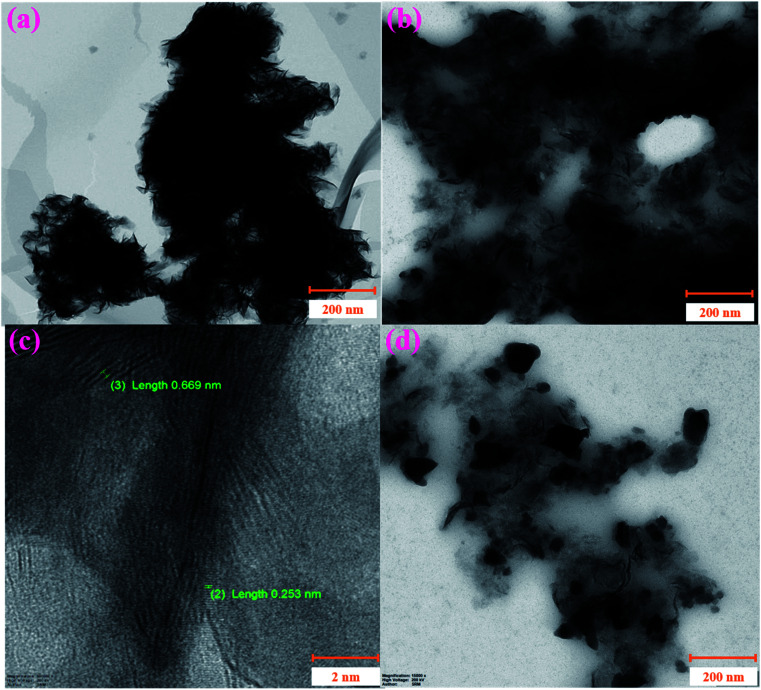
Furthermore, the nanocomposite was analysed by HR-TEM. Fig. 4a shows agglomerated MoS2 nanosheets in the bulk materials. Interestingly, the decoration of NiO particles on MoS2 sheets helps to form a uniform nanocomposite film without aggregation, as shown in Fig. 4b. So, it was confirmed that NiO nanoparticles assist in the prevention of the agglomeration of the MoS2 nanosheets. Next, the lattice fringes of the NiO/MoS2 nanocomposite were measured, where the lattice spaces of both NiO nanoparticles (lattice space = 0.253 nm)67 and MoS2 sheets (lattice space = ∼0.669 nm)47 were observed (Fig. 4c). Furthermore, the size distribution of NiO nanoparticles was analysed by FE-SEM. The particle sizes of NiO varied from ∼38 to 72 nm on the MoS2 nanosheets (Fig. 4d and S2†).
Fig. 4. HR-TEM images of the (a) MoS2 and (b and d) NiO/MoS2 nanocomposite. (c) High-resolution HR-TEM image showing the lattice spaces of NiO/MoS2.
3.2. XPS analysis
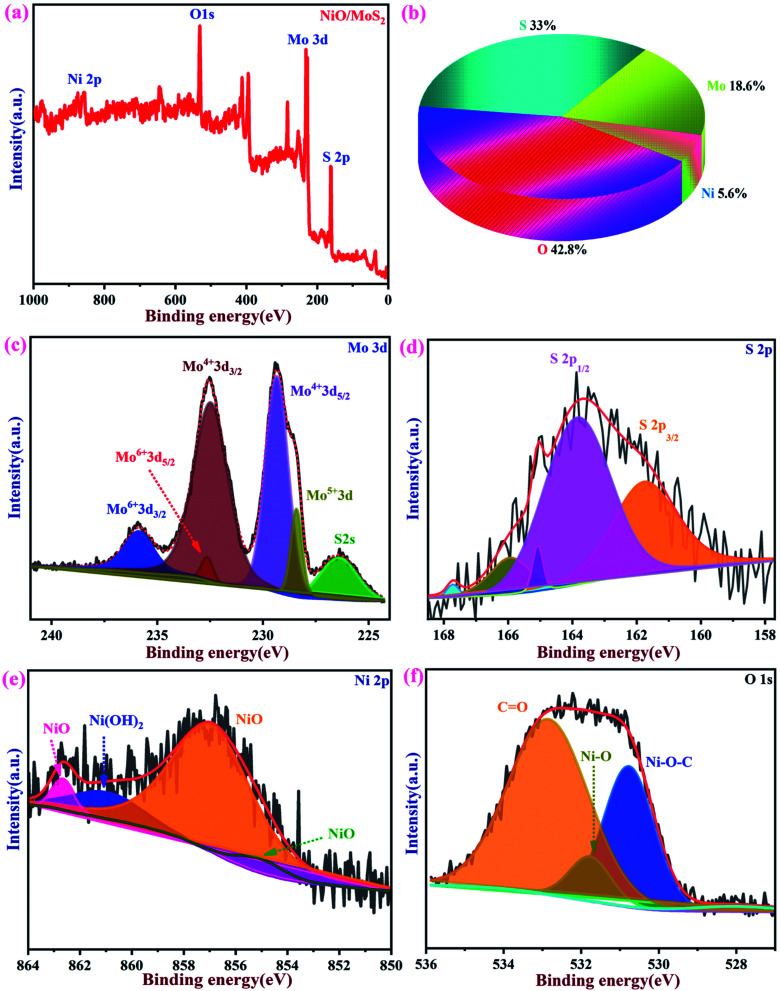
The chemical composition and binding energies of NiO/MoS2 were investigated by XPS. Fig. 5a and b show the survey spectrum and atomic percentages of the NiO/MoS2 nanocomposite. The major elements such as Mo, S, Ni, and O are present (Fig. 5b). Fig. 5c shows the main peaks of Mo 3d at binding energies of 226.3, 228.4, 229.3, 232.4, 232.6 and 235.8 eV, respectively. Two characteristic peaks for 3d5/2 and 3d3/2 are located at 229.3 and 232.4 eV, indicating the dominance of Mo4+. The contribution from the peaks centered at 228.4 eV is assigned to Mo5+ and the doublets at 232.4 and 235.8 eV correspond to the higher oxidation states of 3d5/2 and 3d3/2 in Mo6+.68,69 As shown in Fig. 5d, the high-resolution spectrum of S 2p in NiO/MoS2 can be fitted into five peaks, with two major peaks at 161.9 and 164.1 eV, which are assigned to S 2p3/2 and S 2p1/2 of the MoS2 phase. In the Ni 2p spectrum, the three peaks located at 855.2, 857.1 and 861.2 eV, corresponding to NiO, Ni2O3 and Ni(OH)2, respectively70 (Fig. 5e). Similarly, the O 1s spectrum can be deconvoluted into three peaks with binding energies of 530.5, 531.8 and 532.9 eV, which may be attributed to Ni–O–C, NiO and O C bonds, as reported previously (Fig. 5f).69,71
Fig. 5. XPS spectra of NiO/MoS2. (a) Survey spectrum and (b) pie chart showing the atomic percentages of elements present in NiO/MoS2. (c) High-resolution spectra of Mo 3d, (d) S 2p, (e) Ni 2p and (f) O 1s.
To ascertain the surface areas of the NiO/MoS2 nanocomposite and MoS2, BET analysis was carried out. Fig. S3† shows the N2 adsorption–desorption isotherms and the corresponding pore-size width distribution for MoS2 (Fig. S3a and b†) and the composite (Fig. S3c and d†). The specific surface area and mean pore diameters of both MoS2 and NiO/MoS2 composite were determined (Fig. S3b and d†) as 3.57 and 15.17 m2 g−1, respectively. The NiO/MoS2 composite exhibits a typical type (IV) isotherm pattern.72 The average pore sizes of the MoS2 and NiO/MoS2 nanocomposite are in the range of 5 to 25 nm and 8 to 30 nm, respectively.73 It is clear that larger pore width diameters were observed for the NiO/MoS2 composite, which suggests the presence of more catalytically active surfaces for enhanced electrocatalytic activity.
3.3. Electrochemical properties of the NiO/MoS2 nanocomposite and electro-oxidation of glucose
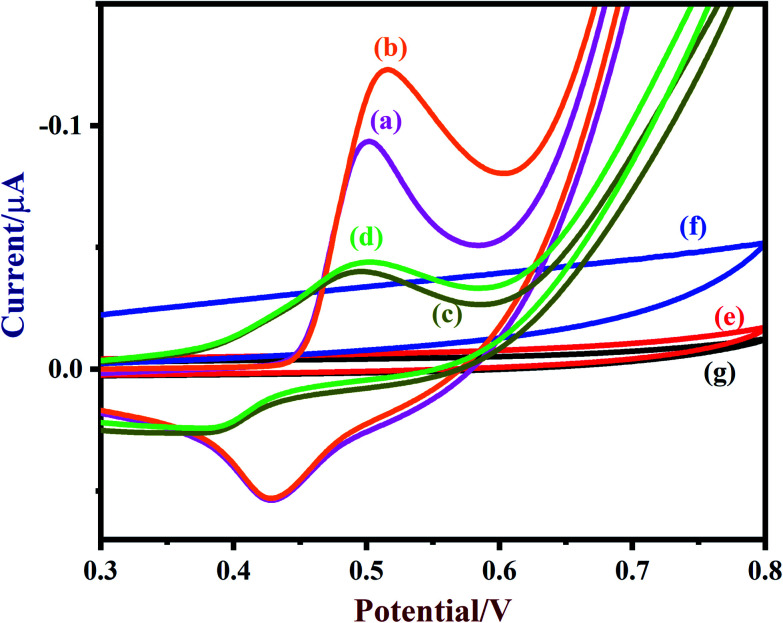
A freshly prepared NiO/MoS2/GCE was used to record cyclic voltammograms (CVs) in 0.1 M NaOH (Fig. 6, curve a), showing a well-defined redox peak for the NiO decorated on MoS2. The formal potential (E0′ = Epa + Epc/2) of NiO/MoS2/GCE was found to be +0.46 V, which is closer to the reported value for NiO in 0.1 M NaOH.74 The peak to peak separation (ΔEp = Epa − Epc) was also calculated as 70 mV, which indicates a highly reversible electron transfer reaction. Next, CVs were also recorded using the above modified electrodes in the presence of 50 μM of glucose in 0.1 M NaOH solution. As can be seen, the anodic peak current of NiO/MoS2/GCE was increased at 0.55 V, with a small decrease in the cathodic current at 0.43 V (Fig. 6, curve b). This result indicates that the NiO/MoS2 nanocomposite shows enhanced glucose oxidation at the surface of the sensor. The electrochemical glucose oxidation reaction may follow an irreversible process, as given in eqn (1)–(3)74–76 (Scheme 2). The electrode reaction of Ni(ii) to Ni(iii) is a quasi-reversible process that is favored in solution containing negatively charged hydroxide ions. After the electrocatalytic oxidation of glucose, the oxidized form of the nanocomposite was reduced back to its initial form, as given in eqn (2).74
| NiO + OH− → NiO(OH) + e− | 1 |
| Ni(OH)2 + OH− ⇆ NiO(OH) + H2O + e− | 2 |
| NiO(OH) + glucose → Ni(OH)2 + glucolactone | 3 |
Fig. 6. CVs of (a) NiO/MoS2/GCE (blank), (b) NiO/MoS2/GCE (with 50 μM of glucose), (c) NiO/GCE (blank), (d) NiO/GCE (with 50 μM of glucose), (e) MoS2/GCE (blank), (f) MoS2/GCE (with 50 μM of glucose) and (g) bare-GCE (with 50 μM of glucose) were recorded in 0.1 M NaOH. Scan rate = 50 mV s−1.
Scheme 2. Electrocatalytic oxidation mechanism of glucose at the NiO/MoS2/GCE.
As a control experiment, NiO/GCE (without MoS2) was prepared and used to record CVs in 0.1 M NaOH (Fig. 6, curve c). As shown, NiO/GCE exhibited an ill-defined redox peak at E0′ of 0.44 V with low anodic and cathodic peak currents (Ipa = −0.0439 μA and Ipc = 0.0238 μA) compared to those of NiO/MoS2/GCE, which proves that there is enhanced electrochemical activity for the nanocomposite due to the presence of MoS2 (Fig. 6, curve a). Similarly, the electro-oxidation of glucose (50 μM) on NiO/GCE was also studied under the same conditions. It was found that NiO/GCE shows a very small oxidation peak for 50 μM glucose at 0.5 V, with a lower peak current (Fig. 6, curve d). This experiment further suggested that the observed enhanced electrocatalytic activity of the nanocomposite (NiO/MoS2/GCE) is due to the synergistic effect between NiO and MoS2. In the same manner, CVs were recorded using MoS2/GCE in the absence and presence of 50 μM of glucose. It was found that MoS2/GCE did not show any well-defined oxidation peak for glucose except for changes in the background current (Fig. 6, curves e and f). As expected, there were no reduction or oxidation peaks observed at the bare GCE for glucose (curve g). The above results confirm that MoS2 plays an important role in the enhancement of catalytic activity for glucose.
Furthermore, EIS was used to measure the changes in electrode resistance after modification with various materials. Fig. S4† shows the Nyquist plots of the modified electrodes obtained, featuring a semicircle and linear part at higher and lower frequencies, which correspond to the limited and diffusion-limited electron transfer processes.77 Nyquist plots typically illustrate the modified electrode charge transfer resistance (Rct), which can be determined from the diameter of the semicircles. It was found that the NiO/MoS2/GCE (87.18 Ω) has a low Rct compared to NiO/GCE (109.42 Ω), MoS2/GCE (113.07 Ω), and bare/GCE (119.42 Ω) (Fig. S4†). These EIS results corroborated our hypothesis that the conductivity of the nanocomposite was increased due to existing favorable interactions between NiO/MoS2 and the electrolyte.
The effect of pH on the glucose oxidation was also studied. It was found that NiO/MoS2/GCE shows a high catalytic current for glucose (50 μM) at pH 13 (0.1 M NaOH) compared to other studied electrolytes (pH 11, 9, 7.4, 5 and 3) (Fig. S5†). Furthermore, the oxidation potential of glucose was also shifted to a higher positive voltage (+0.86 V) at pH 7.4 and the catalytic current decreased (Fig. S5†). So, we selected 0.1 M NaOH as a supporting electrolyte to detect glucose.78 It is worth noting that the oxidation potential and catalytic currents of glucose (50 μM) were also shifted according to the pH of the electrolyte (Fig. S6a and b†). A lower oxidation potential with a high catalytic current was observed at pH 13, which was found to be the optimum pH.
3.4. Effect of scan rate and linear range of glucose detection
The effect of scan rate on the glucose oxidation current was investigated using NiO/MoS2/GCE in 0.1 M NaOH containing 50 μM of glucose from 20 to 200 mV s−1. Fig. S7a† shows that both the anodic and cathodic peak currents increased with scan rate, indicating that glucose oxidation on NiO/MoS2 may follow a surface-controlled oxidation process.79,80 A good linear relationship between scan rate and anodic/cathodic (Ipa/Ipc) peak currents were obtained with correlation coefficient (R2) values of 0.9911 and 0.9832 (Fig. S7b†).
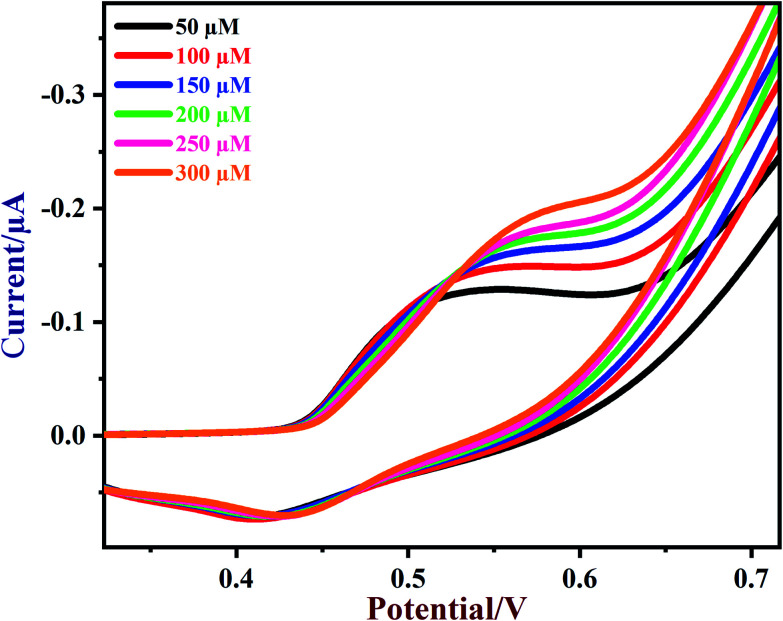
Next, various concentrations of glucose were tested on the NiO/MoS2/GCE sensor. CVs of NiO/MoS2/GCE were recorded with subsequent additions of glucose from 50 to 300 μM (Fig. 7). The oxidation peak currents of the sensor were increased linearly with glucose concentration. When the concentrations of glucose increased from 50 to 300 μM, the oxidation potential of the sensor was slightly shifted to a more positive value, which may be due to a diffusion controlled mass transfer process, so a high voltage has to be applied to carry out glucose oxidation81 (Fig. 7).
Fig. 7. CVs of NiO/MoS2/GCE in the presence of different concentrations of glucose from 50 to 300 μM in 0.1 M NaOH. Scan rate = 50 mV s−1.
3.5. Optimization of catalyst loading on GCE
Various amounts of NiO/MoS2 were placed on the GCE surface to find out the optimum loading of the material for effective glucose oxidation. For this purpose, GCE was coated with different volumes of NiO/MoS2 dispersion (stock = 2.5 mg mL−1), such as 10 μL (25 μg), 20 μL (50 μg), 30 μL (75 μg) and 40 μL (100 μg), as shown in Fig. S8a.† The GCE coated with 10 μL (25 μg) of NiO/MoS2 showed a higher catalytic current for 50 μM of glucose. But, further increasing the amount of catalyst did not improve the catalytic current of glucose (Fig. S8b†). Moreover, the oxidation potential of glucose also shifted to a more positive voltage, maybe due to thick film formation, which is not favorable for the interaction between glucose and NiO/MoS2/GCE (Fig. S8c†). From this study, the optimal catalyst loading was found to be 10 μL (25 μg) of NiO/MoS2 on the GCE surface.
3.6. Amperometric detection of glucose
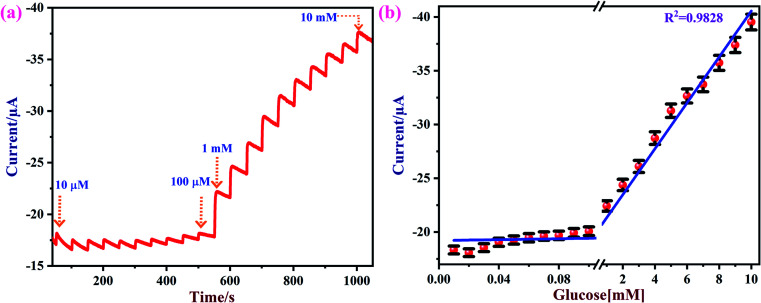
Amperometry can be used to detect an analyte of interest at a particular applied potential with high sensitivity. Fig. 8a shows amperometric current responses of the NiO/MoS2/GCE sensor with successive additions of glucose from 0.01 to 10 mM at an applied voltage of 0.55 V in 10 mL of 0.1 M NaOH. During this experiment, electrolyte was constantly stirred using a magnetic pellet at 1200 rpm. Each addition of glucose was made into the electrochemical cell in time intervals of 50 s. Upon consecutive additions of glucose to the electrochemical cell, a gradual increase in the steady-state current was observed.77 This shows that the NiO/MoS2/GCE sensor has excellent catalytic activity and sensitivity towards glucose.
Fig. 8. (a) Amperometric curve recorded using the NiO/MoS2/GCE with successive additions of glucose from 0.01 to 10 mM at an applied potential of 0.55 V. The solution was stirred at a rate of 1200 rpm. (b) The obtained linear calibration plot of glucose concentrations vs. oxidation currents with error bars (n = 3).
Fig. 8b shows the obtained calibration plot for glucose using the NiO/MoS2/GCE-based sensor. This amperometric detection was repeated three times using a same modified electrode. From the obtained amperometric curve the mean and standard deviation were calculated, as given in the error bars in Fig. 8b. The calibration graph shows a good linear relationship between the concentrations of the glucose and oxidation currents from 0.01 to 10 mM with a linear correlation coefficient of (R2) 0.9828.
The limit of detection (LOD) for glucose was estimated using the following formula: LOD = 3 × standard deviation (SD)/slope value (S).82 The SD of the blank current (without glucose) was estimated as 1.1547 × 10⁻⁸ A and the slope value was estimated as 0.214 × 10⁻⁷ A μM−1. The calculated LOD was 1.62 μM, which is comparable to some of the reported methods (Table 1). Furthermore, the linear range, LOD, and applied potential used for glucose oxidation are compared with other reported methods in Table 1. It seems that a wide linear range of detection is possible using the proposed method. The observed improvement in the analytical performance of the NiO/MoS2/GCE-based sensor may be due to the favorable electron transfer between the glucose and electrode surface. In addition, the excellent electrical conductivity and higher surface area of the nanocomposite were also found to be responsible for the improved electrocatalytic activity.
Linear range of detection, LOD, applied potential and electrolyte used in the present method compared with other reported glucose sensorsa.
| Working electrode | Applied potential (V) | Electrolyte | Linear range (mM) | Detection limit (μM) | Reference |
|---|---|---|---|---|---|
| Ni(OH)2/CILE | 0.55 | 0.5 M NaOH | 0.05–23 | 6 | 87 |
| NiO-GR/GCE | 0.35 | 0.2 M NaOH | 0.02–11.2 | 5 | 88 |
| Ti/TiO2 NTA/Ni | 0.50 | 0.1 M NaOH | 0.1–1.7 | 4 | 89 |
| Ni-NPs/TiO2NTs | 0.6 | 0.1 M NaOH | 0.004–4.8 | 2 | 90 |
| Nanostructured α-Ni(OH)2/FTO | 0.4 | 1 M KOH | 0.01–0.75 | 2.5 | 91 |
| Cu2O/MoS2/GCE | 0.7 | 0.1 M NaOH | 0.01–4 | 1 | 78 |
| Cu/GNs | 0.6 | 0.1 M NaOH | 0–4.5 | 0.5 | 92 |
| NiO/MoS2/GCE | 0.55 | 0.1 M NaOH | 0.01–10 | 1.62 | This work |
CILE = carbon ionic liquid electrode. Ti/TiO2 NTA/Ni = Ti/TiO2 nanotube array/Ni composite electrode. Ni-NPs/TiO2 NTs = Ni nanoparticle loaded TiO2 nanotube arrays. GNs = graphene nanosheets. NiO-GR/GCE = nickel oxide and graphene nanocomposite modified carbon electrode. FTO = fluorine-doped tin oxide electrode.
3.7. Interference, reproducibility and repeatability studies of NiO/MoS2/GCE
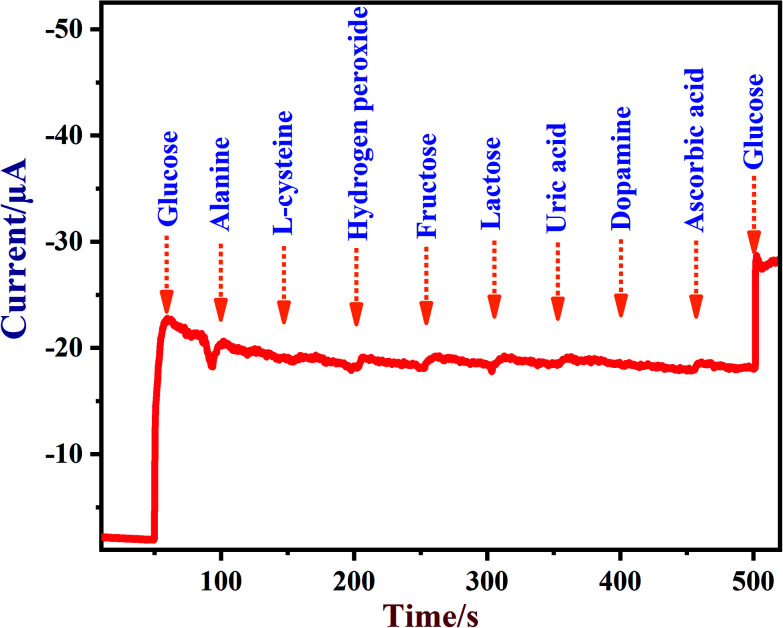
A newly prepared NiO/MoS2/GCE sensor was tested with other interferent biomolecules such as alanine, l-cysteine, hydrogen peroxide, fructose, lactose, uric acid, dopamine and ascorbic acid, which are commonly present alongside glucose in biological systems. Some of these important electroactive biomolecules may affect the direct electrochemical oxidation of glucose due to their overlapping oxidation potentials.83,84 It was reported that the concentrations of these interferent molecules are about 30 times lower than the glucose levels in human blood (4.4–6.6 mM).78 As shown in Fig. 9, after the addition of each interferent, the NiO/MoS2/GCE sensor did not show any significant current response at 0.55 V. Interestingly, the NiO/MoS2/GCE sensor responded well to both additions of glucose (2 mM) into the same solution. This experiment suggested that NiO/MoS2/GCE can be used for the selective detection of glucose without any significant interference. Furthermore, in order to find out the concentrations of interferent compounds which will start to affect the sensor response, we carried out amperometry in the presence of 2 mM glucose followed by additions of interferent compounds (0.01, 0.1, 0.5 and 1 mM) in the same electrolyte at a constant potential of 0.55 V (Fig. S9†). It was found that alanine and dopamine only start to show small interferent currents when used above 0.1 and 0.5 mM, respectively (Fig. S9†). However, l-cysteine, hydrogen peroxide, fructose, lactose, ascorbic acid and uric acid did not interfere up to the studied concentrations (Fig. S9†).
Fig. 9. Amperometric response recorded using a NiO/MoS2/GCE in 0.1 M NaOH in the presence of glucose (2 mM), alanine (1 mM), l-cysteine (1 mM), hydrogen peroxide (1 mM), fructose (1 mM), lactose (1 mM), uric acid (1 mM), dopamine (1 mM), ascorbic acid (1 mM) and glucose (2 mM). The rotation rate was 1200 rpm and the applied potential used was 0.55 V.
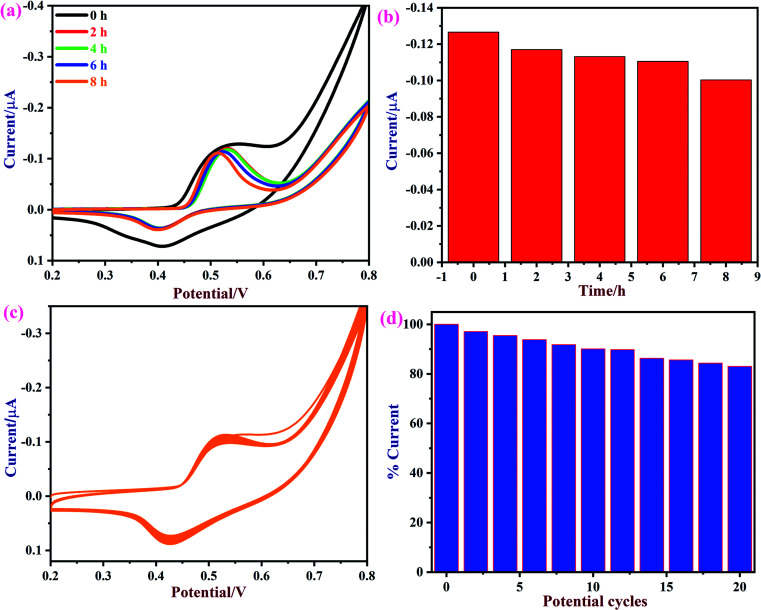
Next, the repeatability and stability of the NiO/MoS2/GCE sensor were also tested by cyclic voltammetry in the presence of 50 μM of glucose in 0.1 M NaOH. The CVs were recorded using a NiO/MoS2/GCE sensor in freshly prepared 0.1 M NaOH containing 50 μM glucose in the time interval of 0 to 8 h (Fig. 10a and b). The relative standard deviation (RSD) was estimated as 3.02 for the five measurements. The obtained bar graph shows that NiO/MoS2/GCE had good repeatability even after 8 h of repeated use (note: glucose oxidation CVs were recorded in time intervals of 0, 2, 4, 6 and 8 h, not continuously). The stability of the NiO/MoS2/GCE was also tested by recording repetitive CVs up to 20 cycles (Fig. 10c and d). As can be seen, the redox peak currents of NiO/MoS2/GCE did not decrease significantly with the number of cycles. This indicates the strong attachment of the NiO/MoS2 on the surface of GCE.
Fig. 10. (a) CVs of a NiO/MoS2/GCE were recorded in 0.1 M NaOH containing 50 μM of glucose at different time intervals of 0, 2, 4, 6, and 8 h and (b) the corresponding bar diagram displays the changes in current vs. time. (c) CVs were recorded continuously for 20 cycles using a NiO/MoS2/GCE in 0.1 M NaOH at a scan rate of 50 mV s−1. (d) The bar graph shows the changes in the current percentages according to the number of potential cycles.
Furthermore, the NiO/MoS2/GCE sensor was used to record CVs in 0.1 M NaOH (fresh solution) after glucose oxidation was carried out (Fig. S10†). It was found that the used NiO/MoS2/GCE sensor again showed a reversible redox peak of NiO with almost the same peak currents as compared to before glucose oxidation (Fig. S10,† curves a–c) even after repeated use. This study further confirmed that there was no electrode fouling, so this sensor can be used for multiple measurements.
3.8. Real sample analysis
To test the real-world application of the sensor, NiO/MoS2/GCE was used to detect glucose in blood serum by amperometry. The amperometry response of the NiO/MoS2/GCE was recorded with successive stepwise additions of (10, 20 and 30 μM) glucose in 10 mL of 0.1 M NaOH containing 10 μL of blood serum. The total glucose concentration in the blood serum was found to be 4.37 ± 0.07 mM using the HbA1c technique (conducted by a private medical lab).85 Furthermore, three different glucose concentrations (0.01, 0.02 and 0.03 mM) were spiked into the NaOH/serum solution. The spiked glucose concentrations were estimated by amperometry and their recovery values were calculated.86 We selected this spike-and-recovery method to test the sensor applicability and efficiency in recovery analysis. This real sample procedure was repeated about three times to calculate the standard deviation (see Table 2). As shown in Table 2, NiO/MoS2/GCE sensor shows good reproducibility and recovery rate (96.1–99.8%) for the detection of glucose in real sample analysis.
Electrochemical detection of various concentrations of glucose (spiked) in blood serum samples using NiO/MoS2/GCE as a non-enzymatic sensor.
| S. no. | Samples | Glucose concentration (mM) | Glucose added (mM) | Glucose founda (mM) | RSD | Recovery% |
|---|---|---|---|---|---|---|
| 1 | Human blood serum | 4.4 | — | 4.37 ± 0.07 | 1.50 | — |
| 2 | Human blood serum spiked with glucose | 4.4 | 0.010 | 4.41 ± 0.017 | 3.19 | 97.8 |
| 3 | Human blood serum spiked with glucose | 4.4 | 0.020 | 4.42 ± 0.021 | 3.40 | 96.1 |
| 4 | Human blood serum spiked with glucose | 4.4 | 0.030 | 4.43 ± 0.014 | 1.87 | 99.8 |
Mean value ± standard deviation for n = 3.
4. Conclusions
In summary, a NiO/MoS2 nanocomposite was synthesized successfully using a hydrothermal method. The as-prepared NiO/MoS2 nanocomposite was characterized and confirmed using various methods. UV-Vis confirmed the interaction between the MoS2 nanosheets and NiO according to the shift in their absorbance wavelengths. FE-SEM, PXRD, EDX, XPS and HR-TEM revealed that the NiO nanoparticles were incorporated within the MoS2 nanosheets. The pore width and surface area of MoS2 and NiO/MoS2 nanocomposite were determined by BET. Due to the synergistic effect between NiO and MoS2, this new glucose sensor exhibits a wide linear range of detection from 0.01 to 10 mM glucose with an LOD of 1.62 μM. Furthermore, the stability, reproducibility and repeatability of the sensor were tested and it was found that this NiO/MoS2/GCE sensor is highly stable and can be used for multiple measurements. Real sample analysis was also carried out in blood serum with successive additions of glucose. The recovery analysis indicated that our proposed sensor can be applied for the detection of glucose in blood serum. We envisage that this NiO/MoS2 nanocomposite-based sensor can be used for the selective detection of glucose in biological and medical samples.
Conflicts of interest
There are no conflicts to declare.
Supplementary Material
Acknowledgments
G. J. thanks the SRM IST for a Junior Research Fellowship.
Electronic supplementary information (ESI) available. See DOI: 10.1039/c9ra09318d
References
- Kalra S. Mukherjee J. J. Venkataraman S. Bantwal G. Shaikh S. Saboo B. Das A. K. Ramachandran A. Indian J. Endocrinol. Metab. 2013;17:819. doi: 10.4103/2230-8210.117219. [DOI] [PMC free article] [PubMed] [Google Scholar]
- Vaurs C. Brun J.-F. Bertrand M. Burcelin R. Du Rieu M. C. Anduze Y. Hanaire H. Ritz P. Metabolism. 2016;65:18–26. doi: 10.1016/j.metabol.2015.10.020. [DOI] [PubMed] [Google Scholar]
- Wild S. Roglic G. Green A. Sicree R. King H. Diabetes Care. 2004;27:1047–1053. doi: 10.2337/diacare.27.5.1047. [DOI] [PubMed] [Google Scholar]
- Whiting D. R. Guariguata L. Weil C. Shaw J. Diabetes Res. Clin. Pract. 2011;94:311–321. doi: 10.1016/j.diabres.2011.10.029. [DOI] [PubMed] [Google Scholar]
- Shoji A. Takahashi Y. Osato S. Sugawara M. J. Pharm. Biomed. Anal. 2019;163:1–8. doi: 10.1016/j.jpba.2018.09.028. [DOI] [PubMed] [Google Scholar]
- Kabasakalian P. Kalliney S. Westcott A. Clin. Chem. 1974;20:606–607. [PubMed] [Google Scholar]
- Gamian A. Boratyński J. Zal M. A. Roy R. Arch. Immunol. Ther. Exp. 1996;44:249–254. [PubMed] [Google Scholar]
- Steiner M.-S. Duerkop A. Wolfbeis O. S. Chem. Soc. Rev. 2011;40:4805–4839. doi: 10.1039/C1CS15063D. [DOI] [PubMed] [Google Scholar]
- Luo J. Luo P. Xie M. Du K. Zhao B. Pan F. Fan P. Zeng F. Zhang D. Zheng Z. Biosens. Bioelectron. 2013;49:512–518. doi: 10.1016/j.bios.2013.05.021. [DOI] [PubMed] [Google Scholar]
- Chen L. Hwang E. Zhang J. Sensors. 2018;18:1440. doi: 10.3390/s18051440. [DOI] [PMC free article] [PubMed] [Google Scholar]
- Kim J. Campbell A. S. Wang J. Talanta. 2018;177:163–170. doi: 10.1016/j.talanta.2017.08.077. [DOI] [PubMed] [Google Scholar]
- Balla P. Sinha A. Wu L. Lu X. Tan D. Chen J. Talanta. 2019;203:112–121. doi: 10.1016/j.talanta.2019.05.056. [DOI] [PubMed] [Google Scholar]
- Wang J. Chem. Rev. 2008;108:814–825. doi: 10.1021/cr068123a. [DOI] [PubMed] [Google Scholar]
- Zhao S. Liu Z. Chen P. Sun J. Shen X. J. Electroanal. Chem. 2019;845:106–110. doi: 10.1016/j.jelechem.2019.05.050. [DOI] [Google Scholar]
- Kumar T. V. Sundramoorthy A. K. Anal. Chim. Acta. 2019;1074:131–141. doi: 10.1016/j.aca.2019.05.011. [DOI] [PubMed] [Google Scholar]
- Park S. Boo H. Chung T. D. Anal. Chim. Acta. 2006;556:46–57. doi: 10.1016/j.aca.2005.05.080. [DOI] [PubMed] [Google Scholar]
- Gao F. Zhou F. Yao Y. Zhang Y. Du L. Geng D. Wang P. J. Electroanal. Chem. 2017;803:165–172. doi: 10.1016/j.jelechem.2017.09.036. [DOI] [Google Scholar]
- Li X. Ren K. Zhang M. Sang W. Sun D. Hu T. Ni Z. Sens. Actuators, B. 2019;293:122–128. doi: 10.1016/j.snb.2019.04.137. [DOI] [Google Scholar]
- Matsumoto F. Harada M. Koura N. Uesugi S. Electrochem. Commun. 2003;5:42–46. doi: 10.1016/S1388-2481(02)00529-5. [DOI] [Google Scholar]
- Ueda T. Mitchell R. Kitamura F. Nakamoto A. J. Chromatogr. A. 1992;592:229–237. doi: 10.1016/0021-9673(92)85089-C. [DOI] [Google Scholar]
- Huang K.-J. Wang L. Liu Y.-J. Liu Y.-M. Wang H.-B. Gan T. Wang L.-L. Int. J. Hydrogen Energy. 2013;38:14027–14034. doi: 10.1016/j.ijhydene.2013.08.112. [DOI] [Google Scholar]
- Si P. Huang Y. Wang T. Ma J. RSC Adv. 2013;3:3487–3502. doi: 10.1039/C2RA22360K. [DOI] [Google Scholar]
- Barrera C. Zhukov I. Villagra E. Bedioui F. Páez M. A. Costamagna J. Zagal J. H. J. Electroanal. Chem. 2006;589:212–218. doi: 10.1016/j.jelechem.2006.02.009. [DOI] [Google Scholar]
- Ojani R. Raoof J.-B. Salmany-Afagh P. J. Electroanal. Chem. 2004;571:1–8. doi: 10.1016/j.jelechem.2004.03.032. [DOI] [Google Scholar]
- Quintino M. d. S. M. Winnischofer H. Nakamura M. Araki K. Toma H. E. Angnes L. Anal. Chim. Acta. 2005;539:215–222. doi: 10.1016/j.aca.2005.02.057. [DOI] [Google Scholar]
- Wu M.-S. Ji R.-Y. Zheng Y.-R. Electrochim. Acta. 2014;144:194–199. doi: 10.1016/j.electacta.2014.08.098. [DOI] [Google Scholar]
- Yoon J. Lee E. Lee D. Oh T.-S. Yoon Y. S. Kim D.-J. J. Electrochem. Soc. 2017;164:B558–B560. doi: 10.1149/2.1341712jes. [DOI] [Google Scholar]
- Pal N. Banerjee S. Bhaumik A. J. Colloid Interface Sci. 2018;516:121–127. doi: 10.1016/j.jcis.2018.01.027. [DOI] [PubMed] [Google Scholar]
- Zhang H. Chen W.-G. Li Y.-Q. Jin L.-F. Cui F. Song Z.-H. Front. Chem. 2018;6:472. doi: 10.3389/fchem.2018.00472. [DOI] [PMC free article] [PubMed] [Google Scholar]
- Wen Z. Bin M. LIN L.-y. XIE J.-y. Trans. Nonferrous Met. Soc. China. 2012;22:s100–s104. doi: 10.1016/S1003-6326(12)61691-4. [DOI] [Google Scholar]
- Kolathodi M. S. Palei M. Natarajan T. S. J. Mater. Chem. A. 2015;3:7513–7522. doi: 10.1039/C4TA07075E. [DOI] [Google Scholar]
- Barrientos L. Rodriguez-Llamazares S. Merchani J. Jara P. Yutronic N. Lavayen V. J. Chil. Chem. Soc. 2009;54:391–393. [Google Scholar]
- Qiu Y. Li X. Bai M. Wang H. Xue D. Wang W. Cheng J. New J. Chem. 2017;41:2124–2130. doi: 10.1039/C6NJ03688K. [DOI] [Google Scholar]
- Khairy M. El-Safty S. A. RSC Adv. 2013;3:23801–23809. doi: 10.1039/C3RA44465A. [DOI] [Google Scholar]
- Zhu Y. Cao C. Tao S. Chu W. Wu Z. Li Y. Sci. Rep. 2014;4:5787. doi: 10.1038/srep05787. [DOI] [PMC free article] [PubMed] [Google Scholar]
- Sun W. Rui X. Zhu J. Yu L. Zhang Y. Xu Z. Madhavi S. Yan Q. J. Power Sources. 2015;274:755–761. doi: 10.1016/j.jpowsour.2014.10.105. [DOI] [Google Scholar]
- Li M. Wang D. Li J. Pan Z. Ma H. Jiang Y. Tian Z. RSC Adv. 2016;6:71534–71542. doi: 10.1039/C6RA16084K. [DOI] [Google Scholar]
- Sha R. Vishnu N. Badhulika S. Sens. Actuators, B. 2019;279:53–60. doi: 10.1016/j.snb.2018.09.106. [DOI] [Google Scholar]
- Sinha A. Huang Y. Zhao H. Talanta. 2019;204:455–464. doi: 10.1016/j.talanta.2019.06.040. [DOI] [PubMed] [Google Scholar]
- Sinha A. Tan B. Huang Y. Zhao H. Dang X. Chen J. Jain R. TrAC, Trends Anal. Chem. 2018;102:75–90. doi: 10.1016/j.trac.2018.01.008. [DOI] [Google Scholar]
- Rahsepar M. Foroughi F. Kim H. Sens. Actuators, B. 2019;282:322–330. doi: 10.1016/j.snb.2018.11.078. [DOI] [Google Scholar]
- Luo Y. Chen C. Xia K. Peng S. Guan H. Tang J. Lu H. Yu J. Zhang J. Xiao Y. Opt. Express. 2016;24:8956–8966. doi: 10.1364/OE.24.008956. [DOI] [PubMed] [Google Scholar]
- Radisavljevic B. Radenovic A. Brivio J. Giacometti V. Kis A. Nat. Nanotechnol. 2011;6:147. doi: 10.1038/nnano.2010.279. [DOI] [PubMed] [Google Scholar]
- Ramakrishna Matte H. Gomathi A. Manna A. K. Late D. J. Datta R. Pati S. K. Rao C. Angew. Chem., Int. Ed. 2010;49:4059–4062. doi: 10.1002/anie.201000009. [DOI] [PubMed] [Google Scholar]
- Zhao J. Zhang Z. Yang S. Zheng H. Li Y. J. Alloys Compd. 2013;559:87–91. doi: 10.1016/j.jallcom.2013.01.067. [DOI] [Google Scholar]
- Ramki S. Sukanya R. Chen S.-M. Sakthivel M. Inorg. Chem. Front. 2019;6:1680–1693. doi: 10.1039/C9QI00158A. [DOI] [Google Scholar]
- Xie J. Zhang H. Li S. Wang R. Sun X. Zhou M. Zhou J. Lou X. W. Xie Y. Adv. Mater. 2013;25:5807–5813. doi: 10.1002/adma.201302685. [DOI] [PubMed] [Google Scholar]
- Li D. Liao Q. Ren B. Jin Q. Cui H. Wang C. J. Mater. Chem. A. 2017;5:11301–11308. doi: 10.1039/C7TA02149F. [DOI] [Google Scholar]
- Zhai Y. Li J. Chu X. Xu M. Jin F. Li X. Fang X. Wei Z. Wang X. J. Alloys Compd. 2016;672:600–608. doi: 10.1016/j.jallcom.2016.02.130. [DOI] [Google Scholar]
- Xu H. He D. Fu M. Wang W. Wu H. Wang Y. Opt. Express. 2014;22:15969–15974. doi: 10.1364/OE.22.015969. [DOI] [PubMed] [Google Scholar]
- Zhang W.-D. Chen J. Jiang L.-C. Yu Y.-X. Zhang J.-Q. Microchim. Acta. 2010;168:259–265. doi: 10.1007/s00604-010-0288-2. [DOI] [Google Scholar]
- Gangopadhyay R. De A. Chem. Mater. 2000;12:608–622. doi: 10.1021/cm990537f. [DOI] [Google Scholar]
- Hussain S. Akbar K. Vikraman D. Choi D.-C. Kim S. J. An K.-S. Jung S. Jung J. New J. Chem. 2015;39:7481–7487. doi: 10.1039/C5NJ01512J. [DOI] [Google Scholar]
- Li Y.-Y. Wang J.-H. Luo Z.-J. Chen K. Cheng Z.-Q. Ma L. Ding S.-J. Zhou L. Wang Q.-Q. Sci. Rep. 2017;7:7178. doi: 10.1038/s41598-017-07601-1. [DOI] [PMC free article] [PubMed] [Google Scholar]
- Hu Y. Li X. Lushington A. Cai M. Geng D. Banis M. N. Li R. Sun X. ECS J. Solid State Sci. Technol. 2013;2:M3034–M3039. doi: 10.1149/2.007310jss. [DOI] [Google Scholar]
- Meng N. Zhou Y. Nie W. Song L. Chen P. J. Nanopart. Res. 2015;17:300. doi: 10.1007/s11051-015-3105-3. [DOI] [Google Scholar]
- Su S. Lu Z. Li J. Hao Q. Liu W. Zhu C. Shen X. Shi J. Wang L. New J. Chem. 2018;42:6750–6755. doi: 10.1039/C8NJ00940F. [DOI] [Google Scholar]
- Ge L. Han C. Xiao X. Guo L. Int. J. Hydrogen Energy. 2013;38:6960–6969. doi: 10.1016/j.ijhydene.2013.04.006. [DOI] [Google Scholar]
- Shamsipur M. Najafi M. Hosseini M.-R. M. Bioelectrochemistry. 2010;77:120–124. doi: 10.1016/j.bioelechem.2009.07.007. [DOI] [PubMed] [Google Scholar]
- Zhang L. Ye C. Li X. Ding Y. Liang H. Zhao G. Wang Y. Nano-Micro Lett. 2018;10:28. doi: 10.1007/s40820-017-0178-9. [DOI] [PMC free article] [PubMed] [Google Scholar]
- Ma L. Zhang Q. Wu C. Zhang Y. Zeng L. Anal. Chim. Acta. 2019;1055:17–25. doi: 10.1016/j.aca.2018.12.025. [DOI] [PubMed] [Google Scholar]
- Ammara S. Shamaila S. Bokhari A. Sabah A. J. Phys. Chem. Solids. 2018;120:12–19. doi: 10.1016/j.jpcs.2018.04.015. [DOI] [Google Scholar]
- Ma G. Peng H. Mu J. Huang H. Zhou X. Lei Z. J. Power Sources. 2013;229:72–78. doi: 10.1016/j.jpowsour.2012.11.088. [DOI] [Google Scholar]
- Liu P. Liu Y. Ye W. Ma J. Gao D. Nanotechnology. 2016;27:225403. doi: 10.1088/0957-4484/27/22/225403. [DOI] [PubMed] [Google Scholar]
- Mulaba-Bafubiandi A. F. Karimi-Maleh H. Karimi F. Rezapour M. J. Mol. Liq. 2019;285:430–435. doi: 10.1016/j.molliq.2019.04.084. [DOI] [Google Scholar]
- Yan H. Zhang D. Xu J. Lu Y. Liu Y. Qiu K. Zhang Y. Luo Y. Nanoscale Res. Lett. 2014;9:424. doi: 10.1186/1556-276X-9-424. [DOI] [PMC free article] [PubMed] [Google Scholar]
- Li J. Li P. Li J. Tian Z. Yu F. Catalysts. 2019;9:506. doi: 10.3390/catal9060506. [DOI] [Google Scholar]
- Dong H. Liu C. Ye H. Hu L. Fugetsu B. Dai W. Cao Y. Qi X. Lu H. Zhang X. Sci. Rep. 2015;5:17542. doi: 10.1038/srep17542. [DOI] [PMC free article] [PubMed] [Google Scholar]
- Ho Y. T. Ma C. H. Luong T. T. Wei L. L. Yen T. C. Hsu W. T. Chang W. H. Chu Y. C. Tu Y. Y. Pande K. P. Phys. Status Solidi RRL. 2015;9:187–191. doi: 10.1002/pssr.201409561. [DOI] [Google Scholar]
- Wang H.-q. Fan X.-p. Zhang X.-h. Huang Y.-g. Wu Q. Pan Q.-c. Li Q.-y. RSC Adv. 2017;7:23328–23333. doi: 10.1039/C7RA02932B. [DOI] [Google Scholar]
- Haubner K. Murawski J. Olk P. Eng L. M. Ziegler C. Adolphi B. Jaehne E. ChemPhysChem. 2010;11:2131–2139. doi: 10.1002/cphc.201000132. [DOI] [PubMed] [Google Scholar]
- Vinoth R. Patil I. M. Pandikumar A. Kakade B. A. Huang N. M. Dionysios D. D. Neppolian B. ACS Omega. 2016;1:971–980. doi: 10.1021/acsomega.6b00275. [DOI] [PMC free article] [PubMed] [Google Scholar]
- Kale H. Kulthe M. Goyal R. K. Int. Conf. Powder Metall. Part. Mater. 2016;16:18–20. [Google Scholar]
- Vaidyanathan S. Cherng J.-Y. Sun A.-C. Chen C.-Y. Int. J. Mol. Sci. 2016;17:1104. doi: 10.3390/ijms17071104. [DOI] [PMC free article] [PubMed] [Google Scholar]
- Zhang X. Zhang Z. Liao Q. Liu S. Kang Z. Zhang Y. Sensors. 2016;16:1791. doi: 10.3390/s16111791. [DOI] [PMC free article] [PubMed] [Google Scholar]
- Dung N. Q. Patil D. Jung H. Kim J. Kim D. Sens. Actuators, B. 2013;183:381–387. doi: 10.1016/j.snb.2013.04.018. [DOI] [Google Scholar]
- Jerome R. Sundramoorthy A. K. J. Electrochem. Soc. 2019;166:B3017–B3024. doi: 10.1149/2.0041909jes. [DOI] [Google Scholar]
- Fang L. Wang F. Chen Z. Qiu Y. Zhai T. Hu M. Zhang C. Huang K. Talanta. 2017;167:593–599. doi: 10.1016/j.talanta.2017.03.008. [DOI] [PubMed] [Google Scholar]
- Lin K.-C. Lin Y.-C. Chen S.-M. Electrochim. Acta. 2013;96:164–172. doi: 10.1016/j.electacta.2013.02.098. [DOI] [Google Scholar]
- Ranjani M. Sathishkumar Y. Lee Y. S. Yoo D. J. Kim A. R. RSC Adv. 2015;5:57804–57814. doi: 10.1039/C5RA08471G. [DOI] [Google Scholar]
- Devi N. R. Kumar T. V. Sundramoorthy A. K. J. Electrochem. Soc. 2018;165:G3112–G3119. doi: 10.1149/2.0191812jes. [DOI] [Google Scholar]
- Preethika M. Sundramoorthy A. K. Appl. Surf. Sci. 2019;488:503–511. doi: 10.1016/j.apsusc.2019.05.255. [DOI] [Google Scholar]
- Huang J. Dong Z. Li Y. Li J. Tang W. Yang H. Wang J. Bao Y. Jin J. Li R. Mater. Res. Bull. 2013;48:4544–4547. doi: 10.1016/j.materresbull.2013.07.060. [DOI] [Google Scholar]
- Guo R. Liu T. Wei X. Colloids Surf., A. 2002;209:37–45. doi: 10.1016/S0927-7757(02)00032-8. [DOI] [Google Scholar]
- Knowler W. C. Diabetes Care. 2015;38:51–58. doi: 10.2337/dc14-0886. [DOI] [PMC free article] [PubMed] [Google Scholar]
- T. F. Scientific, Thermo Scientific Tech Tip, 2007, 58, http://tools.thermofisher.com/content/sfs/brochures/TR0058-Spike-and-Recovery.pdf [Google Scholar]
- Safavi A. Maleki N. Farjami E. Biosens. Bioelectron. 2009;24:1655–1660. doi: 10.1016/j.bios.2008.08.040. [DOI] [PubMed] [Google Scholar]
- Zhu X. Jiao Q. Zhang C. Zuo X. Xiao X. Liang Y. Nan J. Microchim. Acta. 2013;180:477–483. doi: 10.1007/s00604-013-0955-1. [DOI] [Google Scholar]
- Wang C. Yin L. Zhang L. Gao R. J. Phys. Chem. C. 2010;114:4408–4413. doi: 10.1021/jp912232p. [DOI] [Google Scholar]
- Yu S. Peng X. Cao G. Zhou M. Qiao L. Yao J. He H. Electrochim. Acta. 2012;76:512–517. doi: 10.1016/j.electacta.2012.05.079. [DOI] [Google Scholar]
- Martins P. R. Aparecida Rocha M. Angnes L. Eisi Toma H. Araki K. Electroanalysis. 2011;23:2541–2548. doi: 10.1002/elan.201100271. [DOI] [Google Scholar]
- Luo J. Jiang S. Zhang H. Jiang J. Liu X. Anal. Chim. Acta. 2012;709:47–53. doi: 10.1016/j.aca.2011.10.025. [DOI] [PubMed] [Google Scholar]
Associated Data
This section collects any data citations, data availability statements, or supplementary materials included in this article.


