

Key Points
Question
Is rapid dose decrease or discontinuation among patients receiving high-dose, long-term opioid therapy associated with increased risk of opioid-related harms?
Findings
In a retrospective cohort study of 19 443 privately insured patients who received high-dose, long-term opioid therapy, rapid dose reduction or discontinuation (vs dose maintenance or increase or gradual reduction or discontinuation) was associated with increased risk of opioid overdose over 4 years of follow-up.
Meaning
This cohort study found that opioid dose reduction or discontinuation that exceeded current chronic pain management guidelines was associated with increased risk of opioid-related harms, highlighting the importance of caution when reducing opioid doses in order to improve patient safety.
This cohort study assesses the association of rapid reduction or discontinuation of opioid therapy with overdose and opioid use disorder (OUD) among patients receiving high-dose, long-term opioid therapy in North Carolina.
Abstract
Importance
Rapid reduction or discontinuation of long-term opioid therapy may increase risk of opioid overdose or opioid use disorder (OUD). Current guidelines for chronic pain management caution against rapid dose reduction but are based on limited evidence.
Objective
To characterize the association between rapid reduction or abrupt discontinuation of opioid therapy (vs maintained or gradual reduction) and incidence of opioid overdose and OUD among patients prescribed high-dose, long-term opioid therapy (HDLTOT).
Design, Setting, and Participants
This retrospective cohort study was conducted among patients aged 18 to 64 years who were prescribed HDLTOT (≥90 daily morphine milligram equivalents for ≥90% of 90 days) from January 2006 to September 2018, with follow-up up to 4 years after cohort entry. Claims data were drawn from a large private health insurer in North Carolina and analyzed from March 1, 2006, to September 30, 2018.
Exposures
Time-varying exposure of rapid dose reduction or discontinuation (>10% dose reduction/week) vs maintenance, increase, or gradual reduction or discontinuation.
Main Outcomes and Measures
The main outcome was incident opioid overdose (fatal or nonfatal) or diagnosed OUD. Inverse probability-weighted cumulative incidence of outcomes were estimated using the cumulative incidence function and hazard ratios (HRs) using marginal structural Fine-Gray models as a function of rapid dose tapering or discontinuation (vs gradual reduction or discontinuation or maintained or increased), accounting for competing risks.
Results
A total of 19 443 patients (median [IQR] age, 49 [41-55] years; 10 073 [51.8%] men) who received HDLTOT were identified. Rapid reduction or discontinuation was associated with higher risk of fatal and nonfatal overdoses compared with gradual reduction after the first year (year 1: HR, 1.43; 95% CI, 0.94-2.18; years 2-4: HR, 1.95; 95% CI, 1.31-2.90). There was no association between rapid reduction or discontinuation and diagnosed OUD through 2 years of follow-up; however, the hazard of incident OUD among patients exposed to rapid tapering or discontinuation was greater 25 to 48 months after the start of follow-up (HR, 1.28; 95% CI, 1.01-1.63).
Conclusions and Relevance
In this cohort study, rapid dose reduction or discontinuation was associated with increased risk of opioid overdose and OUD during long-term follow-up. These findings reinforce prior concerns about safety of rapid dose reductions for patients receiving HDLTOT and highlight the need for caution when reducing opioid doses.
Introduction
Approximately 20 years into the opioid epidemic in the United States, optimal strategies for long-term opioid therapy (LTOT) for chronic pain remain poorly defined.1,2 The clinical need for pain management tools for patients with chronic pain is undisputed; the human toll of widespread opioid prescribing in terms of opioid misuse, opioid use disorder (OUD), and overdoses is equally clear.3,4,5,6,7,8 The need for evidence to inform the balancing of these risks and benefits is urgent.1,2,9,10,11
Spurred by the 2016 guidelines from the Centers for Disease Control and Prevention (CDC),9 numerous recent legislative and policy actions have sought to regulate opioid prescribing to increase patient safety.12,13,14 While often written to rein in high-volume prescribers or regulate first prescriptions for acute or postsurgical pain, these actions have had a general chilling effect, with demonstrated opioid prescription reductions or discontinuations for patients with chronic pain associated with these policies, even when they are not the intended policy targets.15,16
For patients with chronic and intractable pain, whether or not to reduce or discontinue LTOT and the optimal approach to do so are clinical management questions of particular importance. Some studies have raised concerns that overly rapid reduction or abrupt discontinuation of LTOT may increase patients’ risk of overdose by leading them to turn to illicit drugs to manage their suddenly uncontrolled pain.16,17 The CDC guidelines for chronic pain management caution against rapid dose reduction and recommend decreasing dosage by 10% or less per week.9,15,18 However, these recommendations are based on expert opinion derived from a very limited evidence base, as stated in the guidelines themselves.9,10,11,18
Accordingly, we sought to characterize incidence of OUD and nonfatal and fatal opioid overdose in a cohort of privately insured patients prescribed high-dose LTOT (HDLTOT), comparing outcomes between patients with stable or guideline-concordant gradual opioid dosage reduction vs those with a rapid dose reduction or abrupt discontinuation of opioid therapy. We hypothesized that rapid dose reduction or discontinuation would increase risk of adverse outcomes compared with maintaining or gradually reducing doses. We further hypothesized that both dose maintenance and gradual reduction or discontinuation would have protective associations against adverse outcomes compared with rapid dose reduction or discontinuation.
Methods
This cohort study was approved by the institutional review board at the University of North Carolina at Chapel Hill and determined to be exempt from informed consent because data were deidentified. This study followed the Strengthening the Reporting of Observational Studies in Epidemiology (STROBE) reporting guideline.
Study Data and Population
We conducted a retrospective cohort study using deidentified insurance claims from a large private health insurer, covering about one-fifth of North Carolina residents, between January 1, 2006, and September 30, 2018. Included individuals were adults (ages 18-64 years) who received HDLTOT, defined as at least 90 daily morphine milligram equivalents (MME) for at least 90% of 90 consecutive days.19,20
We calculated daily MME similarly to definition 2 from Dasgupta et al21 (eMethods in the Supplement). Briefly, dose per unit and number of units dispensed for each prescription were multiplied, then divided by days’ supply from the outpatient pharmaceutical claim. This daily dose was then multiplied by an MME conversion factor from CDC tables.22 Finally, daily MME was calculated as the sum of MME per day across all prescriptions each day. Overlapping prescriptions for 7 or fewer days were staggered, while those overlapping more than 7 days were assumed to truly overlap.23
Patients with a history (using all-available data for lookback24,25) of opioid overdose or OUD were excluded, identified using International Classification of Diseases, Ninth Revision, Clinical Modification (ICD-9-CM), or International Statistical Classification of Diseases, Tenth Revision, Clinical Modification (ICD-10-CM) codes in insurance claims (eTable 1 in the Supplement). To identify fatal overdoses, claims data were linked to vital records (deaths) from the North Carolina Department of Health and Human Services Division of Public Health using a hierarchical matching algorithm (eFigure 1 in the Supplement).
Patients were followed from the first day after the 90-day HDLTOT classification period until the death, disenrollment, administrative censoring (September 30, 2018), or end of 48 months, whichever came first (eFigure 2 in the Supplement). Patients could reenter the analytic cohort after disenrollment, with follow-up time reset to 0, if they reentered the insurance pool and again met eligibility criteria.
Exposure
We assessed exposure status at each month of follow-up. During each 30-day period, we compared mean dose during the current month to both the previous month’s mean dose and 6-month rolling mean to classify patients’ prescription trajectories as dose maintained, increased, gradually decreased, rapidly decreased, gradually discontinued, or rapidly discontinued. Comparison to a 6-month rolling mean was included to minimize impacts of short-term dose variabilities on exposure classification. We defined gradual dose reduction following CDC guideline recommendations of no more than 10% dose reduction per week (≤34% per month) and anything faster as rapid dose reduction (eMethods and eTable 2 in the Supplement).9
Our primary analyses applied a time-varying dichotomous exposure of rapid decrease or discontinuation vs maintenance or increase or gradual reduction or discontinuation. We used a time-varying intent-to-treat approach, classifying patients as ever exposed to any rapid reduction or discontinuation after their first identified rapid reduction or discontinuation event, vs never exposed.
To address our secondary hypothesis, we used a 3-level time-varying exposure, classifying patients as having had their dosage (1) consistently maintained or increased, (2) ever gradually but never rapidly reduced or discontinued, or (3) ever rapidly reduced or discontinued.
Outcomes
We examined 4 coprimary outcomes of interest: (1) fatal opioid overdose, identified using ICD-10 codes from underlying and contributing causes of death in linked death records (eTable 3 in the Supplement), (2) incident nonfatal opioid overdose identified using ICD-9-CM and ICD-10-CM diagnosis codes from insurance claims (eTable 1 in the Supplement), (3) a combined outcome of incident nonfatal or fatal opioid overdose, and (4) incident OUD identified using diagnosis codes from insurance claims (eTable 1 in the Supplement). Death (all-cause) was treated as a competing risk26,27 for incident nonfatal overdose and incident OUD, as was death not attributed to opioid overdose for incident fatal overdose and incident overdose (fatal or nonfatal).
Patient Characteristics
Time-fixed patient characteristics at the index date were sex and history of opioid use prior to the 90-day HDLTOT classification period. All time-updated patient characteristics were identified prior to the start of each 30-day exposure window to ensure correct temporal ordering (eFigure 2 in the Supplement). Time-updated demographic characteristics included age (modeled as quadratic) and calendar year (categorical to avoid small cell counts: 2006-2010, 2011-2012, 2013-2014, and 2015-2018, based on functional form analysis and accounting for waves of the opioid epidemic28 and changing policies) at the start of the prior 30-day window. Time-updated 5-digit zip-code level characteristics (missing for 22 individuals excluded from the analytic cohort) included percentage of individuals in the zip code identifying as Black and percentage identifying as other race, including American Indian and Alaska Native, Asian, Native Hawaiian and other Pacific Islander, or individuals who identify as another race not listed or 2 or more races (both categorized based upon quartiles), both obtained from the American Community Survey (ACS),29 and rural-urban commuting area (RUCA) codes applied to the zip code30 (categorized as metropolitan, micropolitan, and small town/rural) at the start of the prior 30-day window. Zip code–level characteristics, including race, were merged with patient zip code from insurance member files and were included in propensity score models to account for community level and geographic differences that may be associated with opioid prescribing (exposure) and opioid-related harms (outcome). Time-updated diagnoses of depression, anxiety, posttraumatic stress disorder, substance use disorder other than OUD (eg, alcohol use disorder), and cancer were identified using an all-available lookback prior to the start of the previous 30-day period. Time-varying prescriptions included selective serotonin reuptake inhibitors, non–selective serotonin reuptake inhibitor antidepressants (eg, bupropion, trazodone), benzodiazepines, other anxiolytics (eg, buspirone), naloxone, and whether the patient received any extended-release opioids during the previous 30-day period. Time-varying derived indications included diagnosed acute pain, chronic pain, or invasive surgery in the 6-month period before the start of the previous 30-day period.
Statistical Analysis
We first calculated median change in dose by exposure status between baseline to month 12 and baseline to month 48. To estimate the association between rapid opioid dose reduction or discontinuation with time-to-incident opioid overdose or diagnosed OUD, we related exposure status through month t to outcome occurrence during month t + 1, implemented with inverse probability (IP) weighted survival curves and marginal structural models.31,32 We used stabilized IP treatment weights (IPTW) to account for time-dependent confounding33 (eMethods in the Supplement). To address possible selection bias stemming from potentially informative censoring, we calculated stabilized IP censoring weights (IPCW). We then multiplied IPCW by IPTW to obtain IPTC-weights (IPTCW).
We estimated crude and weighted cumulative incidence of (1) fatal opioid overdose, (2) nonfatal opioid overdose, (3) nonfatal or fatal opioid overdose, and (4) incident OUD using the cumulative incidence function through 48 months of follow-up, accounting for competing risks.34,35 We calculated risk differences at multiple time points, obtaining 95% CI using robust variance estimators to account for repeated observations.
We used weighted Fine-Gray models to estimate subdistribution hazard ratios (HRs), accounting for competing risks.34 We used an infinitesimal jackknife36 to compute robust SEs and Efron method37 to handle tied event times. We assessed the proportional hazards assumption using Schoenfeld residuals, with models stratified by follow-up time, where appropriate, to handle violations.
We conducted additional sensitivity analyses (eMethods in the Supplement). First, to examine impacts of baseline opioid dose variability on cohort selection, we restricted the analytic cohort to patients determined to have stable baseline dosing. Second, to address potential outcome misclassification, we examined only nonfatal overdoses occurring during an emergency department or inpatient event.
We used SAS version 9.4 (SAS Institute) for data management and R version 3.6.0 (R Project for Statistical Computing) for analyses (eTable 3 in the Supplement). Significance was defined as 95% CIs that did not cross 0 for risk differences or that did not cross 1 for HRs. Data were analyzed from March 1, 2006, to September 30, 2018.
Results
We identified 19 443 patients who received HDLTOT. Median (IQR) age at day 0 was 49 (41-55) years and 10 073 (51.8%) were men (Table 1). Most patients had prior opioid exposure (11 588 patients [59.6%]). In the 6 months before study follow-up, 17 317 patients (89.1%) had a chronic pain diagnosis. One-third of patients had ever been diagnosed with depression (6399 patients [32.9%]) or anxiety (6427 patients [33.1%]), and 2694 patients (13.9%) had a history of cancer.
Table 1. Characteristics at Baseline of 19 443 Patients Receiving High-Dose, Long-term Opioid Therapy in North Carolina, 2006-2018.
| Characteristic | Participants, No. (%) (N = 19 443) |
|---|---|
| Age, median (IQR), y | 49 (41-55) |
| Sex | |
| Women | 9313 (48.2) |
| Men | 10 073 (51.8) |
| Calendar year | |
| 2006 | 2915 (15.0) |
| 2007 | 1498 (7.7) |
| 2008 | 1492 (7.7) |
| 2009 | 1454 (7.5) |
| 2010 | 1367 (7.0) |
| 2011 | 1183 (6.1) |
| 2012 | 1194 (6.1) |
| 2013 | 1228 (6.3) |
| 2014 | 2194 (11.3) |
| 2015 | 1790 (9.2) |
| 2016 | 1236 (6.4) |
| 2017 | 1427 (7.3) |
| 2018 | 465 (2.4) |
| Prior opioid exposure, ever | 11 588 (59.6) |
| Diagnosis | |
| Cancer | 2694 (13.9) |
| Depression | 6399 (32.9) |
| Anxiety | 6427 (33.1) |
| PTSD | 420 (2.2) |
| SUD | 1782 (9.2) |
| Pain diagnosis, past 6 mo | |
| Acute | 4926 (25.3) |
| Chronic | 17 317 (89.1) |
| Surgery, past 6 mo | 2371 (12.2) |
| Medication use, past mo | |
| Benzodiazepine | 7873 (40.5) |
| SSRI | 3984 (20.5) |
| Anxiolytic | 641 (3.3) |
| Antidepressant | 5794 (29.8) |
| Naloxone | 21 (0.1) |
| ER/LA | 11 360 (58.4) |
| Log cumulative MME, median (IQR) | 9.64 (9.39-9.98) |
Abbreviations: ER/LA, extended-release/long-acting opioid; MME, morphine milligram equivalent; PTSD, posttraumatic stress disorder; SSRI, selective serotonin reuptake inhibitor; SUD, substance use disorder.
During follow-up, there were 59 fatal opioid overdoses, 215 nonfatal overdoses, 268 fatal or nonfatal overdoses (if individuals experienced a nonfatal overdose before a fatal overdose, only the first [nonfatal] overdose was considered for the combined outcome), and 2796 incident OUD diagnoses (Table 2). Across the 4 outcomes, median follow-up ranged from 15 to 17 months, and nearly half (46%-49%) of follow-up time was classified as exposed to rapid reduction or discontinuation. Competing risk of death was observed among 4.6% to 4.8% of patients. Among patients exposed to rapid dose decrease or discontinuation by month 12, median (IQR) dose change was −49.7% (−91.2% to −5.5%) from baseline to month 12 and −54.1% (−100.0% to 2.5%) by month 48 among those exposed by month 48. Among unexposed patients, median (IQR) dose change was 3.7% (−2.6% to 33.3%) by month 12 and 23.0% (0% to 72.9%) by month 48.
Table 2. Incident Fatal Opioid Overdose, Nonfatal Opioid Overdose, Fatal or Nonfatal Opioid Overdose, and Opioid Use Disorder Overall and by Exposure Status Among Patients Receiving High-Dose, Long-term Opioid Therapy in North Carolina, 2006-2018.
| Outcome, follow-up mo | No. | |||||
|---|---|---|---|---|---|---|
| Overall | Maintained, increased, or gradually reduced or discontinued | Rapidly reduced or discontinued | ||||
| Events | Follow-up, person-monthsa | Events | Follow-up, person-months | Events | Follow-up, person-months | |
| Opioid overdose | ||||||
| Fatal | 59 | 475 959 | 26 | 244 696 | 33 | 231 263 |
| 0-12 | 29 | 205 482 | 17 | 148 420 | 12 | 57 061 |
| 13-48 | 30 | 270 477 | 9 | 96 275 | 21 | 174 202 |
| Nonfatal | 215 | 472 603 | 93 | 244 106 | 122 | 228 497 |
| 0-12 | 99 | 204 929 | 64 | 148 181 | 35 | 56 747 |
| 13-48 | 116 | 267 674 | 29 | 95 924 | 87 | 171 750 |
| Fatal or nonfatalb | 268 | 472 604 | 115 | 244 106 | 153 | 228 497 |
| 0-12 | 126 | 204 929 | 79 | 148 181 | 47 | 56 747 |
| 13-48 | 142 | 267 674 | 36 | 95 924 | 106 | 171 750 |
| Opioid use disorder | 2796 | 432 004 | 1603 | 233 382 | 1193 | 198 622 |
| 0-12 | 1534 | 197 116 | 1124 | 144 382 | 410 | 52 734 |
| 13-24 | 703 | 113 981 | 326 | 52 287 | 377 | 61 694 |
| 25-48 | 559 | 120 907 | 153 | 36 713 | 406 | 84 194 |
Person-months of follow-up differ across each outcome analysis because an individual may have experienced a nonfatal outcome (eg, opioid use disorder or nonfatal opioid overdose) prior to a fatal overdose. Therefore, that individual would contribute fewer person-months to the analysis with the nonfatal outcome than to the fatal opioid overdose outcome analysis.
Some individuals had both a nonfatal and then a fatal overdose; thus the number of combined events is less than the number of fatal overdoses plus the number of nonfatal overdoses.
Crude (eFigure 3 in the Supplement) and weighted (Figure 1A-C) cumulative incidences of fatal opioid overdose, nonfatal opioid overdose, and combined fatal or nonfatal opioid overdose were consistently higher for patients exposed to rapid dose reduction or discontinuation compared with patients with maintained, increased, or gradually reduced or discontinued dosage (eTable 5 in the Supplement). We found no notable difference in incident OUD across exposure groups during the first 12 months of follow-up (risk difference, 0.53%; 95% CI, −0.65 to 1.71), after which the weighted cumulative incidence of OUD was higher among patients ever exposed to rapid dose reduction or discontinuation, although with considerable confidence interval overlap (Figure 1D). Differences in cumulative incidence were more pronounced after 2 years of follow-up for all 4 outcomes examined, with the largest difference between cumulative incidence curves toward the end of the follow-up period. Specifically, the weighted risk difference of the combined outcome of fatal or nonfatal opioid overdose among patients who ever experienced rapid dose reduction or discontinuation of opioid therapy, compared with patients with maintained, increased, or gradually reduced or discontinued dosage, was 0.25% (95% CI −0.04 to 0.54) at 3 months of follow-up and 0.58% (95% CI, 0.11 to 1.04) at 2 years of follow-up (eTable 5 in the Supplement).
Figure 1. Inverse Probability of Treatment and Censoring–Weighted Cumulative Incidence Curves by Primary Exposure Status.
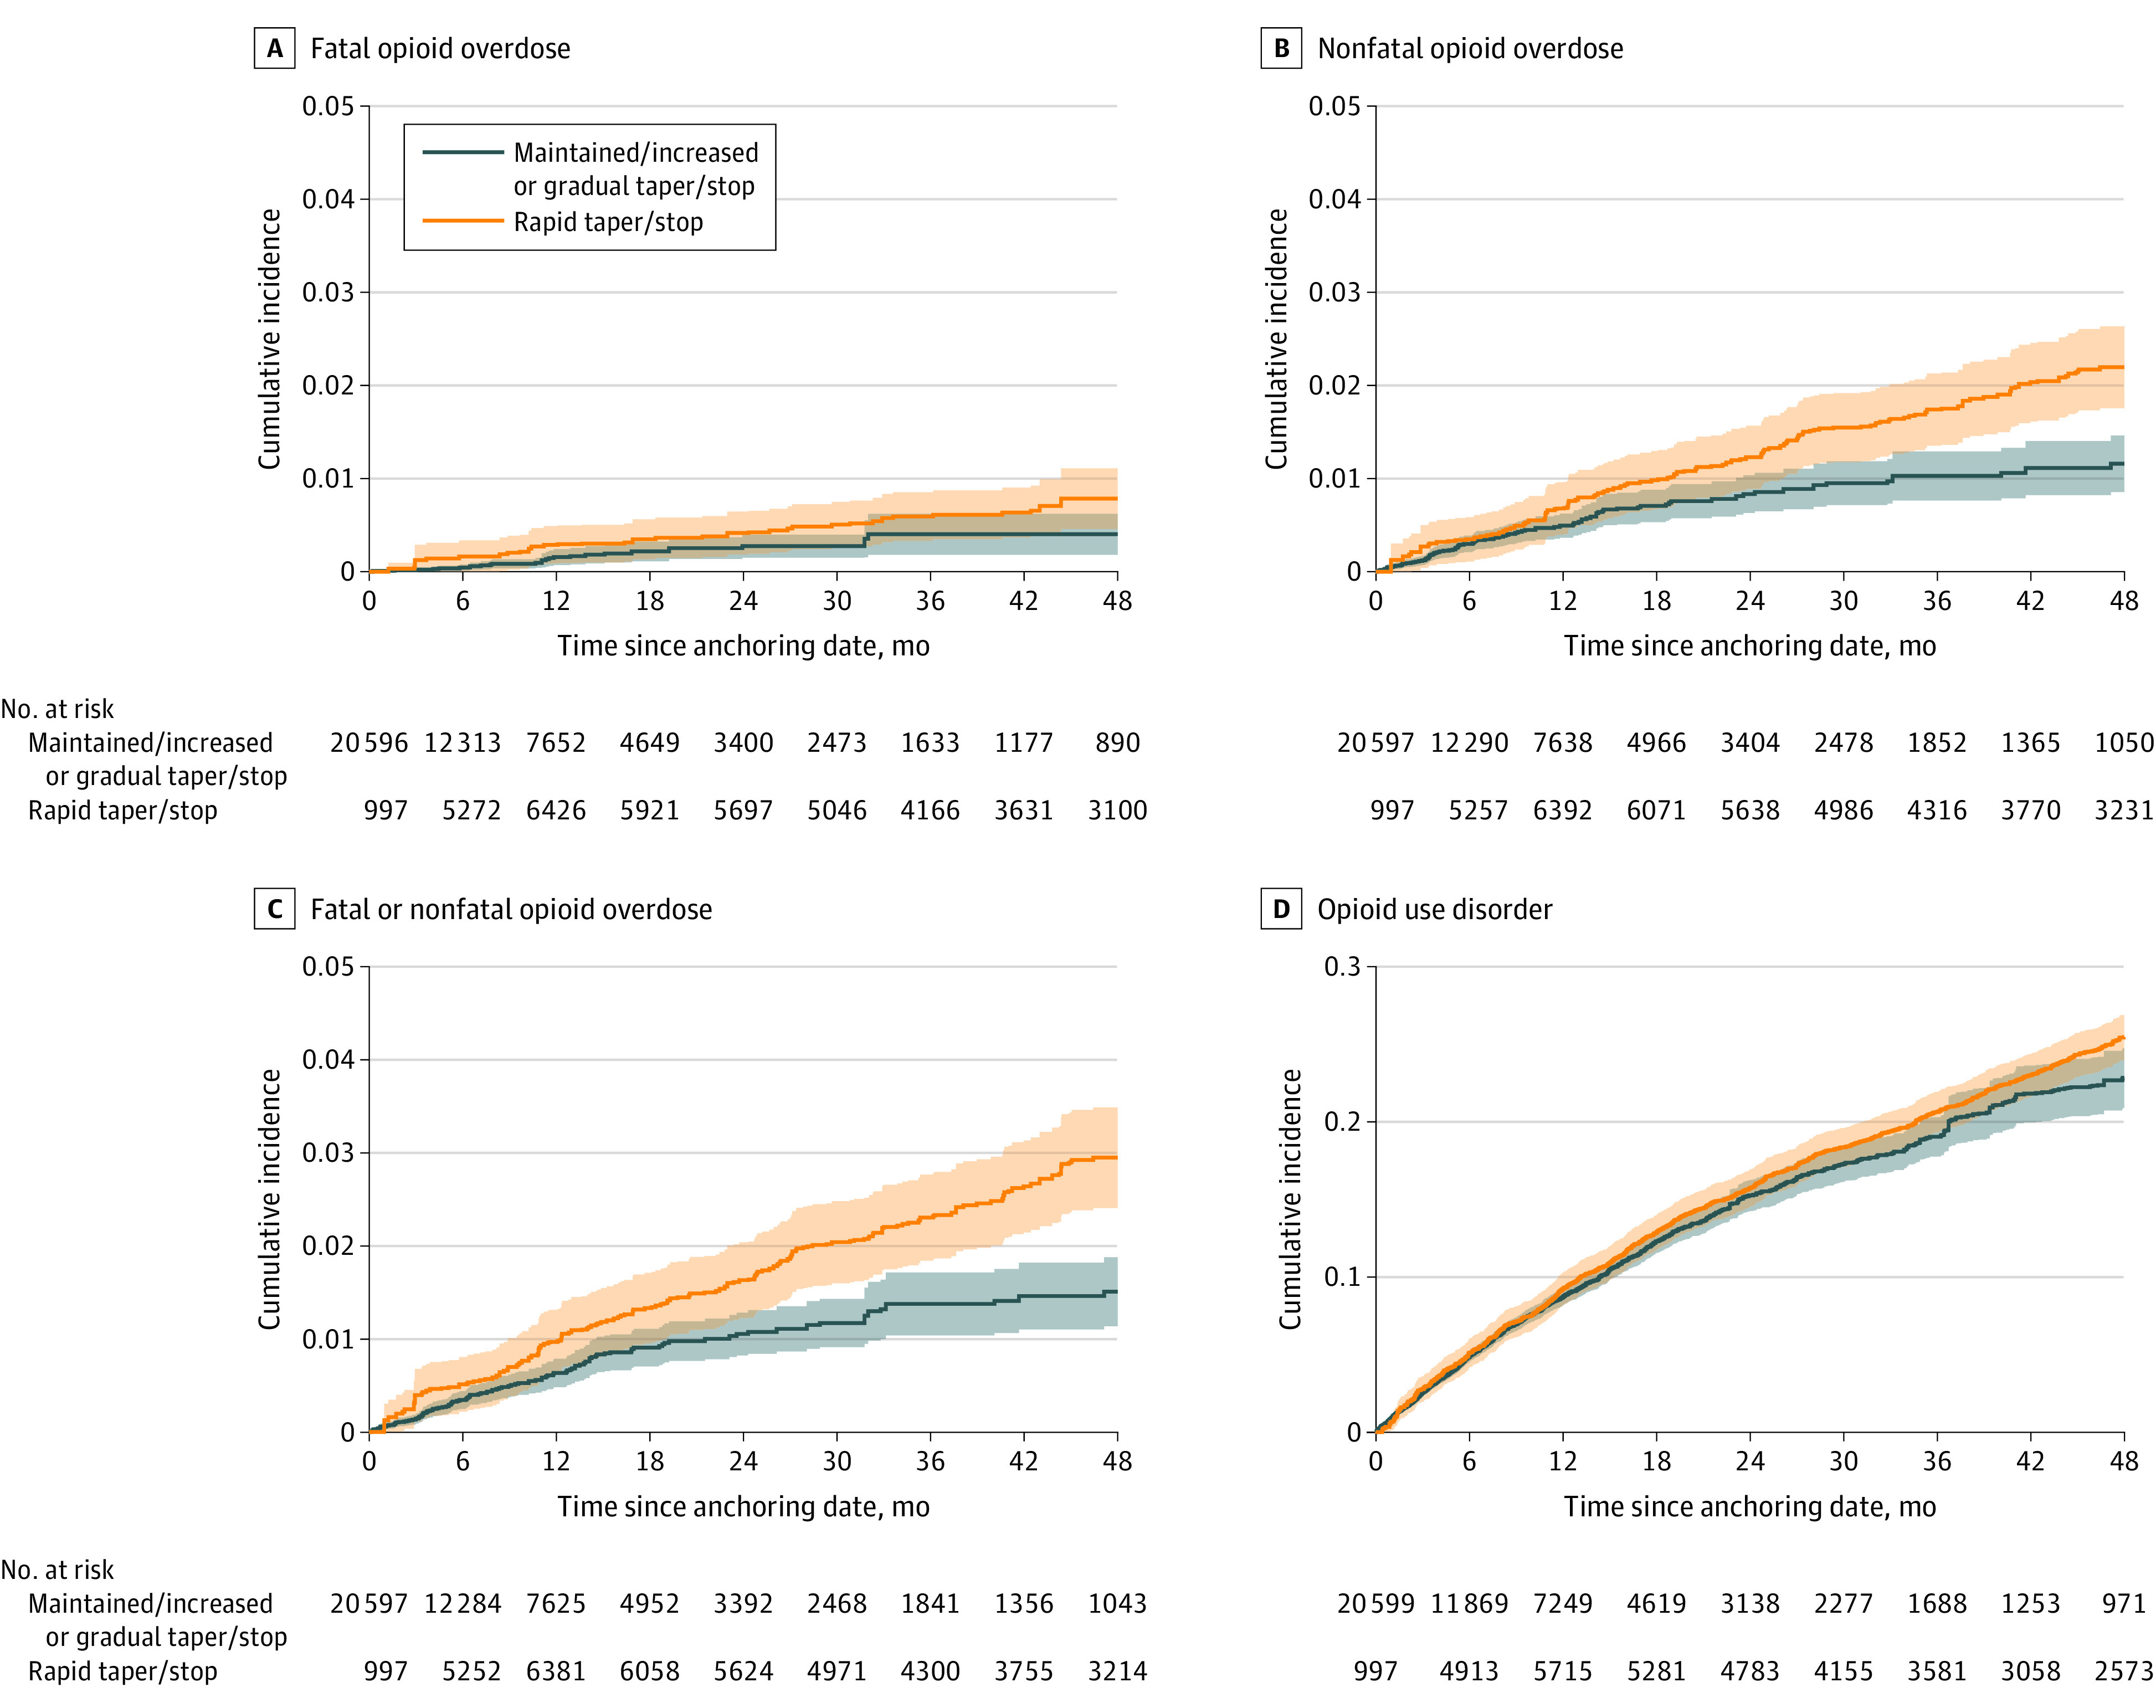
Among 19 443 patients receiving high-dose, long-term opioid therapy in North Carolina from 2006 to 2018. Shading indicates 95% CI.
Tests indicated that the proportional hazards assumption was not upheld, indicating separate estimates for months 1 to 12 vs 13 to 48 of follow-up for overdose outcomes and months 1 to 12, 13 to 24, and 25 to 48 of follow-up for OUD. Among patients ever exposed to rapid dose reduction or discontinuation, compared with those never exposed, the weighted hazard of incident nonfatal or fatal opioid overdose was increased with time (year 1: weighted HR, 1.43; 95% CI, 0.94 to 2.18; years 2-4: weighted HR, 1.95; 95% CI, 1.31 to 2.90) (Figure 2; eTable 6 in the Supplement). A similar trend was observed for each of these 2 outcomes alone. The hazard of incident OUD comparing patients ever exposed to rapid reduction or discontinuation vs those never exposed was not significantly higher through 2 years of follow-up (year 1: weighted HR, 1.07; 95% CI, 0.94 to 1.21; year 2: weighted HR, 1.01; 95% CI, 0.85 to 1.19). However, the hazard of incident OUD among patients exposed to rapid reduction or discontinuation was notably higher 25 to 48 months after the start of follow-up (weighted HR, 1.28; 95% CI, 1.01 to 1.63).
Figure 2. Inverse Probability of Treatment and Censoring–Weighted Hazard Ratios (HRs) Comparing Patients Exposed to Rapid Tapering or Discontinuation vs Those Who Had Their Dosage Maintained.

Among 19 443 patients receiving high-dose, long-term opioid therapy or gradually tapered or discontinued in North Carolina from 2006 to 2018.
When using a 3-category exposure, patients exposed to rapid dose reduction or discontinuation were at consistently higher risk of fatal or nonfatal opioid overdose than patients with maintained or increased dosage (Figure 3A-C). For the first 6 to 9 months of follow-up, patients with gradual dose reduction or discontinuation had the lowest risk of all outcomes. After the first year of follow-up, we observed a dose-response association between dose trajectory and risk of fatal opioid overdose or nonfatal opioid overdose (Figure 3A-F). Within 2 to 4 years after the start of follow-up, patients exposed to any dose reduction or discontinuation had higher risk of incident OUD than those never exposed (gradual: HR, 1.30; 95% CI, 0.84 to 2.01; rapid: 1.52; 95% CI, 1.03 to 2.26), without evidence of a dose-response association (Figure 3D; eTable 7 in the Supplement). Sensitivity analyses using a subsample of patients with stable baseline dosing (eTables 8-10 in the Supplement) and of the nonfatal opioid overdose definition (eTables 11-13 in the Supplement) resulted in similar trends as seen in primary analyses.
Figure 3. Inverse Probability of Treatment and Censoring–Weighted Cumulative Incidence Curves and Hazard Ratios (HRs) by Exposure Status Using a 3-Level Exposure Coding.
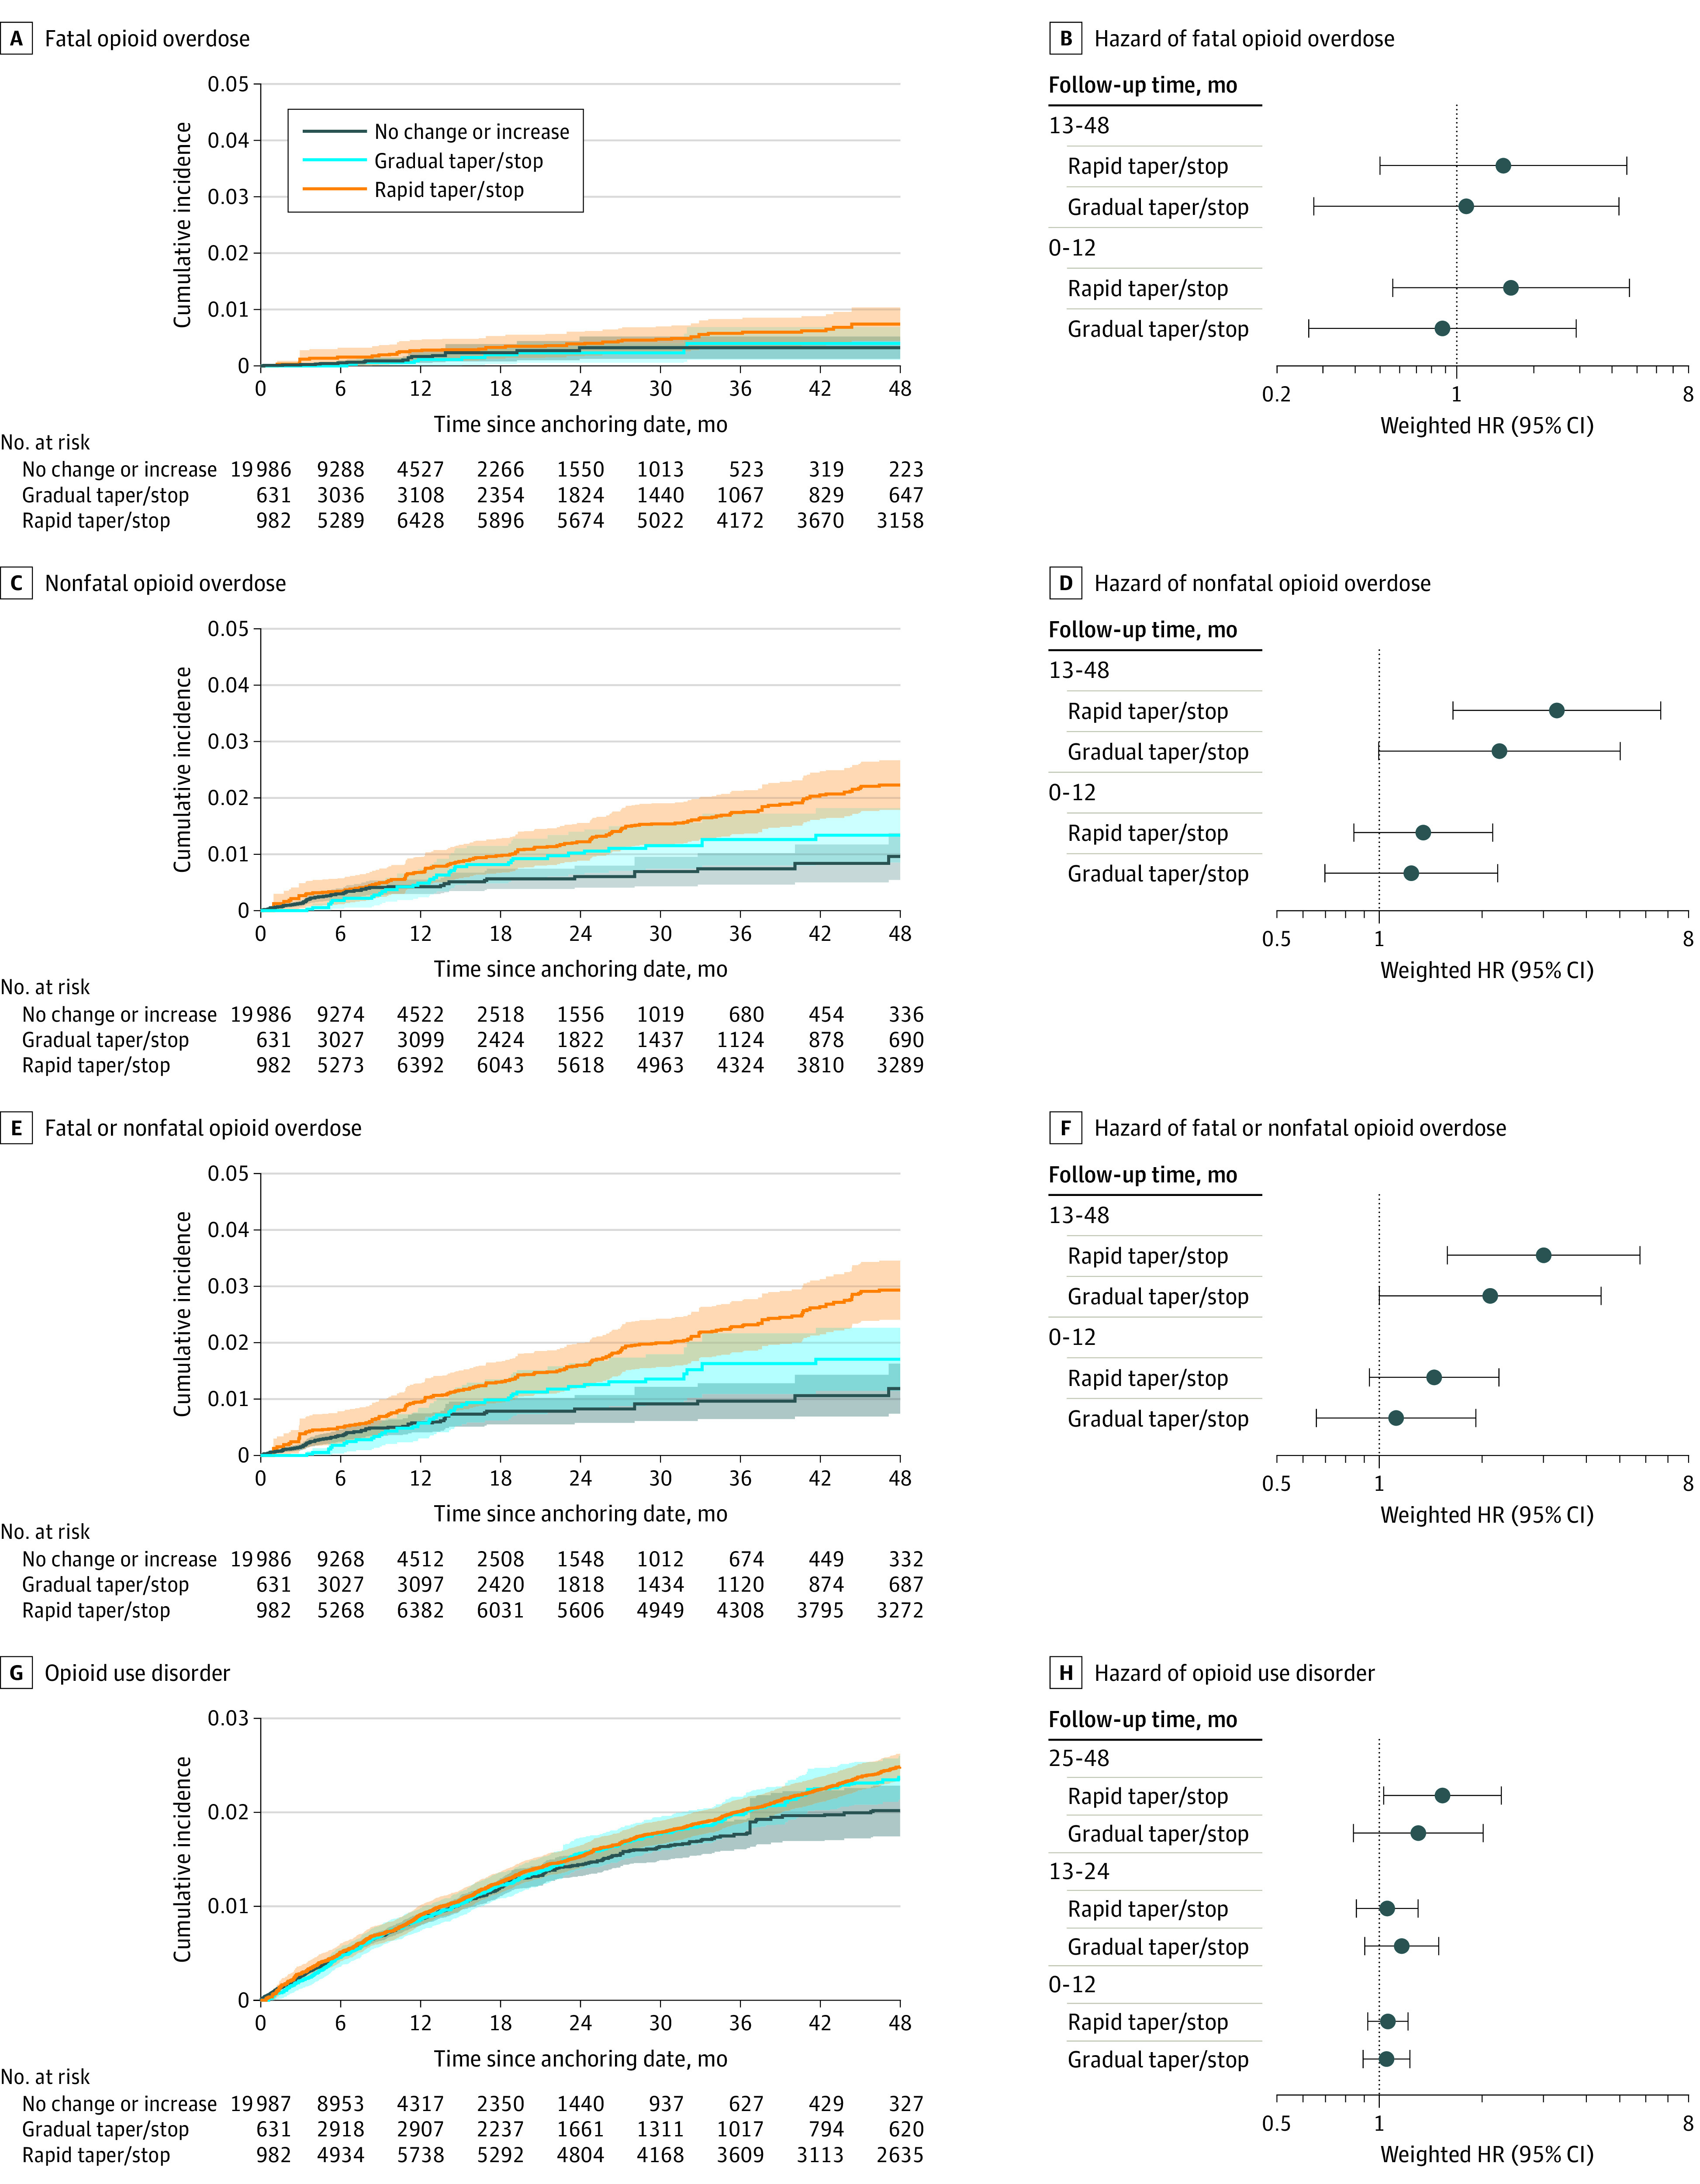
Among 19 443 patients receiving high-dose, long-term opioid therapy in North Carolina from 2006 to 2018. Shading indicates 95% CI.
Discussion
In this cohort study of privately insured patients in North Carolina with 12 years of data, we characterized incidence of fatal and nonfatal opioid overdoses and OUD among patients receiving HDLTOT whose dosages were reduced or discontinued more rapidly than recommended by CDC guidelines compared with patients whose opioid therapy was either maintained or gradually reduced or discontinued in a manner consistent with guidelines. Rapid reduction or discontinuation was associated with higher risk of opioid overdoses after the first year of follow-up, and the risk increased with longer follow-up time. When considered separately, those with gradual reduction or discontinuation had the lowest incidence of adverse outcomes during the first 6 to 9 months of follow-up; as follow-up progressed, those without dosage decreases had the lowest incidence, with rapid reduction or discontinuation demonstrating the highest incidence for all overdose outcomes and gradual reduction or discontinuation an intermediate incidence. OUD incidence did not differ between gradually and rapidly reduced patients and was considerably higher during 2 to 4 years of follow-up than among those who received a maintained or increasing opioid dose.
A 2021 study by Agnoli et al38 similarly found an association of opioid dose reduction rapidity with nonfatal opioid overdoses, although it did not examine fatal overdoses or OUD. Other studies have reported that opioid discontinuation was associated with increased overdose mortality,39,40 emergency department visits,41 and heroin use.17 We followed patients up to 4 years, thereby assessing the incidence of opioid-related harm over time in greater detail, and were able to examine both fatal and nonfatal overdoses as well as OUD. We also used a stringent definition to determine stable opioid prescribing, consistent with current CDC guidelines (≤10% change per week). Our study, along with prior studies, affirms the potential harms of rapid opioid dose reduction or discontinuation. Such findings have great importance for current policy and practice, as evidenced by recent CDC guidance warning against misapplication of CDC guidelines.18,42
When examining guideline-concordant gradual dose reduction separately, we found that gradual reductions had a protective association compared with maintained HDLTOT for 6 to 9 months. However, these associations disappeared after more than a year of HDLTOT, at which point even gradual reduction appeared to increase risk of adverse outcomes compared with sustained HDLTOT, although the increase was less than that for rapid discontinuation. The increased risk associated with gradual dose reduction may be owing to patients’ development of tolerance, after which even gradual reductions may lead to persistent uncontrolled pain,43 mental health concerns,38 and potential use of diverted or illicit opioids for pain management,17 thereby increasing risk of overdoses and OUD. Patients receiving HDLTOT whose medications are reduced or discontinued may feel stigmatized and even experience reduced access to care.43,44,45 Development of tolerance, along with the observation that most decreases occurred after 6 months of follow-up, may also help explain the lack of association between rapid dose reduction or discontinuation and opioid-related harms in the first year of follow-up. The long follow-up period in our study facilitates insights into implications for clinical decision-making for patients with HDLTOT.
Limitations
Our study has several limitations. First, while we developed a directed acyclic graph to control for measured confounding in this study, we could not address potential unmeasured confounding. However, our use of weighted marginal structural models is an important advance in controlling time-varying confounding without blocking causal mediation pathways,31,46,47 avoiding bias incurred by standard regression models used in prior studies. Second, we used ICD-9-CM and ICD-10-CM codes to identify OUD diagnoses, which have low sensitivity and typically underestimate OUD prevalence.48 However, this outcome misclassification is likely nondifferential, thereby biasing results toward the null. Similarly, there could be nondifferential underascertainment of nonfatal opioid overdoses in claims data, especially with use of naloxone in the community. Third, our privately insured patient sample may not be representative of patients with Medicaid, Medicare, or no insurance who receive long-term opioids. Fourth, claims data do not provide information on motivation for opioid dosage changes. Fifth, many patients disenrolled before the end of follow-up, and our approach relied on the assumption that IPTCW adequately accounted for informative censoring.
Conclusions
In this cohort study of privately insured patients receiving HDLTOT, we found that rapid dose reduction or discontinuation, in excess of CDC guidelines, was associated with increased risk of opioid overdose and OUD over 4 years of follow-up. Guideline-concordant gradual reduction or discontinuation had a protective association compared with maintaining or rapidly decreasing doses for the first 9 months of follow-up; however, in the longer term, maintenance of HDLTOT conferred the lowest risk of adverse outcomes compared with rapid decrease, which conferred the highest risk, and gradual decrease, which constituted an intermediate level of risk. These findings reinforce concerns about the safety of precipitous opioid dose reductions for patients receiving HDLTOT and highlight the need for clinicians to monitor patients closely in the long term when reducing opioid doses.
eMethods.
eTable 1. ICD-9-CM and ICD-10-CM Diagnostic Codes Used to Identify Opioid Overdose and Opioid Use Disorder (OUD) in Claims Data
eTable 2. Algorithm Used to Classify Monthly Prescription Trajectories
eTable 3. ICD-10 Codes Used to Identify Fatal Opioid Overdose in Linked Death Records
eTable 4. R Packages Used in Analyses
eTable 5. IPTCW Risk Differences (95% CI) for the Association Between Rapid Tapering or Discontinuation of Opioid Treatment and Outcomes at Multiple Points of Follow-up
eTable 6. Unweighted and IPTC-Weighted Hazard Ratios (HR) for Outcomes Comparing Patients Exposed to Rapid Tapering or Discontinuation vs Patients Who Had Their Dosage Maintained or Gradually Tapered or Discontinued
eTable 7. Unweighted and IPTC-Weighted Hazard Ratios (HR) for Outcomes Comparing Patients Exposed to Rapid Reduction or Discontinuation or Exposed to Gradual Reduction or Discontinuation vs Patients Who Had Their Dosage Maintained or Gradually Tapered or Discontinued
eTable 8. Outcome Frequency Overall and by Exposure Status Among a Subsample of 12 364 Patients Determined to Have Stable Baseline Dosing
eTable 9. IPTCW Risk Differences (95% CI) for the Association Between Rapid Tapering or Discontinuation of Opioid Treatment and Outcomes Among a Subsample of 12 364 Patients Determined to Have Stable Baseline Dosing at Multiple Points of Follow-up
eTable 10. Unweighted and IPTC-Weighted Hazard Ratios (HR) for Outcomes Comparing Patients Exposed to Rapid Tapering or Discontinuation vs Patients Who Had Their Dosage Maintained or Increased or Gradually Tapered or Discontinued Among a Subsample of 12 364 Patients Determined to Have Stable Baseline Dosing
eTable 11. Outcome Frequency Overall and by Exposure Status, Considering Only Nonfatal Opioid Overdoses Occurring During an Emergency Department or Inpatient Event
eTable 12. IPTCW Risk Differences (95% CI) for the Association Between Rapid Tapering or Discontinuation of Opioid Treatment and Overdose Outcomes, Considering Only Nonfatal Opioid Overdoses Occurring During an Emergency Department or Inpatient Event
eTable 13. Unweighted and IPTC-Weighted Hazard Ratios (HR) for Overdose Outcomes Comparing Patients Exposed to Rapid Tapering or Discontinuation vs Patients Who Had Their Dosage Maintained or Gradually Tapered or Discontinued, Considering Only Nonfatal Opioid Overdoses Occurring During an Emergency Department or Inpatient Event
eFigure 1. Death Match Algorithm
eFigure 2. Timelines of Eligibility and Exposure Ascertainment and Covariate and Outcome Ascertainment
eFigure 3. Crude Cumulative Incidence of Outcomes by Primary Exposure Status
eFigure 4. Crude Cumulative Incidence of Outcomes by Exposure Status Using a Categorical Exposure Definition
eReferences
References
- 1.Chou R, Turner JA, Devine EB, et al. The effectiveness and risks of long-term opioid therapy for chronic pain: a systematic review for a National Institutes of Health Pathways to Prevention Workshop. Ann Intern Med. 2015;162(4):276-286. doi: 10.7326/M14-2559 [DOI] [PubMed] [Google Scholar]
- 2.Chou RH, Turner J, Blazina I, et al. ; Agency for Healthcare Research and Quality . Opioid treatments for chronic pain. Updated February 2022. Accessed March 24, 2022. https://effectivehealthcare.ahrq.gov/products/opioids-chronic-pain/research [PubMed]
- 3.Substance Abuse and Mental Health Services Administration . Key substance use and mental health indicators in the United States: results from the 2019 National Survey on Drug Use and Health. Accessed March 24, 2022. https://www.samhsa.gov/data/report/2019-nsduh-annual-national-report
- 4.Increase in fatal drug overdoses across the United States driven by synthetic opioids before and during the COVID-19 pandemic. News release. Centers for Disease Control and Prevention . December 17, 2020. Accessed March 24, 2022. https://emergency.cdc.gov/han/2020/han00438.asp
- 5.Centers for Disease Control and Prevention . CDC WONDER. Accessed September 10, 2016. https://wonder.cdc.gov/
- 6.Crane EH. Highlights of the 2011 Drug Abuse Warning Network (DAWN) Findings on Drug-Related Emergency Department Visits. In: The CBHSQ Report. Substance Abuse and Mental Health Services Administration; 2013:1-9. [PubMed] [Google Scholar]
- 7.Centers for Disease Control and Prevention . Understanding the epidemic. Accessed September 10, 2016. https://www.cdc.gov/drugoverdose/epidemic/index.html
- 8.Katz J. Drug deaths in America are rising faster than ever. The New York Times. June 5, 2017. Accessed March 24, 2022. https://www.nytimes.com/interactive/2017/06/05/upshot/opioid-epidemic-drug-overdose-deaths-are-rising-faster-than-ever.html
- 9.Dowell D, Haegerich TM, Chou R. CDC guideline for prescribing opioids for chronic pain—United States, 2016. JAMA. 2016;315(15):1624-1645. doi: 10.1001/jama.2016.1464 [DOI] [PMC free article] [PubMed] [Google Scholar]
- 10.Staffa J, Meyer T, Secora A, McAninch J. Commentary on “Methodologic limitations of prescription opioid safety research and recommendations for improving the evidence base.” Pharmacoepidemiol Drug Saf. 2019;28(1):13-15. doi: 10.1002/pds.4650 [DOI] [PubMed] [Google Scholar]
- 11.Ranapurwala SI, Naumann RB, Austin AE, Dasgupta N, Marshall SW. Methodologic limitations of prescription opioid safety research and recommendations for improving the evidence base. Pharmacoepidemiol Drug Saf. 2019;28(1):4-12. doi: 10.1002/pds.4564 [DOI] [PubMed] [Google Scholar]
- 12.McGinty EE, Stuart EA, Caleb Alexander G, Barry CL, Bicket MC, Rutkow L. Protocol: mixed-methods study to evaluate implementation, enforcement, and outcomes of U.S. state laws intended to curb high-risk opioid prescribing. Implement Sci. 2018;13(1):37. doi: 10.1186/s13012-018-0719-8 [DOI] [PMC free article] [PubMed] [Google Scholar]
- 13.Maierhofer CN, Ranapurwala SI, DiPrete BL, et al. Association between statewide opioid prescribing interventions and opioid prescribing patterns in North Carolina, 2006-2018. Pain Med. 2021;22(12):2931-2940. doi: 10.1093/pm/pnab181 [DOI] [PMC free article] [PubMed] [Google Scholar]
- 14.Blackburn NA, Joniak-Grant E, Nocera M, et al. Implementation of mandatory opioid prescribing limits in North Carolina: healthcare administrator and prescriber perspectives. BMC Health Serv Res. 2021;21(1):1191. doi: 10.1186/s12913-021-07230-5 [DOI] [PMC free article] [PubMed] [Google Scholar]
- 15.Chou R, Ballantyne J, Lembke A. Rethinking opioid dose tapering, prescription opioid dependence, and indications for buprenorphine. Ann Intern Med. 2019;171(6):427-429. doi: 10.7326/M19-1488 [DOI] [PubMed] [Google Scholar]
- 16.Ranapurwala SI, Ringwalt CL, Pence BW, et al. State medical board policy and opioid prescribing: a controlled interrupted time series. Am J Prev Med. 2021;60(3):343-351. doi: 10.1016/j.amepre.2020.09.015 [DOI] [PMC free article] [PubMed] [Google Scholar]
- 17.Binswanger IA, Glanz JM, Faul M, et al. The association between opioid discontinuation and heroin use: a nested case-control study. Drug Alcohol Depend. 2020;217:108248. doi: 10.1016/j.drugalcdep.2020.108248 [DOI] [PMC free article] [PubMed] [Google Scholar]
- 18.Dowell D, Haegerich T, Chou R. No shortcuts to safer opioid prescribing. N Engl J Med. 2019;380(24):2285-2287. doi: 10.1056/NEJMp1904190 [DOI] [PMC free article] [PubMed] [Google Scholar]
- 19.Karmali RN, Bush C, Raman SR, Campbell CI, Skinner AC, Roberts AW. Long-term opioid therapy definitions and predictors: a systematic review. Pharmacoepidemiol Drug Saf. 2020;29(3):252-269. doi: 10.1002/pds.4929 [DOI] [PMC free article] [PubMed] [Google Scholar]
- 20.Shen Y, Bhagwandass H, Branchcomb T, et al. Chronic opioid therapy: a scoping literature review on evolving clinical and scientific definitions. J Pain. 2021;22(3):246-262. doi: 10.1016/j.jpain.2020.09.002 [DOI] [PubMed] [Google Scholar]
- 21.Dasgupta N, Wang Y, Bae J, et al. Inches, centimeters, and yards: overlooked definition choices inhibit interpretation of morphine equivalence. Clin J Pain. 2021;37(8):565-574. doi: 10.1097/AJP.0000000000000948 [DOI] [PMC free article] [PubMed] [Google Scholar]
- 22.Centers for Disease Control and Prevention . Analyzing prescription data and morphine milligram equivalents (MME). Accessed March 24, 2022. https://www.cdc.gov/opioids/data-resources/index.html
- 23.Ray GT, Bahorik AL, VanVeldhuisen PC, Weisner CM, Rubinstein AL, Campbell CI. Prescription opioid registry protocol in an integrated health system. Am J Manag Care. 2017;23(5):e146-e155. [PMC free article] [PubMed] [Google Scholar]
- 24.Conover MM, Stürmer T, Poole C, et al. Classifying medical histories in US Medicare beneficiaries using fixed vs all-available look-back approaches. Pharmacoepidemiol Drug Saf. 2018;27(7):771-780. doi: 10.1002/pds.4435 [DOI] [PMC free article] [PubMed] [Google Scholar]
- 25.Brunelli SM, Gagne JJ, Huybrechts KF, et al. Estimation using all available covariate information versus a fixed look-back window for dichotomous covariates. Pharmacoepidemiol Drug Saf. 2013;22(5):542-550. doi: 10.1002/pds.3434 [DOI] [PMC free article] [PubMed] [Google Scholar]
- 26.Cole SR, Lau B, Eron JJ, et al. ; CNICS Research Network . Estimation of the standardized risk difference and ratio in a competing risks framework: application to injection drug use and progression to AIDS after initiation of antiretroviral therapy. Am J Epidemiol. 2015;181(4):238-245. doi: 10.1093/aje/kwu122 [DOI] [PMC free article] [PubMed] [Google Scholar]
- 27.Cole SR, Hudgens MG, Brookhart MA, Westreich D. Risk. Am J Epidemiol. 2015;181(4):246-250. doi: 10.1093/aje/kwv001 [DOI] [PMC free article] [PubMed] [Google Scholar]
- 28.Bernard SA, Chelminski PR, Ives TJ, Ranapurwala SI. Management of pain in the United States—a brief history and implications for the opioid epidemic. Health Serv Insights. 2018;11:1178632918819440. doi: 10.1177/1178632918819440 [DOI] [PMC free article] [PubMed] [Google Scholar]
- 29.United States Census Bureau . 2019 American Community Survey: demographic and housing estimates. Accessed May 20, 2021. https://data.census.gov/cedsci/table?y=2019&d=ACS%205-Year%20Estimates%20Data%20Profiles&tid=ACSDP5Y2019.DP05
- 30.US Department of Agriculture Economic Research Service . 2010 Rural-Urban Commuting Area Codes. Accessed May 20, 2021. https://www.ers.usda.gov/data-products/rural-urban-commuting-area-codes.aspx
- 31.Robins JM, Hernán MA, Brumback B. Marginal structural models and causal inference in epidemiology. Epidemiology. 2000;11(5):550-560. doi: 10.1097/00001648-200009000-00011 [DOI] [PubMed] [Google Scholar]
- 32.Hernán MA, Brumback B, Robins JM. Marginal structural models to estimate the causal effect of zidovudine on the survival of HIV-positive men. Epidemiology. 2000;11(5):561-570. doi: 10.1097/00001648-200009000-00012 [DOI] [PubMed] [Google Scholar]
- 33.Cole SR, Hernán MA. Constructing inverse probability weights for marginal structural models. Am J Epidemiol. 2008;168(6):656-664. doi: 10.1093/aje/kwn164 [DOI] [PMC free article] [PubMed] [Google Scholar]
- 34.Fine JP, Gray RJ. A proportional hazards model for the subdistribution of a competing risk. J Am Stat Assoc. 1999;94(446):496-509. doi: 10.1080/01621459.1999.10474144 [DOI] [Google Scholar]
- 35.Geskus RB. Cause-specific cumulative incidence estimation and the fine and gray model under both left truncation and right censoring. Biometrics. 2011;67(1):39-49. doi: 10.1111/j.1541-0420.2010.01420.x [DOI] [PubMed] [Google Scholar]
- 36.Estimation EB. Estimation and accuracy after model selection. J Am Stat Assoc. 2014;109(507):991-1007. doi: 10.1080/01621459.2013.823775 [DOI] [PMC free article] [PubMed] [Google Scholar]
- 37.Efron B. Efficiency of Coxs likelihood function for censored data. J Am Stat Assoc. 1977;72(359):557-565. doi: 10.1080/01621459.1977.10480613 [DOI] [Google Scholar]
- 38.Agnoli A, Xing G, Tancredi DJ, Magnan E, Jerant A, Fenton JJ. Association of dose tapering with overdose or mental health crisis among patients prescribed long-term opioids. JAMA. 2021;326(5):411-419. doi: 10.1001/jama.2021.11013 [DOI] [PMC free article] [PubMed] [Google Scholar]
- 39.Oliva EM, Bowe T, Manhapra A, et al. Associations between stopping prescriptions for opioids, length of opioid treatment, and overdose or suicide deaths in US veterans: observational evaluation. BMJ. 2020;368:m283. doi: 10.1136/bmj.m283 [DOI] [PMC free article] [PubMed] [Google Scholar]
- 40.James JR, Scott JM, Klein JW, et al. Mortality after discontinuation of primary care-based chronic opioid therapy for pain: a retrospective cohort study. J Gen Intern Med. 2019;34(12):2749-2755. doi: 10.1007/s11606-019-05301-2 [DOI] [PMC free article] [PubMed] [Google Scholar]
- 41.Mark TL, Parish W. Opioid medication discontinuation and risk of adverse opioid-related health care events. J Subst Abuse Treat. 2019;103:58-63. doi: 10.1016/j.jsat.2019.05.001 [DOI] [PubMed] [Google Scholar]
- 42.Dowell D, Compton WM, Giroir BP. Patient-centered reduction or discontinuation of long-term opioid analgesics: the HHS guide for clinicians. JAMA. 2019;322(19):1855-1856. doi: 10.1001/jama.2019.16409 [DOI] [PMC free article] [PubMed] [Google Scholar]
- 43.Mueller SR, Glanz JM, Nguyen AP, et al. Restrictive opioid prescribing policies and evolving risk environments: a qualitative study of the perspectives of patients who experienced an accidental opioid overdose. Int J Drug Policy. 2021;92:103077. doi: 10.1016/j.drugpo.2020.103077 [DOI] [PMC free article] [PubMed] [Google Scholar]
- 44.Dassieu L, Heino A, Develay É, et al. “They think you’re trying to get the drug”: qualitative investigation of chronic pain patients’ health care experiences during the opioid overdose epidemic in Canada. Can J Pain. 2021;5(1):66-80. doi: 10.1080/24740527.2021.1881886 [DOI] [PMC free article] [PubMed] [Google Scholar]
- 45.Benintendi A, Kosakowski S, Lagisetty P, Larochelle M, Bohnert ASB, Bazzi AR. “I felt like I had a scarlet letter”: recurring experiences of structural stigma surrounding opioid tapers among patients with chronic, non-cancer pain. Drug Alcohol Depend. 2021;222:108664. doi: 10.1016/j.drugalcdep.2021.108664 [DOI] [PMC free article] [PubMed] [Google Scholar]
- 46.Hallgren KA, Witwer E, West I, et al. Prevalence of documented alcohol and opioid use disorder diagnoses and treatments in a regional primary care practice-based research network. J Subst Abuse Treat. 2020;110:18-27. doi: 10.1016/j.jsat.2019.11.008 [DOI] [PMC free article] [PubMed] [Google Scholar]
- 47.Wu LT, McNeely J, Subramaniam GA, et al. DSM-5 substance use disorders among adult primary care patients: results from a multisite study. Drug Alcohol Depend. 2017;179:42-46. doi: 10.1016/j.drugalcdep.2017.05.048 [DOI] [PMC free article] [PubMed] [Google Scholar]
- 48.Ranapurwala SI, Alam IZ, Pence BW, et al. Development and validation of an electronic health records-based opioid use disorder algorithm by expert clinical adjudication. MedRxiv. Preprint posted online September 26, 2021. doi: 10.1101/2021.09.23.21264021 [DOI] [PMC free article] [PubMed]
Associated Data
This section collects any data citations, data availability statements, or supplementary materials included in this article.
Supplementary Materials
eMethods.
eTable 1. ICD-9-CM and ICD-10-CM Diagnostic Codes Used to Identify Opioid Overdose and Opioid Use Disorder (OUD) in Claims Data
eTable 2. Algorithm Used to Classify Monthly Prescription Trajectories
eTable 3. ICD-10 Codes Used to Identify Fatal Opioid Overdose in Linked Death Records
eTable 4. R Packages Used in Analyses
eTable 5. IPTCW Risk Differences (95% CI) for the Association Between Rapid Tapering or Discontinuation of Opioid Treatment and Outcomes at Multiple Points of Follow-up
eTable 6. Unweighted and IPTC-Weighted Hazard Ratios (HR) for Outcomes Comparing Patients Exposed to Rapid Tapering or Discontinuation vs Patients Who Had Their Dosage Maintained or Gradually Tapered or Discontinued
eTable 7. Unweighted and IPTC-Weighted Hazard Ratios (HR) for Outcomes Comparing Patients Exposed to Rapid Reduction or Discontinuation or Exposed to Gradual Reduction or Discontinuation vs Patients Who Had Their Dosage Maintained or Gradually Tapered or Discontinued
eTable 8. Outcome Frequency Overall and by Exposure Status Among a Subsample of 12 364 Patients Determined to Have Stable Baseline Dosing
eTable 9. IPTCW Risk Differences (95% CI) for the Association Between Rapid Tapering or Discontinuation of Opioid Treatment and Outcomes Among a Subsample of 12 364 Patients Determined to Have Stable Baseline Dosing at Multiple Points of Follow-up
eTable 10. Unweighted and IPTC-Weighted Hazard Ratios (HR) for Outcomes Comparing Patients Exposed to Rapid Tapering or Discontinuation vs Patients Who Had Their Dosage Maintained or Increased or Gradually Tapered or Discontinued Among a Subsample of 12 364 Patients Determined to Have Stable Baseline Dosing
eTable 11. Outcome Frequency Overall and by Exposure Status, Considering Only Nonfatal Opioid Overdoses Occurring During an Emergency Department or Inpatient Event
eTable 12. IPTCW Risk Differences (95% CI) for the Association Between Rapid Tapering or Discontinuation of Opioid Treatment and Overdose Outcomes, Considering Only Nonfatal Opioid Overdoses Occurring During an Emergency Department or Inpatient Event
eTable 13. Unweighted and IPTC-Weighted Hazard Ratios (HR) for Overdose Outcomes Comparing Patients Exposed to Rapid Tapering or Discontinuation vs Patients Who Had Their Dosage Maintained or Gradually Tapered or Discontinued, Considering Only Nonfatal Opioid Overdoses Occurring During an Emergency Department or Inpatient Event
eFigure 1. Death Match Algorithm
eFigure 2. Timelines of Eligibility and Exposure Ascertainment and Covariate and Outcome Ascertainment
eFigure 3. Crude Cumulative Incidence of Outcomes by Primary Exposure Status
eFigure 4. Crude Cumulative Incidence of Outcomes by Exposure Status Using a Categorical Exposure Definition
eReferences