

Abstract
Objective.
The health benefits of exercise are well documented, but several exercise response parameters are attenuated in individuals with obesity. The goal of this pilot study was to identify molecular mechanisms that may influence exercise response with obesity.
Methods.
We performed a multi-omics comparison of the transcriptome, proteome and phosphoproteome in muscle from a preliminary cohort of lean (N=4) and people with obesity (N=4) before and after a single bout of 30 minutes of unilateral cycling at 70% VO2peak. Mass spectrometry and RNA sequencing were used to interrogate the proteome, phosphoproteome, and transcriptome from muscle biopsy tissue.
Results.
The main findings are that individuals with obesity exhibited transcriptional and proteomic signatures consistent with reduced mitochondrial function, protein synthesis, and glycogen synthesis. Furthermore, individuals with obesity demonstrated markedly different transcriptional, proteomic, and phosphoproteomic responses to exercise, particularly biosynthetic pathways of glycogen synthesis and protein synthesis. We identified protein kinase CK2 and GSK3β signaling as exercise responsive pathways that were notably altered by obesity.
Conclusions.
Opportunities to enhance exercise responsiveness by targeting specific molecular pathways that are disrupted in skeletal muscle from individuals with obesity awaits a better understanding of the precise molecular mechanisms that may limit exercise response pathways in obesity.
Keywords: Obesity, exercise, skeletal muscle
INTRODUCTION
Alarming trends of obesity continue worldwide (1). Skeletal muscle from individuals with obesity exhibits phenotypic traits including mitochondrial impairments (2), oxidative stress (3), and insulin resistance (4) that contribute to comorbidities (5). These traits, along with the key role of skeletal muscle in macronutrient metabolism, have motivated initiatives to target muscle health as a strategy for obesity. Exercise enhances mitochondrial function (6), upregulates antioxidants (7), and enhances insulin sensitivity (8) and overall metabolic health (9), but there is considerable heterogeneity in the response to exercise. Analysis of 8 different exercise training studies demonstrates heterogeneity in individual responses of cardiorespiratory fitness (10). These studies sparked debate over the concept of exercise non-responders and how to define classes of responders to training. Fewer studies have interrogated the effects of obesity on molecular and cellular events in skeletal muscle following exercise. While there is general consensus that individuals with obesity exhibit attenuated anabolic responses to nutritional stimuli (11; 12), the effects of obesity on anabolic response to exercise are less clear. People with obesity exhibit blunted anabolic response to a single bout of resistance exercise based on measurements of myofibrillar protein synthesis and anabolic signaling pathways (13). Others demonstrated attenuated expression and phosphorylation of key regulators of mitochondrial biogenesis in obese compared to lean following acute exercise (14). In contrast, others suggest that the anabolic response to resistance exercise is unimpaired in young, active adults with obesity (15), emphasizing the need for additional painstakingly controlled studies to help resolve this question. Despite some evidence that notable elements of exercise response are attenuated in skeletal muscle from individuals with obesity, the precise molecular mechanisms contributing to this phenomenon are not currently understood. A long-term goal is to identify opportunities to enhance exercise responsiveness by targeting specific molecular pathways that are disrupted in skeletal muscle from individuals with obesity. As an early step toward that goal, we performed a quantitative multi-omics comparison of the transcriptome, proteome and phosphoproteome in muscle tissue from lean and individuals with obesity before and after an acute bout of endurance exercise.
METHODS
Study design, consent, and screening.
Muscle samples from 4 lean (BMI: 22±2 kg/m2, 2 male, 2 female) and 4 adults with obesity (BMI: 37±3 kg/m2, 4 female) were analyzed from previously published study (16). Participants were recruited from Southeast Minnesota. Participants did not engage in structured exercise (<30 min of exercise 3 times per week) and were weight-stable. Participants were excluded if they had diabetes, cardiovascular disease, kidney disease, untreated thyroid disease, or blood clotting disorders. Additional exclusion criteria included pregnant or breastfeeding females, smokers, and substance abuse disorders. The study was registered under Clinical Trial Number NCT02732509, approved by the Mayo Foundation Institutional Review Board, and conformed to principles of the Declaration of Helsinki.
Outpatient testing.
Following consent and screening, participants underwent body composition measurements by dual-energy x-ray absorptiometry (DEXA, Lunar iDXA, GE Healthcare) and whole-body oxygen consumption (VO2 peak) was measured during single-leg recumbent cycling using the left leg. The ergometer was equipped with a weighted pedal on the right side to provide a counterweight during cycling. Due to logistics of the ergometer configuration, the resting and exercised legs were not randomized. The initial workload was set to 25 watts for 2 minutes, followed by a ramped increase in workload of 10 watt increments every 60 seconds. Breath-by-breath indirect calorimetry (Ultima CPX, Medical Graphics) was used to determine VO2 peak. The test was terminated when participants were unable to maintain 60 revolutions per minute despite strong encouragement. VO2 peak was identified as the highest average VO2 over a 15s interval.
Inpatient study.
At least 7 days following the outpatient testing, participants were admitted to the Clinical Research and Trials Unit (CRTU). For 3 days prior, participants were provided with all meals to achieve energy balance with standardized macronutrient composition (20% protein, 50% carbohydrate, 30% fat). On the third day of standardized meals, participants reported to the CRTU at approximately 1700h. An evening meal was provided at 1800h, and participants remained fasting overnight until completion of the muscle biopsy the following day. At 0800h the following morning, a percutaneous biopsy of the right vastus lateralis was performed under local anesthesia (2% lidocaine). Participants were provided with meals for the remainder of the day and remained fasting overnight. At 0600h the following morning, participants performed 30 minutes of single-leg cycling at a workload corresponding to 70% of single-leg VO2 peak using the left leg. A muscle biopsy was performed on the exercised leg 3.5 hours following completion of the exercise bout. The two-day inpatient period with resting and postexercise biopsies performed on separate days was required to accommodate the additional outcomes pertinent to the aims of the parent project, some of which have been published previously (16) and others ongoing.
RNAseq.
RNA was extracted using the Qiagen RNeasy mRNA extraction kit and sent to the Genome Analysis Core for sequencing as previously described (17; 18). Libraries were prepared using the Illumina Stranded mRNA Prep and sequenced on an Illumina HiSeq 4000. Reads were aligned using STAR RNA-seq aligner to hg38 genome build. The gene and exon counts were generated by FeatureCounts. Differential expression analysis was carried out using a negative binomial generalized log-linear model in the edgeR R package. Sequencing data are available in the Gene Expression Omnibus database (GEO number GSE185957).
Proteomics and phosphoproteomics.
Protein was extracted, digested, and fractionated from frozen muscle samples, and phosphopeptide enrichment was performed as described in supplemental materials. Muscle peptides were labeled using the Tandem Mass Tag (TMT) system before LC-MS/MS analysis using an Orbitrap Fusion Lumos mass spectrometer. Additional analytical parameters and details of the global proteomics and phosphoproteomics are provided in supplemental materials.
Data Analysis.
MS raw files were processed in MaxQuant software version 1.6.12 (19). Peptides were searched using the Andromeda search engine against the human Uniprot FASTA database downloaded July 24th, 2019. Search types were set to reporter ion MS3 and reporter ion MS2 for global proteome and phosphoproteome analysis respectively. For global and phospho analysis cysteine carbamidomethylation was set as a fixed modification and N-terminal acetylation, methionine oxidation and phosphorylated serine, threonine and tyrosine were set as variable modifications. Searches were performed with a false discovery rate of 1% for both peptides and proteins using a target-decoy approach. Peptide length was set to at least 7 amino acids long and MS2 match tolerance was set to 0.5Da for global proteome data and 0.02Da for phosphoproteome data. Enzyme specificity was set to trypsin and a maximum of 2 missed cleavages were allowed. Protein data was extracted from the “proteinGroups.txt” file and differential quantitation was carried using a generalized linear model as previously described (20).
Gene Set Enrichment Analysis.
Gene set enrichment analysis was performed using Broads GSEA software. All gene sets that were negatively enriched with an FDR corrected p-value (using the Benjamini-Hochberg procedure) < 0.05 were reported. Phosphorylation site specific signature analysis was performed using PTM signature enrichment analysis (PTM-SEA) (21) with PTMSigDB version 1.9.0. All perturbation signatures, signature sets of molecular signaling pathways, kinase substrate signatures and disease-associated signature sets with an FDR corrected p-value < 0.1 were reported.
WGCNA.
The transcript, proteome and phosphoproteome data were z-transformed, merged and analyzed by weighted gene co-expression network analysis (WGCNA) (22). Briefly, a Pearson correlation matrix was calculated and both positive and negative correlations were accepted. Eigen genes were calculated as a consensus trend for each module and additional molecules were assigned based on Pearson correlation values. The four modules most significantly correlated with obesity status and exercise timepoint were subjected to gene level pathway analysis in CludGO (23). Pathway analysis in ClueGo was performed using a two-sided hypergeometric test using information obtained from Kegg. All pathways with a Bonferroni step down adjusted p-value < 0.05 were accepted. To identify networks of regulated molecules that affect phosphorylation signaling all kinases and phosphatases assigned to network modules with a significant association to obesity status or exercise timepoint were selected and subjected to hierarchical clustering. Networks of regulated transcription factors were identified using the same approach.
RESULTS
Quantitative multi-omic comparison of skeletal muscle from individuals with obesity compared to lean.
Of the 4,981 proteins detected in non-exercised muscle, 64 were upregulated and 51 were downregulated (adjusted p-value < 0.05, log2(fold-change) > ±0.5) with obesity (Figure 1A). At the mRNA level, 13,175 transcripts were identified, of which 97 were upregulated and 65 were downregulated with obesity (Figure 1B). To investigate systems-level pathway alterations in skeletal muscle from individuals with obesity, we identified enriched gene sets in the proteomics and RNA sequencing data using gene set enrichment analysis (GSEA) (Figure 1C). Gene sets related to mitochondrial translation and oxidative phosphorylation were negatively enriched with obesity. Several gene sets related to protein translation, ribosome, and amino acid metabolism were downregulated with obesity at the transcript, but not protein level. Conversely, several proteins involved in protein translation including EIF4G3, EIF2B5, EIF4A2 and EIF4G1were upregulated with obesity. The specific molecules contributing to the enrichment of individual gene sets are provided in Table S1 (RNA) and Table S2 (Protein). At the phosphorylation level, 9,455 distinct phosphosites were detected with 139 upregulated and 51 downregulated with obesity (Figure 1D). Phosphosite-centric kinase activity enrichment using PTM-SEA (21) identified significant regulation (FDR < 0.1) of several kinases with obesity. Inferred kinase activities for PAK1, ERK1/MAPK3, GSK3B and PRAKA were downregulated with obesity while the activities of others such as p90RSK/RPS6KA1, PLK1, AKT1, PKCA/PRKCA and CDK1 were upregulated (Figure 1E, Table S3).
Figure 1: Pre-exercise skeletal muscle transcriptome and proteome in individuals with and without obesity.
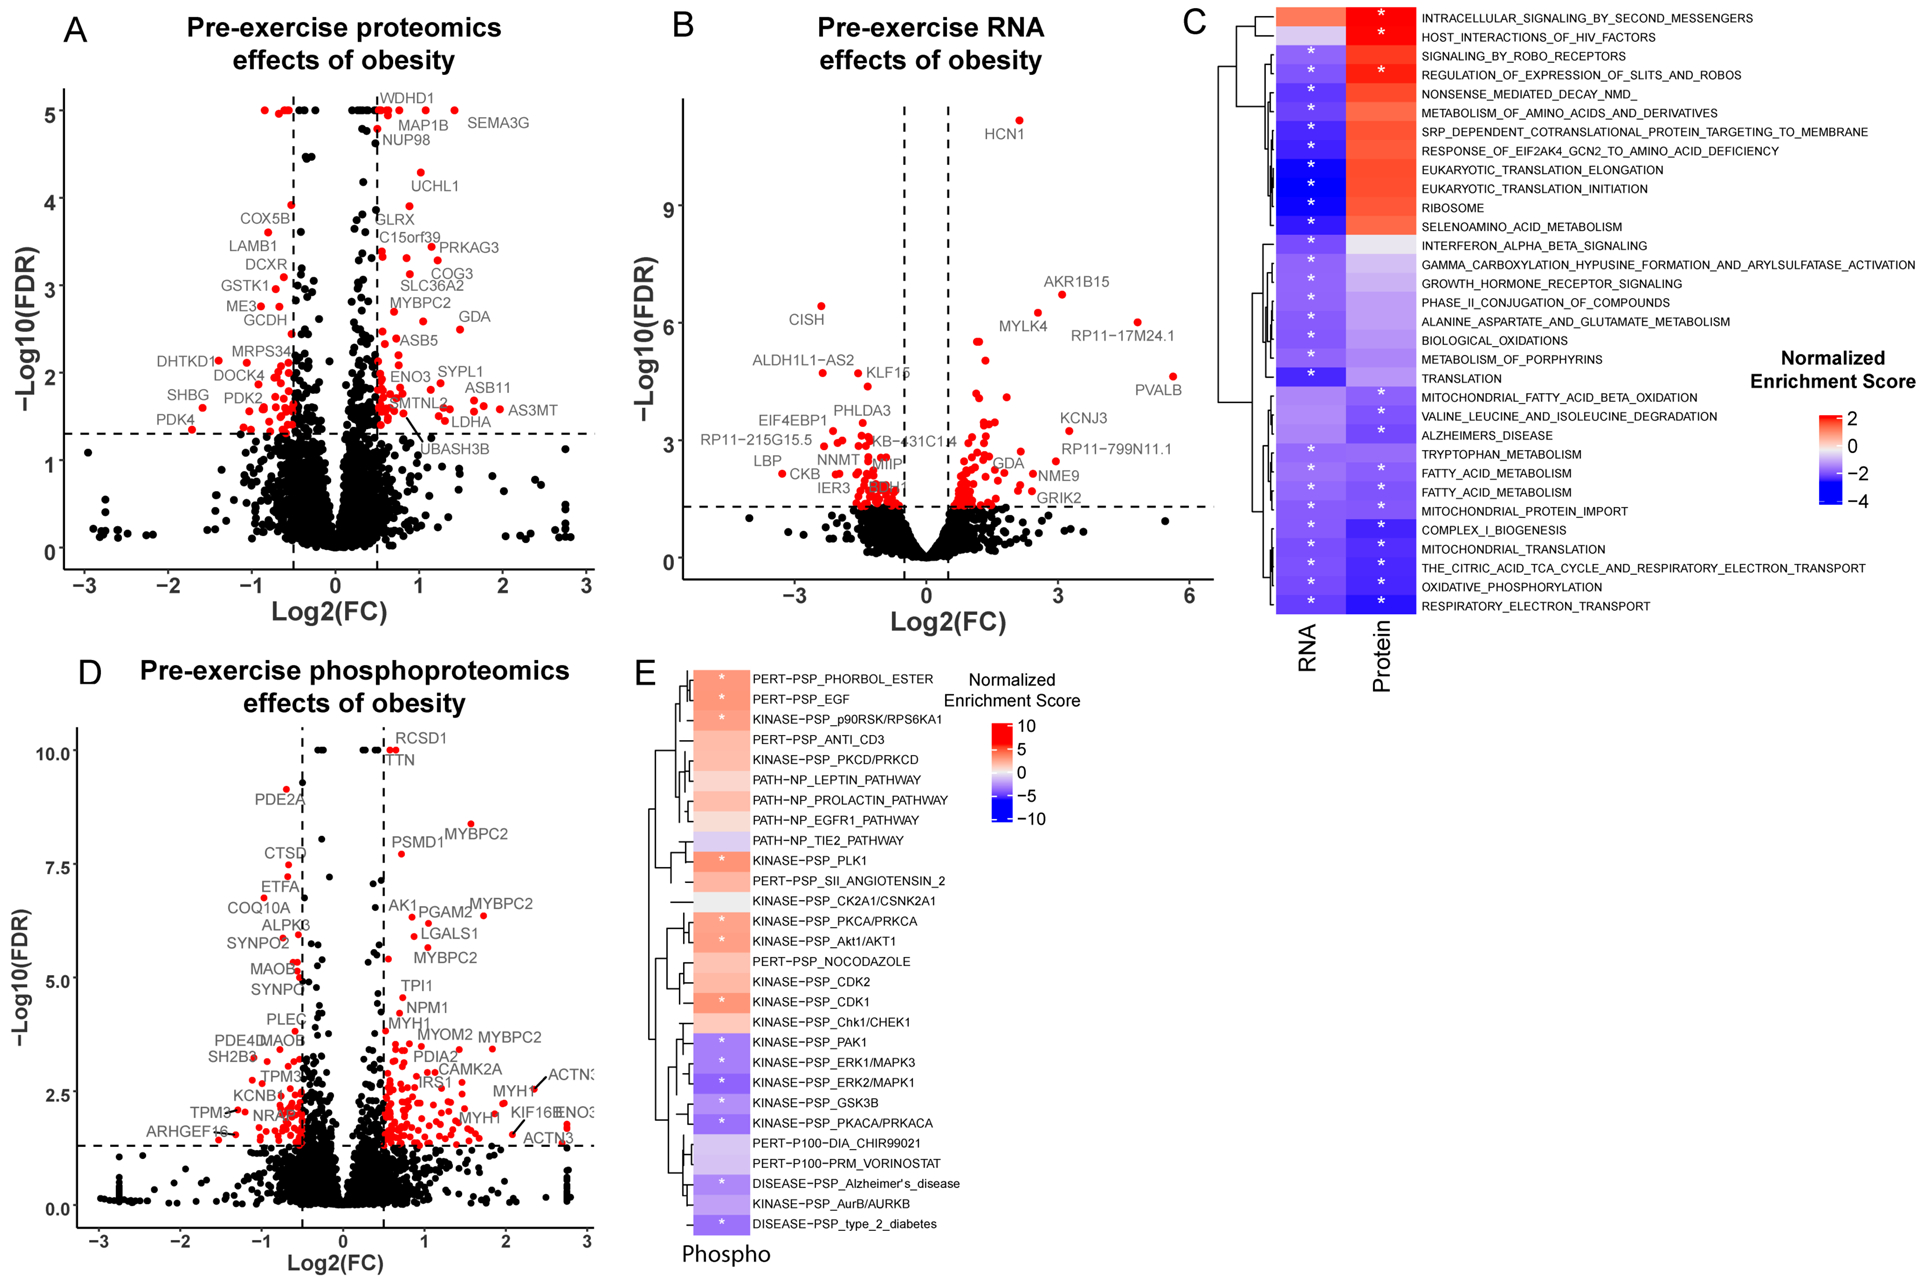
(A-C) Volcano plots illustrating differences in protein (A), mRNA (B) and phosphopeptide (D) abundance between individuals with and without obesity. The x-axis indicates the log2(fold-change) and the y-axis indicates the significance (−log10(FDR)). Positive log2(fold-change) indicates increased abundance in individuals with obesity compared to lean individuals. Changes with a higher significance than the maximum value on the y-axis are plotted at the max value. (C) Enriched gene sets from the baseline mRNA and protein differential comparison identified by gene set enrichment analysis (GSEA) are displayed in a heatmap. Enriched phosphorylation signatures obtained from PTM-signature enriched enrichment analysis (PTM-SEA) are displayed in a heatmap (E) to illustrate effects of obesity on signaling pathways at baseline. Coloring represents the normalized enrichment score, with all significantly enriched gene sets indicated with an asterisk.
Obesity modifies the molecular response to acute aerobic exercise.
Global proteomics, phosphoproteomics, and RNA sequencing were used to evaluate the molecular responses to acute exercise. In lean, 419 transcripts were upregulated and 132 were downregulated after exercise (Figure 2 A–C). Only 82 transcripts were increased and 22 were decreased after exercise in people with obesity, with modest overlap (54 up, 9 down) in differentially expressed genes in lean and people with obesity (Figure 2C). To visualize the magnitude of gene expression changes between the two groups, we generated heatmaps of molecules that were differentially expressed in lean alongside corresponding z-scores for people with obesity (Figure 2D, left) and molecules that were differentially expressed in with obesity alongside corresponding z-scores for lean (Figure 2D, right).
Figure 2: Skeletal muscle transcriptome changes after exercise in individuals with and without obesity.
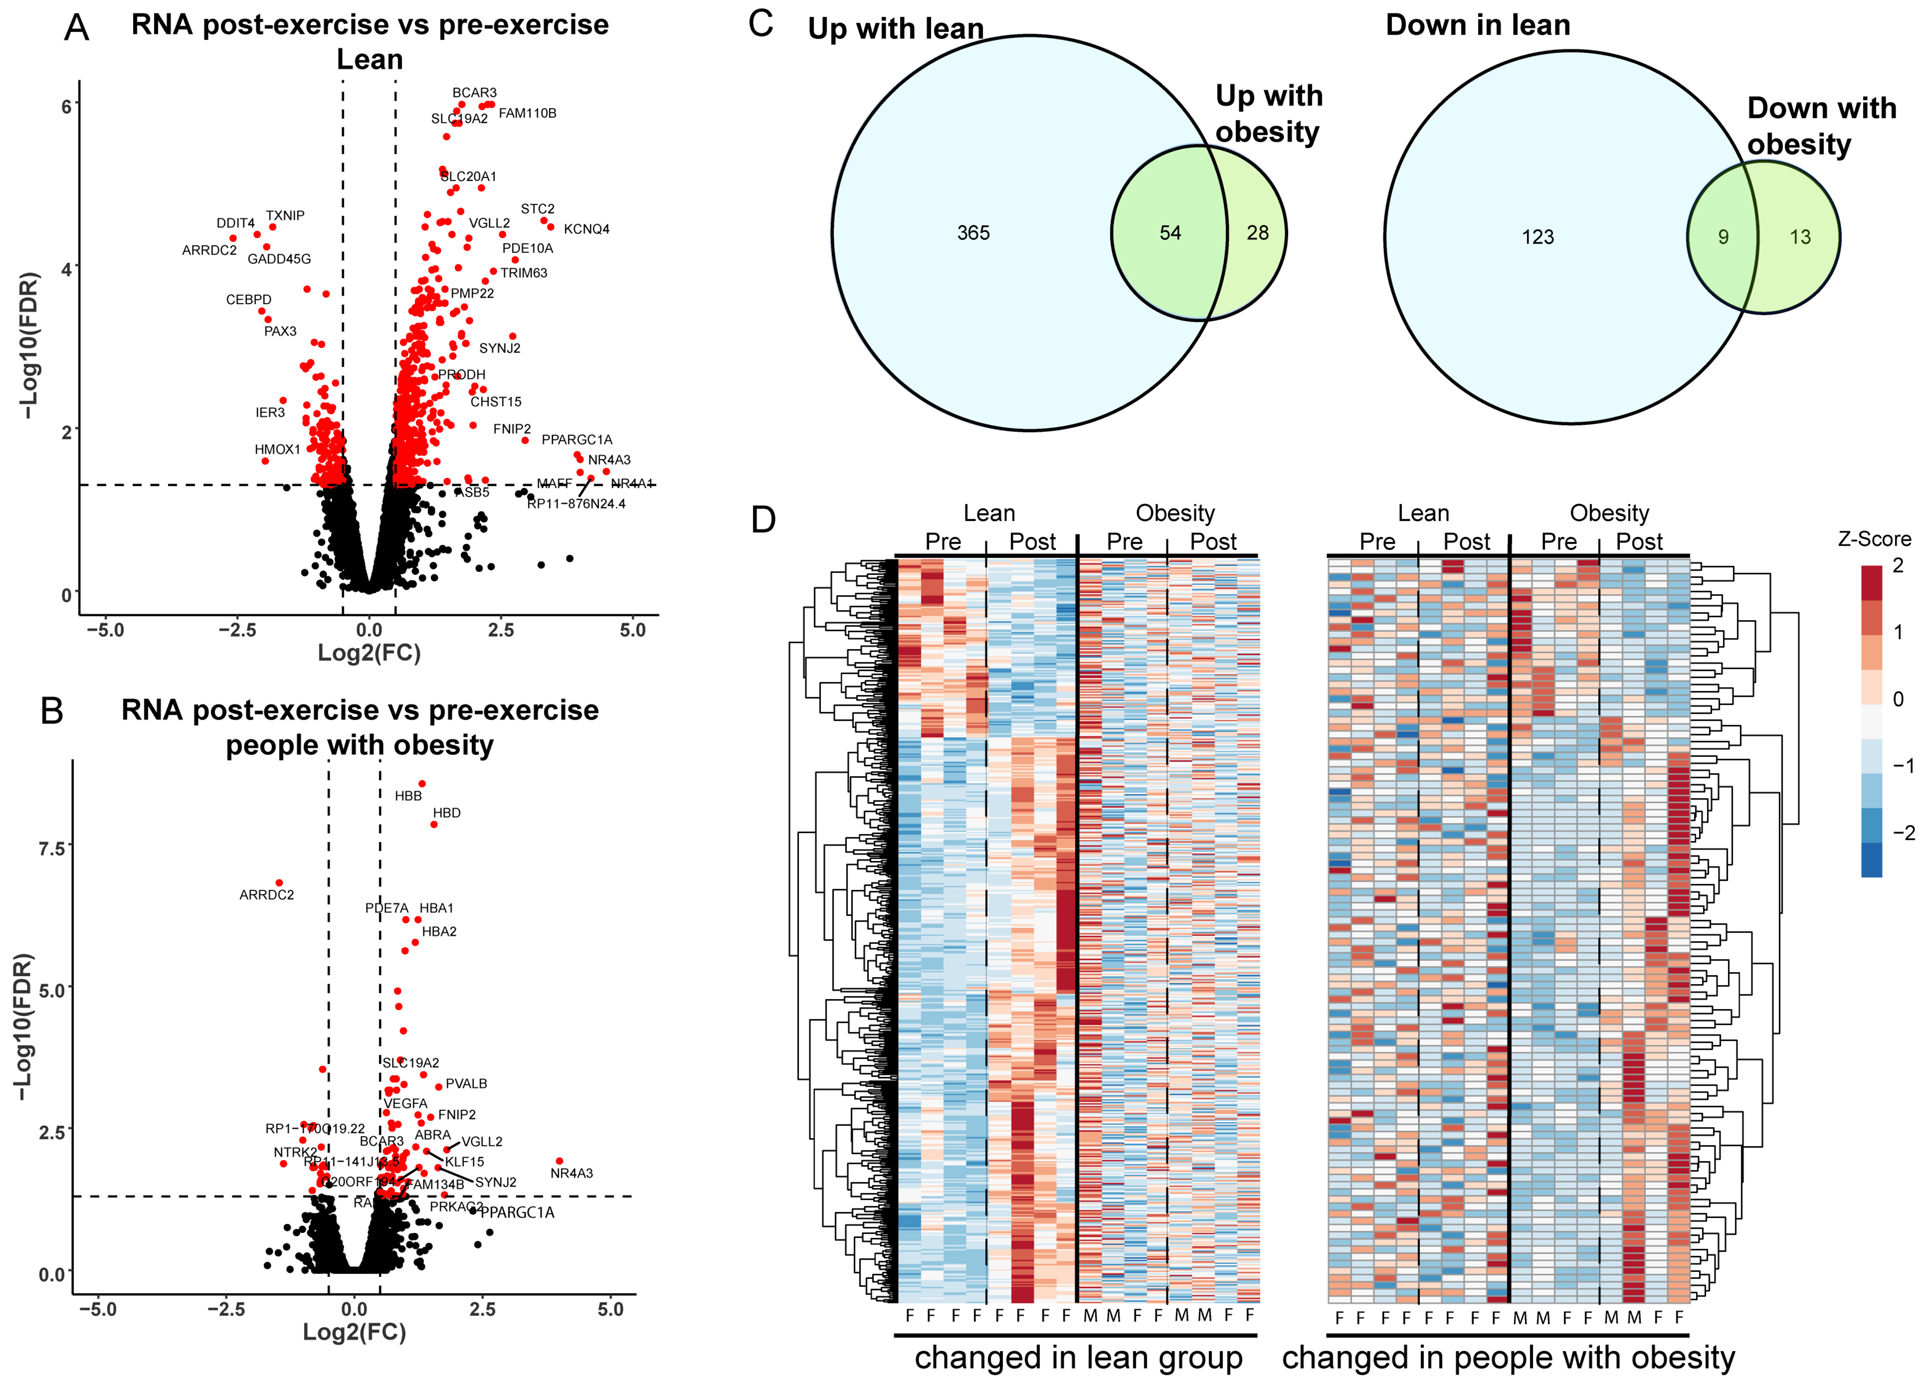
Differences in transcript abundance after exercise are displayed in volcano plots for lean (A) and people with obesity (B). The x-axis indicates the log2(fold-change) and the y-axis indicates the significance (−log10(FDR)). Positive log2(fold-change) indicates an increase in transcript abundance after exercise. (C) Transcripts which are upregulated (left) and downregulated (right) after exercise are compared between groups with a Venn-diagram. (D) Transcripts significantly altered after exercise are clustered and displayed in a heatmap. (Left) Transcripts altered by exercise in lean individuals are displayed with the corresponding changes in individuals with obesity to illustrate differences in the response to exercise between the two groups. (Right) Transcripts significantly altered in individuals with obesity are shown with corresponding changes in lean individuals. Heatmap lanes corresponding to males are indicated with an M. Heatmap lanes corresponding to females are indicated with an F.
Unique responses to exercise in each group were also observed at the protein level where lean upregulated 68 proteins and downregulated 18 proteins, whereas individuals with obesity upregulated 20 and downregulated 40 proteins (Figure 3 A–C), corresponding to only modest overlap (5 up, 5 down) of differentially expressed proteins in the two groups (Figure 3C). The heatmaps in Figure 3E show the variability in protein abundance within groups, but also similar directionality of proteomic responses in both groups, albeit blunted with obesity. We performed gene-centric pathway enrichment using GSEA and merged transcript and protein results in a heatmap to visualize coordinated pathway changes (Figure 3D). At the transcript level, multiple gene sets were significantly regulated in lean but not people with obesity, including downregulation of multiple gene sets related to mitochondrial translation and oxidative phosphorylation and upregulation of signaling by receptor tyrosine kinases. Notably, obese exhibited no regulated gene sets at the transcript level, but multiple gene sets were regulated at the protein level, including downregulation of gene sets related protein translation including ribosome and eukaryotic translation initiation. Upregulated gene sets after exercise in the people with obesity were related to proteasomal degradation. The specific molecules contributing to the enrichment of individual gene sets are provided in Table S4 (RNA lean) Table S5 (RNA obese), Table S6 (Protein lean), and Table S7 (Protein obese).
Figure 3: Muscle Proteome changes after exercise in individuals with and without obesity.
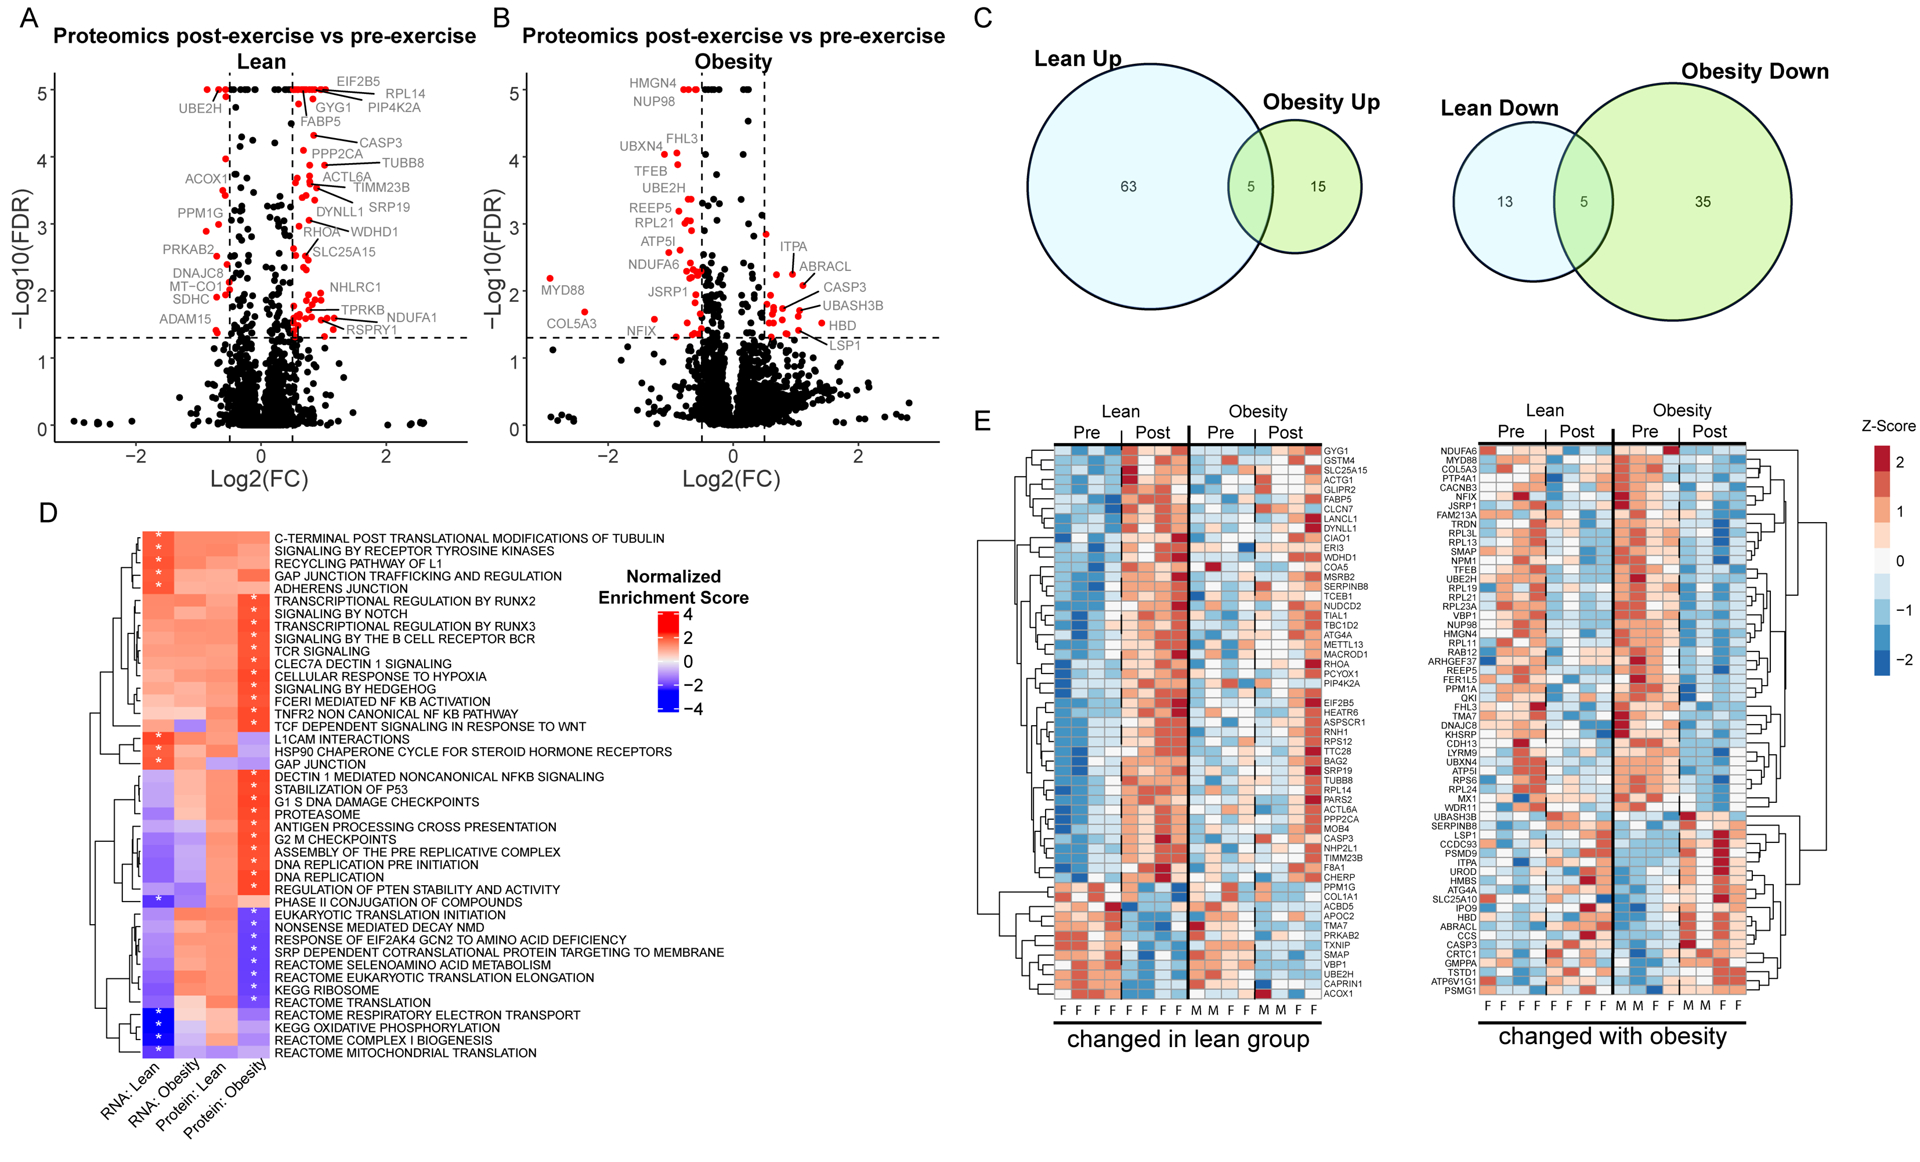
Exercise induced changes in protein abundance are displayed in volcano plots for lean (A) and individuals with obesity (B). The x-axis indicates the log2(fold-change) and the y-axis indicates the −log10 value of the false discovery rate (FDR). Positive log2(fold-change) indicates an increased protein abundance after exercise. (C) Proteins that are upregulated (left) and downregulated (right) after exercise are compared between groups in a Venn-diagram. (D) Enriched gene sets identified in the transcript and protein exercise comparison are displayed in a heatmap to illustrate pathway regulation at a systems level. Color represents normalized enrichment score, all significant changes (adjusted p-value < 0.05) are indicated with an asterisk. (E) Proteins significantly altered after exercise are clustered and displayed in a heatmap. (Left) Proteins altered by exercise in lean individuals are displayed with the corresponding changes in individuals with obesity to illustrate differences in the response to exercise between the two groups. (Right) Proteins significantly altered in individuals with obesity are shown with corresponding changes in lean individuals. Heatmap lanes corresponding to males are indicated with an M. Heatmap lanes corresponding to females are indicated with an F.
Protein phosphorylation is a key molecular signaling event in skeletal muscle. Lean upregulated 226 phosphosites after exercise and downregulated 46 (Figure 4 A,C). After exercise, 52 phosphosites were upregulated with obesity whereas 26 were downregulated (Figure 4 B,C). Minimal overlap of regulated phosphosites (7 up, 0 down) with exercise in the two groups reinforces that obesity not only attenuates, but also shifts the patterns in the exercise-responsive phosphoproteome (Figure 4C). Two sequence motifs were enriched in the phosphopeptide sequences that were upregulated after exercise in lean individuals (Figure 4E), and there were no enriched motifs in phosphopeptides upregulated after exercise in people with obesity. The heatmaps (Figure 4F) of exercise responsive phosphosites show that the two groups exhibit similar directionality in exercise response, but overall attenuation with obesity. To identify regulated signaling pathways and kinase activity after exercise in each group we used PTM-SEA (Figure 4D, Table S3). This analysis identified increased activity of 4 kinases after exercise in the lean group including Erk1/MAPK3, GSK3B and PKCD, however, none were significantly increased after exercise with obesity. In the group with obesity, activity of PLK1 was increased after exercise. Notably, the activity of CK2A1 (casein kinase 2) was upregulated after exercise with obesity and downregulated after exercise in the lean group.
Figure 4: Phosphoproteome changes after exercise in individuals with and without obesity.
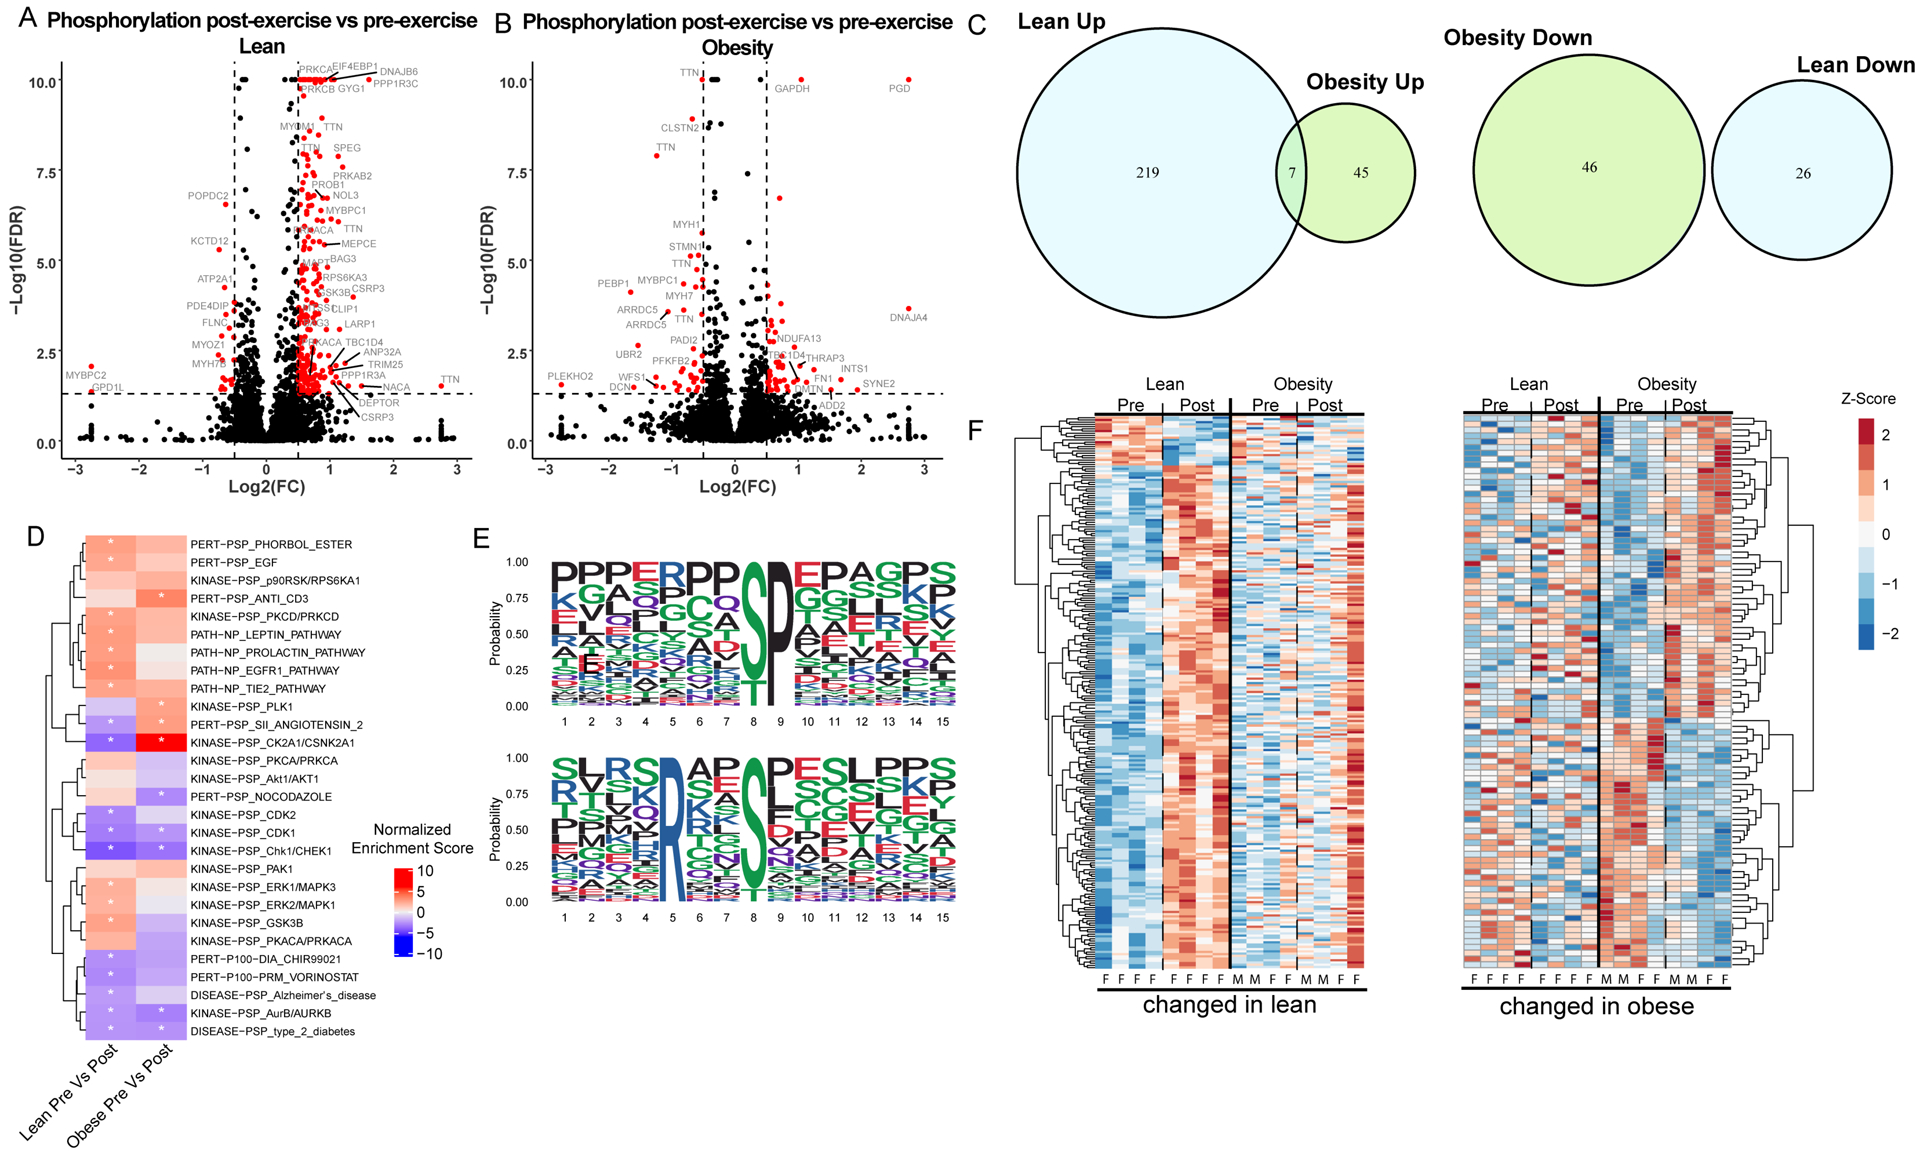
Exercise induced changes in protein phosphorylation are displayed in volcano plots for lean (A) and individuals with obesity (B). The x-axis indicates the log2(fold-change) and the y-axis indicates the −log10 value of the false discovery rate (FDR). Positive log2(fold-change) indicates an increased protein abundance after exercise. (C) Phosphopeptides that are upregulated (left) and downregulated (right) after exercise are compared between groups in a Venn-diagram. (D) Enriched phosphorylation signatures obtained from PTM-signature enriched enrichment analysis (PTM-SEA) are displayed in a heatmap to illustrate regulation of signaling pathways. Enriched phosphorylation signatures after exercise in lean (left) and individuals with obesity (right). Color represents normalized enrichment score, all significant changes (adjusted p-value < 0.05) are indicated with an asterisk. (E) Sequences logos for enriched phosphorylation motifs identified in exercise induced changes from lean individuals using the Motif-X algorithm are displayed. (D) Proteins significantly altered after exercise are clustered and displayed in a heatmap. (Left) Proteins altered by exercise in lean individuals are displayed with the corresponding changes in individuals with obesity to illustrate differences in the response to exercise between the two groups. (Right) Proteins significantly altered in individuals with obesity are shown with corresponding changes in lean individuals. Heatmap lanes corresponding to males are indicated with an M. Heatmap lanes corresponding to females are indicated with an F.
Integrative multi-omics analysis identifies clusters of molecules associated with obesity and differential responses to exercise.
We integrated the multi-omics data to identify clusters of molecules associated with obesity and exercise response. Weighted gene co-expression network analysis (WGCNA) identified 100 functional modules. The four modules most significantly correlated with obesity status (Figure 5A) and exercise (Figure 5B) were then subjected to functional enrichment analysis in ClueGo (Figure 5C). As modules associated with obesity status did not change with exercise, they were termed “exercise static”, whereas modules associated with exercise timepoint were termed “exercise responsive”. Each static and responsive module had varying molecular composition. Exercise refractory module 1 was composed primarily of mRNA and was enriched for molecules involved in ubiquitin mediated proteolysis, autophagy, and protein processing in the ER, all of which were increased in individuals with obesity relative to lean (Figure 5C). Exercise refractory module 2 was driven by phosphopeptides associated with glycolysis/gluconeogenesis, HIF-1 signaling, and glucagon signaling, which were also increased with obesity. Exercise responsive module 1 was composed of primarily protein and phosphopeptides involved in glycolysis / gluconeogenesis (Figure 5C). Exercise responsive module 2 was composed of protein and phosphopeptides involved long term potentiation, tight junctions, and neurotrophin signaling (Figure 5C). Circular plots (Figure 5D) integrate the transcriptome, proteome, and phosphoproteome show the change in key exercise-responsive gene categories grouped by function in lean and people with obesity.
Figure 5: Integrated multi-omics network analysis identifies altered network modules in obesity.
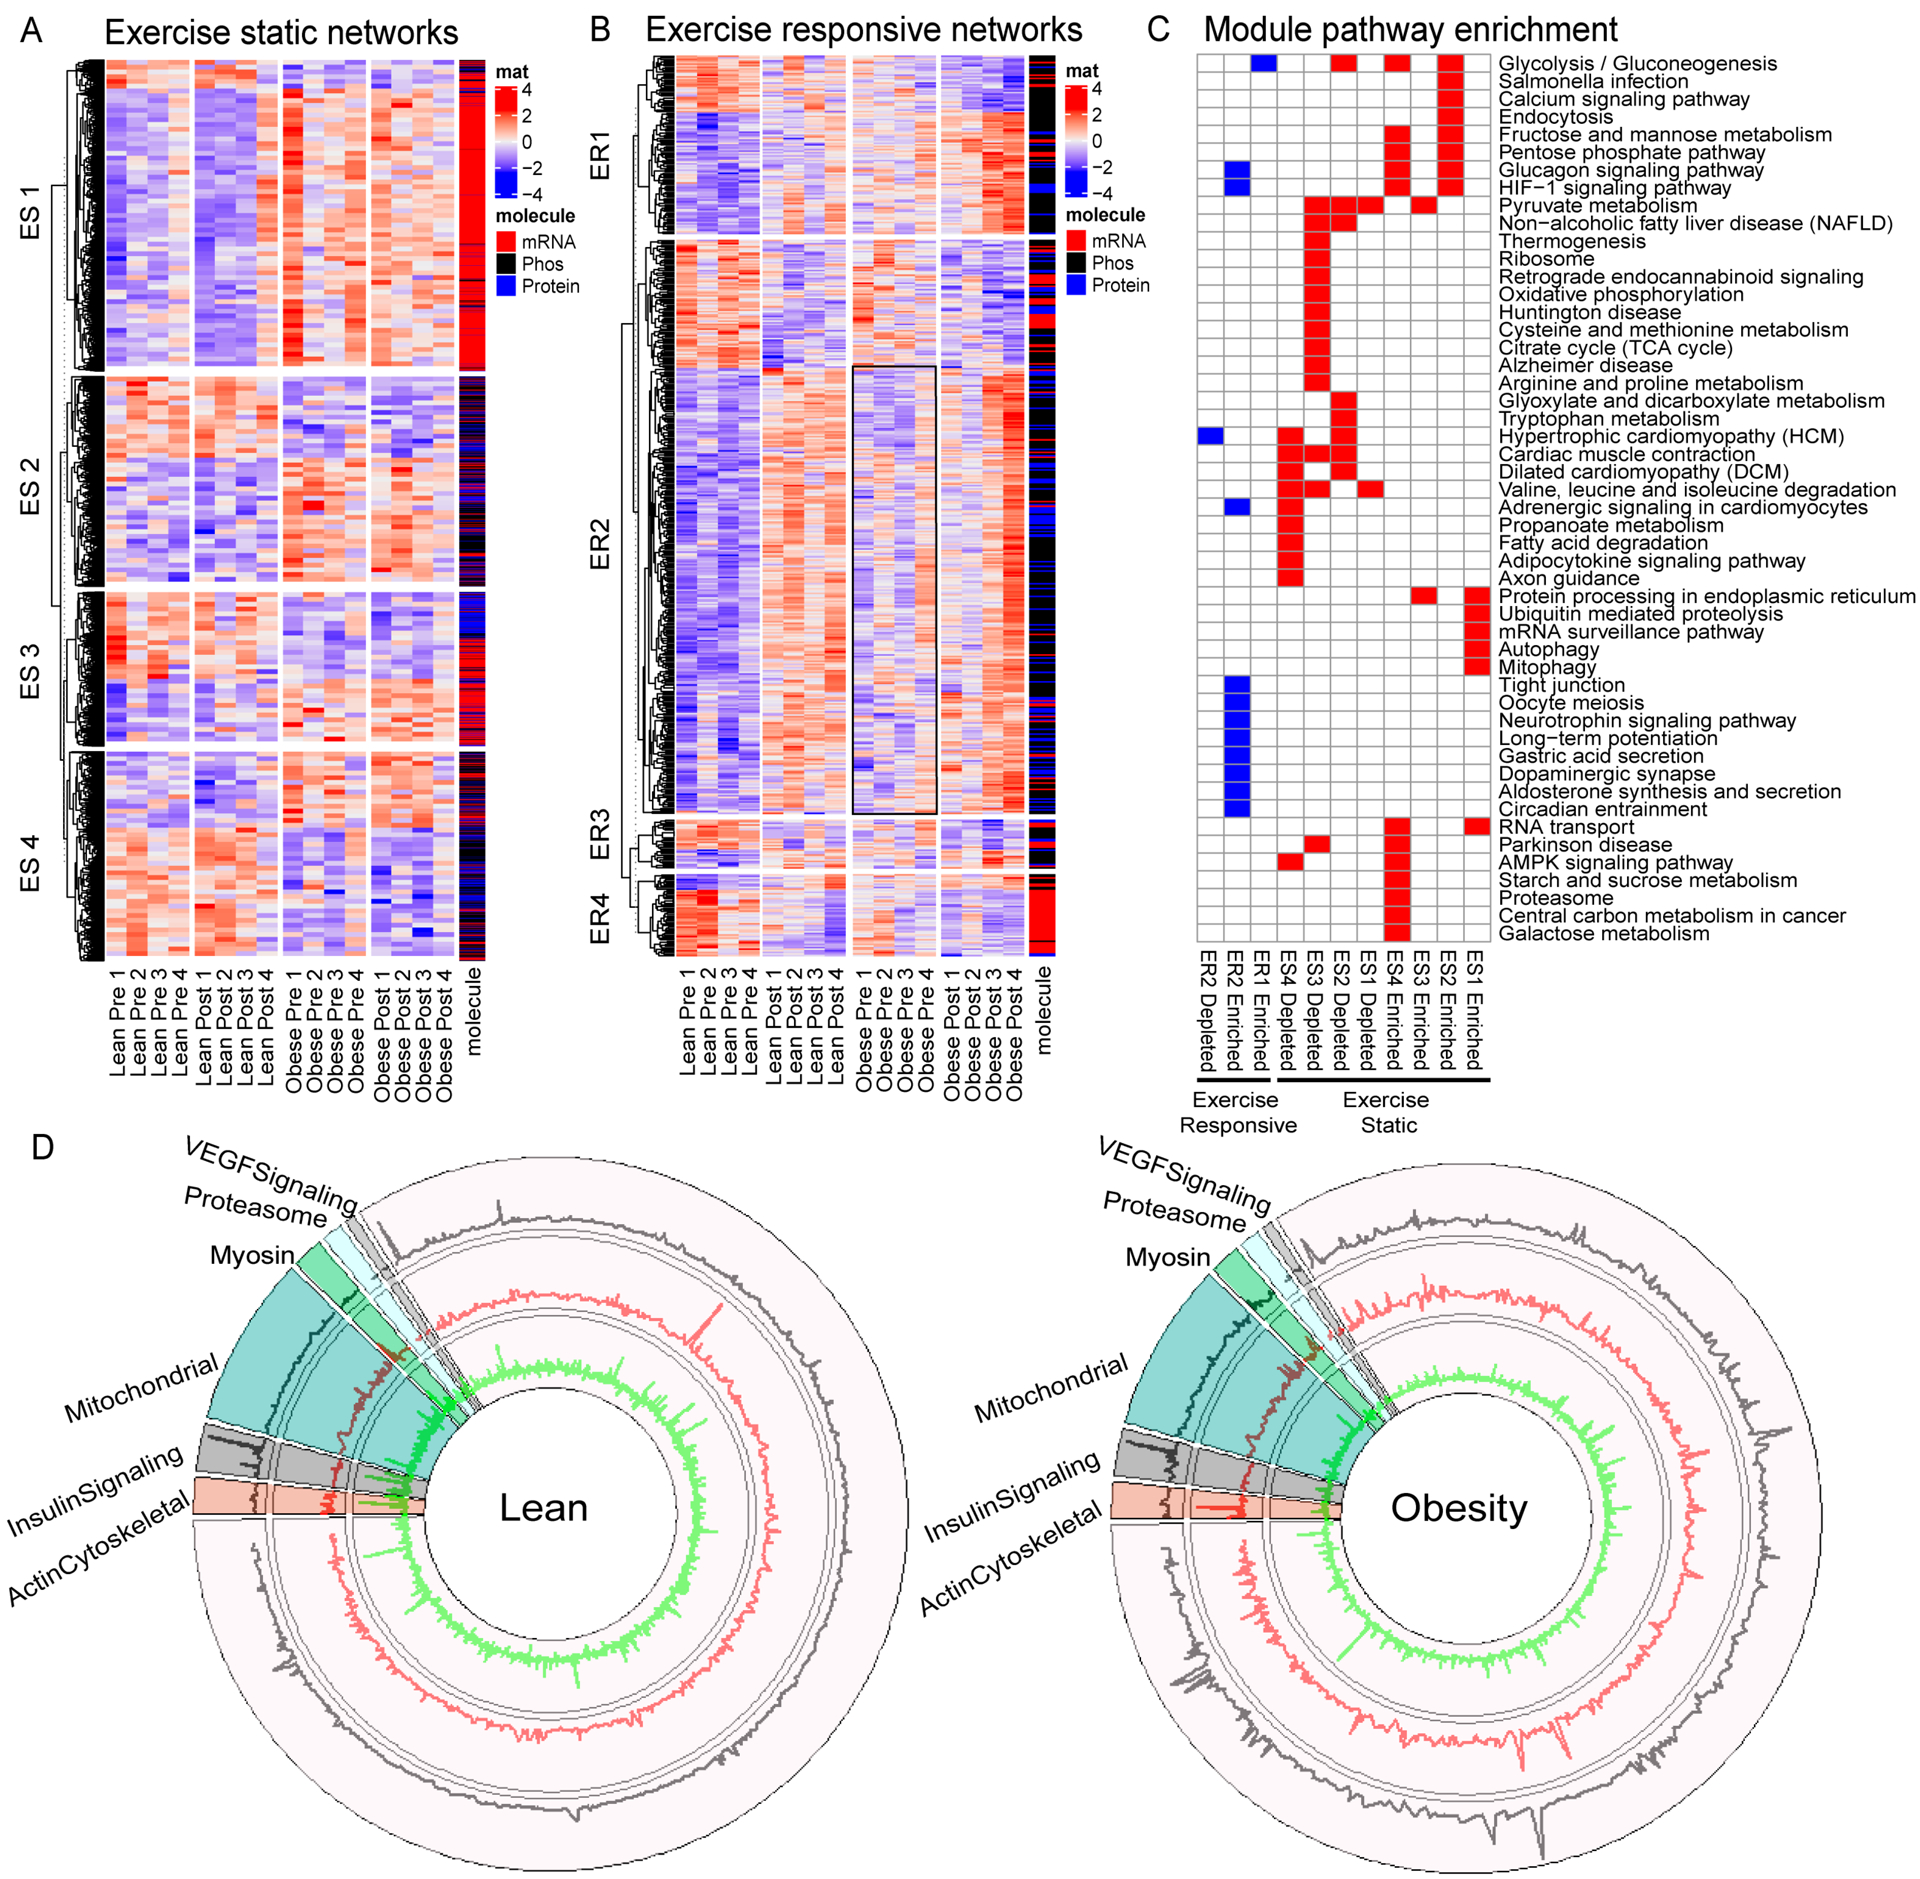
Transcriptome, proteome and phosphoproteome data was z-transformed and merged into a single matrix for weighted correlation network analysis (WGCNA) to identify modules of co-regulated molecules that associate with phenotypic traits. (A,B) The two most significant positively and negatively correlated network modules associated with obesity status (“Exercise Static”, A) and obesity status and exercise (“Exercise Dynamic”, B) are plotted in a heat map and separated by module (rows) and sample group (columns). Molecule type (i.e. mRNA, protein, or phosphopeptide) is color-coded as indicated by the bar on the right. (C) Summary of enriched pathways in exercise static or exercise dynamic network modules. A two-sided hypergeometric test was performed to obtain p-values, and correction was carried out with Bonferroni step down. A significance threshold of adjusted p-value = 0.05 was applied and significant pathways are indicated by color. Significant exercise static pathways are colored red, significant exercise responsive pathways are blue. (D) Circular plots integrating the transcriptome (outer ring), proteome (middle ring), and phosphoproteome (inner ring) show the change with exercise in lean and people with obesity with key exercise-responsive gene categories grouped by function.
To further interrogate the markedly distinct effects of exercise on the muscle phosphoproteome, we clustered all transcripts, proteins, and phosphopeptides derived from kinases and phosphatases that belonged to modules associated with obesity and exercise by WGCNA. This analysis identified clusters of kinases and phosphatases associated with obesity status (Figure 6A), exercise (Figure 6B) and both exercise and obesity (Figure 6C). We performed the same analysis for transcription factors (Figure 6 D–F). Transcription factors also formed clusters associated with obesity status, exercise, and both. Integration of multi-omic kinase and phosphatase data using WGCNA uncovered a dysregulation of GSK3β signaling in subjects with obesity. GSK3β mRNA was associated with obesity status, where higher levels were observed in subjects with obesity (Figure 6A). Obesity also increased phosphorylation of GSK3β at S9, a known inactivating phosphorylation event (24). After exercise, phosphorylation of S9 increased in both groups, however, GSK3β and GSK3α protein levels increased only in the lean group (Figure 6B). Additionally, after exercise 3 phosphosites were decreased on GYS in lean but not people with obesity. Further, three regulatory subunits of PP-1, a protein phosphatase that positively regulates GYS (25), displayed increased phosphorylation levels after exercise in lean, but not people with obesity, indicating that glycogen synthesis signaling is downregulated in people with obesity relative to lean.
Figure 6: Network analysis of kinases, phosphatases and transcription factors reveals dysregulation of signaling networks in obesity.
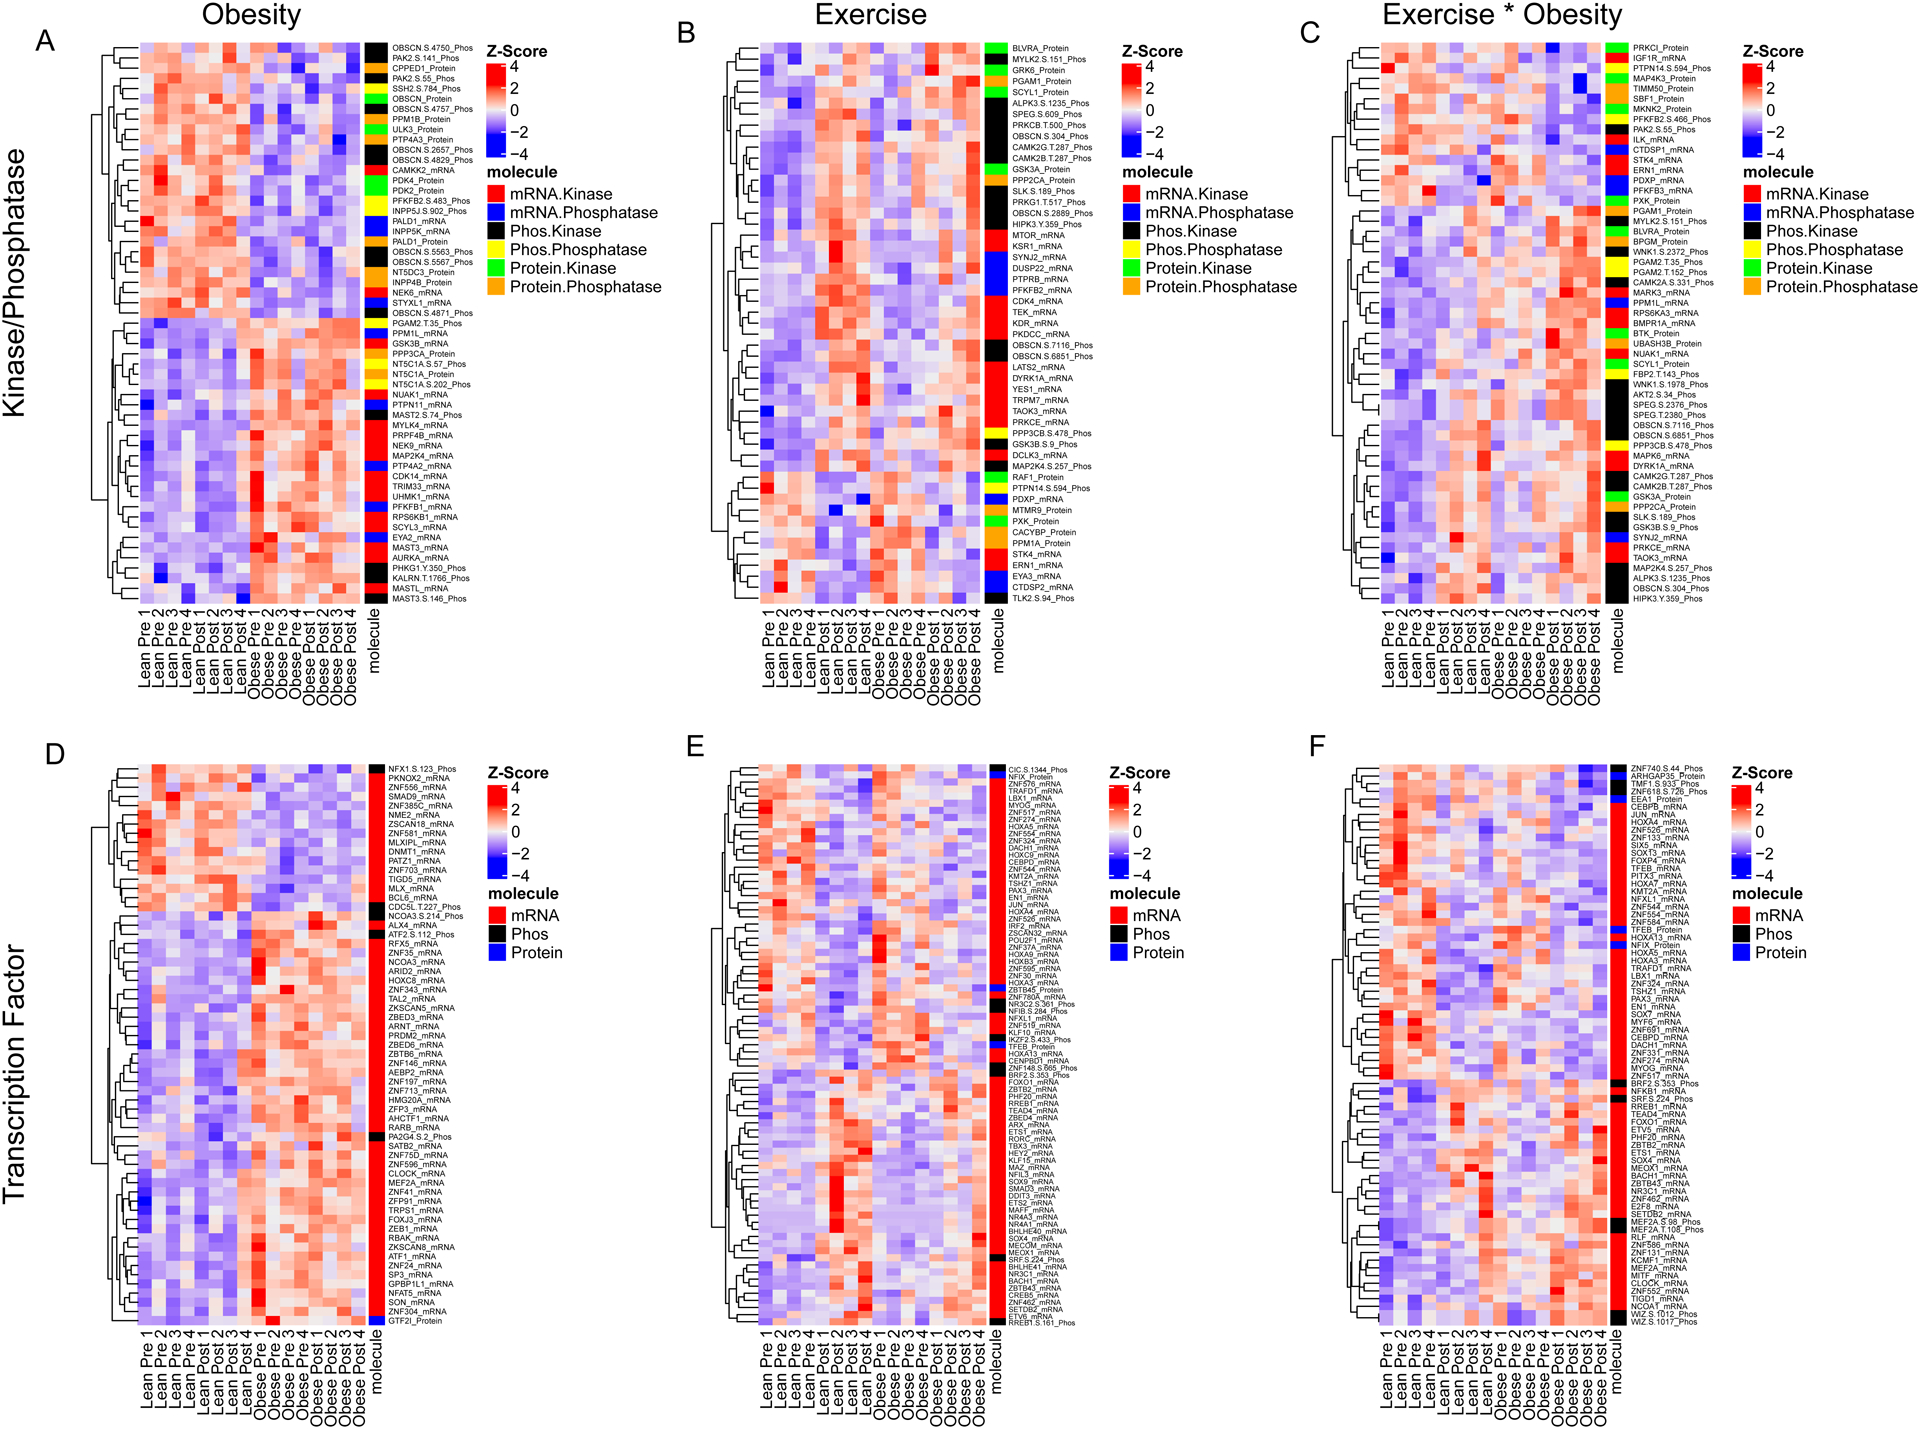
Kinase and phosphatase transcripts, proteins and phosphopeptides with significant network module phenotype associations were clustered to identify alterations in signaling molecules that associate with obesity and the response to exercise. Kinase and phosphatase transcripts, proteins and phosphopeptides that associate with obesity status (A), exercise status (B) or obesity status and exercise are displayed in a heatmap. Molecules in each heatmap were filtered by module p-value in order to display row labels. The color or each row represents z-score. The molecule class is color coded as indicated by the car on the right. Transcription factor transcripts, proteins and phosphopeptides that are significantly associated with obesity status (C), exercise status (D), or obesity and exercise (E) are displayed in a heatmap. Molecule class is as indicated by the color-coded bar on the right of each heatmap.
Discussion:
Although exercise leads to many favorable adaptations and represents an important behavioral strategy to lessen the burden of obesity, the notable variability in exercise responsiveness (10) necessitates a more detailed investigation of underlying factors that may limit exercise response in individuals with obesity. Toward this goal, we used a multi-omics approach to interrogate the molecular responses to a single bout of exercise in a small group of people with and without obesity. The main preliminary findings of this study are that skeletal muscle from people with obesity exhibited transcriptional and proteomic signatures consistent with reduced mitochondrial function, protein synthesis, and glycogen synthesis. Furthermore, obesity leads to distinct transcriptional, proteomic, and phosphoproteomic responses to acute exercise. Biosynthetic pathways including glycogen synthesis and protein synthesis were distinct between lean individuals and people with obesity. We identified protein kinase CK2 and GSK3β signaling pathways as exercise responsive pathways that were notably altered by obesity.
The transcriptional and proteomic signatures of skeletal muscle from people with and without obesity at rest recapitulated known phenotypes in skeletal muscle of individuals with obesity. Gene-centric GSEA identified downregulation of numerous gene sets with obesity, including Fatty Acid Metabolism, Citric Acid Cycle, Oxidative Phosphorylation, and Respiratory Electron Transport. These gene sets also emerged as significantly downregulated in muscle with obesity by global proteomics and are consistent with literature demonstrating that mitochondrial function is impaired with obesity (16) and may be linked with insulin resistance (26). Other notably downregulated gene sets were relevant to muscle protein synthesis, including Translation, Mitochondrial Protein Import, Mitochondrial Translation, Complex I Biogenesis, Ribosome, and Eukaryotic Translation Elongation and Initiation. These transcriptional and proteomic patterns align with published data demonstrating significantly reduced synthesis rates of muscle proteins in the post-absorptive state (11). Altered muscle protein metabolism with obesity is likely to contribute to numerous disturbances, including mitochondrial dysfunction, insulin resistance, and functional impairments (27).
Skeletal muscle is remarkably adaptive to physical activity, and the beneficial adaptations to chronic exercise training depend on the cumulative impact of many acute responses to exercise bouts. The adaptations to chronic exercise have been examined in individuals with obesity, (10; 28; 29), but the molecular responses to acute bouts of exercise continues to be an active area of investigation. Here we demonstrate that individuals with and without obesity exhibit remarkably dissimilar molecular responses to a single bout of cycling exercise. In lean individuals, mitochondrial translation and oxidative phosphorylation were decreased at the transcript, but not protein level after exercise. Lean individuals increased receptor tyrosine kinase signaling after exercise whereas individuals with obesity did not. Interestingly, dysregulated receptor tyrosine kinase signaling has been implicated in obesity and is the focus of ongoing research (30; 31). In individuals with obesity, GSEA identified decreased levels of protein translation together with increased proteasomal activity. These findings suggest that reduced protein synthesis together with increased proteasomal activity after exercise in subjects with obesity may contribute to poor muscle tissue maintenance and reduced muscle quality. It is tempting to implicate suppression of mTORC1 given prior work demonstrating that endurance exercise reduces mTORC1 activation (32). Although no direct kinase activity assays were performed to address this possibility, we note that exercise reduced the phosphorylation (serine 9) of the mTORC1 inhibitor FKBP12 in obese but not lean, although it is unclear how this phosphosite influences protein function.
Protein phosphorylation regulates a large number of signal transduction pathways in skeletal muscle, including many that are influenced by exercise. In lean, PTM-SEA identified several kinase signatures following acute exercise, including Erk1/MAPK3, GSK3B, and PKCD. Importantly, none of these kinases were significantly increased after exercise in obesity. The activity of protein kinase CK2 decreased after exercise in the lean whereas its activity was increased after exercise in the group with obesity. This kinase is involved in myogenesis, protein turnover, protein import, and stability of neuromuscular junctions and cytoskeleton (33), but its role in regulating exercise response pathways requires the insights of additional mechanistic studies.
Multi-omics integration identified networks of regulated kinases, phosphatases and transcription factors associated with obesity and exercise (Figure 6). In Figure 7, we present a summary of curated exercise-responsive pathways, including molecules known to regulate glycogen synthesis, protein synthesis, protein breakdown, and myogenesis/cell cycle. This summary highlights exercise-responsive pathways that are similar in both groups (protein breakdown) and those that are differentially regulated with obesity (biosynthetic pathways of glycogen and protein synthesis). Integration of transcript, proteome, and phosphorylation data by WGCNA identified dysregulated GSK3β signaling in individuals with obesity at baseline and after exercise. GSK3β is a serine/threonine kinase and important regulator of cellular metabolism in addition to proliferation, migration, cell death and immune function (34–36). GSK3β phosphorylates and inactivates GYS (37), leading to reduced glycogen synthesis. GSK3β also influences protein synthesis through its influence on eukaryotic protein synthesis initiation factor 2B (eIF2B) (38). Baseline comparison of phosphorylation profiles between groups uncovered increased phosphorylation of GSK3β at serine-9 in people with obesity. After exercise, phosphorylation of serine 9 GSK3β increased in both groups, however, 3 phosphosites on GYS (serine 641, 645, 649) were reduced following exercise in lean individuals but not people with obesity. These data indicate that GYS is activated after exercise to a greater extent in lean compared to individuals with obesity. Further two phosphosites on PP-1, which positively regulates GYS, were increased after exercise in lean, but not with obesity. Relevant to muscle protein synthesis, we observed that EIF4BP1 was significantly phosphorylated (serine 65) following exercise in lean but not with obesity, alongside distinct phosphorylation patterns in DEPTOR and RPS6KA3. Phosphorylation of EIF4BP1 at serine 65 is regulated by a few different kinases, including ERK, PIM2, and GSK3β (39). Collectively, these alterations indicate that GSK3β signaling, and likely glycogen and protein synthesis are dysregulated in people with obesity, relative to lean individuals following acute exercise. Previous studies have suggested that postexercise glycogen synthesis is well-maintained in individuals with obesity (40). Here we did not measure glycogen synthesis or glycogen synthase activity, but the impact of obesity on multiple levels of GSK3β signaling suggests that further investigation of GSK3β signaling in obesity is worthwhile. Indeed, specific inhibitors of protein kinases, including GSK3, have been evaluated for their therapeutic potential in clinical conditions such as cancer (41) and type 2 diabetes (42). The current study was designed to match relative workload (watts at 70% VO2 peak) in individuals with obesity to lean, but it is important to consider additional factors that could contribute to the observed differences in exercise response such as absolute workload, fuel selection during exercise, muscle fiber type, and prevailing glycogen levels in skeletal muscle. The individuals with obesity had approximately 20% lower absolute workload compared to lean, and although we did not measure muscle glycogen or evaluate fuel selection during the 30 minute exercise bout, prior work demonstrates that men with obesity exhibit lower rates of carbohydrate oxidation during exercise compared to lean men (43). Obesity is also associated with fewer type I and more type IIb fibers (44). Inasmuch, some of the molecular exercise response pathways found to be altered with obesity could be explained on the basis of exercise fuel selection, muscle glycogen levels, and fiber type.
Figure 7: Curated summary of exercise-induced fold changes in transcriptional, proteomic, and phosphoproteomic signals in skeletal muscle from lean vs obese.
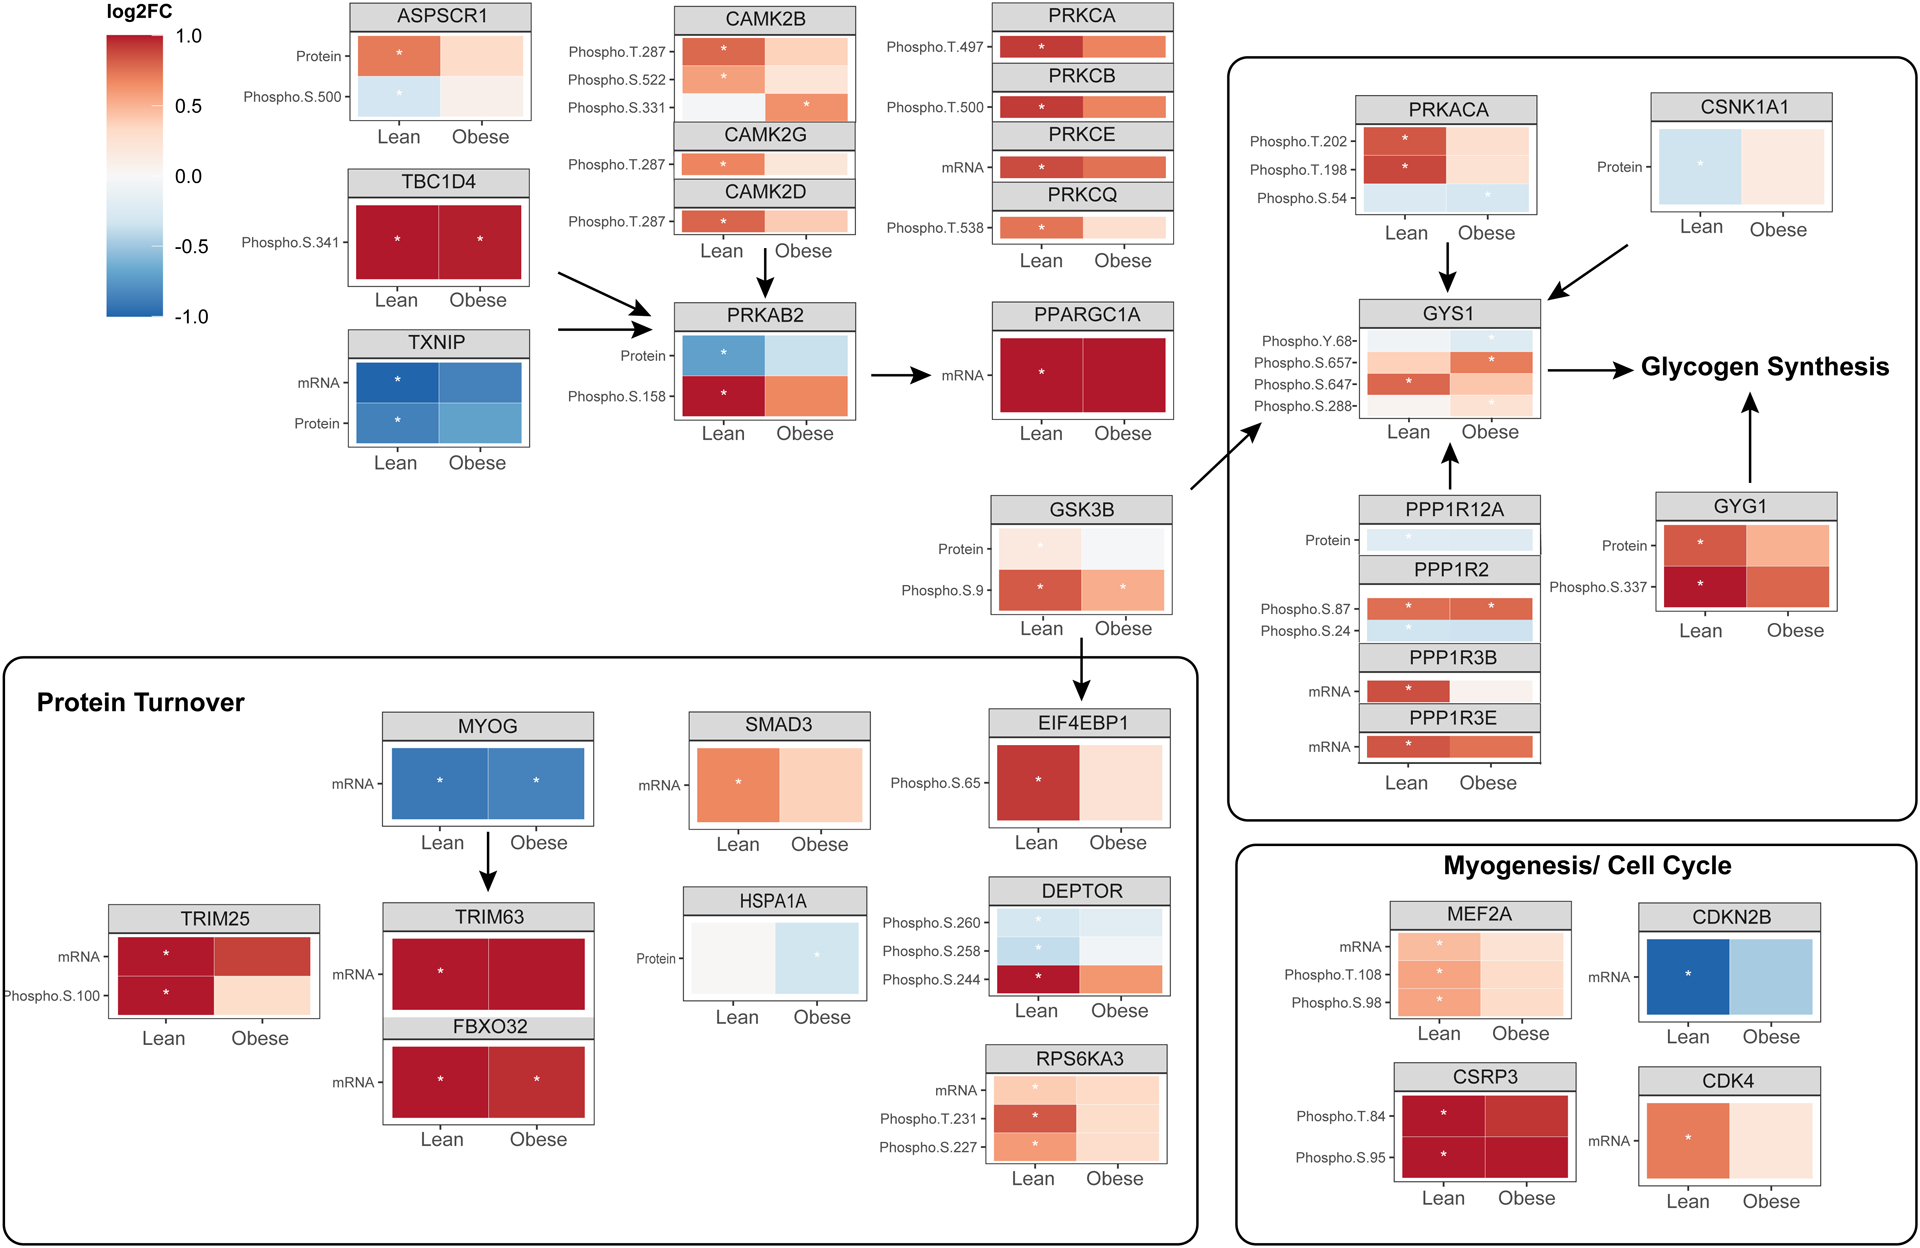
mRNA, protein abundance, and phosphopeptide enrichment are summarized for salient clusters of exercise-responsive molecules. Red shading indicates upregulated signals whereas blue shading indicates downregulation. A significance threshold of adjusted p-value = 0.05 was applied, and molecules that reached statistical significance are indicated by an asterisk.
CONCLUSION
We use a multi-omics approach to identify systems level alterations in skeletal muscle with obesity at baseline and in response to acute exercise. Skeletal muscle from individuals with obesity exhibited transcriptional and proteomic signatures consistent with known derangements in mitochondrial function and protein metabolism. After exercise, multi-omic integration of gene expression, protein abundance, and protein phosphorylation identified several key biosynthetic pathways related to glycogen synthesis and protein synthesis that were influenced by acute exercise in lean but attenuated in individuals with obesity. Notable potential control points emerged from the dataset, including reciprocal regulation of CK2 and altered GSK3β signaling in obese compared to lean individuals after exercise. The possibility that these control points could be targeted to enhance exercise response in individuals with obesity awaits follow-up investigation, particularly given the preliminary nature of this work due to the limited sample size and notable variability and interindividual heterogeneity in gene expression and proteomic signatures of humans.
Supplementary Material
Table 1. Study participant demographics, body composition, and physiological data.
Body composition was determined by dual energy x-ray absorptiometry. Whole-body maximal oxygen uptake (VO2 peak) was measured during exhaustive single-leg cycling and expressed relative to total body weight (BW) and fat free mass (FFM).
| Lean | Obesity | P | |
|---|---|---|---|
| N (F/M) | 4 (2F/2M) | 4 (2F/2M) | - |
| BMI (kg/m2) | 22.2 (2.0) | 39.3 (2.8) | <0.001 |
| Age (years) | 37.5 (5.3) | 43.5 (9.1) | 0.31 |
| Body Fat (%) | 28.2 (8.5) | 48.6 (5.1) | 0.01 |
| VO2 peak (L/min) | 1.48 (0.35) | 1.50 (0.21) | 0.93 |
| VO2 peak (mL/kg BW/min) | 25.2 (6.3) | 13.1 (3.0) | 0.023 |
| VO2 Peak (mL/kgFFM/min) | 35.8 (5.2) | 26.5 (5.1) | 0.042 |
| Watts at VO2 peak | 82.5 (22.2) | 65 (12.2) | 0.23 |
| Watts at 70% VO2 Peak | 57.7 (15.5) | 45.5 (8.6) | 0.23 |
| Total work (kj) | 105 (27.9) | 79.5 (14.5) | 0.17 |
| RPE at 30 minutes | 18 (2) | 16 (3) | 0.29 |
Data are presented as mean (SD). F, female; M, male; BMI, body mass index; RPE, rate of perceived exertion.
Study Importance Questions.
Skeletal muscle anabolic response to nutritional stimuli is blunted in people with obesity, but the impact of obesity on the molecular response to acute exercise is not clear.
This study demonstrated that people with obesity exhibit unique molecular (transcriptomic, proteomic, phosphoproteomic) response to acute exercise compared to lean.
Protein kinase CK2 and GSK3β signaling pathways are exercise responsive pathways that were notably altered by obesity.
Acknowledgments.
We are grateful to all study participants and Bobbie Soderberg, Vicky Wade, and staff in the Clinical Research Unit. The authors thank Drs. Michael Jensen, Adrian Vella, and Sree Nair. Zachary Ryan provided elite technical support. Individual participant data (proteomics, transcriptomics) will be immediately shared in deidentified/ anonymized formats upon request by bona fide researchers submitting a research proposal requesting data access.
Funding:
This work was supported by Grant Numbers UL1 TR002377 from the National Center for Advancing Translational Sciences and R01 AG054454 from the National Institute on Aging. H. E. Kunz was supported by National Institute of Arthritis and Musculoskeletal and Skin Diseases for the Musculoskeletal Research Training Program (T32 AR056950).
Footnotes
Disclosure. The authors declare that they have no conflicts of interested with the contents of this article.
Clinical Trial Registration Number: NCT02732509
REFERENCES
- 1.Worldwide trends in body-mass index, underweight, overweight, and obesity from 1975 to 2016: a pooled analysis of 2416 population-based measurement studies in 128·9 million children, adolescents, and adults. Lancet 2017;390:2627–2642 [DOI] [PMC free article] [PubMed] [Google Scholar]
- 2.Ritov VB, Menshikova EV, He J, Ferrell RE, Goodpaster BH, Kelley DE: Deficiency of subsarcolemmal mitochondria in obesity and type 2 diabetes. Diabetes 2005;54:8–14 [DOI] [PubMed] [Google Scholar]
- 3.Anderson EJ, Lustig ME, Boyle KE, Woodlief TL, Kane DA, Lin CT, Price JW 3rd, Kang L, Rabinovitch PS, Szeto HH, Houmard JA, Cortright RN, Wasserman DH, Neufer PD: Mitochondrial H2O2 emission and cellular redox state link excess fat intake to insulin resistance in both rodents and humans. J Clin Invest 2009; [DOI] [PMC free article] [PubMed] [Google Scholar]
- 4.DeFronzo RA, Tripathy D: Skeletal muscle insulin resistance is the primary defect in type 2 diabetes. Diabetes Care 2009;32 Suppl 2:S157–163 [DOI] [PMC free article] [PubMed] [Google Scholar]
- 5.Blüher M: Obesity: global epidemiology and pathogenesis. Nature reviews Endocrinology 2019;15:288–298 [DOI] [PubMed] [Google Scholar]
- 6.Holloszy JO: Biochemical adaptations in muscle. Effects of exercise on mitochondrial oxygen uptake and respiratory enzyme activity in skeletal muscle. J Biol Chem 1967;242:2278–2282 [PubMed] [Google Scholar]
- 7.Gomes MJ, Pagan LU, Lima ARR, Reyes DRA, Martinez PF, Damatto FC, Pontes THD, Rodrigues EA, Souza LM, Tosta IF, Fernandes AAH, Zornoff LAM, Okoshi K, Okoshi MP: Effects of aerobic and resistance exercise on cardiac remodelling and skeletal muscle oxidative stress of infarcted rats. J Cell Mol Med 2020;24:5352–5362 [DOI] [PMC free article] [PubMed] [Google Scholar]
- 8.Richter EA, Garetto LP, Goodman MN, Ruderman NB: Muscle glucose metabolism following exercise in the rat: increased sensitivity to insulin. J Clin Invest 1982;69:785–793 [DOI] [PMC free article] [PubMed] [Google Scholar]
- 9.Hansen D, Dendale P, Jonkers RA, Beelen M, Manders RJ, Corluy L, Mullens A, Berger J, Meeusen R, van Loon LJ: Continuous low- to moderate-intensity exercise training is as effective as moderate- to high-intensity exercise training at lowering blood HbA(1c) in obese type 2 diabetes patients. Diabetologia 2009;52:1789–1797 [DOI] [PMC free article] [PubMed] [Google Scholar]
- 10.Ross R, Goodpaster BH, Koch LG, Sarzynski MA, Kohrt WM, Johannsen NM, Skinner JS, Castro A, Irving BA, Noland RC, Sparks LM, Spielmann G, Day AG, Pitsch W, Hopkins WG, Bouchard C: Precision exercise medicine: understanding exercise response variability. Br J Sports Med 2019;53:1141–1153 [DOI] [PMC free article] [PubMed] [Google Scholar]
- 11.Guillet C, Delcourt I, Rance M, Giraudet C, Walrand S, Bedu M, Duche P, Boirie Y: Changes in basal and insulin and amino acid response of whole body and skeletal muscle proteins in obese men. J Clin Endocrinol Metab 2009;94:3044–3050 [DOI] [PubMed] [Google Scholar]
- 12.Beals JW, Burd NA, Moore DR, van Vliet S: Obesity Alters the Muscle Protein Synthetic Response to Nutrition and Exercise. Front Nutr 2019;6:87. [DOI] [PMC free article] [PubMed] [Google Scholar]
- 13.Beals JW, Skinner SK, McKenna CF, Poozhikunnel EG, Farooqi SA, van Vliet S, Martinez IG, Ulanov AV, Li Z, Paluska SA, Burd NA: Altered anabolic signalling and reduced stimulation of myofibrillar protein synthesis after feeding and resistance exercise in people with obesity. J Physiol 2018;596:5119–5133 [DOI] [PMC free article] [PubMed] [Google Scholar]
- 14.De Filippis E, Alvarez G, Berria R, Cusi K, Everman S, Meyer C, Mandarino LJ: Insulin-resistant muscle is exercise resistant: evidence for reduced response of nuclear-encoded mitochondrial genes to exercise. Am J Physiol Endocrinol Metab 2008;294:E607–614 [DOI] [PubMed] [Google Scholar]
- 15.Hulston CJ, Woods RM, Dewhurst-Trigg R, Parry SA, Gagnon S, Baker L, James LJ, Markey O, Martin NRW, Ferguson RA, van Hall G: Resistance exercise stimulates mixed muscle protein synthesis in lean and obese young adults. Physiol Rep 2018;6:e13799. [DOI] [PMC free article] [PubMed] [Google Scholar]
- 16.Kunz HE, Hart CR, Gries KJ, Parvizi M, Laurenti M, Dalla Man C, Moore N, Zhang X, Ryan Z, Polley EC, Jensen MD, Vella A, Lanza IR: Adipose tissue macrophage populations and inflammation are associated with systemic inflammation and insulin resistance in obesity. Am J Physiol Endocrinol Metab 2021;321:E105–e121 [DOI] [PMC free article] [PubMed] [Google Scholar]
- 17.Kunz HE, Dasari S, Lanza IR: EPA and DHA elicit distinct transcriptional responses to high-fat feeding in skeletal muscle and liver. Am J Physiol Endocrinol Metab 2019;317:E460–e472 [DOI] [PMC free article] [PubMed] [Google Scholar]
- 18.Lalia AZ, Dasari S, Robinson MM, Abid H, Morse DM, Klaus KA, Lanza IR: Influence of omega-3 fatty acids on skeletal muscle protein metabolism and mitochondrial bioenergetics in older adults. Aging (Albany NY) 2017;9:1096–1129 [DOI] [PMC free article] [PubMed] [Google Scholar]
- 19.Cox J, Mann M: MaxQuant enables high peptide identification rates, individualized p.p.b.-range mass accuracies and proteome-wide protein quantification. Nat Biotechnol 2008;26:1367–1372 [DOI] [PubMed] [Google Scholar]
- 20.Robinson MM, Dasari S, Konopka AR, Johnson ML, Manjunatha S, Esponda RR, Carter RE, Lanza IR, Nair KS: Enhanced Protein Translation Underlies Improved Metabolic and Physical Adaptations to Different Exercise Training Modes in Young and Old Humans. Cell Metab 2017;25:581–592 [DOI] [PMC free article] [PubMed] [Google Scholar]
- 21.Krug K, Mertins P, Zhang B, Hornbeck P, Raju R, Ahmad R, Szucs M, Mundt F, Forestier D, Jane-Valbuena J, Keshishian H, Gillette MA, Tamayo P, Mesirov JP, Jaffe JD, Carr S, Mani DR: A Curated Resource for Phosphosite-specific Signature Analysis. Mol Cell Proteomics 2019;18:576–593 [DOI] [PMC free article] [PubMed] [Google Scholar]
- 22.Langfelder P, Horvath S: WGCNA: an R package for weighted correlation network analysis. BMC Bioinformatics 2008;9:559. [DOI] [PMC free article] [PubMed] [Google Scholar]
- 23.Bindea G, Mlecnik B, Hackl H, Charoentong P, Tosolini M, Kirilovsky A, Fridman WH, Pagès F, Trajanoski Z, Galon J: ClueGO: a Cytoscape plug-in to decipher functionally grouped gene ontology and pathway annotation networks. Bioinformatics 2009;25:1091–1093 [DOI] [PMC free article] [PubMed] [Google Scholar]
- 24.Mackenzie RW, Elliott BT: Akt/PKB activation and insulin signaling: a novel insulin signaling pathway in the treatment of type 2 diabetes. Diabetes Metab Syndr Obes 2014;7:55–64 [DOI] [PMC free article] [PubMed] [Google Scholar]
- 25.Platholi J, Federman A, Detert JA, Heerdt P, Hemmings HC Jr.,: Regulation of protein phosphatase 1I by Cdc25C-associated kinase 1 (C-TAK1) and PFTAIRE protein kinase. J Biol Chem 2014;289:23893–23900 [DOI] [PMC free article] [PubMed] [Google Scholar]
- 26.Simoneau JA, Kelley DE: Altered glycolytic and oxidative capacities of skeletal muscle contribute to insulin resistance in NIDDM. J Appl Physiol 1997;83:166–171 [DOI] [PubMed] [Google Scholar]
- 27.Guillet C, Masgrau A, Boirie Y: Is protein metabolism changed with obesity? Curr Opin Clin Nutr Metab Care 2011;14:89–92 [DOI] [PubMed] [Google Scholar]
- 28.Menshikova EV, Ritov VB, Ferrell RE, Azuma K, Goodpaster BH, Kelley DE: Characteristics of skeletal muscle mitochondrial biogenesis induced by moderate-intensity exercise and weight loss in obesity. Journal of applied physiology 2007;103:21–27 [DOI] [PubMed] [Google Scholar]
- 29.Coen PM, Menshikova EV, Distefano G, Zheng D, Tanner CJ, Standley RA, Helbling NL, Dubis GS, Ritov VB, Xie H, Desimone ME, Smith SR, Stefanovic-Racic M, Toledo FG, Houmard JA, Goodpaster BH: Exercise and Weight Loss Improve Muscle Mitochondrial Respiration, Lipid Partitioning, and Insulin Sensitivity After Gastric Bypass Surgery. Diabetes 2015;64:3737–3750 [DOI] [PMC free article] [PubMed] [Google Scholar]
- 30.Krishnamurthy M, Ayazi F, Li J, Lyttle AW, Woods M, Wu Y, Yee SP, Wang R: c-Kit in early onset of diabetes: a morphological and functional analysis of pancreatic beta-cells in c-KitW-v mutant mice. Endocrinology 2007;148:5520–5530 [DOI] [PubMed] [Google Scholar]
- 31.Zhao M, Jung Y, Jiang Z, Svensson KJ: Regulation of Energy Metabolism by Receptor Tyrosine Kinase Ligands. Frontiers in physiology 2020;11:354. [DOI] [PMC free article] [PubMed] [Google Scholar]
- 32.Philp A, Schenk S, Perez-Schindler J, Hamilton DL, Breen L, Laverone E, Jeromson S, Phillips SM, Baar K: Rapamycin does not prevent increases in myofibrillar or mitochondrial protein synthesis following endurance exercise. J Physiol 2015;593:4275–4284 [DOI] [PMC free article] [PubMed] [Google Scholar]
- 33.Hashemolhosseini S: The role of protein kinase CK2 in skeletal muscle: Myogenesis, neuromuscular junctions, and rhabdomyosarcoma. Neurosci Lett 2020;729:135001. [DOI] [PubMed] [Google Scholar]
- 34.Beurel E, Michalek SM, Jope RS: Innate and adaptive immune responses regulated by glycogen synthase kinase-3 (GSK3). Trends Immunol 2010;31:24–31 [DOI] [PMC free article] [PubMed] [Google Scholar]
- 35.Sun T, Rodriguez M, Kim L: Glycogen synthase kinase 3 in the world of cell migration. Dev Growth Differ 2009;51:735–742 [DOI] [PubMed] [Google Scholar]
- 36.Wu D, Pan W: GSK3: a multifaceted kinase in Wnt signaling. Trends Biochem Sci 2010;35:161–168 [DOI] [PMC free article] [PubMed] [Google Scholar]
- 37.Embi N, Rylatt DB, Cohen P: Glycogen synthase kinase-3 from rabbit skeletal muscle. Separation from cyclic-AMP-dependent protein kinase and phosphorylase kinase. Eur J Biochem 1980;107:519–527 [PubMed] [Google Scholar]
- 38.Welsh GI, Proud CG: Glycogen synthase kinase-3 is rapidly inactivated in response to insulin and phosphorylates eukaryotic initiation factor eIF-2B. Biochem J 1993;294 ( Pt 3):625–629 [DOI] [PMC free article] [PubMed] [Google Scholar]
- 39.Qin X, Jiang B, Zhang Y: 4E-BP1, a multifactor regulated multifunctional protein. Cell Cycle 2016;15:781–786 [DOI] [PMC free article] [PubMed] [Google Scholar]
- 40.Jensen J, Tantiwong P, Stuenæs JT, Molina-Carrion M, DeFronzo RA, Sakamoto K, Musi N: Effect of acute exercise on glycogen synthase in muscle from obese and diabetic subjects. Am J Physiol Endocrinol Metab 2012;303:E82–89 [DOI] [PMC free article] [PubMed] [Google Scholar]
- 41.McCubrey JA, Steelman LS, Bertrand FE, Davis NM, Sokolosky M, Abrams SL, Montalto G, D’Assoro AB, Libra M, Nicoletti F, Maestro R, Basecke J, Rakus D, Gizak A, Demidenko ZN, Cocco L, Martelli AM, Cervello M: GSK-3 as potential target for therapeutic intervention in cancer. Oncotarget 2014;5:2881–2911 [DOI] [PMC free article] [PubMed] [Google Scholar]
- 42.Cohen P: The role of protein phosphorylation in human health and disease. The Sir Hans Krebs Medal Lecture. Eur J Biochem 2001;268:5001–5010 [DOI] [PubMed] [Google Scholar]
- 43.Goodpaster BH, Wolfe RR, Kelley DE: Effects of obesity on substrate utilization during exercise. Obes Res 2002;10:575–584 [DOI] [PubMed] [Google Scholar]
- 44.Tanner CJ, Barakat HA, Dohm GL, Pories WJ, MacDonald KG, Cunningham PR, Swanson MS, Houmard JA: Muscle fiber type is associated with obesity and weight loss. Am J Physiol Endocrinol Metab 2002;282:E1191–1196 [DOI] [PubMed] [Google Scholar]
Associated Data
This section collects any data citations, data availability statements, or supplementary materials included in this article.