

Abstract
Objective:
Cannabis use disorder (CUD) is the most common non-alcohol related substance use disorder (SUD) in the United States and is especially prevalent among returning veterans. The long-term mental health correlates of CUD remain unknown, which is significant given the rise in legalization and also recreational and medicinal cannabis use nationally.
Method:
Using a gender-balanced, national sample of 1,649 veterans (n = 115 with CUD; 75.2% White; Mage = 37.49, SD = 9.88), we used latent growth curve modeling to examine posttraumatic stress disorder (PTSD) symptom severity, depressive symptoms, generalized anxiety, alcohol use, and psychosocial functioning between veterans with versus without a prior diagnosis of CUD over five time points, spanning an average of 7 years.
Results:
Returning veterans with CUD compared to those without reported higher alcohol use, depression, anxiety, PTSD symptom severity, and worse psychosocial functioning at baseline. We observed nonlinear change across each outcome. We also found that CUD moderated change in alcohol use (quadratic: b = −.129, p < .001) and PTSD symptoms (quadratic: b = −.280, p = .019), such that individuals with CUD evidenced decelerated change and worse outcomes relative to veterans without a previously documented CUD diagnosis. Trajectories of depression, anxiety, and psychosocial functioning were similar across individuals with versus without CUD.
Conclusions:
In the first long-term and longitudinal evaluation of mental health and alcohol use course among returning veterans, CUD was associated with worse and more persistent alcohol use and PTSD symptom severity over time. These data have implications for clinical assessment, case conceptualization, and treatment of veterans and may inform efforts to offset risk for hazardous drinking and PTSD following a diagnosis of CUD.
Keywords: cannabis use disorder, PTSD, depression, anxiety, veterans
Approximately 3 out of 10 cannabis users in the United States (U.S.) develop cannabis use disorder (CUD) in their lifetimes, making CUD one of the most prevalent substance use disorders (SUDs) in the U.S. (Compton et al., 2019; Substance Abuse and Mental Health Services Administration, 2019). Rates of CUD among veterans have also increased in the post-9/11 era, with incidence increasing by 50% among veterans between 2002 and 2009 (Bonn-Miller et al., 2012). Recent reports suggest that the prevalence of past-year cannabis use might also be higher among veterans versus nonveterans (Bonn-Miller et al., 2012; Davis et al., 2018; Hasin et al., 2015), though research remains limited, estimates vary, and some research demonstrates lower rates of use overall compared to the general U.S. population (Davis et al., 2018). Nevertheless, cannabis use in the context of existing psychiatric distress and disorder represents a notable concern, and psychiatric disorder and comorbidity are higher among returning veterans (Debell et al., 2014; Lan et al., 2016; Seal et al., 2011). Given the increase in the legalization of medicinal and recreational cannabis, there is potential for cannabis use to continue and perhaps increase nationally (Cerda et al., 2020; Hall & Lynskey, 2016), which is problematic given the limited literature regarding the longitudinal course or consequences of CUD among returning veterans.
Compared with nonveterans, veterans experience higher depression, anxiety, SUD, and posttraumatic stress disorder (PTSD), and exceptionally high prevalence of comorbidity among these diagnoses (Debell et al., 2014; Lan et al., 2016; Seal et al., 2011). Research is also beginning to link these psychiatric diagnoses with CUD, specifically. For instance, Bonn-Miller et al. (2012) found that nearly 30% of veterans with a diagnosis of CUD, but no other SUD, had a cooccurring PTSD diagnosis. Individuals with cooccurring CUD and PTSD typically report higher PTSD symptom severity and worse clinical outcomes relative to those without CUD (Bonn-Miller et al., 2011, 2015). In the first study of its kind, Bonn-Miller et al. (2013) demonstrated that combat-deployed veterans with CUD, relative to those without CUD, reported lower levels of PTSD improvement following residential PTSD treatment. Using nation-wide epidemiological data, Hasin et al. (2016) extended these findings by showing that meeting diagnostic criteria for CUD was associated with a higher likelihood of meeting criteria for other SUDs, anxiety disorders, mood disorders, and PTSD. In aggregate, these studies demonstrate that individuals with CUD evidence increased risk for psychiatric symptoms and worse overall functioning relative to individuals who do not use cannabis or meet criteria for CUD (Crippa et al., 2009; Degenhardt et al., 2003).
In this study, we were primarily interested in examining the long-term mental health outcomes among veterans following a diagnosis of CUD. However, most extant research on the topic has focused on explicating the effects of psychiatric symptoms and diagnoses on the risk for future cannabis use and CUD (e.g., self-medication hypothesis; Bonn-Miller et al., 2011; Sarvet et al., 2018). Thus, relatively less is known regarding mental health outcomes of returning veterans following a CUD diagnosis. It appears that common psychiatric symptoms among veterans (e.g., depression, anxiety, PTSD, and alcohol use) might be affected by cannabis use and CUD (e.g., Bonn-Miller et al., 2011, 2013, 2015). These pathways are further supported by recent research by Gentes et al. (2016) who, using data collected from veterans seeking care through PTSD specialty clinics within the Veterans Health Administration (VHA), found that patients who reported cannabis use in the last 6 months reported significantly greater levels of hazardous drinking and PTSD and depression symptom severity. Notable exceptions include studies identifying potential subgroups of veterans and differences over time among veterans who subscribe to medicinal versus recreational cannabis use. Veterans who use of cannabis for “medicinal” versus “recreational” purposes report higher PTSD severity and startle response (Loflin et al., 2017), but also heavier cannabis use, potentially as a replacement for alcohol use (which was higher among “recreational” cannabis users) and as a means of self-medication (Davis et al., 2018; Gunn et al., 2019; Loflin et al., 2017). Veterans who report “medicinal” (vs. “recreational”) use also report doing so to manage psychiatric distress (e.g. PTSD, depression), sleep disturbance, and worse physical health (Metrik et al., 2018).
Most recently, Gunn et al. (2020) examined the longitudinal associations between cannabis use and future depressive symptoms among veterans. Using linear cross-lagged panel analysis, these researchers found that CUD predicted future depressive symptom severity at some waves but not all. The added value of their longitudinal follow-up study is that it offers novel insight into the prospective association between CUD and depression but also suggests the possibility that these associations are nonlinear. In a related study, researchers found that cannabis use among veterans was associated with significantly worse PTSD intrusion symptoms in the future (Metrik et al., 2020). There are many notable strengths of these studies, particularly as they relate to naturalistic longitudinal design, which is needed to evaluate natural recovery and change. However, both studies are limited in that they do not collect follow-up data beyond 12 months nor do they simultaneously evaluate the impact of CUD on interrelated concerns and psychiatric symptoms that are common among veterans (e.g., alcohol use, anxiety, depression, PTSD, and psychosocial functioning).
As noted, the associations between CUD, anxiety, depression, alcohol use, PTSD, and overall functioning have been documented; however, there are no known studies that have examined all of these outcomes simultaneously, or natural change or recovery trajectories with versus without a documented CUD diagnosis among veterans beyond 12 months. As such, there is a limited understanding of the long-term impact of CUD among veterans. Work that provides us with this understanding would be invaluable, given the rising incidence of cannabis use and CUD among veterans across the U.S. Using data from a large, multiyear longitudinal registry of veteran men and women, we examined the 7-year course of PTSD, depression, and anxiety symptoms; alcohol use; and psychosocial functioning among veterans with a documented diagnosis of CUD versus those without a diagnosis to examine naturalistic change but also between-group differences in observed change over this time period. Consistent with previous research (Gentes et al., 2016), we hypothesized that veterans with a documented diagnosis within CUD 10 years of study enrollment (as recorded in their medical record), relative to those without, would report significantly higher depression, anxiety, and PTSD symptom severity; alcohol use; and worse psychosocial functioning at baseline. Also consistent with extant albeit preliminary research (e.g., Bonn-Miller et al., 2013; Kosty et al., 2017; Lee et al., 2020), we hypothesized that veterans with a documented CUD would evidence significantly less positive symptom change over time.
Method
Participants and Procedures
Participants in this study included returning combat-deployed veterans who served in Iraq or Afghanistan between 2001 and 2009 and who subsequently enrolled in a longitudinal registry (N = 1,649). This primary data collection effort was designed to examine the longitudinal course of psychiatric disorder (namely PTSD), health, and recovery among combat-deployed veterans of Iraq and Afghanistan conflicts. All participants in this registry underwent a mental health evaluation at a Veteran Affairs (VA) Health Care Center prior to participation, as indexed by diagnostic interview or psychotherapy procedure code, between July 2008 and December 2009 (see also, Rosen et al., 2012). Eligible patients were identified through national VHA claims databases; patients with PTSD diagnoses were randomly selected and oversampled, relative to patients without PTSD who were also randomly selected (3:1 PTSD:no PTSD in the final sample). We also oversampled women (1:1). Once identified, potential participants were contacted by phone and, if consented, enrolled in the study. The average date of enrollment and completion of T1/baseline assessment was 2011 (SD = .80; range: 2009–2012). There were variable time lags across participants and between time lags, ranging from approximately 1–2 and a half years between waves (see Descriptive Results section). Aside from primary data collection described above, we also extracted from participants’ VA medical records certain diagnosis codes for secondary data analysis and to examine patient-level predictors of psychiatric disorder and recovery across waves of primary data collection. Our CUD diagnosis variable was extracted from VA medical records and all other data came from the longitudinal registry. All participants provided informed consent, and all study procedures were approved by the local Institutional Review Board (IRB) and Human Research Protection Office, U.S. Army Medical Research and Material Command.
Measures
Demographics
All participants completed baseline measures, including questions regarding basic demographic (e.g., age, race, gender) and deployment dates.
CUD Diagnosis
We used national VA electronic medical record (EMR) data to identify all veterans in the sample with a CUD diagnosis assigned by a licensed health professional during any VA facility visit in the 10 years prior to, but not after, the participants’ study enrollment. Diagnoses were based on International Classification of Diseases, version 9 (ICD-9), codes for CUD. A 10-year prestudy period was chosen to cast a wide net when creating our CUD cohort and to cover the eligibility window used for primary data collection (i.e., recruitment of veterans deployed on or after 2001).
PTSD Symptoms
We used the 17-item PTSD Symptom Checklist (PCL-C; Weathers et al., 1993) for Diagnostic and Statistical Manual of Mental Disorders (DSM-IV) for T1 assessment (as DSM-IV was still in use at the time of T1 assessment) and the 20-item self-report PTSD Symptom Checklist for DSM-5 (PCL-5; Weathers et al., 2013) for T2–T4. The PCL-C quantifies PTSD symptom severity on a1 (not at all) to5 (extremely) scale, whereas the PCL-5 uses a 0 (not at all) to4 (extremely) scale. PCL-C scores at T1 were converted to PCL-5 scores using score conversions from a recently validated crosswalk procedure (Moshier et al., 2019). Once PCL-C scores were converted, total PTSD symptoms scores ranged from 0 to 80, identical to that of PCL-5, with higher scores indicating greater PTSD severity. Internal consistencies were very high in this study (α’s for T1, T2, T3, T4, T5 were .94, .96, .96, .96, .96, respectively) and stability of PTSD symptoms over time was modest to high (r = .65–.83, all p < .001).
Alcohol Use
Alcohol consumption and related problems were measured at each wave using the 10-item Alcohol Use Disorders Identification Test (AUDIT; Saunders et al., 1993). This assessment includes items to assess alcohol consumption (e.g., “How often do you have six or more drinks on one occasion?”), dependence (e.g., “ How often during the last year have you found that you were not able to stop drinking once you started?”), and alcohol use-related negative consequences (e.g., “Have you or someone else been injured because of your drinking?”). Each item is measured on a 0–4 scale, which is totaled to create a total AUDIT score ranging anywhere from 0 to 40, with higher scores indicated higher alcohol consumption, probable disorder, and related negative consequences. The AUDIT demonstrated strong internal consistency (α’s for T1, T2, T3, T4, T5 were .86, .87, .88, .87, .87, respectively) and stability between time points was variable (r = .53–.77, all p < .001).
Patient Health Questionnaire
The Patient Health Questionnaire (PHQ; Spitzer et al., 1999) is a self-report version of the Primary Care Evaluation of Mental Disorders (PRIME-MD). The PHQ is a 58-item questionnaire that access symptoms for mood, anxiety, alcohol, eating, and somatoform disorders and can be used to evaluate diagnostic status and severity. Due to mood and anxiety disorders being the most common comorbid diagnosis with CUD, we examined severity scores for depression and generalized anxiety disorder specifically. The nine-item depression scale demonstrated strong internal consistency (α’s for T1, T2, T3, T4, T5 were .86, .87, .88, .87, .90, respectively) and reliability (r = .62–.76, all p < .001). The seven-item anxiety scale demonstrated strong internal consistency (α’s for T1, T2, T3, T4, T5 were .86, .87, .88, .87, .86, respectively) and varying stability between repeated measures (r = .53–.73, all p < .001).
Psychosocial Functioning
The Inventory of Psychosocial Functioning (IPF; Bovin et al., 2018) is an 80-item, self-report measure of PTSD-related psycho-social functional impairment. Participants answer a yes/no question on each domain in the past 30 days. If participants answer “yes” to a particular domain, they are then prompted to answer additional questions on a Likert-type scale ranging from 0 = never to 6 = always. The sum of all the completed IPF scale scores is divided by the number of scales completed to obtain a total score between 0 and 100, with higher numbers indicating greater functional impairment. The IPF scale demonstrated strong internal consistency (α’s for T1, T2, T3, T4, T5 were .86, .87, .88, .87, .90, respectively) and stability that ranged from r = .63–.77 (all p < .001).
Data Handling and Analytic Strategy
We tested hypotheses using latent growth curve modeling (LGCM), fit using the OpenMx package (Neale et al., 2016) in R. Plots were created using lme4 (for multilevel models; Bates et al., 2015) and visreg (Breheny & Burchett, 2017). Use of LGCM allowed us to model symptom course over the observational period, interindividual differences in symptom course, and specify CUD status as a moderator of symptom change specifically. We modeled alcohol, depression, anxiety, PTSD symptoms, and psychosocial functioning separately. We first examined scatter plots and observed nonlinear trends across each variable over time. To correctly specify our change trajectories, and prior to inclusion of moderators and covariates, we first constructed unconditional linear change models that we then used as references to evaluate model fit for quadratic, cubic, and quartic change models. We specified linear time as the average time lag, in months, between participants’ baseline and each subsequent assessment (i.e., 0 [base-line], 2.42, 3.38, 4.52, 6.94 years postbaseline) in order to account for and correctly model differential time lags between follow-up assessments. Quadratic, cubic, and quartic models were created by raising time to the second, third, and fourth power, respectively. We evaluated overall model fit using root·mean square error of approximation (RMSEA), comparative fit index (CFI), and Tucker–Lewis index (TLI; Bentler, 1990; Hu & Bentler, 1998; MacCallum et al., 1996; Schermelleh-Engel et al., 2003; Tucker & Lewis, 1973) and relative model fits using RMSEA, 95% CIs, Akaike information criterion (AIC), and log-likelihood ratio tests for each nonlinear change model relative to the unconditional linear change reference model (see Table 1; Grimm et al., 2017; Wickrama et al., 2016).
Table 1.
Model Fit Indices and Tests of Comparative Fit for Unconditional Change Models (No Time-Invariant Predictors)a
| Primary Variables | Growth Specification | RMSEA [95% CI] | TLI | CFI | AIC | −2LL |
|---|---|---|---|---|---|---|
| Alcohol | Linear (ref.) | .10 [.08, .11] | .96 | .95 | 39,278.53 | Ref. |
| Quadratic | .08 [.06, .09]* | .98 | .98 | 39,158.97 | 127.56*** | |
| Cubic | .08 [.07, .10]* | .97 | .97 | 39,176.36 | 110.17*** | |
| Quartic | .09 [.07, .10] | .97 | .97 | 39,190.40 | 96.13** | |
| PTSD | Linear (ref.) | .09 [.08, .11] | .96 | .95 | 44,440.21 | Ref. |
| Quadratic | .07 [.06, .09]* | .98 | .98 | 44,327.92 | 120.29* | |
| Cubic | .07 [.05, .08]* | .98 | .98 | 44,320.42 | 127.79* | |
| Quartic | .07 [.05, .08]* | .98 | .98 | 44,317.06 | 131.15* | |
| Depression | Linear (ref.) | .06 [.05, .08] | .98 | .97 | 38,494.90 | Ref. |
| Quadratic | .03 [.02, .05]* | >.99 | >.99 | 38,420.24 | 82.65* | |
| Cubic | .04 [.02, .06] | .99 | .99 | 38,428.35 | 74.54* | |
| Quartic | .05 [.03, .06] | .99 | .99 | 38,436.47 | 66.42* | |
| Anxiety | Linear (ref.) | .06 [.05, .08] | .98 | .97 | 30,934.38 | Ref. |
| Quadratic | .03 [.01, .05]* | >.99 | >.99 | 30,858.94 | 83.44* | |
| Cubic | .04 [.02, .05]* | .99 | .99 | 30,864.90 | 77.47* | |
| Quartic | .05 [.03, .06]* | .99 | .99 | 30,878.33 | 64.05* | |
| IPF | Linear (ref.) | .05 [.04, .07] | .99 | .99 | 50,848.32 | Ref. |
| Quadratic | .03 [.02, .05]* | >.99 | >.99 | 50,806.32 | 50.00* | |
| Cubic | .04 [.02, .05]* | >.99 | >.99 | 50,809.85 | 46.47* | |
| Quartic | .04 [.02, .06]* | .99 | .99 | 50,813.37 | 42.95* | |
| Model fit indices and tests of comparative fit for models as predictor paths were freely estimatedb | ||||||
| RMSEA [95% CI] | TLI | CFI | AIC | −2LL | ||
|
| ||||||
| Alcohol | Constrained | .06 [.06, .07] | .93 | .93 | 70,387.64 | — |
| CUD | .06 [.05, .07] | .94 | .94 | 70,345.49 | 48.15*** | |
| Gender | .06 [.05, .07] | .94 | .95 | 70,320.44 | 31.05*** | |
| Racec | .06 [.05, .07] | .93 | .95 | 70,325.26 | 1.18 | |
| Age | .06 [.05, .07] | .94 | .95 | 70,303.88 | 22.56*** | |
| TSDc | .06 [.05, .07] | .93 | .95 | 70,309.71 | .17 | |
| PTSD | Constrained | .06 [.05, .07] | .93 | .93 | 75,556.59 | — |
| CUD | .06 [.05, .07] | .94 | .94 | 75,536.39 | 26.21*** | |
| Genderc | .06 [.05, .07] | .93 | .94 | 75,535.54 | 6.84 | |
| Race | .06 [.05, .07] | .94 | .95 | 75,517.63 | 24.75*** | |
| Age | .06 [.05, .07] | .94 | .95 | 75,507.85 | 15.78** | |
| TSD | .06 [.05, .07] | .93 | .95 | 75,499.88 | 13.97** | |
| Depression | Constrained | .05 [.05, .06] | .94 | .94 | 69,648.92 | — |
| CUD | .05 [.05, .06] | .95 | .95 | 69,625.00 | 29.91*** | |
| Genderc | .05 [.05, .06] | .94 | .95 | 69,624.12 | 6.88 | |
| Race | .05 [.04, .06] | .95 | .96 | 69,602.00 | 29.00*** | |
| Age | .05 [.04, .06] | .96 | .96 | 69,578.50 | 29.49*** | |
| TSDc | .05 [.04, .06] | .95 | .97 | 69,577.82 | 6.69 | |
| Anxiety | Constrained | .05 [.04, .06] | .95 | .95 | 62,087.61 | — |
| CUD | .05 [.04, .06] | .95 | .95 | 62,077.18 | 16.42*** | |
| Gender | .05 [.04, .06] | .95 | .95 | 62,069.09 | 14.09** | |
| Race | .05 [.04, .06] | .96 | .96 | 62,065.03 | 10.06* | |
| Age | .05 [.04, .06] | .95 | .96 | 62,054.67 | 16.37*** | |
| TSD | .05 [.04, .06] | .94 | .95 | 62,052.82 | 7.84* | |
| IPF | Constrained | .05 [.04, .06] | .96 | .96 | 82,034.99 | — |
| CUD | .05 [.04, .06] | .96 | .96 | 82,018.68 | 22.31*** | |
| Genderc | .05 [.04, .06] | .96 | .96 | 82,016.89 | 7.79 | |
| Race | .05 [.04, .06] | .96 | .96 | 82,010.74 | 13.95** | |
| Age | .05 [.04, .06] | .96 | .97 | 81,987.50 | 29.24*** | |
| TSD | .05 [.04, .06] | .96 | .97 | 81,985.27 | 8.23* | |
Note. PTSD = posttraumatic stress disorder; CUD = cannabis use disorder; Ref. = reference model; RMSEA = root mean square error of approximation; TLI = Tucker-Lewis index; CFI = comparative fit index; AIC = akaike information criterion (parameter adjusted); −2LL = log-likelihood ratio test (to compare relative fit); 95% CI = 95% confidence interval; IPF = inventory of psychosocial functioning; TSD = time since deployment.
Non-linear change models were evaluated relative to their respective unconditional linear change models, with best fitting models italics. Quadratic fit models, italics, were the best fitting in all cases except PTSD. Cubic and quartic change models provided slightly better fits for PTSD but quadratic was retained due to equivalent RMSEA and other global fit indices, and for parsimony.
CUD models were evaluated relative to the unconditional model with all predictor paths constrained to zero (i.e., “constrained” model); subsequent predictor models were evaluated against the best previous model tested (e.g., model with gender paths estimated relative to model with CUD paths estimated only).
Predictor was non-significant in the model; its paths were subsequently constrained to zero.
p < .05.
p < .01.
p < .001.
Once we identified the appropriate growth terms for each model, we used a stepped approach for these analyses to examine CUD diagnosis as a moderator of change while also including gender, race, age, and time since deployment as time-invariant covariates. We first constructed a baseline comparison model, for each outcome, by including/estimating the means and variances of each covariate but constraining their model paths to zero (Grimm et al., 2017). We subsequently allowed paths for CUD (0 = no, 1 = yes), then gender (female = 0, male = 1), race (White = 1, non-White = 0), age (continuous), and time since return from deployment (i.e., time lag in months, from return home to study enrollment) to be freely estimated, one at a time, to compare relative fit of each predictor for inclusion in the final model. The final models reported were those that demonstrated the greatest fit, which included paths that improved model fit while excluding paths that did not improve fit, both in accordance with log-likelihood ratio tests (see Table 1). In cases where the predictor did not improve model fit, its mean and variance were nevertheless retained in the model, but its paths constrained to zero. Also freely estimated across each model were the covariances between baseline scores (intercepts), linear, and quadratic slopes. Doing so allowed us to account for baseline severity (e.g., baseline alcohol use and its association with change in alcohol use), and the covariance between baseline scores and change when examining the moderated effects of CUD status and other time-invariant predictors. Final models were estimated using maximum likelihood and full information maximum likelihood (FIML) for missing data.
Results
Descriptive Results
We present participant demographics, along with means, standard deviations, and ranges for psychosocial functioning, alcohol use, PTSD symptom severity, depressive symptom severity, and anxiety symptom severity in Table 2. A clerical error resulted in 42.23% of participants not receiving a PCL-IV at T1. This error was corrected, and the remaining 953 participants received the PCL-IV at baseline. Each of our 1,649 participants was represented in the PTSD model, which was accomplished through repeated measurement (e.g., participants missing baseline data completing subsequent waves) and our use of FIML to handle all missing data. Missing participants on subsequent waves included 275 (16.7%), 302 (18.3%), 407 (24.7%), and 618 (37.5%) at T2–T5, respectively. The mean length of time between T1 and T2, T2 and T3, T3 and T4, and T4 and T5 assessments was 28.86 (SD = 6.55), 11.57 (SD = 1.33), 13.32 (SD = 1.96), and 29.35 (3.27) months, respectively (we modeled time accordingly in our analyses). There were no statistically significant differences between participants with versus without a documented CUD regarding time lags between follow up-assessments, p = .15–.51.
Table 2.
Demographic and Other Characteristics of the Sample (N = 1,649)
| CUD (n = 115) |
Non-CUD (n = 1,534) |
Test statistic |
|||
|---|---|---|---|---|---|
| Descriptives for Categorical Variables | N | % | n | % | χ2 |
| Gender | 5.32 | ||||
| Male | 70 | 60.90 | 754 | 49.20* | |
| Female | 45 | 39.10 | 780 | 50.80* | |
| Race/ethnicity | 5.42* | ||||
| White | 78 | 67.80 | 1,162 | 75.70 | |
| Black/African American | 23 | 20.00 | 238 | 15.50 | |
| American Indian/Alaskan Native | 3 | 2.60 | 15 | 1.00 | |
| Asian | 1 | .90 | 14 | .90 | |
| Hawaiian/Pacific Islander | 0 | .00 | 4 | .30 | |
| Multiracial | 5 | 4.30 | 57 | 3.70 | |
| CUD |
Non-CUD |
||||
| Descriptives for Continuous Variables | M | SD | M | SD | F |
|
| |||||
| Age | 33.18 | 8.20 | 37.81 | 9.92 | 23.77*** |
| Time since deployment (months) | 73.69 | 24.82 | 73.73 | 24.82 | .00 |
| Alcohol usea | |||||
| Time 1 | 9.18 | 8.08 | 6.02 | 6.39 | 24.86*** |
| Time 2 | 9.24 | 8.70 | 5.37 | 6.25 | 29.90*** |
| Time 3 | 8.99 | 9.05 | 5.40 | 6.45 | 22.21*** |
| Time 4 | 7.24 | 7.60 | 4.76 | 5.76 | 11.83*** |
| Time 5 | 5.63 | 5.79 | 5.14 | 6.09 | .31 |
| PTSD symptomsb | |||||
| Time 1 | 50.13 | 18.41 | 42.01 | 19.35 | 10.75** |
| Time 2 | 48.52 | 19.41 | 38.75 | 20.24 | 17.97*** |
| Time 3 | 50.02 | 21.25 | 39.30 | 20.42 | 18.85*** |
| Time 4 | 44.52 | 18.40 | 35.59 | 20.86 | 11.19*** |
| Time 5 | 42.78 | 18.25 | 36.33 | 19.68 | 4.62* |
| Depressive symptomsc | |||||
| Time 1 | 15.85 | 6.40 | 12.65 | 6.77 | 22.86*** |
| Time 2 | 14.49 | 6.53 | 11.46 | 6.69 | 16.40*** |
| Time 3 | 14.66 | 7.63 | 11.62 | 6.82 | 14.26*** |
| Time 4 | 14.40 | 6.85 | 11.45 | 6.83 | 11.81*** |
| Time 5 | 12.85 | 6.45 | 11.31 | 6.73 | 2.40 |
| Anxiety symptomsc | |||||
| Time 1 | 9.98 | 3.00 | 9.13 | 3.28 | 7.02** |
| Time 2 | 9.25 | 3.24 | 8.30 | 3.68 | 5.55* |
| Time 3 | 9.36 | 3.77 | 8.33 | 3.62 | 5.89* |
| Time 4 | 9.89 | 3.12 | 8.35 | 3.80 | 11.18*** |
| Time 5 | 9.22 | 2.85 | 8.17 | 3.70 | 3.94* |
| Psychosocial functioning | |||||
| Time 1 | 47.01 | 16.38 | 41.43 | 15.73 | 13.26*** |
| Time 2 | 45.76 | 16.82 | 39.39 | 15.41 | 14.05*** |
| Time 3 | 46.46 | 15.94 | 39.77 | 16.11 | 13.12*** |
| Time 4 | 46.83 | 17.17 | 38.44 | 15.79 | 18.71*** |
| Time 5 | 43.56 | 15.92 | 37.49 | 15.70 | 6.83** |
Note. CUD = cannabis use disorder; PTSD = posttraumatic stress disorder.
The clinical cutoff for the AUDIT is 8 (Conigrave et al., 1995).
The clinical cut off for the PCL-5 and converted PCL-IV is 33 (Bovin et al., 2016).
Depression and anxiety scores of 5, 10, and 15 correspond to mild, moderate, and severe depression and anxiety, respectively (Spitzer et al., 2006; Kroenke et al., 2001).
p < .05.
p < .01.
p < .001.
Primary Analyses
Each quadratic change model provided a superior fit relative to its respective linear change model (see Table 1), and the best fit overall relative to cubic and quartic change models with the exception of PTSD symptom severity. Although cubic and quartic PTSD change models produced slightly lower AIC values, these changes were not statistically significant and we retained the quadratic change model due to equivalent RMSEA and other global fit indices and for parsimony (see Wickrama et al., 2016). The fully constrained models (with predictor means and variances included but paths constrained to zero) all demonstrated good fit (Table 1). Time-invariant predictors were then included/excluded from final models in accordance with the configuration that provided the best overall model fit, in accordance with log-likelihood ratio tests. Comparative fit was not evaluated using global fit indices, as it is common for these indices to not change appreciably when predictor paths are freely estimated (Grimm et al., 2017). While inclusion of CUD improved model fit for each outcome, other time-invariant predictors did not (see Table 1 for variables included/excluded). Nevertheless, their means and variances remained in the models, but their paths constrained to zero (see Tables 1 and 3).
Table 3.
Unstandardized Latent Growth Curve Modeling Output for Final Models With Time-Invariant Predictors
| Alcohol |
PTSD |
Depression |
Anxiety |
IPF |
||||||
|---|---|---|---|---|---|---|---|---|---|---|
| Model Paths, Means, and Variances | Estimate | SE | Estimate | SE | Estimate | SE | Estimate | SE | Estimate | SE |
| Regressions | ||||||||||
| Intercept → linear slope | −2.249*** | .462 | −2.416 | 2.673 | −1.700*** | .517 | .144 | .140 | −7.616** | 2.695 |
| Intercept → quadratic slope | .077 | .058 | −.836* | .378 | .115† | .068 | −0.031† | .018 | .539 | .357 |
| Linear slope → quadratic slope | −.235*** | .032 | −2.014*** | .323 | −.235*** | .039 | −.055*** | .012 | −1.019*** | .186 |
| CUD → intercept | 2.762 *** | .625 | 7.286 *** | 2.101 | 3.302 *** | .655 | 1.029 ** | .322 | 5.992 *** | 1.496 |
| CUD → linear slope | .497 † | .265 | 1.937 * | .889 | .212 | .288 | .172 | .155 | .624 | .592 |
| CUD → quadratic slope | −.129 *** | .037 | −.280 * | .120 | −.066 | .042 | −.016 | .023 | −.077 | .087 |
| Gender → intercept | 1.755*** | .319 | — | — | — | — | .074 | .168 | — | — |
| Gender → linear slope | −.043 | .128 | — | — | — | — | −.223** | .077 | — | — |
| Gender → quadratic slope | −.005 | .017 | — | — | — | — | .022* | .011 | — | — |
| Age → intercept | −.069*** | .016 | .186*** | .056 | .080*** | .017 | .030*** | .008 | .180*** | .040 |
| Age → linear slope | .012† | .006 | −.020 | .021 | −.007 | .007 | −.002 | .004 | −.019 | .015 |
| Age → quadratic slope | −.002* | .001 | −.000 | .003 | −.000 | .001 | −.000 | .001 | −.000 | .002 |
| Race → intercept | — | — | −5.006*** | 1.283 | −1.661*** | .403 | −.489* | .205 | −2.151* | .943 |
| Race → linear slope | — | — | −.268 | .493 | −.1609 | .167 | −.005 | .093 | −.537 | .364 |
| Race → quadratic slope | — | — | .065 | .065 | .036 | .023 | .003 | .013 | .074 | .050 |
| TSD → intercept | — | — | .077*** | .022 | — | — | .009** | .003 | .029† | .016 |
| TSD → linear slope | — | — | −.021* | .009 | — | — | −.001 | .001 | −.017** | .006 |
| TSD → quadratic slope | — | — | .003* | .001 | — | — | −.000 | .000 | .002* | .001 |
| Intercepts | ||||||||||
| Intercept | 7.803*** | .643 | 33.513*** | 2.861 | 10.855*** | .759 | 7.529*** | .451 | 34.200*** | 2.098 |
| Linear slope | −.750** | .255 | .874 | .962 | −.076 | .311 | .003 | .206 | 1.647* | .814 |
| Quadratic slope | .092** | .034 | −.102 | .126 | .037 | .043 | .018 | .028 | −.156 | .112 |
| CUD | .070*** | .006 | .070*** | .006 | .070*** | .006 | .070*** | .006 | .070*** | .006 |
| Gender | .500*** | .012 | .500*** | .012 | .500*** | .012 | .500*** | .012 | .500*** | .012 |
| Age | 37.490*** | .243 | 37.490*** | .243 | 37.490*** | .243 | 37.486*** | .243 | 37.486*** | .243 |
| Race | .785*** | .010 | .785*** | .010 | .785*** | .010 | .785*** | .010 | .785*** | .010 |
| TSD | 73.732*** | .613 | 73.754*** | .613 | 73.732 | .613 | 73.741 | .613 | 73.736 | .613 |
| Variances | ||||||||||
| Intercept | 32.152*** | 1.468 | 283.985*** | 14.320 | 32.432*** | 1.602 | 6.846*** | .406 | 182.926*** | 8.698 |
| Linear slope | 2.352*** | .251 | 18.447*** | 2.439 | 2.074*** | .296 | .480*** | .089 | 9.104*** | 1.410 |
| Quadratic slope | .027*** | .004 | .256*** | .045 | .030*** | .006 | .007*** | .002 | .132*** | .026 |
| CUD | .065*** | .002 | .065*** | .002 | .065*** | .002 | .065*** | .002 | .065*** | .002 |
| Gender | .250*** | .009 | .250*** | .009 | .250*** | .009 | .250*** | .009 | .250*** | .009 |
| Age | 97.583*** | 3.398 | 97.583*** | 3.398 | 97.585*** | 3.398 | 97.584*** | 3.398 | 97.584*** | 3.399 |
| Race | .169*** | .006 | .169*** | .006 | .169*** | .006 | .169*** | .006 | .169*** | .006 |
| TSD | 598.078*** | 21.221 | 598.048*** | 21.214 | 597.988*** | 21.212 | 598.070*** | 21.218 | 598.095*** | 21.222 |
| Fit statistics | ||||||||||
| RMSEA | .059 | .062 | .048 | .052 | .050 | |||||
| CFI | .953 | .951 | .965 | .962 | .970 | |||||
| TLI | .940 | .933 | .956 | .943 | .959 | |||||
Note. Bolded text highlights the central associations of interest that were observed between CUD status and intercepts and linear and quadratic change slopes. PTSD = posttraumatic stress disorder; CUD = cannabis use disorder (0 = no, 1 = yes); IPF = inventory of psychosocial functioning; SE = standard error; RMSEA = root mean square error of approximation; TLI = Tucker-Lewis index; CFI = comparative fit index. Race was excluded from the alcohol model to improve model fit. TSD = time since deployment.
p < .10.
p < .05.
p < .01.
p < .001.
Alcohol Use
Alcohol use decreased to a statistically significant degree over time (linear: b = −.750, p = .003), particularly within the first three measurement periods (quadratic: b = .09, p = .006), and especially for individuals with higher baseline alcohol use severity (b = −2.25, p < .001). After accounting for these effects, and as hypothesized, CUD status moderated baseline alcohol use (b = 2.76, p < .001) and change over time (linear: b = .50, p = .061; quadratic: b = −.13, p < .001; see Figure 1). As displayed in Figure 2, individuals without a documented CUD diagnosis evidenced a more immediate decrease in alcohol use severity, beginning below the clinical cutoff of 8 (Conigrave et al., 1995), which stabilized over time. In contrast, individuals with a previously documented CUD diagnosis began above the clinical cutoff and evidenced a more gradual decrease, which did not fall below the clinical cutoff until approximately years later. We also found that men reported higher AUDIT scores at baseline than women, though gender was unrelated to change. Lastly, younger veterans reported higher AUDIT scores and age was related to rate of change (see Table 3).
Figure 1.
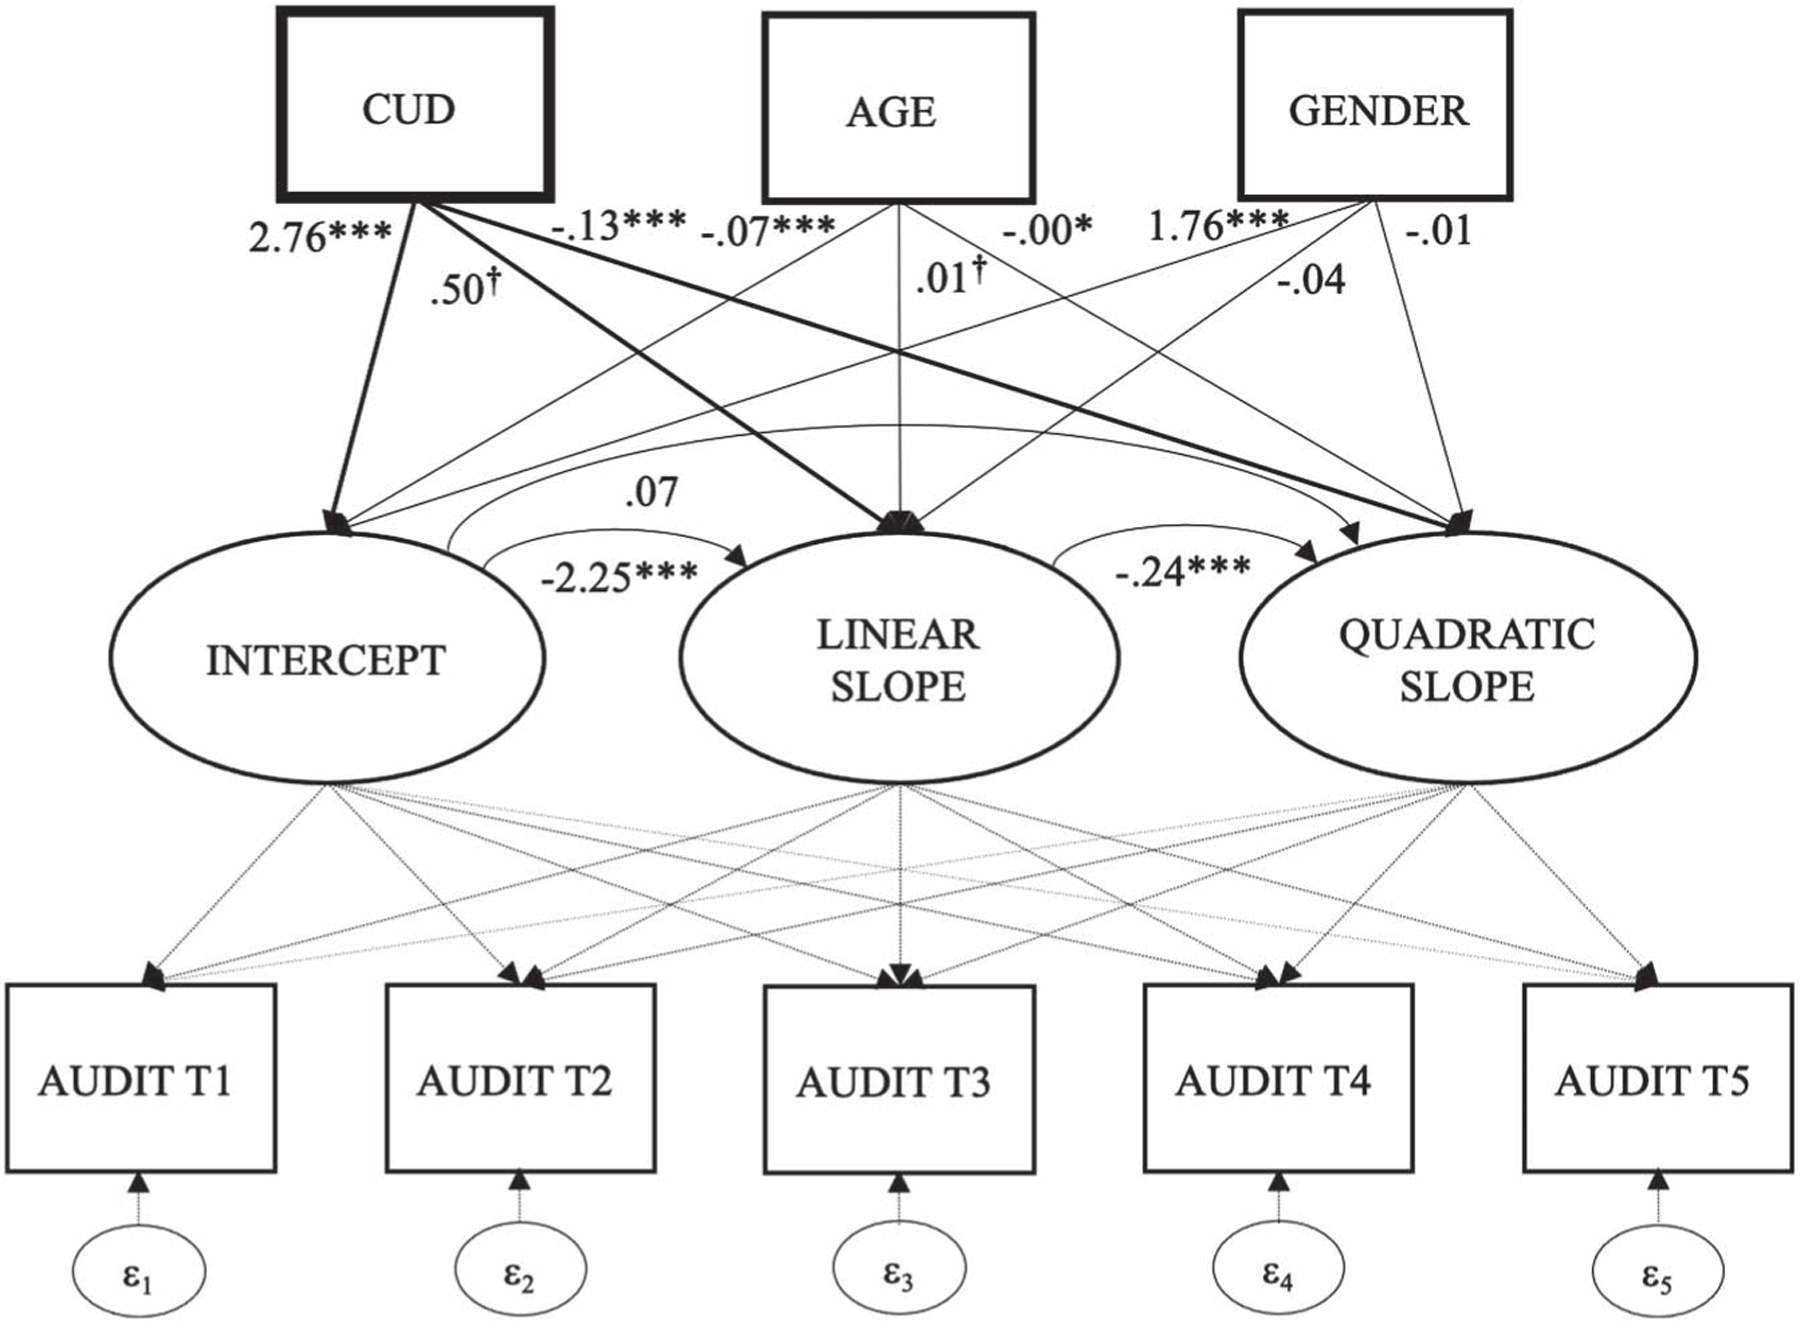
Structural Model Featuring Intercept and Linear and Quadratic Change of Alcohol Use Over Time, and as a Function of Baseline Cannabis Use Disorder
Figure 2.
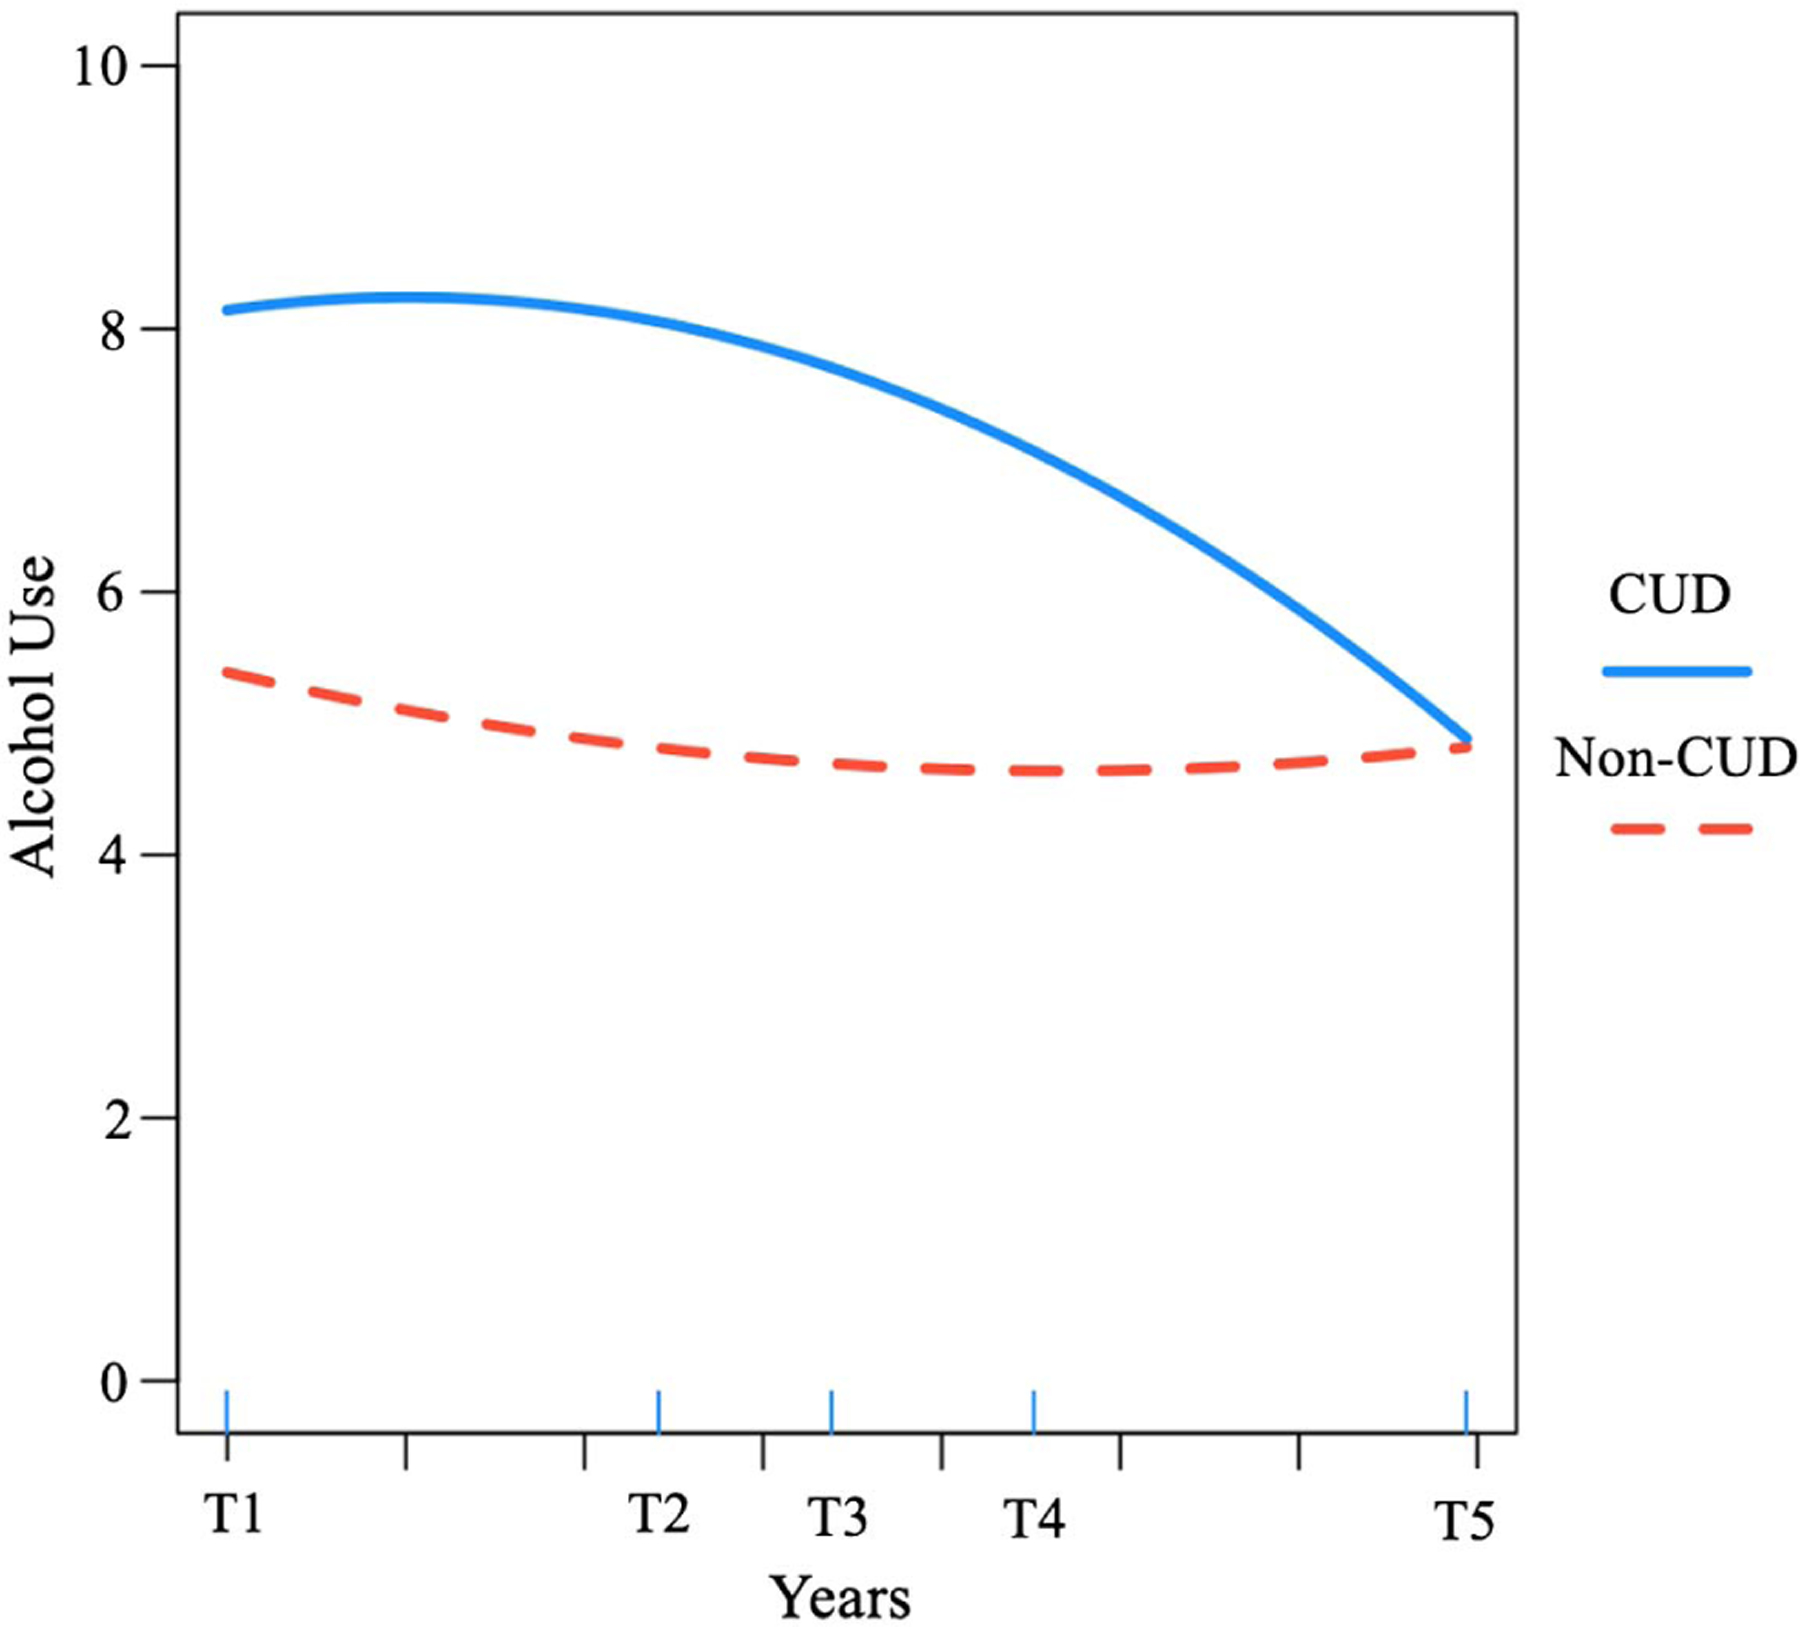
Alcohol Use Severity Over Time for Returning Veterans With Versus Without a Diagnosis of Cannabis Use Disorder
Note. See the online article for the color version of this figure.
PTSD Symptoms
We did not observe an overall mean change in PTSD symptom severity over time (linear: b = .87, p = .363; quadratic: b = −.10, p = .419). While baseline PTSD severity did not predict the rate of linear change, it was associated with quadratic change (b = −.84, p = .027; see Figure 3). Individuals with a previously documented CUD diagnosis reported higher baseline PTSD symptom severity (b = 7.29, p < .001), and change in PTSD symptoms was moderated by CUD with respect to quadratic (b = −.28, p = .019) and linear change trajectories (b = 1.93, p = .029). As depicted in Figure 4, the direction of these effects suggests a higher starting point with respect to PTSD symptom severity and a slower rate of improvement among veterans with CUD at baseline. Returning veterans who were older (b = .19, p < .001), non-White race (b = −5.01, p < .001), and who had a longer time lag from deployment to study enrollment (b = .08, p = .014) reported higher baseline PTSD symptom severity and time since deployment predicted the rate of PTSD change (see Table 3).
Figure 3.
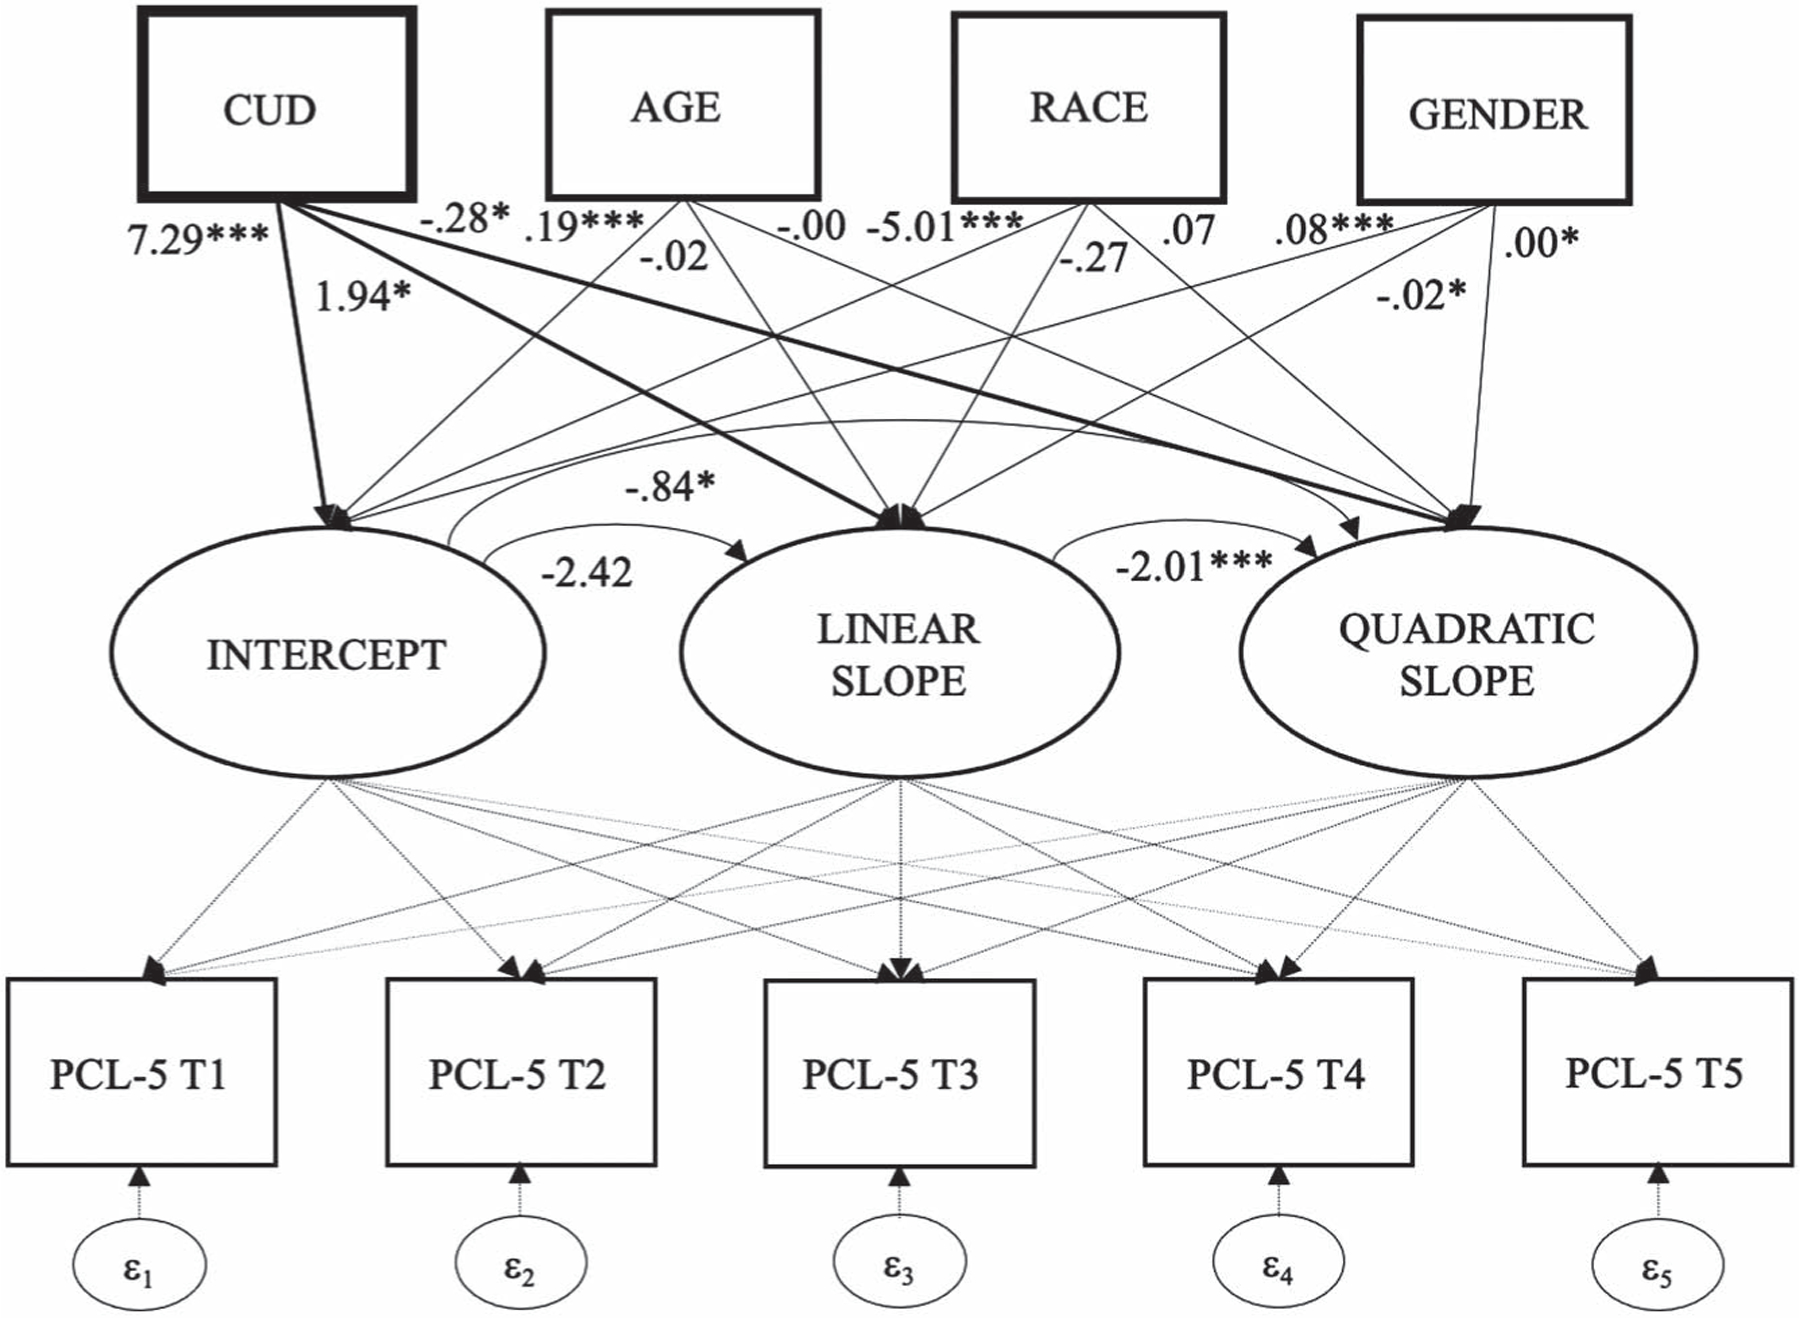
Structural Model Featuring Intercept and Linear and Quadratic Change of PTSD Symptoms Over Time, and as a Function of Baseline Cannabis Use Disorder
Figure 4.

PTSD Symptoms Severity Over Time for Returning Veterans With Versus Without a Diagnosis of Cannabis Use Disorder
Note. See the online article for the color version of this figure.
Depressive Symptoms
We did not observe a statistically significant change in depressive symptoms over time, relative to its variance. However, higher baseline depressive symptoms were associated with accelerated linear rate of improvement over time (b = −1.70, p < .001); baseline depression did not predict quadratic change. Individuals with a prior CUD diagnosis (b = 3.30, p < .001), who were older (b = .08, p < .001), and non-White reported higher depression at baseline (b = −1.66, p < .001), but showed similar rates of change over time.
Anxiety Symptoms
We did not observe a mean change in anxiety symptoms over time, and baseline anxiety was unrelated to its rate of change. Individuals with a previously documented CUD diagnosis (b = 1.03, p = .001), older versus younger (b = .03, p < .001), non-White (b = −4.89, p = .017), and with a longer delay from deployment and study enrollment (b = .009, p = .008) reported higher anxiety at baseline. Returning veteran men reported a greater rate of improvement relative to returning veteran women over time (linear: b = −.22, p = .003; quadratic: b = .02, p = .038), but no other factors were related to rate of change.
Psychosocial Functioning
Psychosocial functioning scores increased over time (i.e., became more severe; linear: b = 1.65, p = .043), but this trend was suppressed for those with higher baseline scores (b = −7.62, p = .005). Individuals with a previously documented CUD diagnosis (b = 5.99, p < .001), older age (b = .18, p < .001), and non-White race (b = −2.15, p = .023) reported worse psychosocial functioning scores at baseline. Duration of time since deployment was marginally related to baseline scores and significantly related to the rate of change. See Table 3 for full final model output.
Discussion
In this longitudinal study, we analyzed existing data to examine the prospective mental health and psychosocial functioning outcomes among returning veterans with versus without a previously documented diagnosis of CUD. As hypothesized, we found that veterans with a prior CUD diagnosis—that is, within the 10 years of study enrollment, as confirmed by their medical records—reported greater alcohol use, PTSD, depression, anxiety, and worse psychosocial functioning at baseline. More importantly, and as expected, returning veterans with a previously documented CUD exhibited worse and more persistent PTSD symptom severity and more hazardous alcohol use over time relative to those without a prior CUD diagnosis. We did not assess CUD prospectively and are therefore unable to examine CUD as a time-varying moderator of alcohol use and PTSD symptom change. Rather, with these results, we highlight disparate psychiatric symptom and functioning scores at baseline and enduring patterns of alcohol use and PTSD severity among returning veterans with a previously documented CUD diagnosis. On the other hand, we did not observe differential growth trajectories between returning veterans with versus without a prior CUD diagnosis on measures of depression, anxiety, or psychosocial functioning.
Our first hypothesis was supported in that returning veterans with a documented CUD diagnosis prior to their baseline assessment reported higher symptom severity scores for depression, anxiety, and PTSD, as well as more hazardous alcohol use and poorer psychosocial functioning. Although ancillary to our primary aims, we also observed demographic differences in baseline scores. Namely, men reported higher baseline alcohol use severity; and age was negatively related to baseline alcohol use scores and positively related to baseline depression, anxiety, PTSD, and worse psychosocial functioning. Returning veterans of color also reported worse baseline PTSD, depression, anxiety, and psychosocial functioning scores (predictor paths for race were excluded from the alcohol model, as they did not improve model fit). Lastly, the more time elapsed between deployment and study enrollment was positively associated with baseline PTSD and anxiety severity.
We found partial support for our second hypothesis that returning veterans with a CUD recorded prior to their baseline assessment would evidence worse and more persistent problems across measured mental health, alcohol use, and psychosocial functioning outcomes. Although returning veterans with a previously documented CUD reported higher depression and anxiety symptom severity, and worse psychosocial functioning at baseline, we did not find significant differences in the rate of change for each of these measures as a function of CUD status. That is, there appear to be strong associations between CUD and depression and anxiety symptoms and psychosocial functioning, yet other unmeasured factors may better account for the observed changes across these indices over time. On the other hand, we found that CUD moderated change in alcohol use and PTSD, such that individuals with a documented CUD evidenced decelerated change and enduring psychiatric disparity on measures of alcohol use and PTSD symptoms. More precisely, and as depicted in Figure 2, returning veterans with a prior diagnosis of CUD were, on average, above the clinical cutoff of 8 on the AUDIT at baseline, consistent with alcohol use disorder (Conigrave et al., 1995), and remained above this cutoff for an average of 4–5 years. On the other hand, returning veterans without a documented CUD never exceeded the clinical cutoff of 8, then decreased and stabilized their drinking over time. Thus, CUD may increase the likelihood of receiving an alcohol use disorder (AUD) diagnosis (Blanco et al., 2016), negatively impact recovery (Subbaraman et al., 2017), and function to maintain AUD symptoms (Weinberger et al., 2016).
Like alcohol use, returning veterans with a documented CUD also reported greater PTSD symptom severity at baseline and over time. Importantly, as depicted in Figure 4, returning veterans with and without a prior CUD diagnosis reported high levels of PTSD symptom severity at baseline and over time, which never fell below the clinical cutoff (33; Bovin et al., 2016). Nevertheless, returning veterans with a documented CUD had higher PTSD symptom severity at baseline and evidenced decelerated rates of change over approximately 7 years compared with returning veterans without a CUD diagnosis. These findings are consistent with those of Metrik et al. (2020) who found prospectively increasing associations between cannabis use and greater PTSD intrusive symptoms over 12 months, while baseline PTSD was prospectively associated with CUD at 12-month follow-up. Our results also extend their findings beyond 1 year, and our CUD-PTSD findings might help contextualize our alcohol use results as well. Consistent with Metrik et al. (2020), and also Berke et al. (2019), one possibility is that CUD, alcohol use/AUD, and PTSD serve to maintain and mutually reinforce one another over time.
The model invoked most often to explain the cooccurrence of psychiatric disorders and substance use is the self-medication model, which postulates individuals use alcohol and drugs to reduce or avoid experiencing unpleasant affect, thoughts, physiological states, and memories (Khantzian, 2003). However, this model does not provide an explanation for the longitudinal course of psychiatric distress following substance use or, in the present case, CUD. The mutual maintenance model is an extension of the self-medication hypothesis in that psychiatric stress is postulated to give rise to substance use, and substance use, in turn, can exacerbate or perpetuate psychiatric distress. This model was used recently to account for the reciprocal and mutually reinforcing associations between PTSD and substance use among combat-deployed veterans, recently discharged veterans (Berke et al., 2019). In their study, Berke and colleagues found that PTSD symptom severity predicted substance use, and substance use predicted worse PTSD symptom severity in turn. Although we could not examine predictors of CUD onset, the mutual maintenance model is among the few that accounts for the effects of substance use on future mental health outcomes. This model also provides complimentary insight into the potential effects of CUD and enduring PTSD and alcohol use among returning veterans, as observed in our study, and highlights an important risk pathway for future research. That is, the significant alcohol use disparity we observed between veterans with versus without a documented CUD, and the significant risk conferred by continual hazardous drinking, makes this finding particularly noteworthy.
It is possible that cannabis use operates differently than other substances with respect to the maintenance of PTSD symptom severity over time. For example, using four waves from the same data set, Mahoney et al. (2020) found that, although more severe baseline PTSD symptoms predicted accelerated declines in both PTSD symptom severity and alcohol use, baseline alcohol use did not predict changes in PTSD symptom severity over time. Conversely, in the present study, we found that a previously documented diagnosis of CUD resulted in decelerated improvements in PTSD symptoms and alcohol use. Thus, CUD diagnostic status, in particular, may confer additional risk for sustained alcohol use and PTSD symptom severity and appears to be a significant predictor of PTSD symptom change relative to alcohol use. Future research is needed to compare these effects, as well as those of other SUDs, to further explicate the dynamic and temporal associations between CUD, PTSD, and alcohol use among returning veterans. Another important future direction is to directly compare veterans who report using cannabis “medicinally” versus “recreationally,” as recent scholarship demonstrates that medicinal use is more strongly associated with psychiatric distress and impairment (e.g., cannabis use as a means of coping with symptoms; Davis et al., 2018; Gunn et al., 2019; Loflin et al., 2017; Metrik et al., 2018) and recreational use being associated with heavier alcohol use (e.g., Gunn et al., 2019). While either motive can give rise to CUD, the presence of subgroups and differential psychiatric distress profiles among these subgroups necessitate follow-up research to examine psychiatric outcomes long term.
Strengths and Limitations
A notable strength of this study is that we oversampled women veterans who are often underrepresented in veteran research. Second, the study used a robust longitudinal design and latent variable analytic approach (i.e., LGCM), which allowed us to model symptom course over the observational period, including interindividual differences in intraindividual changes, over the span of nearly 7 years. On the other hand, a notable limitation is that with the exception of CUD diagnostic status, all measures were self-report. Although we relied on validated and reliable “gold-standard” self-report measures, future research may benefit from structured diagnostic assessment. Although CUD diagnoses were provided by licensed professionals, CUD may be underdiagnosed within the VA (Bonn-Miller et al., 2012), and representation of returning veterans who may meet diagnostic criteria is also limited to the degree that veterans were not accessing VA care or services that would be more attuned to CUD as a diagnostic possibility (e.g., SUD specialty clinics). If so, there may be returning veterans in our non-CUD comparison group who have an undocumented CUD, and that our results would have produced even more robust differences between groups had we performed diagnostic CUD assessments for each participant. Future research should incorporate validated diagnostic assessment for substance use to overcome documented issues with EMR data as noted by Holowka et al. (2014). Our inclusion of CUD diagnoses recorded within 10 years of participants’ study enrollment date allowed us to cast a wide net when identifying our CUD cohort. On the other hand, without repeated assessment of CUD, we do not have specific information about the timing or duration of CUD diagnoses and are unable to distinguish patients with a history of CUD in the past 10 years but who entered early or sustained remission prior to study enrollment. While this remains a significant limitation, if participants had achieved CUD remission within our CUD group, we suspect our results would have been even more pronounced between those with versus without CUD diagnoses. In either case, our CUD cohort nevertheless represents returning veterans with a previously diagnosed CUD, documented by a licensed professional, and we suspect that the psychiatric and alcohol use disparities reported here would be enhanced, not diminished, if replicated with a sample of veterans with active CUD diagnoses. We were further limited in that we cannot account for cannabis use motives (recreational vs. medicinal) or changes in CUD status following returning veterans’ initial diagnosis, which has been shown to vary among nonveterans over time (Kosty et al., 2017). Future studies should incorporate repeated measurements of cannabis and CUD throughout the assessment periods. We also did not assess participants’ location, distance from VA clinics, or treatment or interventions received during the study period, which is a notable limitation given the potential impact of treatment received, or not received, on psychiatric symptoms and functioning long term. Lastly, we observed missing data ranging from 16.7% to 37.5% across waves and additional missing data on our T1 PTSD self-report measure (clerical error). While we adjusted for missing values in our models, future research would benefit from increased compliance.
Clinical Implications
These findings provide new insight into the longitudinal course of alcohol use and PTSD symptoms following a diagnosis of CUD. These findings add scientific and clinical value and may better inform prevention efforts, the development of screening and assessment practices, and critical points of intervention for veterans with prior and/or active CUD diagnoses. The demographic moderators identified in our models—namely age, gender, race, and time since deployment—provide insight into patient-level characteristics that account for hetero-geneity across mental health, alcohol use, and psychosocial functioning over time, and that are relevant for screening and intervention.
In a recent study, PTSD symptoms were found to be persistent among returning veterans following trauma exposure (Lee et al., 2020), and our findings suggest that veterans with CUD report worse mental health, psychosocial functioning, and alcohol use, and that PTSD and alcohol use are more persistent for veterans with CUD over time. Given the population prevalence of cannabis use, it is recommended that clinicians conduct careful assessment of cannabis use, its functions for the patient/client, and thoughtful tracking of consequences over time to help offset risk for negative outcomes observed in this study. For veterans, this should include assessment of quantities and frequency of cannabis use, whether they regard it as recreational or medicinal, but also functional impairments associated with its use. For many veterans, the consequences of using cannabis may be outweighed by their concern about exacerbation of psychiatric distress following cessation. It is therefore recommended that veterans receive psychoeducation regarding the long-term impacts of cannabis use and regarding the risk for decelerated recovery from PTSD and hazardous drinking specifically.
Conclusion
Our study provides novel insights into the 7-year course of PTSD, anxiety, depression, alcohol use, and psychosocial functioning following a documented diagnosis of CUD among returning veterans. Our results suggest the importance of assessment of substance use in general and specifically cannabis use and disorder in future research and treatment for returning veterans. Our results indicate that patients with a previously documented CUD exhibit more severe and persistent alcohol use and PTSD symptom distress among returning Operation Enduring Freedom/Operation Iraqi Freedom (OEF/OIF) veterans. This information may be immediately useful for assessment and treatment planning purposes, prevention policy, and could inform much needed research efforts to examine the long-term effects of CUD on the mental health of returning veterans.
Public Health Significance Statement.
This study indicates that returning veterans with a diagnosis of cannabis use disorder (CUD) report worse depression, anxiety, posttraumatic stress disorder (PTSD), alcohol use, and psychosocial functioning. Findings also indicate that CUD was associated with more severe and persistent alcohol use and PTSD symptom severity long term. This information may be immediately useful for assessment and treatment planning purposes, prevention, and could inform much needed research efforts to examine the long-term effects of CUD on the mental health of returning veterans.
Acknowledgments
This research was supported by grants from the Department of Defense, United States (W81XWH-08–2-0100/W81XWH-08–2-0102 and W81XWH-12–2-0117/W81XWH-12–2-0121). Colin T. Mahoney is supported by the National Institute of Mental Health Award #5T32MH019836–16 (PI: Terence M. Keane).
References
- Bates D, Mächler M, Bolker B, & Walker S (2015). Fitting linear mixed-effects models using lme4. Journal of Statistical Software, 67(1), 1–48. 10.18637/jss.v067.i01 [DOI] [Google Scholar]
- Bentler PM (1990). Comparative fit indexes in structural models. Psychological Bulletin, 107(2), 238–246. 10.1037/0033-2909.107.2.238 [DOI] [PubMed] [Google Scholar]
- Berke DS, Yeterian J, Presseau C, Rusowicz-Orazem L, Kline NK, Nash WP, & Litz BT (2019). Dynamic changes in marines’ reports of PTSD symptoms and problem alcohol use across the deployment cycle. Psychology of Addictive Behaviors, 33(2), 162–170. 10.1037/adb0000430 [DOI] [PubMed] [Google Scholar]
- Blanco C, Hasin DS, Wall MM, Flórez-Salamanca L, Hoertel N, Wang S, Kerridge BT, & Olfson M (2016). Cannabis use and risk of psychiatric disorders: Prospective evidence from a US national longitudinal study. JAMA Psychiatry, 73(4), 388–395. 10.1001/jamapsychiatry.2015.3229 [DOI] [PubMed] [Google Scholar]
- Bonn-Miller MO, Boden MT, Vujanovic AA, & Drescher KD (2013). Prospective investigation of the impact of cannabis use disorders on posttraumatic stress disorder symptoms among veterans in residential treatment. Psychological Trauma: Theory, Research, Practice, and Policy, 5(2), 193–200. 10.1037/a0026621 [DOI] [Google Scholar]
- Bonn-Miller MO, Harris AHS, & Trafton JA (2012). Prevalence of cannabis use disorder diagnoses among veterans in 2002, 2008, and 2009. Psychological Services, 9(4), 404–416. 10.1037/a0027622 [DOI] [PubMed] [Google Scholar]
- Bonn-Miller MO, Moos RH, Boden MT, Long WR, Kimerling R, & Trafton JA (2015). The impact of posttraumatic stress disorder on cannabis quit success. The American Journal of Drug and Alcohol Abuse, 41(4), 339–344. 10.3109/00952990.2015.1043209 [DOI] [PubMed] [Google Scholar]
- Bonn-Miller MO, Vujanovic AA, & Drescher KD (2011). Cannabis use among military veterans after residential treatment for posttraumatic stress disorder. Psychology of Addictive Behaviors, 25(3), 485–491. 10.1037/a0021945 [DOI] [PubMed] [Google Scholar]
- Bovin MJ, Black SK, Rodriguez P, Lunney CA, Kleiman SE, Weathers FW, Schnurr PP, Spira J, Keane TM, & Marx BP (2018). Development and validation of a measure of PTSD-related psychosocial functional impairment: The inventory of psychosocial functioning. Psychological Services, 15(2), 216–229. 10.1037/ser0000220 [DOI] [PubMed] [Google Scholar]
- Bovin MJ, Marx BP, Weathers FW, Gallagher MW, Rodriguez P, Schnurr PP, & Keane TM (2016). Psychometric properties of the PTSD checklist for diagnostic and statistical manual of mental disorders-fifth edition (PCL-5) in veterans. Psychological Assessment, 28(11), 1379–1391. 10.1037/pas0000254 [DOI] [PubMed] [Google Scholar]
- Breheny P, & Burchett W (2017). Visualization of regression models using visreg. The R Journal, 9(2), 56–71. 10.32614/RJ-2017-046 [DOI] [Google Scholar]
- Cerda M, Mauro C, Hamilton A, Levy NS, Santaella-Tenorio J, Hasin D, Wall MM, Keyes KM, & Martins SS (2020). Association between recreational marijuana legalization in the United States and changes in marijuana use and cannabis use disorder from 2008 to 2016. JAMA Psychiatry, 77(2), 165–171. 10.1001/jamapsychiatry.2019.3254 [DOI] [PMC free article] [PubMed] [Google Scholar]
- Compton WM, Han B, Jones CM, & Blanco C (2019). Cannabis use disorders among adults in the United States during a time of increasing use of cannabis. Drug and Alcohol Dependence, 204(1), Article 107468. 10.1016/j.drugalcdep.2019.05.008 [DOI] [PMC free article] [PubMed] [Google Scholar]
- Conigrave KM, Hall WD, & Saunders JB (1995). The AUDIT questionnaire: Choosing a cut-off score. Alcohol use disorder identification test. Addiction, 90(10), 1349–1356. 10.1111/j.1360-0443.1995.tb03552.x [DOI] [PubMed] [Google Scholar]
- Crippa JA, Zuardi AW, Martin-Santos R, Bhattacharyya S, Atakan Z, McGuire P, & Fusar-Poli P (2009). Cannabis and anxiety: A critical review of the evidence. Human Psychopharmacology, 24(7), 515–523. 10.1002/hup.1048 [DOI] [PubMed] [Google Scholar]
- Davis AK, Lin LA, Ilgen MA, & Bohnert KM (2018). Recent cannabis use among Veterans in the United States: Results from a national sample. Addictive Behaviors, 76, 223–228. 10.1016/j.addbeh.2017.08.010 [DOI] [PMC free article] [PubMed] [Google Scholar]
- Debell F, Fear NT, Head M, Batt-Rawden S, Greenberg N, Wessely S, & Goodwin L (2014). A systematic review of the comorbidity between PTSD and alcohol misuse. Social Psychiatry and Psychiatric Epidemiology, 49(9), 1401–1425. 10.1007/s00127-014-0855-7 [DOI] [PubMed] [Google Scholar]
- Degenhardt L, Hall W, & Lynskey M (2003). Exploring the association between cannabis use and depression. Addiction, 98(11), 1493–1504. 10.1046/j.1360-0443.2003.00437.x [DOI] [PubMed] [Google Scholar]
- Gentes EL, Schry AR, Hicks TA, Clancy CP, Collie CF, Kirby AC, Dennis MF, Hertzberg MA, Beckham JC, & Calhoun PS (2016). Prevalence and correlates of cannabis use in an outpatient VA posttraumatic stress disorder clinic. Psychology of Addictive Behaviors, 30(3), 415–421. 10.1037/adb0000154 [DOI] [PMC free article] [PubMed] [Google Scholar]
- Grimm K, Ram N, & Estabrook R (2017). Growth modeling: Structural equation modeling and multilevel modeling approaches Guilford Press. [Google Scholar]
- Gunn R, Jackson K, Borsari B, & Metrik J (2019). A longitudinal examination of daily patterns of cannabis and alcohol co-use among medicinal and recreational veteran cannabis users. Drug and Alcohol Dependence, 205, Article 107661. 10.1016/j.drugalcdep.2019.107661 [DOI] [PMC free article] [PubMed] [Google Scholar]
- Gunn RL, Stevens AK, Micalizzi L, Jackson KM, Borsari B, & Metrik J (2020). Longitudinal associations between negative urgency, symptoms of depression, cannabis and alcohol use in veterans. Experimental and Clinical Psychopharmacology, 28, 426–437. 10.1037/pha0000357 [DOI] [PMC free article] [PubMed] [Google Scholar]
- Hall W, & Lynskey M (2016). Evaluating the public health impacts of legalizing recreational cannabis use in the United States. Addiction, 111(10), 1764–1773. 10.1111/add.13428 [DOI] [PubMed] [Google Scholar]
- Hasin DS, Kerridge BT, Saha TD, Huang B, Pickering R, Smith SM, Jung J, Zhang H, & Grant BF (2016). Prevalence and correlates of DSM-5 cannabis use disorder, 2012–2013: Findings from the national epidemiological survey on alcohol and related conditions-III. The American Journal of Psychiatry, 173(6), 588–599. 10.1176/appi.ajp.2015.15070907 [DOI] [PMC free article] [PubMed] [Google Scholar]
- Hasin DS, Saha TD, Kerridge BT, Goldstein RB, Chou SP, Zhang H, Jung J, Pickering RP, June Ruan W, Smith SM, Huang B, & Grant BF (2015). Prevalence of marijuana use disorders in the United States between 2001–2002 and 2012–2012. JAMA Psychiatry, 72(12), 1235–1242. 10.1001/jamapsychiatry.2015.1858 [DOI] [PMC free article] [PubMed] [Google Scholar]
- Holowka DW, Marx BP, Gates MA, Litman HJ, Ranganathan G, Rosen RC, & Keane TM (2014). PTSD diagnostic validity in Veterans Affairs electronic records of Iraq and Afghanistan veterans. Journal of Consulting and Clinical Psychology, 82(4), 569–579. 10.1037/a0036347 [DOI] [PubMed] [Google Scholar]
- Hu L, & Bentler PM (1998). Fit indices in covariance structure modeling: Sensitivity to underparameterized model misspecification. Psychological Methods, 3(4), 424–453. 10.1037/1082-989X.3.4.424 [DOI] [Google Scholar]
- Khantzian EJ (2003). Understanding addictive vulnerability: An evolving psychodynamic perspective. Neuro-Psychoanalysis, 5(1), 5–21. 10.1080/15294145.2003.10773403 [DOI] [Google Scholar]
- Kosty DB, Seeley JR, Farmer RF, Stevens JJ, & Lewinsohn PM (2017). Trajectories of cannabis use disorder: Risk factors, clinical characteristics and outcomes. Addiction, 112, 279–287. 10.1111/add.13557 [DOI] [PMC free article] [PubMed] [Google Scholar]
- Kroenke K, Spitzer RL, & Williams JB (2001). The PHQ-9: validity of a brief depression severity measure. Journal of general internal medicine, 16(9), 606–613. 10.1046/j.1525-1497.2001.016009606.x [DOI] [PMC free article] [PubMed] [Google Scholar]
- Lan CW, Fiellin DA, Barry DT, Bryant KJ, Gordon AJ, Edelman EJ, Gaither JR, Maisto SA, & Marshall BD (2016). The epidemiology of substance use disorders in US Veterans: A systematic review and analysis of assessment methods. The American Journal on Addictions, 25(1), 7–24. 10.1111/ajad.12319 [DOI] [PMC free article] [PubMed] [Google Scholar]
- Lee DJ, Lee LO, Bovin MJ, Moshier SJ, Dutra SJ, Kleiman SE, Rosen RC, Vasterling JJ, Keane TM, & Marx BP (2020). The 20-year course of posttraumatic stress disorder symptoms among veterans. Journal of Abnormal Psychology, 129, 658–669. 10.1037/abn0000571 [DOI] [PMC free article] [PubMed] [Google Scholar]
- Loflin M, Earleywine M, & Bonn-Miller M (2017). Medicinal versus recreational cannabis use: Patterns of cannabis use, alcohol use, and cued-arousal among veterans who screen positive for PTSD. Addictive Behaviors, 68, 18–23. 10.1016/j.addbeh.2017.01.008 [DOI] [PubMed] [Google Scholar]
- MacCallum RC, Browne MW, & Sugawara HM (1996). Power analysis and determination of sample size for covariance structure modeling. Psychological Methods, 1(2), 130–149. 10.1037/1082-989X.1.2.130 [DOI] [Google Scholar]
- Mahoney C, Livingston NA, Wong M, Rosen R, Marx B, & Keane T (2020). Parallel process modeling of PTSD symptoms and alcohol use severity in returning veterans. Psychology of Addictive Behaviors. Advance online publication 10.1037/adb0000569 [DOI] [PMC free article] [PubMed]
- Metrik J, Bassett SS, Aston ER, Jackson KM, & Borsari B (2018). Medicinal versus recreational cannabis use among returning veterans. Translational Issues in Psychological Science, 4(1), 6–20. 10.1037/tps0000133 [DOI] [PMC free article] [PubMed] [Google Scholar]
- Metrik J, Stevens AK, Gunn RL, Borsari B, & Jackson KM (2020). Cannabis use and posttraumatic stress disorder: Prospective evidence from a longitudinal study of veterans. Psychological Medicine Advance online publication. 10.1017/S003329172000197X [DOI] [PMC free article] [PubMed]
- Moshier SJ, Lee DJ, Bovin MJ, Gauthier G, Zax A, Rosen RC, Keane TM, & Marx BP (2019). An empirical crosswalk for the PTSD checklist: Translating DSM-IV to DSM-5 usinga veteran sample. Journal of Traumatic Stress, 32(5), 799–805. 10.1002/jts.22438 [DOI] [PMC free article] [PubMed] [Google Scholar]
- Neale MC, Hunter MD, Pritikin JN, Zahery M, Brick TR, Kirkpatrick RM, Estabrook R, Bates TC, Maes HH, & Boker SM (2016). OpenMx 2.0: Extended structural equation and statistical modeling. Psychometrika, 81(2), 535–549. 10.1007/s11336-014-9435-8 [DOI] [PMC free article] [PubMed] [Google Scholar]
- Rosen RC, Marx BP, Maserejian NN, Holowka DW, Gates MA, Sleeper LA, Vasterling JJ, Kang HK, & Keane TM (2012). Project VALOR: Design and methods of a longitudinal registry of post-traumatic stress disorder (PTSD) in combat-exposed veterans in the Afghanistan and Iraqi military theaters of operations. International Journal of Methods in Psychiatric Research, 21(1), 5–16. 10.1002/mpr.355 [DOI] [PMC free article] [PubMed] [Google Scholar]
- Sarvet AL, Wall MM, Keyes KM, Olfson M, Cerdá M, & Hasin DS (2018). Self-medication of mood and anxiety disorders with marijuana: Higher in states with medical marijuana laws. Drug and Alcohol Dependence, 186, 10–15. 10.1016/j.drugalcdep.2018.01.009 [DOI] [PMC free article] [PubMed] [Google Scholar]
- Saunders JB, Aasland OG, Babor TF, de la Fuente JR, & Grant M (1993). Development of the Alcohol Use Disorders Identification Test (AUDIT): WHO collaborative project on early detection of persons with harmful alcohol consumption-II. Addiction, 88, 791–804. 10.1111/j.1360-0443.1993.tb02093.x [DOI] [PubMed] [Google Scholar]
- Schermelleh-Engel K, Moosbrugger H, & Müller H (2003). Evaluating the fit of structural equation models: Tests of significance and descriptive goodness-of-fit measures. Methods of Psychological Research Online, 8(2), 23–74. [Google Scholar]
- Seal KH, Cohen G, Waldrop A, Cohen BE, Maguen S, & Ren L (2011). Substance use disorders in Iraq and Afghanistan veterans in VA healthcare, 2001–2010: Implications for screening, diagnosis and treatment. Drug and Alcohol Dependence, 116(1–3), 93–101. 10.1016/j.drugalcdep.2010.11.027 [DOI] [PubMed] [Google Scholar]
- Spitzer RL, Kroenke K, Williams JB, & Patient Health Questionnaire Primary Care Study Group. (1999). Validation and utility of a self-report version of PRIME-MD: The PHQ primary care study. JAMA: Journal of the American Medical Association, 282(18), 1737–1744. 10.1001/jama.282.18.1737 [DOI] [PubMed] [Google Scholar]
- Spitzer RL, Kroenke K, Williams JB, & Löwe B (2006). A brief measure for assessing generalized anxiety disorder: the GAD-7. Archives of internal medicine, 166(10), 1092–1097. 10.1001/archinte.166.10.1092 [DOI] [PubMed] [Google Scholar]
- Subbaraman MS, Metrik J, Patterson D, & Swift R (2017). Cannabis use during treatment for alcohol use disorders predicts alcohol treatment outcomes. Addiction, 112(4), 685–694. 10.1111/add.13693 [DOI] [PMC free article] [PubMed] [Google Scholar]
- Substance Abuse and Mental Health Services Administration. (2019). Results from the 2018 national survey on drug use and health Center for Behavioral Health Statistics and Quality, Substance Abuse and Mental Health Services Administration. [Google Scholar]
- Tucker LR, & Lewis C (1973). A reliability coefficient for maximum likelihood factor analysis. Psychometrika, 38, 1–10. 10.1007/BF02291170 [DOI] [Google Scholar]
- Weathers FW, Litz BT, Herman DS, Huska JA, & Keane TM (1993). The PTSD Checklist (PCL): Reliability, validity, and diagnostic utility [Conference session] In Annual convention of the international society for traumatic stress studies, San Antonio, TX, United States. [Google Scholar]
- Weathers FW, Litz BT, Keane TM, Palmieri PA, Marx BP, & Schnurr PP (2013). The PTSD checklist for DSM-5 (PCL-5) http://www.ptsd.va.gov
- Weinberger AH, Platt J, & Goodwin RD (2016). Is cannabis use associated with an increased risk of onset and persistence of alcohol use disorders? A three-year prospective study among adults in the United States. Drug and Alcohol Dependence, 161, 363–367. 10.1016/j.drugalcdep.2016.01.014 [DOI] [PMC free article] [PubMed] [Google Scholar]
- Wickrama KK, Lee TK, O’Neal CW, & Lorenz FO (2016). Higher-order growth curves and mixture modeling with Mplus: A practical guide Routledge. 10.4324/9781315642741 [DOI] [Google Scholar]