Abstract
Fog collection from atmosphere is an effective way to solve the water resource crisis in arid or semi-arid areas. Inspired by the bumpy surface of the desert beetle, this work provides a beetle-like superamphiphobic coating by adding silicon carbide particles to nano-SiO2 superamphiphobic coating in proportion, which shows excellent superamphiphobic performance, high nucleation rate, efficient drop removal efficiency and recommendable fog collection effect. In this work, drop removal is facilitated by the collisions of water droplets between the array sheets, and when the as-prepared samples are placed parallel to each other and with a space of ∼2 mm, the jumping drop collisions between two sample surfaces could promote the departure of droplets, and the water collection rate of the collision surface increased by ∼217% compared to that of the non-collision surface, which provides a new idea to promote water droplet removal. This work findings are instrumental in water collection and have wide application prospects in desalination, heat transfer, anti-fogging and other fields.
Fog collection from atmosphere is an effective way to solve the water resource crisis in arid or semi-arid areas.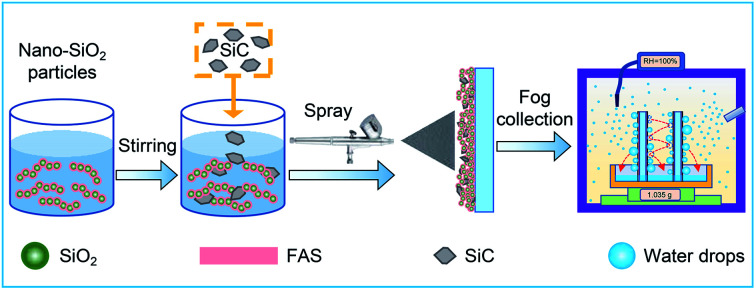
1. Introduction
In recent years, reports reveal that about two-thirds of the world's population suffers from a serious water crisis,1 and about 10% of the fresh water resources are stored in the air.2 Then, fog collection from the atmosphere has been widely considered by researchers,3–8 and it is an effective way to overcome water scarcity in arid and semi-arid areas.9–12 Hence, various biomimetic fog collection materials inspired by the Namib desert beetle,13–17 Cactus,18–20 Nepenthes21–23 and Spider silk24–27 have gained considerable attention recently. For instance, Chen et al.28 provided a superhydrophilic/superhydrophobic hybrid film inspired by the Namib desert beetle, and this hybrid film coated with Ag/TiO2 nanoparticles exhibited excellent water collecting ability. Jiang and Zheng's groups prepared diverse biomimetic materials inspired by Cactus29,30 and Spider silk,31 these materials demonstrated high water collection efficiency, and, their work has important implications for water collection in arid and semi-arid areas. Dai et al.21 provided a hydrophilic directional slippery rough surface inspired by pitcher plants and rice leaves, which showed high-density nucleation and rapid drops removal, and exhibited high fog collection efficiency.
However, currently reported biomimetic materials often prepared by reactive ion etching,14,32 electrochemistry,33,34 photocatalysis,35,36 photolithography37 and other high cost means.38–40 And, these technologies are relatively expensive and are not conducive to mass production of materials. Furthermore, researchers mainly focus on superhydrophobic/superoleophobic property,41 droplets transportation,42–46 oil/water separation47–49 and self-cleaning50,51 for the materials surface, and how to realize both rapid nucleation and droplet removal remains an important challenge. Previous studies have found that constructing appropriate hydrophilic regions on superhydrophobic surface could promote the nucleation and self-repelled jumping removal of water droplets,52 and self-repelled jumping has become an important way to remove water droplets from surface.36,53 But, little attention has been paid to the idea that facilitating drops removal via the collision of jumping droplets. It is worth noting that, we have reported a superamphiphobic coating with polymer-wrapped particles (SAS), which demonstrates excellent water collection efficiency.6 But, it has large drop size and drops between array sheets tend to form water bridges due to its high surface adhesion, so it is not suitable to promote drop removal by jumping drop collisions.
In this paper, a method with low cost and easy preparation is developed to obtain a beetle-like superamphiphobic coating (BSC), which with high nucleation rate and rapid droplet removal performance. In this work, silicon carbide (SiC) particles with size of 7–12 μm were added into a homogeneous nano-SiO2 superamphiphobic paints, and the hybrid paints are then uniformly mixed with a stirrer. Subsequently, the hybrid paints are pressure-sprayed onto substrate surface, and a BSC is fabricated after dry. Then, the coatings condensation property, drop removal efficiency and water collection rate are investigated in detail. The results show that the BSC exhibits excellent dropwise condensation properties and water collection effect. And furthermore, when the samples are placed parallel to each other and perpendicular to the horizontal plane, the jumping droplets between the array sheets are able to collide with each other. Then, the drop removal efficiency between these two opposite surfaces is improved greatly. These studies offer insight for the design of fog collectors, which is important for developing materials that can be extended to application in water collection, desalination, heat transfer and other fields.
2. Experimental section
2.1. Reagents and materials
Aluminum sheets (99.95%, ∼5 cm × ∼5 cm × ∼0.3 mm) were purchased from Shanghai Lianggao Aluminum Co., Ltd (Shanghai, China) 1H,1H,2H,2H-Perfluorodecyltriethoxysilane (FAS) was, provided by Quanzhou SICONG New Material Development Co., Ltd (Quanzhou, China), chained nano-SiO2 sol, deionized water and anhydrous ethanol (EtOH) were supplied by Nanjing Wanqing Chemical Instrument co., Ltd (Nanjing, China), tetraethyl orthosilicate (TEOS) and ammonium hydroxide were provided by Sinoharm Chemical Reagent Co., Ltd (Shanghai, China), and SiC particles (diameter: 7 μm–12 μm, Fig. S1(c)†) were purchased from Hebei Naite Alloy Welding Rod Factory (Xintai, Hebei).
2.2. Sample preparation
As shown in Fig. 1, the samples were prepared as follows: (1) chained nano-SiO2 superhydrophobic paints were prepared according to previous reports.6,53 80 mL of ethanol and 4 mL of ammonia hydroxide were added into a beaker, and 1.2 mL of chained nano-SiO2 sol (Fig. S1(a)†) was added to the beaker drop by drop. Then, 0.6 mL of TEOS was added to the solution, and 0.5 mL of FAS was added to fluoridize the chained nano-SiO2 particles. Then, sealing the beaker and stirring the solution for 24 h to obtain the nano-SiO2 superamphiphobic paints (Fig. S1(b)†). (2) 0.132 g of SiC particles (Fig. S1(c)†) were added to a beaker with 45 mL of the nano-SiO2 superamphiphobic paints. (3) The mixed paints were stirred with a magnetic stirrer for ∼5 min, and then pressure-sprayed onto an aluminum sheet or glass substrate. After then, a BSC was formed after drying at 80 °C. After that, the nano-SiO2 superamphiphobic paints were sprayed onto the aluminum sheet or glass substrate (Fig. S2†), then dried in an oven at 80 °C to obtain nano-SiO2 superamphiphobic coating (Nano), and this sample and the untreated aluminum sheet (Untreated, Fig. S2†) as the control samples in this work.
Fig. 1. Schematic diagram of sample preparation and fog collection.
2.3. Characterization
The surface topographies of different samples were observed via field emission scanning electron microscopy (SEM, FEI Company, USA). The water/oil contact angles (for 5 μL deionized water/oil) and roll angles (for 10 μL deionized water/oil) were measured using an OCA 15 Pro Contact Angle Meter (Dataphysics Instrument GmbH, Germany). During the condensation process, pictures of the droplets were captured by a stereo microscope (Navitar, NY, USA), the schematic diagram of the condensation test system is shown in Fig. S3.† In addition, a Photron FASTCAM Mini UX100 type high-speed camera (Photron Ltd, Japan) equipped with a Navitar 6000 zoom lens (Navitar, NY, USA) was used to capture images/movies of the dynamic droplets. The drop number density and surface coverage were measured and recorded. During the condensation process, environmental temperature is 22 ± 3 °C, cooling stage temperature is 2 °C, and environment relative humidity is 80 ± 5%. The home-made fog collection device is shown in Fig. 1, and a mimetic fog flow with velocity of ∼0.9 m s−1 was produced using a commercial humidifier.
3. Results and discussion
3.1. Morphology and wettability
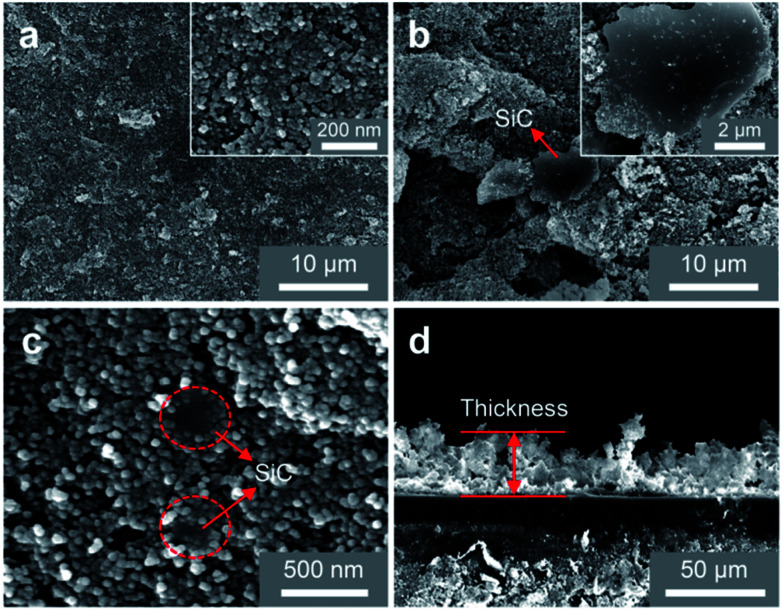
To explore the surface performance of different coatings, the microscopic SEM images are shown in Fig. 2. Fig. 2(a) shows the SEM surface morphology of nano-SiO2 superamphiphobic coating, and this image reveals that this coating is a rough structure with many nanopores. As shown in Fig. 2(b) and (c), SiC particles exist in two main ways in the coating: Fig. 2(b) shows that the SiC particles with irregular shape exist on the surface of nano-SiO2 superamphiphobic coating, and the particle size is 7 μm–12 μm. At the same time, Fig. 2(c) demonstrates that although some of SiC particles embedded in the nano-SiO2 superamphiphobic coating, and partial regions of SiC particles are exposed. Therefore, the SiC particles are randomly distributed in the beetle-like superamphiphobic coating, and the exposed SiC particles (similar to the bumps of the desert beetle, the element distribution is shown in Fig. S4†) act as random nucleation sites during the condensation process. Then, fog harvested by these biomimetic spots in high humidity environment, and forming droplets that grow and remove quickly. In particular, there are also many nanoporous in the beetle-like superamphiphobic coating (Fig. 2(c)), thus, water/oil drops on the coating could form air-cushion between the solid–liquid interface, which maintains the droplets in a stable Cassie state54,55 on the coating and with excellent superamphiphobic performance. Therefore, this BSC is not only helpful for improving nucleation efficiency, but also beneficial to facilitate water droplets departure.
Fig. 2. SEM images of different coatings. (a) SEM image of the Nano. (b) and (c) are the exist states of SiC particles in the beetle-like superamphiphobic coating. (b) Reveals that some SiC particles are exposed outside the nano-SiO2 superamphiphobic coating, and (c) shows that although some SiC particle are embedded into the nano-SiO2 particles, and partial regions are exposed, which act as the nucleation sites during the condensation process. (d) Side view of the beetle-like superamphiphobic coating, and the thickness of the coating is ∼21.7 μm to ∼31.2 μm.
To study the wettability of different coatings, water/oil contact angles for the Nano, BSC ans SiC particles are measured. As illustrated in Fig. 3, water/oil contact angles for the Nano and the BSC are both more than 150°, while the water/oil roll angles are less than 5°. Hence, the results show that these two samples are both superamphiphobic surface, and the added SiC particles have little effect on the water/oil wettability of the coating. In addition, water/oil contact angles of the SiC particles are ∼107.6° and ∼29.3°, respectively. And furthermore, according to the elements distribution of the BSC (Fig. S4†), there is very little fluorine (F) on the SiC particles, but a lot of fluorine on the silica particles. So the BSC is a hybrid wetting coating that with wettability difference between the SiC particles and nano-SiO2 particles.
Fig. 3. Water/oil wettability of different coatings. (a) Water contact angles and roll angles on the different coatings. (b) Oil contact angles and roll angles on the different coatings.
3.2. Condensation behaviors
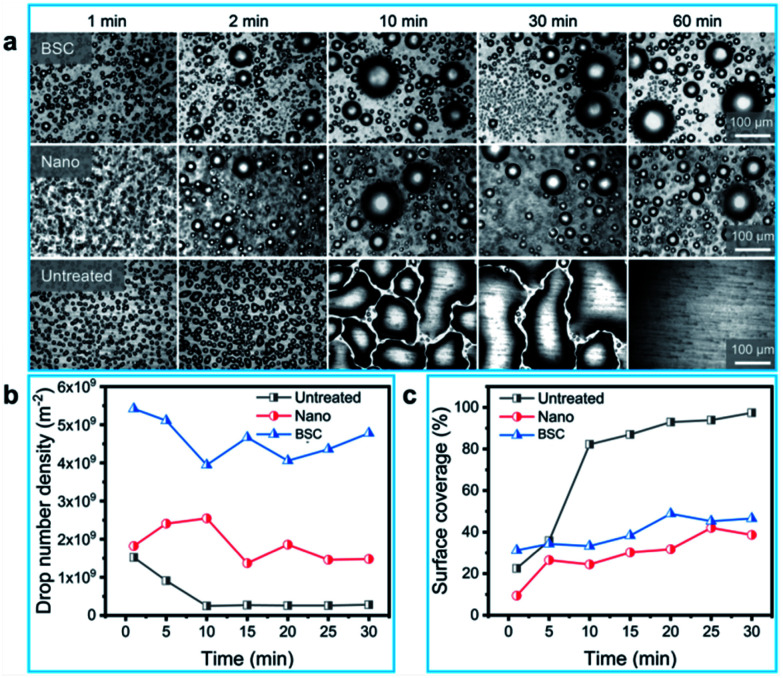
To study the dynamic behaviors of condensate droplets on different surfaces, we investigated the condensation properties of different samples. As illustrated in Fig. 4(a), dynamic pictures of three samples (BSC, Nano and Untreated) during the condensation process are captured, and robust dropwise condensation are observed on the BSC and Nano, and the distribution of droplets varies over time, which show that droplets on the BSC could also have excellent departure ability. At the same time, filmwise condensation occurs on the untreated aluminum sheet (a hydrophilic surface), and droplets are difficult to departure from this highly adhesive surface. Furthermore, drop number density and surface coverage for different surfaces are recorded in Fig. 4(b) and (c). As shown in Fig. 4(b), drop number density of the BSC are higher than that of the Nano, and within 30 min, the average drop number density for the BSC (∼4.62 × 10⁹ m−2) is increased by ∼150% compared to that of the Nano (∼1.85 × 10⁹ m−2), which illustrates that the mixed SiC particles enhanced the nucleation rate for the BSC. As shown in Fig. 4(c), surface coverage for the BSC is higher than that of the Nano due to its higher nucleation at the early stage. Then, after 25 min, surface coverage for the BSC is close to that of the Nano. The reason is that during the condensation process, droplets coalescence and self-repelled jumping are captured (Fig. S5†), which is beneficial to drops departure and reduce the surface coverage. However, drops coverage on the Untreated surface increases gradually as time goes on, and then, it approaches 100% after 30 min, which reveals that hydrophilic surface is not conducive to the removal of water droplets. Therefore, the BSC not only has high nucleation rate, but also with excellent dewdrop removal performance, which is beneficial to water collection by drops departure (Fig. S6†).
Fig. 4. The captured condensation images, drop number density and surface coverage of different surfaces. (a) Dropwise condensation on the BSC and the Nano, and filmwise condensation on the hydrophilic surface. (b) Variation of drop number density for different samples with time. (c) Variation of surface coverage rate for different samples with time.
3.3. Fog collection performance
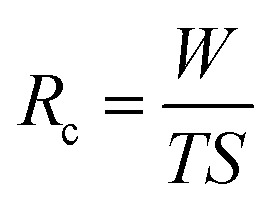
Water collection rate is an important evaluation index for fog/water collection.56–58 To evaluate the water collection rate of different samples, we established the following model:
 |
1 |
where Rc represents the water collection rate (g m−2 h−1), W, T and S represent the total weight of the collected water (g), fog/water collecting time (h) and the area fog/water collecting surface (m2), respectively.
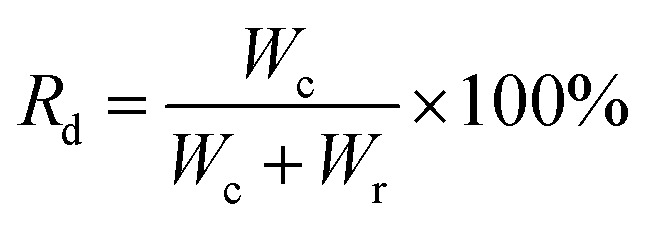
In order to evaluate the drop removal efficiency for various surfaces, we define the drop removal efficiency as:
 |
2 |
where Rd represents the drop removal efficiency (%), Wc and Wr represent the weight of the collected water (g) and the weight of the retained water (g), respectively.
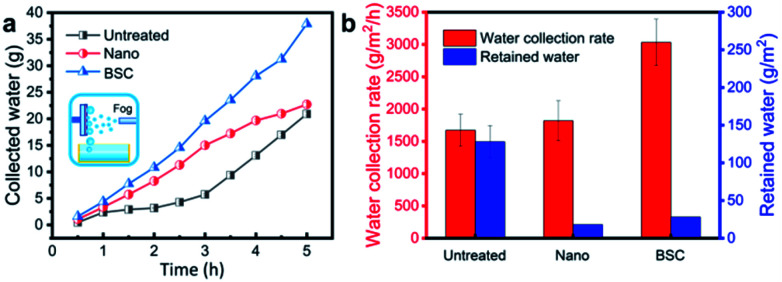
To compare the water collection performance of different samples, water collection rate and retained water of different samples are tested and measured after 5 hours (Fig. 5). The results show that the BSC with the highest water collection rate (∼3032 g m−2 h−1), which is increased by ∼67% and ∼81% compared to that of the Nano and the Untreated sample, respectively. And, furthermore, the calculated water drop removal efficiency for the BSC, the Nano and the Untreated sample are ∼99.08%, ∼99.02% and ∼92.89%, respectively. Therefore, the BSC with more excellent water collection rate and praiseworthy drop removal efficiency than that of the control samples.
Fig. 5. Water collection effect for different surfaces after 5 hours test. In this test, the environment temperature was 22 ± 3 °C and the fog flow speed was ∼0.9 m s−1. (a) The weight of collected water for different surfaces varies over time. (b) Water collection rate and retained water for different surfaces. Compared with the Nano and the Untreated sample, water collection rate of the BSC is improved by ∼67% and ∼81%, respectively.
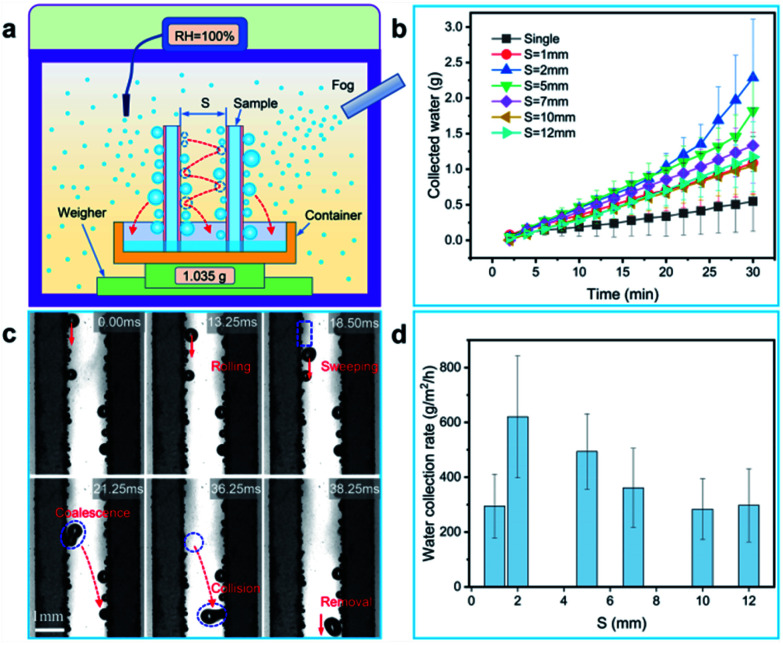
In order to explore the impact of jumping droplets collision on the removal performance, two glass sheets coated with BSC (both sides of the sample are coated with the BSC, and the sample size is ∼7.6 cm × ∼2.5 cm × ∼0.1 cm) are selected to test the water collection rate. Here, the two samples are vertically fixed in a superamphiphobic container (coated with the nano-SiO2 superamphiphobic coating), and they are parallel to each other (Fig. 6(a)). Then, the weight of collected water as a function of time is shown in Fig. 6(b), the results show that when the space (S) between the two parallel samples is ∼2 mm, and the samples could harvest more water than that of the samples with other spaces, which exhibit excellent water collection efficiency (Fig. 6(d)).
Fig. 6. Water collection via drops collisions between two parallel opposite surfaces (collision surfaces). In this test, relative humidity is close to 100%, the fog flow velocity of ∼0.6 m s−1 to ∼0.7 m s−1 and it does not impact on the sample surface, and the environment temperature is 22 ± 3 °C. (a) Schematic diagram of water collecting device. (b) The weight of collected water as a function of time, and the space between the two collision surfaces are various from ∼1 mm to ∼12 mm. (c) Time-lapse images for droplets jump and collide with each other to removal between two collision surfaces (S ≈ 2 mm).
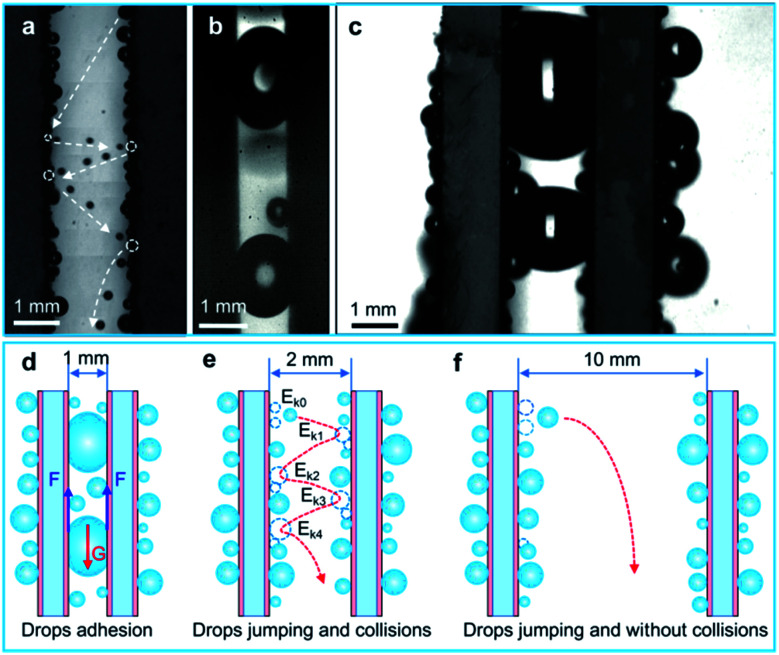
To further illustrate the drop collision phenomenon visually, we used a high-speed camera to capture the drop collision behavior between two array sheets. As shown in Fig. 6(c), a drop with diameter of ∼500 μm rolls down along the sample surface, and some tiny droplets are swept by this drop. Then, the big drop coalesces with another droplet with diameter of ∼400 μm at 21.25 ms, and the coalesced drop releases surface energy (Es) to induce the self-repelled jumping (the initial jumping velocity is ∼0.14 m s−1). After then, at 36.25 ms, the coalesced drop jump toward the opposite surface and collides with a droplet on this surface. Then, it forms a larger drop with diameter of ∼650 μm and removed by gravity. In addition, multiple droplet collisions between two parallel samples were also captured by a high-speed camera (Fig. 7(a), Movie S2†), and this phenomenon is favorable for water droplet removal.
Fig. 7. Drops jumping and collision phenomenon between two array sheets and the drop removal mechanism. (a) Drops multiple jumping and collisions between the two BSC array sheets (S ≈ 2 mm). (b) Drops form water bridges between two parallel BSC sheets (S ≈ 1 mm). (c) Drops form water bridges between two parallel SAS sheets (S ≈ 2 mm). (d)–(f) reveals the drop removal mechanism of array sheets with different spaces. (d) Reveals that water droplets between the two BSC array sheets tend to form water bridges, and they adhere to the BSC sheets when S is less than 1 mm, and (e) shows that when S increases to about 2 mm, drops jumping and collision between the two sheets are frequent and drop removal is enhanced. Then, (f) shows that when S is more than 10 mm, the jumping drops are hard to collide the opposite surface, and the effect of droplet collision on the drop removal is not obvious. So S ≈ 2 mm is an appropriate parallel spacing for the two samples.
As shown in Fig. 7(e), a coalesced droplet releases the surface energy of Es to overcome the dissipation of viscosity (Evis) and the work of adhesion (Ew), then, the residual energy is transformed into initial kinetic energy (Ek0) to drive the droplet to jump.36,59
Here, Ek0 obtained by the coalescence of two droplets can be expressed as:60
| Ek0 = Es − Evis − Ew | 3 |
Because the droplets collide with each other many times between two parallel surfaces, we assume that there exist N (N ≥ 1) times transformations of kinetic energy. So when the jumping drop collide with the drops on the opposite surface for the first time, the merged drop releases surface energy of Es1, and the kinetic energy of Ek1 can be described as:
| Ek1 = Ek0 + Eh1 + Es1 − Evis1 − Ew1 − Ec1 | 4 |
where Eh1, Evis1, Ew1 and Ec1 represent the change in gravitational potential energy of the merged drop, the dissipation of viscosity, the work of adhesion and the impact energy consumption after the jumping drop's first time collision, respectively. According to eqn (4), we can derive a formula to express the kinetic energy after N times drops collisions as follows:
| EkN = Ek(N−1) + EhN + EsN − EvisN − EwN − EcN | 5 |
Then, the drop jumping velocity of υN can be described as:
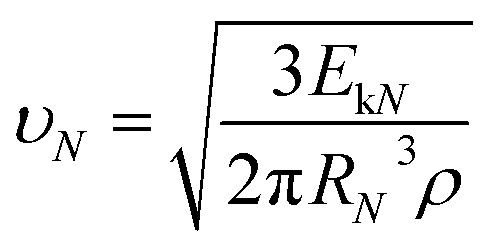 |
6 |
Here, RN and ρ represent the radius of the merged drop after N times collisions and the density of water.
Then, our model reveals that the surface energy released by the coalesced drop can induce droplet jump, and droplets collisions between the parallel BSC surfaces could promote the droplet departure, which is beneficial to water collection.
To illustrate the effect of space on water droplet removal, drop departure behaviors between two parallel BSC sheets with various spaces were captured, and the drop removal mechanism is shown in Fig. 7(d)–(f). As shown in Fig. 6(c) and 7(a), when S is ∼2 mm, the collision of water droplets between two array sheets is obvious, and the water collection rate of the collision surfaces (∼914.7 g m−2 h−1) is increased by ∼216% compared to that of the non-collision surfaces (∼288.9 g m−2 h−1), Fig. 7(e) reveals that drops multiple jumping and collisions enhanced the water collection performance. However, it is worth noting that when S decrease to less than 1 mm, drops between the two array sheets tend to form water bridges (Fig. 7(b) and Movie S2†), and they adhere to the inside of the gap due to the surface adhesion (F), which prevents the removal of water droplets (Fig. 7(d)). Next, as the space between the two array sheets increases (S > 2 mm), the probability of water drops collision maybe decrease, which leads to the decrease of drop removal efficiency on the collision surface. Finally, when S > 10 mm, drops between the two array sheets rarely collide with the opposite surface (Fig. 7(f) and Movie S2†), and the water collection rate of the collision surfaces is close to the non-collision surface. Therefore, an optimized parameter of S ≈ 2 mm is provided, and our results show that droplets jumping and collisions between the array sheets are able to improve the droplet removal efficiency, which is beneficial to the improvement of water collection efficiency.
In order to compare the removal effect of the BSC sample with that of the reported coating of SAS,6 we further investigated the drop removal performance between the two SAS samples. As shown in Fig. 7(c), when S ≈ 2 mm, drops between the two parallel SAS samples form water bridges due to its high surface adhesion, which is not conducive to water droplet removal. So the water collection rate of the collision surface for the SAS sample is ∼542.0 g m−2 h−1, and this result is ∼41% lower than that of the collision surface for the BSC sample. Therefore, the BSC sample is more suitable for drop removal and water collection by droplets collision, and this finding has a good application prospect in water collection, desalination and heat transfer, etc.
4. Conclusions
In conclusion, a simple, low-cost and effective method for fabricating a beetle-like superamphiphobic coating with efficient fog collection property was presented. The as prepared sample with excellent superamphiphobic performance, high nucleation rate, efficient water droplet removal efficiency and commendable water collection efficiency. Compared to the nano-SiO2 superamphiphobic coating, the average drop number density of the as-prepared sample was increased by ∼150% during 30 min. And furthermore, the water collection rate for the as-prepared sample was ∼67% higher than that of the nano-SiO2 superamphiphobic coating, and ∼81% higher than that of the hydrophilic aluminum surface. In addition, a novel method to promote the drop removal by the collision of jumping droplets between two array sheets, and when the spacing between the two parallel samples was about 2 mm, the water collection rate of the collision surface was increased by ∼216% compared to that of the non-collision surface. Therefore, we believe that the approach to promote water droplet removal could be applied in semi-arid deserts and inland areas for overcoming water shortage problems, and it have wide application prospects in fog/water collection, desalination, heat transfer, anti-fogging and other fields.
Conflicts of interest
There are no conflicts to declare.
Supplementary Material
Acknowledgments
This study was supported by the National Natural Science Foundation of China (51671055, 51676033), the National Key Research and Development Program of China (2016YFC0700304).
Electronic supplementary information (ESI) available. See DOI: 10.1039/c9ra09329j
Notes and references
- Mekonnen M. M. Hoekstra A. Y. Sci. Adv. 2016;2:e1500323. doi: 10.1126/sciadv.1500323. [DOI] [PMC free article] [PubMed] [Google Scholar]
- Kim H. Yang S. Rao S. R. Narayanan S. Kapustin E. A. Furukawa H. Umans A. S. Yaghi O. M. Wang E. N. Science. 2017;356:430. doi: 10.1126/science.aam8743. [DOI] [PubMed] [Google Scholar]
- Zheng Y. Bai H. Huang Z. Tian X. Nie F. Zhao Y. Zhai J. Jiang L. Nature. 2010;463:640. doi: 10.1038/nature08729. [DOI] [PubMed] [Google Scholar]
- Hu R. Wang N. Hou L. Cui Z. Liu J. Li D. Li Q. Zhang H. Zhao Y. J. Mater. Chem. A. 2019;7:124. doi: 10.1039/C8TA10615K. [DOI] [Google Scholar]
- Jiang Y. Savarirayan S. Yao Y. Park K. Appl. Phys. Lett. 2019;114:83701. doi: 10.1063/1.5087144. [DOI] [Google Scholar]
- Wang X. Zeng J. Yu X. Zhang Y. J. Mater. Chem. A. 2019;7:5426. doi: 10.1039/C8TA12372A. [DOI] [Google Scholar]
- Zhang Q. Lin G. Yin J. Soft Matter. 2018;14:8276. doi: 10.1039/C8SM01688G. [DOI] [PubMed] [Google Scholar]
- Jiang Y. Machado C. Savarirayan S. Patankar N. A. Park K. C. Soft Matter. 2019;15:6779. doi: 10.1039/C9SM01105F. [DOI] [PubMed] [Google Scholar]
- Li C. Liu Y. Gao C. Li X. Xing Y. Zheng Y. ACS Appl. Mater. Interfaces. 2019;11:4507. doi: 10.1021/acsami.8b15901. [DOI] [PubMed] [Google Scholar]
- Xing Y. Shang W. Wang Q. Feng S. Hou Y. Zheng Y. ACS Appl. Mater. Interfaces. 2019;11:10951. doi: 10.1021/acsami.8b19574. [DOI] [PubMed] [Google Scholar]
- Hou Y. Shang Y. Yu M. Feng C. Yu H. Yao S. ACS Nano. 2018;12:11022. doi: 10.1021/acsnano.8b05163. [DOI] [PubMed] [Google Scholar]
- Labbé R. Duprat C. Soft Matter. 2019;15:6946. doi: 10.1039/C9SM01205B. [DOI] [PubMed] [Google Scholar]
- Park K. Kim P. Grinthal A. He N. Fox D. Weaver J. C. Aizenberg J. Nature. 2016;531:78. doi: 10.1038/nature16956. [DOI] [PubMed] [Google Scholar]
- Hou Y. Yu M. Chen X. Wang Z. Yao S. ACS Nano. 2015;9:71. doi: 10.1021/nn505716b. [DOI] [PubMed] [Google Scholar]
- Park J. Kim S. Micromachines. 2019;10:201. doi: 10.3390/mi10030201. [DOI] [PMC free article] [PubMed] [Google Scholar]
- Zhu H. Duan R. Wang X. Yang J. Wang J. Huang Y. Xia F. Nanoscale. 2018;10:13045. doi: 10.1039/C8NR03277G. [DOI] [PubMed] [Google Scholar]
- Wen C. Guo H. Bai H. Xu T. Liu M. Yang J. Zhu Y. Zhao W. Zhang J. Cao M. Zhang L. ACS Appl. Mater. Interfaces. 2019;11:34330. doi: 10.1021/acsami.9b11862. [DOI] [PubMed] [Google Scholar]
- Ju J. Bai H. Zheng Y. Zhao T. Fang R. Jiang L. Nat. Commun. 2012;3:1247. doi: 10.1038/ncomms2253. [DOI] [PMC free article] [PubMed] [Google Scholar]
- Heng X. Xiang M. Lu Z. Luo C. ACS Appl. Mater. Interfaces. 2014;6:8032. doi: 10.1021/am4053267. [DOI] [PubMed] [Google Scholar]
- Gurera D. Bhushan B. Philos. Trans. R. Soc., A. 2019;377:20180269. doi: 10.1098/rsta.2018.0269. [DOI] [PMC free article] [PubMed] [Google Scholar]
- Dai X. Sun N. Nielsen S. O. Stogin B. B. Wang J. Yang S. Wong T. Sci. Adv. 2018;4:q919. doi: 10.1126/sciadv.aaq0919. [DOI] [PMC free article] [PubMed] [Google Scholar]
- Chen H. Zhang L. Zhang Y. Zhang P. Zhang D. Jiang L. J. Mater. Chem. A. 2017;5:6914. doi: 10.1039/C7TA01609C. [DOI] [Google Scholar]
- Zhang P. Zhang L. Chen H. Dong Z. Zhang D. Adv. Mater. 2017;29:1702995. doi: 10.1002/adma.201702995. [DOI] [PubMed] [Google Scholar]
- Bai H. Ju J. Sun R. Chen Y. Zheng Y. Jiang L. Adv. Mater. 2011;23:3708. doi: 10.1002/adma.201101740. [DOI] [PubMed] [Google Scholar]
- Bai H. Ju J. Zheng Y. Jiang L. Adv. Mater. 2012;24:2786. doi: 10.1002/adma.201200289. [DOI] [PubMed] [Google Scholar]
- Ju J. Zheng Y. Jiang L. Acc. Chem. Res. 2014;47:2342. doi: 10.1021/ar5000693. [DOI] [PubMed] [Google Scholar]
- Chen H. Ran T. Gan Y. Zhou J. Zhang Y. Zhang L. Zhang D. Jiang L. Nat. Mater. 2018;17:935. doi: 10.1038/s41563-018-0171-9. [DOI] [PubMed] [Google Scholar]
- Xu C. Feng R. Song F. Wang X. Wang Y. ACS Sustainable Chem. Eng. 2018;6:14679. doi: 10.1021/acssuschemeng.8b03247. [DOI] [Google Scholar]
- Ju J. Yao X. Yang S. Wang L. Sun R. He Y. Jiang L. Adv. Funct. Mater. 2014;24:6933. doi: 10.1002/adfm.201402229. [DOI] [Google Scholar]
- Cao M. Ju J. Li K. Dou S. Liu K. Jiang L. Adv. Funct. Mater. 2014;24:3235. doi: 10.1002/adfm.201303661. [DOI] [Google Scholar]
- Chen Y. He J. Wang L. Xue Y. Zheng Y. Jiang L. J. Mater. Chem. A. 2014;2:1230. doi: 10.1039/C3TA13862C. [DOI] [Google Scholar]
- Chen X. Wu J. Ma R. Hua M. Koratkar N. Yao S. Wang Z. Adv. Funct. Mater. 2011;21:4617. doi: 10.1002/adfm.201101302. [DOI] [Google Scholar]
- Xu T. Lin Y. Zhang M. Shi W. Zheng Y. ACS Nano. 2016;10:10681. doi: 10.1021/acsnano.6b05595. [DOI] [PubMed] [Google Scholar]
- Xing Y. Wang S. Feng S. Shang W. Deng S. Wang L. Hou Y. Zheng Y. RSC Adv. 2017;7:29606. doi: 10.1039/C7RA05534J. [DOI] [Google Scholar]
- Bai H. Wang L. Ju J. Sun R. Zheng Y. Jiang L. Adv. Mater. 2014;26:5025. doi: 10.1002/adma.201400262. [DOI] [PubMed] [Google Scholar]
- Wang X. Zeng J. Yu X. Liang C. Zhang Y. Appl. Surf. Sci. 2019;465:986. doi: 10.1016/j.apsusc.2018.09.210. [DOI] [Google Scholar]
- Moazzam P. Tavassoli H. Razmjou A. Warkiani M. E. Asadnia M. Desalination. 2018;429:111. doi: 10.1016/j.desal.2017.12.023. [DOI] [Google Scholar]
- Wang M. Liu Q. Zhang H. Wang C. Wang L. Xiang B. Fan Y. Guo C. F. Ruan S. ACS Appl. Mater. Interfaces. 2017;9:29248. doi: 10.1021/acsami.7b08116. [DOI] [PubMed] [Google Scholar]
- Li D. Wang Z. Wu D. Han G. Guo Z. Nanoscale. 2019;11:11774. doi: 10.1039/C9NR03882E. [DOI] [PubMed] [Google Scholar]
- Chu D. Sun X. Hu Y. Duan J. Soft Matter. 2019;15:7398. doi: 10.1039/C9SM01404G. [DOI] [PubMed] [Google Scholar]
- Yin K. Dong X. Zhang F. Wang C. Duan J. Appl. Phys. Lett. 2017;110:121909. doi: 10.1063/1.4979036. [DOI] [Google Scholar]
- Zhou H. Guo Z. J. Mater. Chem. A. 2019;7:11295. [Google Scholar]
- Song D. Bhushan B. J. Colloid Interface Sci. 2019;557:528. doi: 10.1016/j.jcis.2019.09.068. [DOI] [PubMed] [Google Scholar]
- Chen M. Jia Z. Zhang T. Fei Y. Soft Matter. 2018;14:7462. doi: 10.1039/C8SM01056K. [DOI] [PubMed] [Google Scholar]
- Yang S. Yin K. Chu D. He J. Duan J. Appl. Phys. Lett. 2018;113:203701. doi: 10.1063/1.5061723. [DOI] [Google Scholar]
- Yin K. Yang S. Dong X. Chu D. Duan J. He J. Appl. Phys. Lett. 2018;112:243701. doi: 10.1063/1.5039789. [DOI] [Google Scholar]
- Li J. Li D. Yang Y. Li J. Zha F. Lei Z. Green Chem. 2016;18:541. doi: 10.1039/C5GC01818H. [DOI] [Google Scholar]
- Li J. Xu C. Guo C. Tian H. Zha F. Guo L. J. Mater. Chem. A. 2018;6:223. doi: 10.1039/C7TA08076J. [DOI] [Google Scholar]
- Li J. Zhao Z. Li D. Tian H. Zha F. Feng H. Guo L. Nanoscale. 2017;9:13610. doi: 10.1039/C7NR04448H. [DOI] [PubMed] [Google Scholar]
- Zhang J. Wang W. Zhou S. Yang H. Chen C. Prog. Org. Coat. 2019;134:312. doi: 10.1016/j.porgcoat.2019.05.028. [DOI] [Google Scholar]
- Xu F. Wang T. Chen H. Bohling J. Maurice A. M. Wu L. Zhou S. Prog. Org. Coat. 2017;113:15. doi: 10.1016/j.porgcoat.2017.08.005. [DOI] [Google Scholar]
- Xing D. Wu F. Wang R. Zhu J. Gao X. ACS Appl. Mater. Interfaces. 2019;11:7553. doi: 10.1021/acsami.8b19868. [DOI] [PubMed] [Google Scholar]
- Wang X. Zhang J. Zeng J. Wang S. Yu X. Zhang Y. J. Bionic Eng. 2018;15:452. doi: 10.1007/s42235-018-0036-6. [DOI] [Google Scholar]
- Cassie A. Baxter S. Trans. Faraday Soc. 1944;40:546. doi: 10.1039/TF9444000546. [DOI] [Google Scholar]
- Wang S. Jiang L. Adv. Mater. 2007;19:3423. doi: 10.1002/adma.200700934. [DOI] [Google Scholar]
- Zhu H. Guo Z. Chem. Commun. 2016;52:6809. doi: 10.1039/C6CC01894G. [DOI] [PubMed] [Google Scholar]
- Yin K. Du H. Dong X. Wang C. Duan J. He J. Nanoscale. 2017;9:14620. doi: 10.1039/C7NR05683D. [DOI] [PubMed] [Google Scholar]
- Zhong L. Feng J. Guo Z. J. Mater. Chem. A. 2019;7:8405. doi: 10.1039/C9TA01906E. [DOI] [Google Scholar]
- Tian J. Zhu J. Guo H. Li J. Feng X. Gao X. J. Phys. Chem. Lett. 2014;5:2084. doi: 10.1021/jz500798m. [DOI] [PubMed] [Google Scholar]
- Li D. Qian C. Gao S. Zhao X. Zhou Y. Int. J. Refrig. 2017;79:25. doi: 10.1016/j.ijrefrig.2017.04.022. [DOI] [Google Scholar]
Associated Data
This section collects any data citations, data availability statements, or supplementary materials included in this article.


