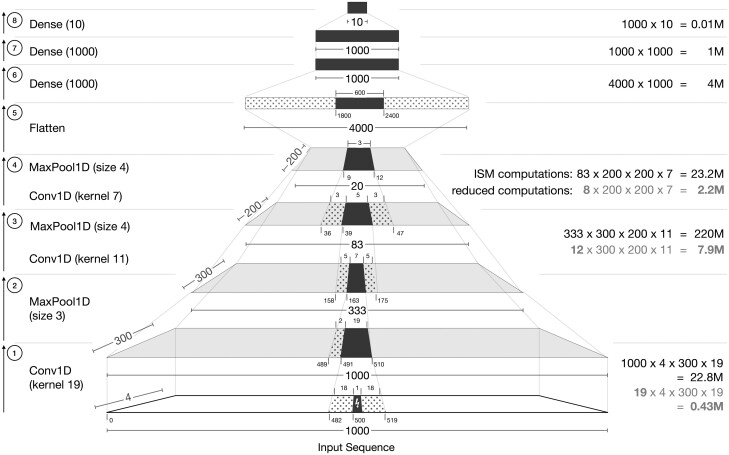
Fig. 2.
Annotated diagram of a Basset-like architecture (Kelley et al., 2016) on an input DNA sequence of length 1000, with a 1 base-pair mutation at position 500 (0-indexed). Dark filled-in positions indicate the regions that are affected by the point mutation in the input. Dotted positions, flanking the dark filled-in positions, indicate unaffected regions that contribute to the output of the next layer. Ticks at the bottom of each layer correspond to position indices. Numbers on the right in indicate the approximate number of computations required at that layer for a standard implementation of ISM. For convolution layers, the numbers in gray indicate the minimal computations required. After the first Conv1D and MaxPool1D layers (Operations 1 and 2), the subsequent Conv1D and MaxPool1D layers are shown as a single operation (Operations 3 and 4). We omit layers, such as activations and batch normalization here for simplicity, as they do not change the affected regions

