



Abstract
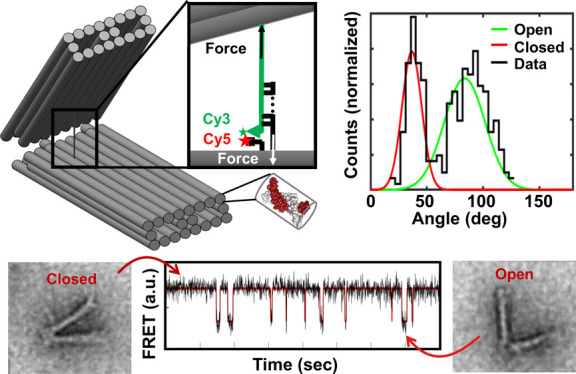
The ability to apply and measure high forces (>10 pN) on the nanometer scale is critical to the development of nanomedicine, molecular robotics, and the understanding of biological processes such as chromatin condensation, membrane deformation, and viral packaging. Established force spectroscopy techniques including optical traps, magnetic tweezers, and atomic force microscopy rely on micron-sized or larger handles to apply forces, limiting their applications within constrained geometries including cellular environments and nanofluidic devices. A promising alternative to these approaches is DNA-based molecular calipers. However, this approach is currently limited to forces on the scale of a few piconewtons. To study the force application capabilities of DNA devices, we implemented DNA origami nanocalipers with tunable mechanical properties in a geometry that allows application of force to rupture a DNA duplex. We integrated static and dynamic single-molecule characterization methods and statistical mechanical modeling to quantify the device properties including force output and dynamic range. We found that the thermally driven dynamics of the device are capable of applying forces of at least 20 piconewtons with a nanometer-scale dynamic range. These characteristics could eventually be used to study other biomolecular processes such as protein unfolding or to control high-affinity interactions in nanomechanical devices or molecular robots.
Keywords: DNA origami nanotechnology, single-molecule fluorescence, force spectroscopy, DNA shearing, partition function modeling
Introduction
Structural DNA nanotechnology is a rapidly expanding field that leverages DNA base pairing to design and construct nanoscale devices via molecular self-assembly.1 The versatile properties of DNA enable device engineering at the angstrom scale with highly programmable geometry and stiffness and movable components that can be externally controlled.2 The ability to prepare highly complex DNA nanostructures has been significantly expanded by scaffolded DNA origami.3 This approach relies on a large continuous scaffold DNA strand typically from a phage genome that guides the self-assembly with hundreds of short (∼40 base) DNA oligonucleotides to form devices with high yield and homogeneity.3−5 Using scaffolded DNA origami, one can construct a wide range of complex devices on the 10–100 nm scale with publicly available design software6 and protocols4 and commercially available materials. This includes static devices,7,8 as well as dynamic devices that have been developed for sensing, drug delivery, computing and biophysical measurement applications, and force applications.9−14 One of the more versatile and studied DNA origami nanodevices is the hinge nanocaliper.15,16 Such nanocaliper devices have been used to investigate a range of biomolecular interactions including DNA bending and nucleosome unwrapping16−18 and have been functionalized with a range of nanomaterials including gold nanoparticles and thermoresponsive polymers to externally control the device conformation.19 While there has been significant work in the fabrication and application of DNA origami devices, including nanocalipers, their design is still largely driven by structural considerations (e.g., geometry or conformational changes), and the optimization for high-performance mechanical capabilities is not well explored.20
One area of considerable potential for scaffolded DNA origami devices is force spectroscopy. Force spectroscopy aims to probe molecular interactions through applied forces, yielding mechanistic insights into the dynamics and conformations of biomolecules and complexes. Established methods in force spectroscopy such as atomic force microscopy (AFM), optical trapping, and magnetic tweezers have been used with great success in the study of molecular motors, intracellular forces, and biocomplex formation.20 In complement to existing force spectroscopy methods, DNA origami contributes specialized features that can mitigate challenges with established techniques, which rely on micron-sized handles, for measurements in confined or complex environments such as inside nanofluidic devices or cells.21,22 DNA origami devices have been designed to apply tensile and compressive forces as well as measure external forces with devices such as force clamps, force-sensitive switches, and nanocalipers.17,18,23 In particular, nanocalipers have been used to measure protein–protein, DNA–protein, and polymer properties through their application of force and accompanying readout.11,16,24 However, the forces applied by these devices are difficult to directly measure, and the mechanism behind the force application and the maximum force capacity is largely unexplored, despite being critical for informed device design and measurement analysis.
Here, we leverage previous studies where we developed a toolset of nanocalipers that function as nanoscale DNA-based force spectrometers (nDFS).18 We use the nDFS to study shearing of a DNA duplex, and we investigate the mechanisms behind the nDFS force application. We show that an individual nDFS is capable of making numerous high-force (>10 pN) measurements on a single molecule, with each measurement taking place on the second time scale. The device exhibits a stiffness similar to high-power optical tweezers (>1 pN/nm)25 over a dynamic range of a few nm, appropriate for studying small, strongly interacting biomolecules. These features enabled the nDFS to study the annealing of short oligonucleotides (<10 nt) and their response in 5′–5′ shear, a relatively unexplored area of nucleic acid characterization in force spectroscopy.26,27 Lastly, we developed a partition function model that accurately describes the ability of the device to induce shear rupture of the duplex. The model then provides a parameter-free estimation of the force output of the nDFS devices, which are in strong agreement with values measured by our single-molecule measurements as well as a previously published denovo model by de Gennes that describes the forces required to shear DNA duplexes.28 This study advances DNA nanodevice capabilities for biomolecule force applications and complements existing techniques by enabling high-force molecular force spectroscopy in tightly constrained environments.
Results and Discussion
DNA Base Pairing Is a Sensitive Probe of Rare DNA Origami Nanocaliper States
DNA origami nanocalipers have proven to be an important nanodevice for a wide range of applications including the investigation of DNA–protein16,29 and protein–protein interactions.24 Recently, we developed a set of nanocalipers that have varying ranges of thermally accessible hinge angles and can be used as force spectrometers.18 This type of nanocaliper was shown to apply up to a couple of piconewtons of force, and we refer to it as a nanoscale DNA force spectrometer. These previous force measurements relied on directly observable angle configurations accessible by thermal fluctuations, so the device behavior at highly improbable angles was not quantified. Therefore, it is possible that rare angles of the nDFS could involve significantly higher forces, but currently this remains an open question.
To probe rare small-angle states of the nDFS, we used a DNA base pairing strategy, which transiently traps low-probability states (Figure 1A). Two complementary oligonucleotide closing strands, CS1Top and CS1Bottom, were positioned on the top and bottom nDFS arms about 12 nm from the vertex such that when base paired the nDFS is constrained to an angle of about 35 degrees. The top arm strand CS1Top contained the 21 nucleotide (nt) sequence S1 (TTCGCATTAACTAAGACAGAT, Supplementary Figure S9), while the conversion of the 3′ nucleotide from a T to a C converted S1 to sequence S2 (Supplementary Figure S10). This results in a more stable binding free energy for S2 relative to S1 for binding to its complementary DNA strand. We refer to the top and bottom strands with S2 as CS2Top and CS2Bottom, respectively. To control the number of base pair interactions, CS1Bottom or CS2Bottom was varied in length while leaving the length of CS1Top or CS2Top constant. We also investigated two different nDFS designs. The DNA loops in the vertex of nDFS.A contained no base-paired DNA, while DNA loops in the vertex of nDFS.B contained base-paired DNA that reduced the overall DNA loop size in the vertex (Figure 1A). These differences in the vertex DNA loops result in different nDFS angle distributions in the absence of a closing strand, where nDFS.B fluctuates around an average angle of 80 degrees (Figure 1C), while nDFS.A fluctuates around an average angle of about 70 degrees (Supplementary Figure S11).18
Figure 1.

(A) Schematic of nano DNA force spectrometer (nDFS) design. The nDFS is constructed from two scaffolded DNA origami square lattice arms, connected by flexible single-stranded DNA (ssDNA) connections. Each arm is a 3 × 8 helix bundle with four helixes missing and 210 bp long with some helixes slightly longer or shorter to accommodate stable staple routing. The flexible ssDNA vertex connection is either pinched open by the addition of a vertex staple (nDFS.B) or bare (nDFS.A). Integrated into the nDFS is a double-stranded cross-arm connection consisting of two overhangs, CSTop and CSBottom. CSTop is labeled at the 3′ end with Cy3 and extends from the top arm. The first two nucleotides on the 5′ end extending from the top arm are unpaired thymines, while the next 19 nucleotides contain either the full S1 or S2 sequence. A variety of overhang lengths for CSBottom were used, ranging from 4 to 19 bp, with this length being assigned to the variable N. At the same site as CSBottom, a second staple extends from the bottom arm with a 5′ extension of two thymine nucleotides and, at the 5′ end, a Cy5 acceptor fluorophore. When the structure is closed during the annealing of CSTop and CSBottom, the Cy3 and Cy5 fluorophores are brought in close proximity and participate in Förster resonance energy transfer (FRET). (B) Collage of TEM subfields picturing the nDFS.B S1 7 bp device. The scale bar corresponds to 50 nm. (C) Histogram of angles with a mixed two-Gaussian model fit to the data representing the open and closed state for the nDFS.B S1 7 bp device. (D) Plot of the fraction closed of nDFS.B S1 as a function of the length of CS1Bottom as measured by TEM (black), ensemble FRET (blue), and confocal fluorescence microscopy (red). The FRET experiment was repeated in triplicate, and uncertainty was estimated using the standard deviation of the measurements.
We first investigated the number of base-pairing interactions required to close nDFS.B. We used TEM to quantify the angle distribution of the nDFS.B as we scanned the range of CS1Bottom lengths (Supplementary Figures S2 and S3). We found that a range of 5 nt to 11 nt of complementary S1 DNA shifted nDFS.B from the mostly open to the mostly closed state (Figure 1C). More specifically, a CS1Bottom length of 7 nt resulted in a fraction of closed nDFS of about 0.5 (Figure 1D). This implies that the first 7 nt of the S1 sequence shifts the free energy of the closed state so that it is nearly equal to the free energy of the open state. We then characterized nDFS.B with the S2 DNA sequence (Supplementary Figure S10) to determine how a change in DNA sequence influenced the base pair lengths that closed the nanocaliper. We found that with the S2 sequence a range of 4 to 10 nt converted the nDFS.B from being mostly open to mostly closed. In addition, 6 nt of the S2 sequence were required for the nDFS.B to be 50% closed, which is a reduction of about one nucleotide as compared to S1. This result explores the effect of CS sequence on nDFS device behavior. As expected, a more negative base stacking free energy reduced the number of DNA base pairs required to close nDFS.B.
Next we investigated the closure of a second nanocaliper, nDFS.A, which does not contain dsDNA in the vertex (Figure 1A). This nDFS.A vertex design exhibits a substantially smaller angle while in the open state relative to the nDFS.B open state (Supplementary Figures S9–S11), which is consistent with our previous study.18 We used CS1Top and CS1Bottom to close nDFS.A and found that it closed over a range of 4 to 8 bp of complementary DNA (Supplementary Figure S11). The shorter lengths of CS1Bottom that are required to close nDFS.A implies that the free energy cost to close the nDFS.A is lower than nDFS.B. Interestingly, these results are consistent with the design differences between nDFS.A and nDFS.B, where DNA loops in the vertex of nDFS.A are less constrained than the DNA loops in nDFS.B. Overall, these results demonstrate how DNA base pairing can be used as a sensitive probe of rare nDFS configurations.
FRET Reporter System Is an Accurate Readout of the Open and Closed nDFS States
TEM imaging provides a detailed characterization of the nanocaliper conformational distribution, but it does not provide kinetic information about the conformational dynamics. To allow for dynamic measurements, we included Cy3 and Cy5 fluorophores in the device such that they undergo efficient FRET in the closed state (Figure 1A). In contrast, the FRET efficiency of the open state is nearly zero. To determine if FRET is an accurate measure of the relative fraction of the open and closed state, we measured the FRET efficiency of nDFS.B as the CS1Bottom oligonucleotide increased in complementary length (Figure 1D), where the ensemble FRET efficiencies were determined using the RatioA method.30 The experiments were carried out in triplicate, and the uncertainty was estimated by the standard deviation of these three measurements. We find that without the bottom closing strand, CS1Bottom, the FRET efficiency is essentially zero. Furthermore, as the length of CS1Bottom is increased from 5 nt to 11 nt, the FRET efficiency increases and saturates at about 0.9. Importantly, the overall trend of the FRET efficiency overlaps well with the TEM measurements of the fraction of closed nanocalipers (Figure 1D, Supplementary Figure S9).
To further confirm that the FRET measurements are an accurate measure of the nDFS closed fraction, we carried out single-particle FRET measurements with the smfBox.31 This approach determines the FRET efficiency of individual nDFS devices that diffuse through a confocal volume. By detecting the FRET efficiency for many nDFS devices, we determined the FRET distribution of nDFS.B S1 for increasing complementary nucleotide lengths (Supplementary Figure S12). These fit well to two Gaussian distributions. We then used the area under each Gaussian distribution to determine the fraction of closed nDFS.B devices. We find that the fraction closed vs complementary nucleotide length as measured with the smfBox agrees well with the TEM measurements and the ensemble FRET measurements (Figure 1D). We also carried out ensemble FRET measurements of nDFS.B with S2 and nDFS.A with S1 (Supplementary Figures S10 and S11). These FRET efficiency measurements also agreed well with the TEM studies of fraction closed. In combination, these results strongly indicate that the FRET efficiency measurements provide an accurate measure of the fraction of closed nanocalipers.
Free Energy Cost of the nDFS Significantly Alters the DNA Binding Probability
By using DNA base pairing to transiently trap the nanocaliper in the closed state, it sets up a competition between the free energy cost of a small-angle nanocaliper state and the free energy reduction due to DNA base pairing. We used the ensemble FRET efficiency as a measure of fraction closed and then determined a free energy ΔG between the open and closed macrostates using the Boltzmann probability: ΔG = −kBT ln([nDFSclosed]/[nDFSopen]). Here a ΔG of 0 means the nanocaliper is equally likely to be open or closed in equilibrium, with a negative ΔG implying that the nDFS is more likely to be found closed and positive ΔG meaning it is more likely to be found open (Figure 2A and Supplementary Figure S13A and D). For comparison, we then determined the ΔG between paired and unpaired DNA bases for S1 (Figure 2B) and S2 (Supplementary Figure S13B and E) as a function of DNA length at a reference concentration of 1 μM, using well-established salt-corrected enthalpies and entropies for dinucleotide DNA base pairing.30,32 We then determined the difference in the ΔG for each added base pair of CS1Bottom both with (ΔΔGnDFS1) and without (ΔΔGCS1) the nDFS.B (Figure 2C). As previously reported, the addition of each base results in a ΔΔGCS1 of about −2 kBT for the annealing of CS1 alone. However, when CS1 is embedded within nDFS.B, the ΔΔGnDFS.B has a smaller change of −0.4 to −0.9 kBT for most of the CS1 lengths. We observe similar results of nDFS.B with S2 and nDFS.A with S1 (Supplementary Figure S13C and F). These results imply that the nDFS.B and nDFS.A not only oppose the overall formation of a DNA duplex but destabilize the DNA base pairing by shifting the overall free energy difference for every additional closed base pair by about a kBT. This is likely due to the hinge applying a force to the base-paired closing strands, while the nanocaliper is in the closed state.
Figure 2.

(A) Plot of ΔGhingevs number of complementary bases for nDFS.B S1, computed using the Boltzmann weight of the probability of the closed state as measured by the FRET ensemble data. (B) Plot of ΔGDNA, the difference in free energy between the S1 DNA melted and annealed states vs length of complementary sequence computed using salt-adjusted free energies33,34 with a reference concentration of 1 μM. (C) ΔΔGN,N–1 computed separately from (A) ΔGhinge or (B) ΔGDNA, where ΔΔGN,N–1 is the difference between ΔGN and ΔGN–1, which is the additional stability imparted by the addition of one base pair. The lower ΔΔGN,N–1 for the DNA alone relative to the nDFS.B implies that the device acts on the oligonucleotides to alter the free energy of binding.
The nDFS Rapidly Explores Rare Low-Angle States
The nDFS nanocaliper explores a wide range of angles in the open state, yet for the nDFS to close such that the CS ssDNA molecules can anneal, it must transition into a low-probability small-angle state (Figure 1B,C). The transition into rare states can take a long time, i.e., minutes to hours or longer.35 So, it is important to quantify the transition rates of the nDFS to determine if they close fast enough to be practical for force measurements. To investigate the opening and closing rate of the nDFS devices, we carried out single-molecule smTIRF microscopy measurements.36 In these measurements, the nDFS is tethered to the surface through multiple biotin–streptavidin linkages (Figure 3A). As single nDFS devices fluctuate between open and closed states, the FRET efficiency fluctuates between a low and high FRET state, respectively (Figure 3B).
Figure 3.

(A) Schematic showing the single-molecule transitions of the nDFS.B device. The biotin–streptavidin linkage to the quartz slide is shown with green and purple diamonds. The change in device state corresponds to a change in emission from the fluorophore due to FRET. (B) Sample traces of nDFS.B devices with 7, 8, and 9 nt of complementary S2. The idealized trace produced by the hidden Markov model (HMM) is shown in red overlay on data in black. Up to 80 s of experiment time per trace is not shown, in which Cy5 is directly excited to measure the position of devices. (C) Cumulative sum distributions for nDFS.B devices with 7, 8, and 9 nt of complementary S2. A double exponential was fit to both closing (low to high FRET) and opening (high to low FRET) events.
We acquired smFRET measurements using ∼5 min acquisition times of the nDFS.B with the CS1 (Figure 3B) and CS2 (Supplementary Figure S14) closing strands and of nDFS.A with the CS1 (Supplementary Figure S15) closing strand. We focused on complementary base pair lengths between 5 and 10 nucleotides since this is the range over which the nDFS devices transition from mostly open to mostly closed (Figure 1C). We observed a significant number of fluctuating nDFS devices for nDFS.B with 7, 8, and 9 nt CS1, for nDFS.B with 6, 7, and 8 nt CS2, and for nDFS.A with 6, 7, 8, and 9 nt CS1. For each CS length that fluctuated, we quantified the overall fraction of time in the closed state for all of the fluctuating molecules and found them to be consistent with the ensemble average FRET efficiency (Supplementary Table S2). This indicates that the surface tethering is not significantly impacting the nDFS fluctuations.
We analyzed all fluctuating smFRET time traces by quantifying FRET efficiency time traces using an empirical Bayes hidden Markov modeling algorithm (red lines, Figure 3B and Supplementary Figures S14A and S15A),37 which generates dwell times from each trace. This analysis confirmed that a two-state FRET model was the best fit to the FRET efficiency time traces. We plotted the distribution of lifetimes as cumulative sums (Figure 3C and Supplementary Figures S14 and S15), which were then fit to exponentials to determine the characteristic opening and closing rates. Log-likelihood analysis of single- and double-exponential fits to cumulative sums yielded a lower p-value for the double-exponential fit for all measurements except for nDFS.B with 8 bp CS2 (Supplementary Table S3). The faster opening and closing rates accounted for the majority of the transitions except for the opening rates with the 9 bp CS1, which occurred with similar probabilities. This indicates there are two time scales for both nDSF.B opening and closing and that the fast rate is the dominant transition, which we will focus on (Table 1). The opening rates decreased as the complementary base pair length was increased for each device, which is expected since additional base pairing increases the stability of the annealed state. For nDFS.B with S2, the longest CS length of 8 nucleotides resulted in time traces with a low number of opening fluctuations and many with a single opening fluctuation. Therefore, we interpret the observed opening time scale as an upper limit for the opening rate. The closing rates remained relatively constant for nDFS.B with S2 and nDFS.A with S1 (Table 1). However, the range of closing rates across nDFS.B (with S1 and S2) and nDFS.A (with S1) are similar, suggesting that the trend down for nDFS.B with S1 may not be significant. More importantly, these results show that both nDFS devices fluctuate into small-angle states on the second time scale, implying that a single nDFS device can be used to apply forces on a single dsDNA molecule to probe DNA base pair opening/closing events ∼100 times during a measurement of 5 min.
Table 1. Summary of the Dominant Kinetic Rates for All Measurable nDFS Devices.
| nDFS design | closing strand | kopen (s–1) | kclose (s–1) |
|---|---|---|---|
| nDFS.B | S1 7 bp | 0.3 ± 0.06 | 1.2 ± 0.1 |
| nDFS.B | S1 8 bp | 0.22 ± 0.12 | 0.8 ± 0.2 |
| nDFS.B | S1 9 bp | 0.17 ± 0.01 | 0.5 ± 0.1 |
| nDFS.B | S2 6 bp | 0.86 ± 0.13 | 1.1 ± 0.2 |
| nDFS.B | S2 7 bp | 0.15 ± 0.1 | 0.9 ± 0.2 |
| nDFS.B | S2 8 bp | <0.02 | 0.9 ± 0.2 |
| nDFS.A | S1 6 bp | 0.9 ± 0.3 | 0.5 ± 0.3 |
| nDFS.A | S1 7 bp | 0.47 ± 0.02 | 1.3 ± 0.2 |
| nDFS.A | S1 8 bp | 0.17 ± 0.04 | 1.2 ± 0.1 |
| nDFS.A | S1 9 bp | 0.03 ± 0.01 | 0.8 ± 0.1 |
The nDFS Nanocaliper Can Apply Forces Greater than 20 pN
Our ensemble measurements,
which show that the nDFS changes the free
energy difference between annealed and melted (unannealed) DNA, implies
that the nDFS exerts a force on the annealed CS DNA (Figure 2). To determine the force applied
by the nDFS, we took advantage of our smFRET measurements that show
that the nDFS opening rate and therefore the CS DNA dissociation rate
occur rapidly on the second time scale (Figure 3). The CS DNA dissociation rate relates to
the applied force through the Arrhenius equation where the nDFS opening
rate is knDFS_open = k0 exp(fΔ shear/kBT). k0 is the
zero force opening rate, f is the force applied by
the nDFS, and Δ
shear/kBT). k0 is the
zero force opening rate, f is the force applied by
the nDFS, and Δ shear is the distance over which
sheared dsDNA needs to be distorted for it to dissociate. The latter
is not to be confused with the change in end-to-end distance ΔxEED between a single-stranded DNA nucleotide
and a double-stranded DNA base pair; it is a largely geometric property
of the DNA double helix and does not depend majorly on the applied
force. Based on the literature,22,38,39 we use a value of 0.4 nm for Δ
shear is the distance over which
sheared dsDNA needs to be distorted for it to dissociate. The latter
is not to be confused with the change in end-to-end distance ΔxEED between a single-stranded DNA nucleotide
and a double-stranded DNA base pair; it is a largely geometric property
of the DNA double helix and does not depend majorly on the applied
force. Based on the literature,22,38,39 we use a value of 0.4 nm for Δ shear, which is the average to
one significant digit of values from these studies. Therefore, once
we determine the opening rate of CS DNA without an applied force,
we can determine the force applied by the nDFS.
shear, which is the average to
one significant digit of values from these studies. Therefore, once
we determine the opening rate of CS DNA without an applied force,
we can determine the force applied by the nDFS.
To measure CS DNA zero force opening rates for both S1 and S2, we used the fluorescence quenching of Cy5 by BHQ3 to detect DNA oligonucleotide binding in the absence of the nDFS (Figure 4A). To do this, we prepared DNA molecules that contain 20 bp of dsDNA that are labeled with biotin and Cy5 at opposite 5 prime ends. In addition, on the Cy5-labeled end, there is a 3 prime ssDNA extension of variable length that contains a portion of either the S1 or S2 sequence. We used three separate ssDNA extensions with the S1 sequence (7, 8, 9 bp) and one ssDNa extension with the S2 sequence (6 bp) in length. Separately, two 21 nt ssDNA oligonucleotides that contain the full S1 or S2 complementary sequence were 3 prime labeled with a BHQ3 quencher so that, as the S1 or S2 oligo anneals to the variable length overhang, the BHQ3 quenches the Cy5 fluorescence. This mimics how the CS DNA anneals in the closed state of the nDFS device but without an applied force, and this arrangement of fluorophore and quencher allows titration of the quencher-labeled strand in solution without increasing the fluorescence background.
Figure 4.
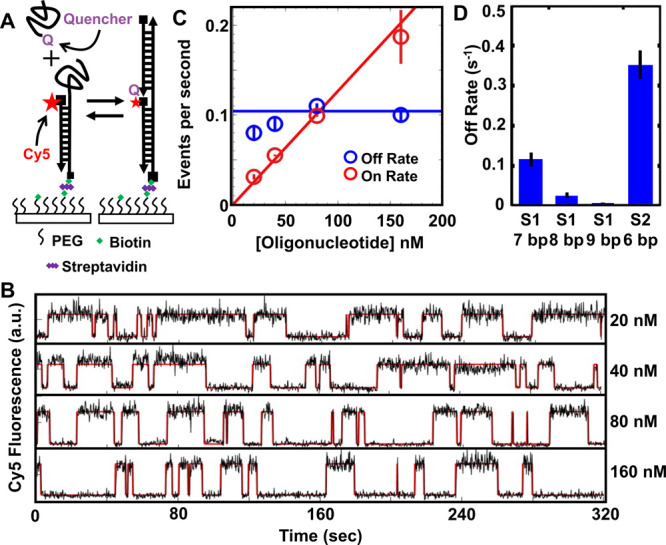
(A) Schematic showing single-molecule measurements of free oligonucleotide annealing and melting rates. (B) Sample traces at various concentrations for the S1 7 bp oligonucleotide. Idealized traces produced by a hidden Markov model are overlaid in red over data in black. (C) Rate summary plot of S1 7 bp data from single-molecule experiments. A linear fit to the binding (on) rates was used to extract the rate constant, and a constant was fit to the dissociation (off) rates, yielding a concentration-independent measurement. (D) Off rate summary of all three measured oligonucleotides. Uncertainty was estimated using the fit uncertainty from rate summary analysis.
We first confirmed that the Cy5-BHQ3 system allowed for the detection of annealing by titrating the BHQ3 oligonucleotide and measuring the ensemble fluorescence in a fluorometer. We characterized the binding fraction of different lengths of the S1 (7, 8, 9 bp) and S2 sequences (6 bp) (Supplementary Figure S16). These titrations fit to a binding isotherm with half saturation concentration (S1/2) values that increase as a function of length and sequence, confirming the Cy5-BHQ3 system allows for the detection of oligonucleotide annealing and the S1/2, which can be interpreted as the apparent dissociation constant, KD.
To quantify the BHQ3 oligonucleotide binding and dissociation kinetics, we used smTIRF. The biotin and Cy5-labeled dsDNA–ssDNA hybrid DNA molecules were anchored to a quartz surface (Figure 4A). Varying concentrations of a BHQ3 oligonucleotide were added to the flow cell, and we quantified the Cy5 fluorescence from single DNA molecules. We found that the Cy5 fluorescence fluctuates between two distinct levels, which are due to the BHQ3 oligo being bound (low Cy5 fluorescence) or not bound (high Cy5 fluorescence) (Figure 4B, Supplementary Figures S17–S20). We analyzed smTIRF Cy5 emission time traces similarly to our analysis of the nDFS smFRET data by using an empirical Bayes hidden Markov modeling algorithm (red lines, Figures 4B and S17–S20),37 which generates bound and unbound dwell times from each trace. This analysis also confirmed that a two-state model was the best fit to the Cy5 emission time traces.
For each concentration, we combined data from at least 50 molecules (Supplementary Table S4) and plotted the bound and unbound dwell times as cumulative sums (Figure 4B, Supplementary Figures S17–S20). We fit the cumulative sums to single exponentials as previously done for single-molecule fluorescence studies of DNA oligonucleotide binding and dissociation to determine the binding and dissociation rates (Supplementary Table S5).40 For each BHQ3 oligo (7 bp S1, 8 bp S1, 9 bp S1, and 6 bp S2), we find that the dissociation rate as a function of BHQ3 concentration is constant, while the binding rate increases linearly (Figure 4C, Supplementary Figures S17–S20). For each length of oligo, the concentration at which these lines intersect is the KD, which is consistent with the S1/2 that was determined from ensemble fluorometer measurements (Supplementary Figure S16C). This confirms that the surface tethering does not significantly interfere with the binding and dissociation equilibrium.
We find that the dissociation rates decrease as the length of the BHQ3 oligo is increased (Figure 4D, koff_7bp_S1 = 0.10 ± 0.01 s–1, koff_8bp_S1 = 0.03 ± 0.01 s–1, koff_8bp_S1 = 0.004 ± 0.001 s–1, koff_6bp_S2 = 0.33 ± 0.02 s–1). These rates combined with the opening rates of the nDFS (Table 1), Δx = 0.4 nm, and kBT = 4.1pN·nm imply the typical force the device applies to disrupt the base-paired DNA is in the 10 to 20 pN range (Figure 5A, fnDFS.B_S1_7bp = 15 ± 1 pN, fnDFS.B_S1_8bp = 18 ± 3 pN, fnDFS.B_S1_9bp = 21 ± 6 pN, fnDFS.B_S2_6bp = 12 ± 1 pN, fnDFS.A_S1_7bp = 21 ± 2 pN, fnDFS.A_S1_8bp = 22 ± 3 pN, fnDFS.A_S1_9bp = 21 ± 6 pN). These forces are an order of magnitude larger than previous forces applied and measured in a DNA origami nanodevice.
Figure 5.
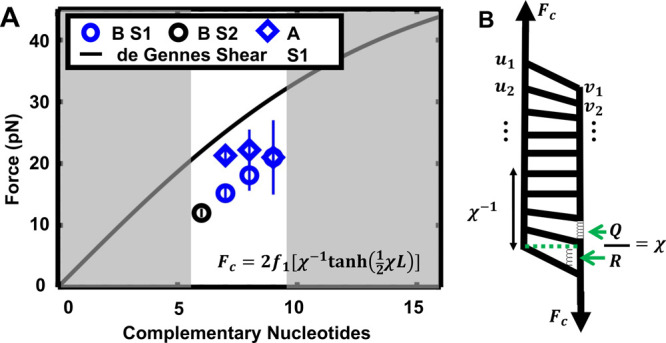
(A) Summary plot of measured forces for various nDFS devices. The maximum shear force for a given number of complementary nucleotides is shown in black. The grayed regions indicate the complementary nucleotide lengths that could not be determine by single-molecule measurements. (B) Diagram of physical quantities used to derive the de Gennes model of polymer shear strength. Displacements from rest un and vn index each base pair during application of shear force Fc. The polymer is characterized by a backbone spring constant Q and a spring constant R, which responds to differences in axial displacement for a given base pair. The polymer response is characterized by the ratio of these spring constants, including an “adjustment length” showing the length scale over which base pair tilting occurs during force response.
Observed Forces from the nDFS Nanodevice Agree with a dsDNA Polymer Model of Maximum Shear Strength
To further understand the measured force that the nDFS applies on the CS DNA, we compared these results to a shear strength model that was developed by Pierre de Gennes, which predicts the critical (maximum) force, FC, a dsDNA can support while subjected to a constant shear28 (Figure 5A,B). This model was determined in the continuum limit and results in an analytic solution: FC = 2f1[κ–1 tanh(1/2κLbound)], where f1 is the force required to rupture a single base pair by shear force, Lbound is the number of paired bases, and κ is the ratio of the linear extension on-axis spring constant (Q) to the linear shear spring constant (R). To plot this equation for dsDNA (Figure 5B), we used previous measured values of both f1 (3.9 pN) and κ = 92.5 for dsDNA.39 In addition, we confirmed that the continuum approximation is nearly identical to the analogous discrete model for calculating FC (Supplementary Figure S21). We find that our single-molecule kinetic studies determine forces applied by the nDFS that are similar but less than the maximum shear force required to unpair the annealed CS DNA (Figure 5B). The similarity between this model (with separately measured parameters) and the measured forces inferred from the single-molecule measurements provides validation of our kinetic approach. Furthermore, the analytical model overestimates the critical force because it does not include thermal fluctuations. In addition, both f1 and κ will be DNA sequence dependent.41 This can introduce up to about a 30% variation in the critical force. The numbers we used were determined from an experiment with a GC content of about 50%.39 The S1 and S2 sequences have a GC content of 32% and 38%, respectively. This suggests that the critical force will be lower than the value predicted by the de Gennes model. Therefore, these combined factors indicate that the observation that each of our force measurements is below the calculated critical force is further consistent with the analytical model.
A Partition Function Model Quantitatively Connects the Ensemble and Single-Molecule Measurements of the nDFS
To more quantitatively understand the nDFS with the CS DNA, we considered two key aspects of the system’s free energy to calculate the probability that the nDFS is in the closed state with the CS DNA annealed. The first aspect is the free energy difference between the fully annealed, partially annealed, and fully melted states of the two CS ssDNA molecules. Using a partition function approach, this can be calculated from known dinucleotide parameters including their dependence on ionic conditions.33,34 The second aspect is how the free energy of the nDFS changes as a function of angle. However, we do not have direct information on this latter contribution to the free energy because nDFS angles that allow for the CS DNA to anneal are too rare to reliably quantify by TEM.
In the absence of direct information on the free energy contribution of the nDFS, we make some plausible assumptions on the dependence of this free energy on the number of paired bases in the CS DNA. First, there must be an overall free energy cost, G0, for the nDFS to be at an angle small enough to where the CS DNA could anneal at all. Second, we note that the length per base for ssDNA is longer than for dsDNA. This difference results in a reduction in the length of the CS DNA as ssDNA is converted into dsDNA (Figure 6A). Since we observed above (Figure 5) that the nDFS must exert a force on the dsDNA, this reduction in overall length contributes a free energy that is linear in the number of closed base pairs. Third, this reduction in overall length of the annealed CS DNA in turn reduces the nDFS angle, which results in a concomitant increase in the force applied by the nDFS. If one approximates the nDFS locally as a linear torsional spring, this increase in force yields a free energy contribution of the nDFS that is quadratic in the number of closed base pairs. Taken together, these three contributions to the free energy result in GnDFS = G0 + g1N + g2N2, where N is the number of closed base pairs and we use the open state as the reference state. We then calculated the probability of the nDFS closing as a function of the number of complementary bases within the CS DNA using a partition function model of the nDFS and CS DNA system. We find that this linear torsional spring model fits the closing probability measurements well (Figure 6B, Supplementary Figure S22, yellow points) using separate fit parameters for nDFS.B and nDFS.A (Supplementary Figure S22) but identical fit parameters for the two different sequences in nDFS.B. To illuminate the importance of taking into account the force exerted by the nDFS, we also fitted a model with only GnDFS = G0 to the data for nDFS.B (Figure 6B, Supplementary Figure S22, red points). In this case, the calculated closing probability changes from less than 5% to over 95%, as only three additional base pairs are added. Varying G0 adjusts the number of complementary base pairs at which the nDFS is about 50% closed, but it does not influence the number of base pairs over which the transition from mostly open to mostly closed occurs. This change is too abrupt to be consistent with the nDFS closing probabilities measured by both TEM and ensemble FRET (Figure 6B, Supplementary Figure S22). In addition, TEM measurements revealed the nDFS.B does not completely close above 10 bp, which also cannot be accounted for in the model that does not take into account the force exerted by the nDFS. These results strongly suggest that both nDFS devices behave like linear torsional springs over this range of angles.
Figure 6.
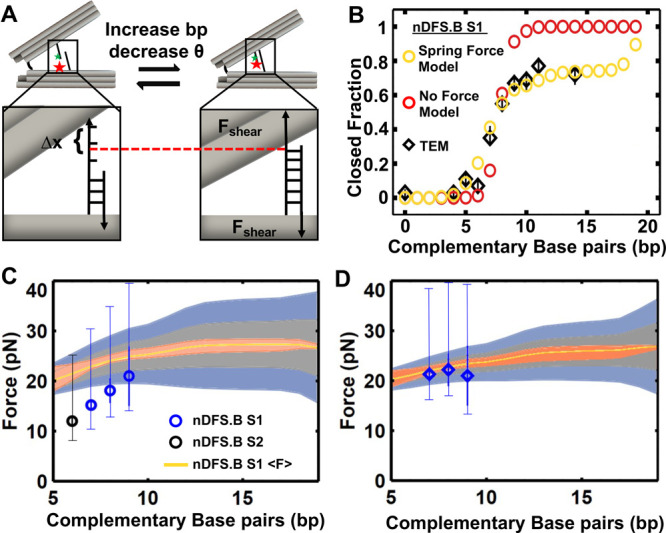
(A) Schematic
showing mechanism by which the closing angle decreases
with increasing number of hybridized bases within the CS strand, which
shortens the end-to-end distance. (B) Ensemble partition function
model showing the impacts of modeling the hinge with and without a
linear force term versus the observed TEM distribution.
(C and D) Plots of force predictions for the nDFS.B and nDFS.A devices
against measured forces, respectively. The thick uncertainty bars
represent the uncertainty of the force measurements from the single-molecule
measurements as shown in Figure 5. The thin uncertainty bars include the range of 0.2
to 0.5 nm for Δ shear, based on previous studies.22,38,39 The ensemble partition function
model prediction is in yellow. The orange error envelope was determined
from the interquartile range of an ⟨F(NBottom)⟩ distribution calculated with
100 000 samples. We also determined the variation in the instantaneous
force due to fluctuations in N and show the standard
deviation associated with this uncertainty in the gray (one standard
deviation) and blue (two standard deviations) envelope.
shear, based on previous studies.22,38,39 The ensemble partition function
model prediction is in yellow. The orange error envelope was determined
from the interquartile range of an ⟨F(NBottom)⟩ distribution calculated with
100 000 samples. We also determined the variation in the instantaneous
force due to fluctuations in N and show the standard
deviation associated with this uncertainty in the gray (one standard
deviation) and blue (two standard deviations) envelope.
The nDFS free energy fit parameters allow us to infer the
forces
that are applied by the nDFS on the annealed CS DNA. The force is
the derivative of the nDFS free energy with respect to the change
in length. This implies that the force applied by the nDFS for a change
in end-to-end distance (EED) of the CS DNA is F =
∂GnDFS/∂x = (1/ΔxEED) ∂GnDFS/∂N = (g1 + g2N)/ΔxEED, where ΔxEED is the change in
end-to-end distance associated with the conversion of one base pair
of dsDNA into ssDNA (which is distinct from the change in length of
the double-stranded DNA at maximal shearing Δ shear introduced above). To plot
the force applied by the nDFS as a function of the number of complementary
base pairs in the CS DNA, we determined the average force with the
partition function model (Figure 6C,D) with the uncertainties derived from the uncertainties
in the fit parameters g1 and g2. It was important to calculate the average forces from
the partition function model because the applied forces lead to fraying
of the CS DNA, resulting in a distribution of paired bases for each
overhang length (Figure S22). In addition,
the change ΔxEED in the EED associated
with closing of an additional base pair is not precisely constant
(Figure S8) because the EED of the ssDNA
itself depends (weakly) on the force that is applied by the nDFS.
Since the force changes depending on the number of bases paired, this
leads to a distribution of applied forces for each overhang length.
We find that our partition function model, which is based only on
fitting the TEM measurements of the fraction of nDFS devices closed
as a function of CS DNA complementary bases, predicts average nDFS
forces that agree well with the forces measured by our single-molecule
rate measurements (Figure 6C,D). This agreement in the average force determined by independent
measurements strongly supports the conclusion that our partition function
model captures the key features of the nDFS including the conclusion
that nDFS can apply forces between 10 and 20 pN to the CS DNA.
shear introduced above). To plot
the force applied by the nDFS as a function of the number of complementary
base pairs in the CS DNA, we determined the average force with the
partition function model (Figure 6C,D) with the uncertainties derived from the uncertainties
in the fit parameters g1 and g2. It was important to calculate the average forces from
the partition function model because the applied forces lead to fraying
of the CS DNA, resulting in a distribution of paired bases for each
overhang length (Figure S22). In addition,
the change ΔxEED in the EED associated
with closing of an additional base pair is not precisely constant
(Figure S8) because the EED of the ssDNA
itself depends (weakly) on the force that is applied by the nDFS.
Since the force changes depending on the number of bases paired, this
leads to a distribution of applied forces for each overhang length.
We find that our partition function model, which is based only on
fitting the TEM measurements of the fraction of nDFS devices closed
as a function of CS DNA complementary bases, predicts average nDFS
forces that agree well with the forces measured by our single-molecule
rate measurements (Figure 6C,D). This agreement in the average force determined by independent
measurements strongly supports the conclusion that our partition function
model captures the key features of the nDFS including the conclusion
that nDFS can apply forces between 10 and 20 pN to the CS DNA.
To provide a more intuitive understanding of the force response of the nDFS, we determined its spring constant. This spring constant is given by kS = ∂F/∂x = (1/ΔxEED) ∂F/ ∂N = g2/ΔxEED2. While as discussed above ΔxEED in principle depends on the force, we in practice find that it remains within 5% of ΔxEED = 0.3 nm over the range of complementary base pairs studied for nDFS.B with either S1 or S2 and for nDFS.A with S1 (Figure S8). Using this value, we find that the nDFS.B and nDFS.A have spring constants of about 3.7 and 2.2 pN/nm, respectively, and that the devices respond essentially linearly over a distance of at least 2 nm. The different observed spring constants show that the different configurations within the hinge vertex allow for the spring constant to be varied.
Conclusions
In this work, we have demonstrated through the design, fabrication, and implementation of the DNA origami nDFS device that it can function as a force probe in a force regime that is much higher than previously reported. The base design is a nanocaliper device where DNA connections at the vertex of the hinge can be configured to generate different hinge angle distributions as we reported previously.18 In this study, we used two devices, nDFS.B and nDFS.A, from this previous study.18 The primary difference is that we positioned the model biomolecule, a short double-strand DNA molecule, within the nDFS so that it is sheared from opposite 5 prime ends. In order to achieve significantly higher forces than what has been previously demonstrated with DNA origami nanodevices, the two complementary single-strand DNA molecules were incorporated such that they base pair to form a dsDNA molecule when the nDFS is in very rare states (small angles relative to freely diffusing device). Using smTIRF microscopy, we found that the nDFS stochastically performs repeated force measurements on the second time scale on the dsDNA molecule. Lastly, ensemble fluorescence and TEM data were used to build a partition function model, including parameters for the force and stiffness of the device at the particular angle of closure, in agreement with a de novo model of DNA shear strength and measured forces.
The quantitation of the observed forces
is by necessity indirect.
Direct observation of the free nDFS angle distribution via AFM allows the reconstruction of the free energy landscape as a
function of the angle and thus (near) direct observation of forces.18 However, this approach finds that configurations
at forces beyond a few piconewtons are too rare to be directly observed
and that the force–angle relationship is too nonlinear to meaningfully
extrapolate into the high-force regime observed here by capturing
the rare configurations via the DNA strut. The indirect
determination of the forces does come at the cost of uncertainties
in the parameters used to convert the experimental observables into
forces. In the case of the determination of the force from the single-molecule
rates, this is the location Δ shear of the transition state
(all other parameters of this analysis are pre-exponential and thus
enter the force only logarithmically). In the case of the partition
function model these are the stacking interaction parameters used
to model the DNA strut and the parameters describing the mechanical
properties of ssDNA, which are well established in the literature
but could be affected here, for example, by the ionic conditions and
the vicinity of the DNA origami bulk. However, while the exact magnitude
of the forces will by necessity depend on the particular choice of
these parameters, a main finding of this study is that the nDFS can
exert forces in the tens of piconewton range. This order of magnitude
is robust to reasonable variations in the parameters. In addition,
the fact that two completely independent approaches to extract the
forces (the single-molecule kinetics and the partition function model
of the equilibrium behavior) yield very consistent results further
supports that the extracted forces are reliable in spite of both methods
being model dependent.
shear of the transition state
(all other parameters of this analysis are pre-exponential and thus
enter the force only logarithmically). In the case of the partition
function model these are the stacking interaction parameters used
to model the DNA strut and the parameters describing the mechanical
properties of ssDNA, which are well established in the literature
but could be affected here, for example, by the ionic conditions and
the vicinity of the DNA origami bulk. However, while the exact magnitude
of the forces will by necessity depend on the particular choice of
these parameters, a main finding of this study is that the nDFS can
exert forces in the tens of piconewton range. This order of magnitude
is robust to reasonable variations in the parameters. In addition,
the fact that two completely independent approaches to extract the
forces (the single-molecule kinetics and the partition function model
of the equilibrium behavior) yield very consistent results further
supports that the extracted forces are reliable in spite of both methods
being model dependent.
Our studies provide strong evidence that the nDFS is able to apply tens of piconewtons of force. The origin of the force provided by the nDFS is connected to its design as a nanometer-scale rotary spring. As the caliper rotates away from its equilibrium angle, there is an associated torque that is converted into a force via the lever arms. Most likely the torque is due to the extension/compression of the short ssDNA molecules within the caliper vertex and steric clash between the caliper arms and the ssDNA within the vertex. This conclusion is consistent with our previous report that changes to the ssDNA within the vertex impact the equilibrium angle of the nDFS caliper and the angular dependence of the torque.18 In addition, the closing strands are located near the vertex of the nDFS and are held near the nDFS arms, which are highly charged. However, the buffer contains 130 mM Na+ and 10 mM Mg2+, which results in a screening length of less than 1 nm. So, charge interactions from the surrounding nDFS device do not likely play a role in destabilizing the closing strands.
These force levels are sufficient to stall many molecular motors42,43 and disrupt molecular structures44,45 including protein unfolding.46 Furthermore, in the rare states that lead to these high forces, the nDFS exhibits a stiffness of about 3.7 and 2.2 pN/nm at the location of the duplex test sample. This puts the nDFS in a regime that is complementary to existing force spectroscopy techniques. The stiffnesses are larger than the typical optical trap (OT, kS < 1 pN/nm) and less than AFM cantilevers (kS > 10 pN/nm).25 In addition, this is very different from magnetic tweezers (MTs), which has essentially no stiffness and therefore a constant force. While both OTs and AFMs can apply higher forces than we measured for the nDFS (over 100 pN), the nDFS measures forces that are typical for MTs, which are often limited to tens of piconewtons of force. While the dynamic range of the nDFS is only a few nanometers when the CS DNA was positioned about 10 nm from the nDFS vertex, the length of the nDFS arms allows for the molecules to be up to 50 nm from the vertex, which increases the dynamic range of this linear spring to about 10 nm. However, this is at the cost of a reduction in the force by a factor of 5.
The nDFS has additional similarities and differences with other force spectroscopy methods. In addition, both the nDFS and AFM repeatedly probe biomolecular binding and release. However, our device probes stochastically through thermal fluctuations, while an AFM probes periodically by a piezo positioner. An important distinction is that both AFMs and OTs use a force-calibrated cantilever or trapped microbead,25 while MTs rely on quantification of the thermal fluctuations to determine the applied force.47 The nDFS force measurements relied on characterizing thermal fluctuations between a low and high FRET state to compare the dissociation rate of the CS strands within the nDFS, which determines the opening transition rate of the device, to the dissociation rate of same two ssDNA molecules without an applied force. Then by knowing the distance between the fully bound state and the transition state toward dissociation,22,38 a force could be inferred using the Arrhenius equation. This approach is similar to previous molecular force measurements using fluctuating DNA origami nanodevices, including the force to dissociate a transcription factor from its DNA target site23,48 and molecular crowding forces.49
A key difference with other force measurements is that while the nDFS is a nanoscale device, these other methods require a micron or larger handle to apply a force to a single molecule. This includes a micron size polystyrene bead in a highly focused OT, an AFM cantilever with an atomically sharp tip, or a micron size bead containing iron oxide in a magnetic field gradient.25,49 In contrast, the nDFS is a nanoscale device. So, there is the potential to use the nDFS in highly constrained environments including cells50 and nanofluidic devices.51 Importantly, a single nDFS design has a limited capability to tune the applied force. The nDFS can be reconfigured, as we previously demonstrated,18 which could allow a single device to apply multiple levels of force. In the future, this could be used to modulate the nDFS, enabling multiple force measurements by a single device. However, a complete force spectroscopy characterization would likely require using multiple nDFS designs with distinct vertex properties or incorporating the molecular complex at different locations along the arms, to achieve several levels of force.
An important aspect of this work is how the combination of our partition function model and experimental measurements provide mechanistic insight into the force the nDFS applies to the dsDNA molecule. Our approach took advantage of the difference in contour length between double-stranded and single-stranded DNA for every additional nucleotide that is base paired. This allowed for the force as a function of average end-to-end distance to be studied in steps of 0.3 nm (Supplementary Figure S8). In addition, our model allowed us to explore the average number of paired bases while the construct is closed. We disaggregated the microstates for each construct (fixed number of complementary bases) by how many bases were actually paired and used that to compute the expected number of bases paired for each construct. We found that for both nDFS.B and nDFS.A the average number of bases paired plateaus (Supplementary Figure S23). These results indicate that the shortening of the internal strut, against the applied force of the device, was associated with a free energy cost higher than the stability imparted by an additional base pair. In addition, nDFS.B plateaus at a 9 nucleotide overhang length, while for nDFS.A the plateau occurred at a 13 nucleotide overhang length. This difference is consistent with our observations that the nDFS.B is more free energy costly to close than nDFS.A.
While these proof-of-principle studies focused on DNA base pairing, there are many other samples of biological interest that could be investigated with the nDFS. This includes other DNA structures such as Holliday junctions52 and G-quadruplexes,53 RNA structures such as riboswitches54 and viral RNA,54,55 DNA–protein complexes such as nucleosomes,56 RNA–protein complexes such as RNaseP,57 multiprotein complexes,58 and protein–ligand interactions.59 The key step is functionalizing the biomolecule of interest so that it can be integrated into the nDFS. There are a number of reported strategies to do this including commercially available approaches that include using maleimide,60 azide,61 and benzylguanine62 labels, among others. Overall, these studies show that the nDFS is a molecular-scale force probe that can apply tens of piconewtons of force on nanometer-sized biomolecules, which is a step forward in the development of technologies for force spectroscopy measurements in constrained environments such as cells and nanofluidic devices that are currently challenging to study with other force spectroscopy methods.
Methods
Preparation of DNA Origami Nanocalipers
The design of the nDFS, which builds off previous work,16 was recently reported.18 The nDFS arms consist of 20 dsDNA helices bundled into a 3 × 8 helix cross section with four interior helices missing, as shown in Figure 1. The two arms are joined at one edge by eight single-stranded scaffold connections, four of which are 2 nt long and four are 70 nt long. The longer connections are used to modulate hinge stiffness across the joint. The arms are approximately 210 bp long on the outer edge. One bottom arm was functionalized through the addition of nine dsDNA extensions on the outside face, each terminating in a 5′ biotin modification. Additionally, one fluorophore (Cy3 or Cy5) was incorporated specifically into each arm, forming a strut bridging the two arms consisting of two oligonucleotides closing strands, CSTop and CSBottom (Figure 1A). The sequences for all staples used are included in Supplementary Table S1. Briefly, one of two sequences was chosen for CSTop, and the length of CSBotttom was varied to control the length of the duplex. The maximum complementary closing strand CSBotttom for S1 and S2 is 5′-(A or G)TCTGTCTTAGTTAATGCG-3′, with bases removed from the 3′ end of CSBotttom to shorten the number of complementary nucleotides. When base paired, this strut brings the Cy3 and Cy5 fluorophores into very close proximity, with a short 2 nt thymine linker attaching each fluorophore to nearby base-paired DNA. A caDNAno design diagram is included in Supplementary Figure S1 illustrating all design details. In order to realize this design, a 8064 nt single-stranded scaffold isolated from the M13MP18 bacteriophage, produced as previously described,4 was folded with staples ordered from a commercial vendor (Supplementary Table S1, IDT, Coralville, IA, USA). A 20 nM scaffold and 200 nM of each staple were combined in a solution containing 5 mM Tris pH 8.0, 5 mM NaCl, 1 mM EDTA, and 18 mM MgCl2. This folding reaction was carried out in a thermocycler (Bio-Rad), with the annealing protocol consisting of rapid heating to 70 °C for 15 min followed by stepwise cooling at 1 degree per 3 h from 63 °C to 57 °C, then cooling to 4 °C, and incubating for 30 min. Samples were then purified by PEG precipitation.63 To achieve precipitation, the sample was mixed with an equal volume of 15% MW8000 PEG (Sigma-Aldrich) in 200 mM NaCl and 100 mM Tris pH 8.0. The combined solution was then centrifuged at 4 °C and 16000g for 30 min. The supernatant was removed and structures were resuspended in 0.5× TBE with 11 mM MgCl2. After resuspension, the 260 nm absorbance was measured using a Nanodrop and analyzed to determine concentration of the device. For devices to be measured using single-molecule techniques, they were then combined with a 27-fold excess (staple:structure, 3-fold excess of biotinylated staples relative to overhangs) of the two staples comprising the biotinylated linker for 15 min at 30 °C in a shaking incubator. These staples were never included in the original folding reaction. If they were added afterward, they were then purified by an additional round of PEG precipitation as described above.
TEM Data
The nanocaliper was diluted to 1 nM in 0.5× TBE with 11 mM MgCl2 buffer for transmission electron microscopy (TEM) imaging.4 A sample volume of 4 μL was pipetted onto a TEM grid (Formvar-coated copper grid, stabilized with evaporated carbon film, Ted Pella, Redding, CA, USA). The sample was incubated on the grid for 4 min to allow structures to deposit onto the surface, and then the sample was wicked away with filter paper. The sample was then stained with 2% uranyl formate (SPI, West Chester, PA, USA). First, a 10 μL drop was applied for 2 s and wicked away to wash the sample, and then another 10 μL drop was applied for 15 s and then wicked away with filter paper. TEM imaging was performed at the OSU Campus Microscopy and Imaging Facility on an FEI Tecnai G2 Spirit TEM using an acceleration voltage of 80 kV at a magnification of 45 000×.
The raw TEM images were organized into a gallery (Supplementary Figures S2–S7) using the particle picking tool in the software EMAN2. Angles were then measured manually from the image galleries to be able to easily correlate measured angles to specific particles. The angles were measured in the software ImageJ by drawing two straight lines directly on each particle along the inner edges of the hinge arms, starting at the end of one arm, then selecting the vertex, and then the end of the other arm.
We used MATLAB as the postprocessing tool to convert the angle data sets to probability density histograms. To estimate the fraction of nanocalipers in open or closed states, we used a least-squares fitting approach by assuming the full conformational distribution consisting of two populations, open and closed. We further assumed both open and closed nanocaliper populations followed Gaussian distributions. Hence, the full distribution was fit with a combination of two Gaussian distributions, capturing the open and closed distributions. The widths and means of the two distributions were held fixed between different CSBottom lengths. The fraction closed was then determined by the Gaussian weight factor between the open and closed Gaussian distributions. To quantify the uncertainty of the fraction closed, we used a bootstrapping approach by sampling the angular distribution with the same sample size of randomly selected devices. The sampling was repeated 100 times to determine the mean and standard deviation. The standard deviation was used as the uncertainty of the fraction closed.
Ensemble FRET Experiments
FRET experiments were carried out to verify the closed/open state of the nDFS.30 Structures were measured at 1 nM concentration in a solution containing 50 mM Tris pH 8.0, 130 mM NaCl, 10.1 mM MgCl2, 0.1 mM EDTA, and 0.005% Tween20. The experiment was carried out in a quartz cuvette using a FluoroMax4 fluorescence spectrometer (Horiba Instruments). Raw FRET efficiency was then calculated with the RatioA method from the emission spectra of Cy3 and Cy5 fluorophores.30 This FRET efficiency was then normalized by dividing all observed values by the highest observed raw FRET efficiency and then plotted.
Flow Channel Preparation
Flow chambers for single-molecule experiments were made using quartz microscope slides (Fisher Scientific, AA42297KJ) and glass coverslips functionalized with PEG.16,64 Briefly, quartz slides were cleaned with a mixture of sulfuric acid and hydrogen peroxide, sonicated in acetone and toluene, and rinsed extensively with highly pure water. PEG-SVA (Laysan Bio) was then incubated with the slides in a shaking incubator at room temperature in toluene with 100 mM acetic acid. Slides were then rinsed extensively in water and sample chambers were created with Parafilm adhering the glass coverslips to the quartz slides. Slides were then stored under vacuum at −20 °C for up to 6 months.
Single-Molecule FRET Measurements
Single-molecule FRET experiments were carried out with a total internal reflectance fluorescence (TIRF) with illumination through a prism interface as previously described. Diode lasers of 532 and 638 nm (Crystal Lasers) were used to excite Cy3 and Cy5 as necessary through a collimated, collinear excitation pathway guided to a Pellin-Broca prism (Melles-Griot) at an angle appropriate for total internal reflection. This prism rests on an oil interface connecting it to a flow cell whose construction is described in the previous section. Light coming from the sample chamber is collected by a 1.2 numerical aperture water immersion objective (Olympus, UplanSApo 60×/1.20w) and filtered by a DualView system (Optical Insights) featuring a dichroic beam splitter (Chroma Tech, T635lpxr) and bandpass filters (Chroma Tech D585/30 and D680/35). The filtered image was then incident on an EMCCD camera (Princeton Instruments PhotonMax 512). Images were collected with Winview software provided with the camera. In preparation for the experiment, slides were left to come to room temperature under vacuum. Once opened, sample chambers were then rinsed with T130 buffer (50 mM Tris pH 8.0, 130 mM NaCl, 0.005% Tween 20), incubated with 1 mg/mL ultrapure BSA in T130 buffer (Sigma-Aldrich AM2616) for 1 min, rinsed with 100 μL of T130 buffer, incubated with neutravidin (20 μg/mL in T130 buffer) for 1 min, and rinsed with 100 μL of T130 buffer supplemented with 10 mM MgCl2. Immediately after this rinse, samples were diluted to 25 pM concentration and added to the flow chamber to incubate for 30 s. The chamber was then rinsed a final time with 50 μL of T130 buffer supplemented with 10 mM MgCl2 and imaging buffer (50 mM Tris pH 8.0, 0.5 mg/mL BSA, 130 mM NaCl, 10 mM MgCl2, 0.005% Tween20, glucose oxidase, cyclooctatetraene, and 2% final concentration of glucose36). Immediately following mixture and addition of the imaging buffer, the samples were imaged for up to 90 min.
Analysis of Single-Molecule/Kinetic Data
Imaging of devices was completed in a 2000 frame time series at 5 Hz, for a total length of 400 s. Up to 100 frames at the beginning of the time series were used to directly excite Cy5 molecules with the 638 nm laser. The remainder of the experiment was spent under Cy3 excitation conditions (538 nm laser only). The direct excitation of Cy5 molecules was used to create a mask of image locations with maxima indicating the presence of Cy5 using ImageJ. The image series was then filtered with a 50-pixel-average background subtraction function using ImageJ. Then the mask was applied to the background-subtracted images to yield individual traces. These individual traces were then analyzed in MATLAB. Traces were screened by the researcher using the following criteria: exhibit at least three complete FRET state transitions and all fluorophore fluctuations appeared consistent with a two-state (high/low) FRET model, allowing for one photobleaching event per channel. To assist in analysis, the anticorrelation between the signals was calculated and used to determine if consistent anticorrelated activity occurred in traces that were too noisy to efficiently inspect by hand. These traces were then fitted to a hidden Markov model using a modified version of command-line ebFRET fitting two-state idealized traces.37 Dwell times were then fit with either a single- or double-exponential fit depending on the log-likelihood as measured by MEMLET.65 Since ebFRET considers the entire population of traces, each trace was analyzed twice: once in a data set formed from traces in one image series and once in an aggregate set with all traces under a given experimental condition. To estimate the error of the rates, the standard deviation was taken of rates measured across the individual image series. The reported rate was the rate measured by combining all traces into one aggregate data set. Then cumulative sums were fit to a double exponential, and the dominant rate was reported; see Supplemental Figures S14, S15, and S17–S20.
BHQ3 Labeling of Oligonucleotides
Oligonucleotides for dsDNA experiments were ordered from Sigma-Aldrich, one of which contained an amine-modified thymine at its 5′ end for labeling. Black Hole Quencher 3-NHS-ester or Cy5-NHS ester was used to label the oligonucleotides, which were both purified separately by reverse phase HPLC on a 218TP C18 column (Vydac). Cy5-labeled oligonucleotides were then combined with biotin-labeled complementary oligonucleotides for 15 min at 65 °C and cooled over 15 min to 4 °C in a thermocycler. The sample was then purified using anion-exchange chromatography using a Gen-Pak Fax column (Waters).
BHQ3 Oligonucleotide Ensemble Quenching Measurements
To carry out dsDNA ensemble experiments, BHQ3-labeled complementary oligo was titrated at nanomolar concentrations into the solution previously described under ensemble FRET. Rather than measure FRET, only Cy5 emission under direct excitation was measured and then analyzed as previously reported for PIFE.64 Cy5 emission efficiency was normalized to a sample with no quencher, and then quenching activity was fit to a sigmoidal binding curve with a Hill coefficient of 1 to determine an apparent S1/2. The error was evaluated by repeating the measurement in triplicate and propagating sample error through to the fit parameter.
BHQ3 Oligonucleotide Single-Molecule Experiments
To carry out dsDNA single-molecule experiments, the same protocol was used for imaging and flow cell preparation as described above, except that all imaging was done under Cy5 direct excitation and only the Cy5 channel was used in further analysis. Normalized Cy5 efficiency was then input into the modified ebFRET script as if it were FRET data and then analyzed as described above.
Single-Molecule Fluorescence Measurements with the smfBox
Single-molecule confocal microscopy data were collected on the custom-built smfBox. Full details of the construction and operation of the instrument are described elsewhere31 including a step-by-step method protocol.66 Briefly, the smfBox alternates two lasers (515 nm, ∼220 μW and 635 nm, ∼70 μW, Omicron LuxX Plus lasers, powers measured immediately before the excitation dichroic) by TTL-controlled modulation of electronic shutters. The beams are coupled into a single-mode fiber before being collimated (to 10 mm) and cropped by an iris (to 5 mm), then directed into a custom-built anodized-aluminum microscope body. nDFS.B S1 constructs were diluted to approximately 10 pM in 10 mM Tris, 5 mM NaCl, and 10 mM MgCl2 buffer with 0.1 mg/mL BSA and data acquired on the smfBox. The MATLAB software package PAM was used to analyze the data.67 Bursts were selected using a sliding window dual-channel burst search with a 50-photon threshold and a 500 μs window size. Custom python code (available at https://github.com/craggslab/smfBox/) was used to sort photon arrival times chronologically in the hdf5 data files to enable export into the PDAFit software function of PAM. Probability distribution analysis was then performed to fit a two-state model to the data using the histogram library method.68
Partition Function Model of Device Actuation
In order to calculate the closing probability, we use a partition function analysis.69 This analysis requires both an enumeration of allowed states of the system and the (free) energy associated with each of these states, in this case the open and closed states of the nDFS. For this calculation, we define a single open state with a reference free energy of zero and conceive of the closed state as being made up of states i distinguished by the number of paired bases in the overhang Ni. We can calculate the expected base-pairing free energy in each state i from the sequence of the DNA using well-established DNA stacking free energies,34 but we do not know a priori the energy cost to close the hinge, which is the driving source for the force applied to the duplex. This energy cost is therefore approximated as a quadratic function of the number of overhang bases paired, since each additional paired base decreases the opening angle of the hinge and thus increases the force exerted on the overhang. The closing free energy thus depends on three energetic fit parameters associated with the constant, linear, and quadratic hinge closing energetic term. In particular, for a given state i,
 |
where G0, g1, and g2 are the constant, linear, and quadratic parameters, respectively, that define the free energy cost of closing the hinge, and ΔGbp,i is the base-pairing free energy associated with state i, calculated using the SantaLucia model34 with salt corrections calculated using Owczarzy etal.’s formula,33 which includes dinucleotide sequence dependence of the base-pairing free energy.
Given this set of states and their associated free energies, we compute the partition function and calculate the closing probability as
 |
where the partition function for the open states is Zo = e–βΔGopen = 1 by definition and
 |
where the sum is over all closed states i, accounting for the many possible base-pairing states for the closed device. These closing probabilities were then fit to experimental ensemble TEM data for each construct as described in the Model Fitting section. For the nDFS.B construct, the fit was applied globally across S1 and S2 data to reflect their common nDFS structure. To solve for the force output by each construct, we derived an implicit equation from a model of a freely jointed chain and the free energies solved for in the previous step, as described in the section Force Calculation. Custom scripts were written in Mathematica and Python to calculate these quantities.
Model Fitting
In order to relate the model to the data, we fit the closed probability pc to the experimental closed probability calculated via TEM by varying the three energetic parameters G0, g1, and g2 within physically realistic bounds. In particular, while g1 and g2 are unbounded, the constant term G0 is required to be positive, since TEM images revealed the free nDFS prefers an open configuration to zeroth order but may have less predictable higher order effects. This fit is performed via a nonlinear least-squares minimization for this set of parameters using a Trust Region Reflective algorithm,70,71 which is implemented using the Python SciPy package.70
Force Calculation
To calculate the force output for each construct, we first consider the force exerted by the hinge as a function of the number of paired bases N,
 |
In order to compute the force, we thus need to determine the dependence of N on the end-to-end distance of the closing strut x. To do this, we assume that when double-stranded DNA is fully extended, each base pair has extension xdsDNA = 0.34 nm and that the average extension per base pair of the single-stranded DNA is given by a freely jointed chain model such that the overall strut EED is
 |
where a is the Kuhn length, lss is the length per base of a fully extended
ssDNA, F is the force, and C is
a constant corresponding to the number of bases in the top arm overhang.
Since we are in a high-force regime (i.e.,  ), we can approximate the expected ssDNA
length per nucleotide,
), we can approximate the expected ssDNA
length per nucleotide,  , as constant. This approximation holds
to about 5%, as is shown in Supplementary Figure S8. This allows us to write
, as constant. This approximation holds
to about 5%, as is shown in Supplementary Figure S8. This allows us to write
 |
We now can compute F(N) numerically, given by the implicit expression
 |
Finally, the average force for a given length of CSBottom, which we refer to as NBottom, is given by
 |
where the states i correspond to all the closed states for the bottom overhang length NBottom. In order to estimate the uncertainty on ⟨F(NBottom)⟩, we sample randomly from a multivariate normal distribution based on the covariance of the energetic fit parameters G0, g1, and g2. We then calculate ⟨F(NBottom)⟩ for each random sample. The error envelope was determined from the interquartile range of an ⟨F(NBottom)⟩ distribution calculated with 100 000 samples. We also determined the variation in the instantaneous force due to fluctuations in N and show one and two standard deviations associated with this uncertainty. This standard deviation is given by
 |
Expected Paired Bases Calculation
In order to calculate the average number of paired bases in the closed states, we can write
 |
where the states i correspond to all the closed states for the bottom overhang length NBottom.
The standard deviation of the number of paired bases is calculated from the standard deviation,
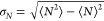 |
where
 |
Expected Change in Strut EED Due to Base Pairing
In order to calculate the average change in strut EED per paired bases in the closed states, we can write
 |
where
the states i correspond
to all the closed states for the bottom overhang length NBottom, and  as above.
The standard deviation
is again  .
.
Acknowledgments
We are grateful to the Poirier, Castro, Bundschuh, and Craggs lab members for insightful discussions and feedback on this work. TEM images were acquired at the OSU Campus Microscopy and Imaging Facility, which is supported in part by grant number P30 CA016058, National Cancer Institute, Bethesda, MD. This work was supported by the National Science Foundation [MCB1715321, EFMA1933344 to C.E.C., M.G.P.; DMR1719316 to R.A.B.]; National Institutes of Health [R01 GM121966, R01 GM131626, R35 GM139564 to M.G.P.]; and Biotechnology and Biological Sciences Research Council, UK [BB/T008032/1 to T.D.C.]. Funding for open access charge was provided by the National Science Foundation.
Supporting Information Available
The Supporting Information is available free of charge at https://pubs.acs.org/doi/10.1021/acsnano.1c10698.
caDNAno schematics of the NDFs; TEM images of the nDFS devices; details of the partition function model, the ensemble fluorescence experiments, the single-molecule confocal measurements, and the smTIRF measurements; table of the DNA oligonucleotides used in this study; tables that summarize the data from the smTIRF measurements (PDF)
The authors declare no competing financial interest.
Notes
The experimental data sets are either included in this submission or the Supporting Information or are available from the authors upon request.
Supplementary Material
References
- Seeman C. Structural DNA Nanotechnology Nadrian. MRS Bull. 2017, 42, 614. 10.1557/mrs.2017.177. [DOI] [Google Scholar]
- DeLuca M., Shi Z., Castro C. E., Arya G.. Dynamic DNA Nanotechnology: Toward Functional Nanoscale Devices. Nanoscale Horizons 2020, 5 ( (2), ), 182. 10.1039/C9NH00529C. [DOI] [Google Scholar]
- Rothemund P. W. K. Folding DNA to Create Nanoscale Shapes and Patterns. Nature 2006, 440 (7082), 297–302. 10.1038/nature04586. [DOI] [PubMed] [Google Scholar]
- Castro C. E.; Kilchherr F.; Kim D.-N.; Shiao E. L.; Wauer T.; Wortmann P.; Bathe M.; Dietz H. A Primer to Scaffolded DNA Origami. Nat. Methods 2011, 8 (3), 221–229. 10.1038/nmeth.1570. [DOI] [PubMed] [Google Scholar]
- Douglas S. M.; Dietz H.; Liedl T.; Högberg B.; Graf F.; Shih W. M. Self-Assembly of DNA into Nanoscale Three-Dimensional Shapes. Nature 2009, 459 (7245), 414–418. 10.1038/nature08016. [DOI] [PMC free article] [PubMed] [Google Scholar]
- Douglas S. M.; Marblestone A. H.; Teerapittayanon S.; Vazquez A.; Church G. M.; Shih W. M. Rapid Prototyping of 3D DNA-Origami Shapes with caDNAno. Nucleic Acids Res. 2009, 37 (15), 5001–5006. 10.1093/nar/gkp436. [DOI] [PMC free article] [PubMed] [Google Scholar]
- Shen B.; Kostiainen M. A.; Linko V. DNA Origami Nanophotonics and Plasmonics at Interfaces. Langmuir 2018, 34 (49), 14911–14920. 10.1021/acs.langmuir.8b01843. [DOI] [PMC free article] [PubMed] [Google Scholar]
- Ai Z.; Wang L.; Guo Q.; Kong D.; Wu Y.; Liu Y.; Wei D. Short-Wavelength Ultraviolet Dosimeters Based on DNA Nanostructure-Modified Graphene Field-Effect Transistors. Chem. Commun. 2021, 57 (41), 5071–5074. 10.1039/D1CC01851E. [DOI] [PubMed] [Google Scholar]
- Chao J.; Wang J.; Wang F.; Ouyang X.; Kopperger E.; Liu H.; Li Q.; Shi J.; Wang L.; Hu J.; Wang L.; Huang W.; Simmel F. C.; Fan C. Solving Mazes with Single-Molecule DNA Navigators. Nat. Mater. 2019, 18 (3), 273–279. 10.1038/s41563-018-0205-3. [DOI] [PubMed] [Google Scholar]
- Wang D.; Fu Y.; Yan J.; Zhao B.; Dai B.; Chao J.; Liu H.; He D.; Zhang Y.; Fan C.; Song S. Molecular Logic Gates on DNA Origami Nanostructures for microRNA Diagnostics. Anal. Chem. 2014, 86 (4), 1932–1936. 10.1021/ac403661z. [DOI] [PubMed] [Google Scholar]
- Roth E.; Glick Azaria A.; Girshevitz O.; Bitler A.; Garini Y. Measuring the Conformation and Persistence Length of Single-Stranded DNA Using a DNA Origami Structure. Nano Lett. 2018, 18 (11), 6703–6709. 10.1021/acs.nanolett.8b02093. [DOI] [PubMed] [Google Scholar]
- Kearney C. J.; Lucas C. R.; O’Brien F. J.; Castro C. E. DNA Origami: Folded DNA-Nanodevices That Can Direct and Interpret Cell Behavior. Adv. Mater. 2016, 28 (27), 5509–5524. 10.1002/adma.201504733. [DOI] [PMC free article] [PubMed] [Google Scholar]
- Marras A. E.; Zhou L.; Su H.-J.; Castro C. E. Programmable Motion of DNA Origami Mechanisms. Proc. Natl. Acad. Sci. U. S. A. 2015, 112 (3), 713–718. 10.1073/pnas.1408869112. [DOI] [PMC free article] [PubMed] [Google Scholar]
- Endo M.; Sugiyama H. Single-Molecule Imaging of Dynamic Motions of Biomolecules in DNA Origami Nanostructures Using High-Speed Atomic Force Microscopy. Acc. Chem. Res. 2014, 47 (6), 1645–1653. 10.1021/ar400299m. [DOI] [PubMed] [Google Scholar]
- Funke J. J.; Ketterer P.; Lieleg C.; Schunter S.; Korber P.; Dietz H. Uncovering the Forces between Nucleosomes Using a DNA Origami Force Spectrometer. Biophys. J. 2017, 112, 166a. 10.1016/j.bpj.2016.11.915. [DOI] [PMC free article] [PubMed] [Google Scholar]
- Le J. V.; Luo Y.; Darcy M. A.; Lucas C. R.; Goodwin M. F.; Poirier M. G.; Castro C. E. Probing Nucleosome Stability with a DNA Origami Nanocaliper. ACS Nano 2016, 10 (7), 7073–7084. 10.1021/acsnano.6b03218. [DOI] [PMC free article] [PubMed] [Google Scholar]
- Zhao D.; Le J. V.; Darcy M. A.; Crocker K.; Poirier M. G.; Castro C.; Bundschuh R. Quantitative Modeling of Nucleosome Unwrapping from Both Ends. Biophys. J. 2019, 117 (11), 2204–2216. 10.1016/j.bpj.2019.09.048. [DOI] [PMC free article] [PubMed] [Google Scholar]
- Wang Y.; Le J. V.; Crocker K.; Darcy M. A.; Halley P. D.; Zhao D.; Andrioff N.; Croy C.; Poirier M. G.; Bundschuh R.; Castro C. E.. A Nanoscale DNA Force Spectrometer Capable of Applying Tension and Compression on Biomolecules. Nucleic Acids Res. 2021, 10.1093/nar/gkab656. [DOI] [PMC free article] [PubMed] [Google Scholar]
- Johnson J. A.; Dehankar A.; Winter J. O.; Castro C. E. Reciprocal Control of Hierarchical DNA Origami-Nanoparticle Assemblies. Nano Lett. 2019, 19 (12), 8469–8475. 10.1021/acs.nanolett.9b02786. [DOI] [PubMed] [Google Scholar]
- DeLuca M.; Shi Z.; Castro C. E.; Arya G. Dynamic DNA Nanotechnology: Toward Functional Nanoscale Devices. Nanoscale Horizons. 2020, 5, 182–201. 10.1039/C9NH00529C. [DOI] [Google Scholar]
- Puchner E. M.; Gaub H. E. Force and Function: Probing Proteins with AFM-Based Force Spectroscopy. Curr. Opin. Struct. Biol. 2009, 19 (5), 605–614. 10.1016/j.sbi.2009.09.005. [DOI] [PubMed] [Google Scholar]
- Lang M. J.; Fordyce P. M.; Engh A. M.; Neuman K. C.; Block S. M. Simultaneous, Coincident Optical Trapping and Single-Molecule Fluorescence. Nat. Methods 2004, 1 (2), 133–139. 10.1038/nmeth714. [DOI] [PMC free article] [PubMed] [Google Scholar]
- Nickels P. C.; Wünsch B.; Holzmeister P.; Bae W.; Kneer L. M.; Grohmann D.; Tinnefeld P.; Liedl T. Molecular Force Spectroscopy with a DNA Origami-Based Nanoscopic Force Clamp. Science 2016, 354 (6310), 305–307. 10.1126/science.aah5974. [DOI] [PMC free article] [PubMed] [Google Scholar]
- Funke J. J.; Ketterer P.; Lieleg C.; Schunter S.; Korber P.; Dietz H. Uncovering the Forces between Nucleosomes Using DNA Origami. Sci. Adv. 2016, 2 (11), e1600974 10.1126/sciadv.1600974. [DOI] [PMC free article] [PubMed] [Google Scholar]
- Neuman K. C.; Nagy A. Single-Molecule Force Spectroscopy: Optical Tweezers, Magnetic Tweezers and Atomic Force Microscopy. Nat. Methods 2008, 5 (6), 491–505. 10.1038/nmeth.1218. [DOI] [PMC free article] [PubMed] [Google Scholar]
- Whitley K. D.; Comstock M. J.; Chemla Y. R. Ultrashort Nucleic Acid Duplexes Exhibit Long Wormlike Chain Behavior with Force-Dependent Edge Effects. Phys. Rev. Lett. 2018, 120 (6), 068102. 10.1103/PhysRevLett.120.068102. [DOI] [PubMed] [Google Scholar]
- Kim K.; Saleh O. A. A High-Resolution Magnetic Tweezer for Single-Molecule Measurements. Nucleic Acids Res. 2009, 37 (20), e136 10.1093/nar/gkp725. [DOI] [PMC free article] [PubMed] [Google Scholar]
- de Gennes P.-G. Maximum Pull out Force on DNA Hybrids. C. R. Acad. Sciences - Ser. IV - Phys. 2001, 2, 1505–1508. 10.1016/S1296-2147(01)01287-2. [DOI] [Google Scholar]
- Funke J. J.; Ketterer P.; Lieleg C.; Korber P.; Dietz H. Exploring Nucleosome Unwrapping Using DNA Origami. Nano Lett. 2016, 16 (12), 7891–7898. 10.1021/acs.nanolett.6b04169. [DOI] [PubMed] [Google Scholar]
- Clegg R. M. Fluorescence Resonance Energy Transfer. Curr. Opin. Biotechnol. 1995, 6 (1), 103–110. 10.1016/0958-1669(95)80016-6. [DOI] [PubMed] [Google Scholar]
- Ambrose B.; Baxter J. M.; Cully J.; Willmott M.; Steele E. M.; Bateman B. C.; Martin-Fernandez M. L.; Cadby A.; Shewring J.; Aaldering M.; Craggs T. D. The smfBox Is an Open-Source Platform for Single-Molecule FRET. Nat. Commun. 2020, 11 (1), 5641. 10.1038/s41467-020-19468-4. [DOI] [PMC free article] [PubMed] [Google Scholar]
- Owczarzy R.; You Y.; Moreira B. G.; Manthey J. A.; Huang L.; Behlke M. A.; Walder J. A. Effects of Sodium Ions on DNA Duplex Oligomers: Improved Predictions of Melting Temperatures. Biochemistry 2004, 43 (12), 3537–3554. 10.1021/bi034621r. [DOI] [PubMed] [Google Scholar]
- Owczarzy R.; Moreira B. G.; You Y.; Behlke M. A.; Walder J. A. Predicting Stability of DNA Duplexes in Solutions Containing Magnesium and Monovalent Cations. Biochemistry 2008, 47 (19), 5336–5353. 10.1021/bi702363u. [DOI] [PubMed] [Google Scholar]
- SantaLucia J. Jr A Unified View of Polymer, Dumbbell, and Oligonucleotide DNA Nearest-Neighbor Thermodynamics. Proc. Natl. Acad. Sci. U. S. A. 1998, 95 (4), 1460–1465. 10.1073/pnas.95.4.1460. [DOI] [PMC free article] [PubMed] [Google Scholar]
- Modi S.; Bhatia D.; Simmel F. C.; Krishnan Y. Structural DNA Nanotechnology: From Bases to Bricks, from Structure to Function. J. Phys. Chem. Lett. 2010, 1 (13), 1994–2005. 10.1021/jz1004957. [DOI] [Google Scholar]
- Aitken C. E.; Marshall R. A.; Puglisi J. D. An Oxygen Scavenging System for Improvement of Dye Stability in Single-Molecule Fluorescence Experiments. Biophys. J. 2008, 94 (5), 1826–1835. 10.1529/biophysj.107.117689. [DOI] [PMC free article] [PubMed] [Google Scholar]
- van de Meent J.-W.; van de Meent J.-W.; Bronson J. E.; Wiggins C. H.; Gonzalez R. L. Empirical Bayes Methods Enable Advanced Population-Level Analyses of Single-Molecule FRET Experiments. Biophys. J. 2014, 106, 1327–1337. 10.1016/j.bpj.2013.12.055. [DOI] [PMC free article] [PubMed] [Google Scholar]
- Mosayebi M.; Louis A. A.; Doye J. P. K.; Ouldridge T. E. Force-Induced Rupture of a DNA Duplex: From Fundamentals to Force Sensors. ACS Nano 2015, 9 (12), 11993–12003. 10.1021/acsnano.5b04726. [DOI] [PubMed] [Google Scholar]
- Hatch K.; Danilowicz C.; Coljee V.; Prentiss M. Demonstration That the Shear Force Required to Separate Short Double-Stranded DNA Does Not Increase Significantly with Sequence Length for Sequences Longer than 25 Base Pairs. Phys. Rev. E Stat. Nonlin. Soft Matter Phys. 2008, 78 (1), 011920. 10.1103/PhysRevE.78.011920. [DOI] [PubMed] [Google Scholar]
- Paramanathan T.; Reeves D.; Friedman L. J.; Kondev J.; Gelles J. A General Mechanism for Competitor-Induced Dissociation of Molecular Complexes. Nat. Commun. 2014, 5, 5207. 10.1038/ncomms6207. [DOI] [PMC free article] [PubMed] [Google Scholar]
- Chakrabarti B.; Nelson D. R. Shear Unzipping of DNA. J. Phys. Chem. B 2009, 113 (12), 3831–3836. 10.1021/jp808232p. [DOI] [PubMed] [Google Scholar]
- Block S. M.; Goldstein L. S.; Schnapp B. J. Bead Movement by Single Kinesin Molecules Studied with Optical Tweezers. Nature 1990, 348 (6299), 348–352. 10.1038/348348a0. [DOI] [PubMed] [Google Scholar]
- Finer J. T.; Simmons R. M.; Spudich J. A. Single Myosin Molecule Mechanics: Piconewton Forces and Nanometre Steps. Nature 1994, 368 (6467), 113–119. 10.1038/368113a0. [DOI] [PubMed] [Google Scholar]
- Florin E.; Moy V.; Gaub H. Adhesion Forces between Individual Ligand-Receptor Pairs. Science. 1994, 264, 415–417. 10.1126/science.8153628. [DOI] [PubMed] [Google Scholar]
- Merkel R.; Nassoy P.; Leung A.; Ritchie K.; Evans E. Energy Landscapes of Receptor-Ligand Bonds Explored with Dynamic Force Spectroscopy. Nature 1999, 397 (6714), 50–53. 10.1038/16219. [DOI] [PubMed] [Google Scholar]
- Stigler J.; Rief M. Calcium-Dependent Folding of Single Calmodulin Molecules. Proc. Natl. Acad. Sci. U. S. A. 2012, 109 (44), 17814–17819. 10.1073/pnas.1201801109. [DOI] [PMC free article] [PubMed] [Google Scholar]
- Gosse C.; Croquette V. Magnetic Tweezers: Micromanipulation and Force Measurement at the Molecular Level. Biophys. J. 2002, 82 (6), 3314–3329. 10.1016/S0006-3495(02)75672-5. [DOI] [PMC free article] [PubMed] [Google Scholar]
- Kramm K.; Schröder T.; Gouge J.; Vera A. M.; Gupta K.; Heiss F. B.; Liedl T.; Engel C.; Berger I.; Vannini A.; Tinnefeld P.; Grohmann D. DNA Origami-Based Single-Molecule Force Spectroscopy Elucidates RNA Polymerase III Pre-Initiation Complex Stability. Nat. Commun. 2020, 11 (1), 2828. 10.1038/s41467-020-16702-x. [DOI] [PMC free article] [PubMed] [Google Scholar]
- Hudoba M. W.; Luo Y.; Zacharias A.; Poirier M. G.; Castro C. E. Dynamic DNA Origami Device for Measuring Compressive Depletion Forces. ACS Nano 2017, 11 (7), 6566–6573. 10.1021/acsnano.6b07097. [DOI] [PubMed] [Google Scholar]
- Halley P. D.; Lucas C. R.; McWilliams E. M.; Webber M. J.; Patton R. A.; Kural C.; Lucas D. M.; Byrd J. C.; Castro C. E. Daunorubicin-Loaded DNA Origami Nanostructures Circumvent Drug-Resistance Mechanisms in a Leukemia Model. Small 2016, 12 (3), 308–320. 10.1002/smll.201502118. [DOI] [PMC free article] [PubMed] [Google Scholar]
- Engelen W.; Dietz H. Advancing Biophysics Using DNA Origami. Annu. Rev. Biophys. 2021, 50, 469–492. 10.1146/annurev-biophys-110520-125739. [DOI] [PubMed] [Google Scholar]
- Duckett D. R.; Murchie A. I. H.; Diekmann S.; von Kitzing E.; Kemper B.; Lilley D. M. J. The Structure of the Holliday Junction, and Its Resolution. Cell. 1988, 55, 79–89. 10.1016/0092-8674(88)90011-6. [DOI] [PubMed] [Google Scholar]
- Lipps H. J.; Rhodes D. G-Quadruplex Structures: In Vivo Evidence and Function. Trends Cell Biol. 2009, 19 (8), 414–422. 10.1016/j.tcb.2009.05.002. [DOI] [PubMed] [Google Scholar]
- Nudler E.; Mironov A. S. The Riboswitch Control of Bacterial Metabolism. Trends Biochem. Sci. 2004, 29 (1), 11–17. 10.1016/j.tibs.2003.11.004. [DOI] [PubMed] [Google Scholar]
- Krug R. M. Influenza Viral RNA Transcription and Replication. RNA Genetics. 2018, 159–169. 10.1201/9781351076425-8. [DOI] [Google Scholar]
- Xiao B.; Freedman B. S.; Miller K. E.; Heald R.; Marko J. F. Histone H1 Compacts DNA under Force and during Chromatin Assembly. Mol. Biol. Cell 2012, 23 (24), 4864–4871. 10.1091/mbc.e12-07-0518. [DOI] [PMC free article] [PubMed] [Google Scholar]
- Altman S. A View of RNase P. Mol. Biosyst. 2007, 3 (9), 604–607. 10.1039/b707850c. [DOI] [PubMed] [Google Scholar]
- Wang Y.-L.; Faiola F.; Xu M.; Pan S.; Martinez E. Human ATAC Is a GCN5/PCAF-Containing Acetylase Complex with a Novel NC2-like Histone Fold Module That Interacts with the TATA-Binding Protein. J. Biol. Chem. 2008, 283 (49), 33808–33815. 10.1074/jbc.M806936200. [DOI] [PMC free article] [PubMed] [Google Scholar]
- Ewert S.; Huber T.; Honegger A.; Plückthun A. Biophysical Properties of Human Antibody Variable Domains. J. Mol. Biol. 2003, 325, 531–553. 10.1016/S0022-2836(02)01237-8. [DOI] [PubMed] [Google Scholar]
- Howorka S.; Cheley S.; Bayley H. Sequence-Specific Detection of Individual DNA Strands Using Engineered Nanopores. Nat. Biotechnol. 2001, 19 (7), 636–639. 10.1038/90236. [DOI] [PubMed] [Google Scholar]
- Duckworth B. P.; Chen Y.; Wollack J. W.; Sham Y.; Mueller J. D.; Andrew Taton T.; Distefano M. D. A Universal Method for the Preparation of Covalent Protein-DNA Conjugates for Use in Creating Protein Nanostructures. Angew. Chem. 2007, 119, 8975–8978. 10.1002/ange.200701942. [DOI] [PubMed] [Google Scholar]
- Jongsma M. A.; Litjens R. H. G. M. Self-Assembling Protein Arrays on DNA Chips by Auto-Labeling Fusion Proteins with a Single DNA Address. Proteomics 2006, 6 (9), 2650–2655. 10.1002/pmic.200500654. [DOI] [PubMed] [Google Scholar]
- Stahl E.; Martin T. G.; Praetorius F.; Dietz H. Facile and Scalable Preparation of Pure and Dense DNA Origami Solutions. Angew. Chem., Int. Ed. Engl. 2014, 53 (47), 12735–12740. 10.1002/anie.201405991. [DOI] [PMC free article] [PubMed] [Google Scholar]
- Donovan B. T.; Chen H.; Jipa C.; Bai L.; Poirier M. G. Dissociation Rate Compensation Mechanism for Budding Yeast Pioneer Transcription Factors. Elife 2019, 8, 8. 10.7554/eLife.43008. [DOI] [PMC free article] [PubMed] [Google Scholar]
- Woody M. S.; Lewis J. H.; Greenberg M. J.; Goldman Y. E.; Ostap E. M. MEMLET: An Easy-to-Use Tool for Data Fitting and Model Comparison Using Maximum-Likelihood Estimation. Biophys. J. 2016, 111 (2), 273–282. 10.1016/j.bpj.2016.06.019. [DOI] [PMC free article] [PubMed] [Google Scholar]
- Abdelhamid M. A. S.; Rhind-Tutt A. V.; Ambrose B.; Craggs T. D. Making Precise and Accurate Single-Molecule FRET Measurements Using the Open-Source smfBox. J. Vis. Exp. 2021, 173. 10.3791/62378. [DOI] [PubMed] [Google Scholar]
- Schrimpf W.; Barth A.; Hendrix J.; Lamb D. C. PAM: A Framework for Integrated Analysis of Imaging, Single-Molecule, and Ensemble Fluorescence Data. Biophys. J. 2018, 114 (7), 1518–1528. 10.1016/j.bpj.2018.02.035. [DOI] [PMC free article] [PubMed] [Google Scholar]
- Antonik M.; Felekyan S.; Gaiduk A.; Seidel C. A. M. Separating Structural Heterogeneities from Stochastic Variations in Fluorescence Resonance Energy Transfer Distributions via Photon Distribution Analysis. J. Phys. Chem. B 2006, 110 (13), 6970–6978. 10.1021/jp057257+. [DOI] [PubMed] [Google Scholar]
- Schroeder D. V.An Introduction to Thermal Physics; Addison Wesley Longman: San Francisco, 2021; pp 247–249; 10.1093/oso/9780192895547.001.0001. [DOI] [Google Scholar]
- Virtanen P.; Gommers R.; Oliphant T. E.; Haberland M.; Reddy T.; Cournapeau D.; Burovski E.; Peterson P.; Weckesser W.; Bright J.; van der Walt S. J.; Brett M.; Wilson J.; Millman K. J.; Mayorov N.; Nelson A. R. J.; Jones E.; Kern R.; Larson E.; Carey C. J.; Polat İ.; Feng Y.; Moore E. W.; VanderPlas J.; Laxalde D.; Perktold J.; Cimrman R.; Henriksen I.; Quintero E. A.; Harris C. R.; Archibald A. M.; Ribeiro A. H.; Pedregosa F.; van Mulbregt P. SciPy 1.0 Contributors. SciPy 1.0: Fundamental Algorithms for Scientific Computing in Python. Nat. Methods 2020, 17 (3), 261–272. 10.1038/s41592-019-0686-2. [DOI] [PMC free article] [PubMed] [Google Scholar]
- Branch M. A.; Coleman T. F.; Li Y. A Subspace, Interior, and Conjugate Gradient Method for Large-Scale Bound-Constrained Minimization Problems. SIAM Journal on Scientific Computing. 1999, 21, 1–23. 10.1137/S1064827595289108. [DOI] [Google Scholar]
Associated Data
This section collects any data citations, data availability statements, or supplementary materials included in this article.