Abstract
In this paper, we report the successful preparation of a novel bifunctional heterogeneous catalyst Ptδ+/SBA-APTE-SA with a partial positively charged Ptδ+ electronic structure via post-synthesis modification of (3-aminopropyl)triethoxysilane (APTE), succinic anhydride (SA) and platinum precursors. The resulting catalyst showed superior catalytic performance for the hydrosilylation of 1,1,1,3,5,5,5-heptamethyltrisiloxane (MDHM) with allyloxy polyethylene glycol (APEG) compared to a heterogeneous platinum catalyst. In addition, our catalyst was suitable for the hydrosilylation of other alkenes. Furthermore, the catalyst displayed sufficient stability after being reused five times without noticeable inactivation. In terms of cycle number and atomic utilization efficiency, it has potential applications as a green hydrosilylation method for industry.
Ptδ+ was uniformly dispersed in aminated and carboxylated SBA-15 as a highly efficient catalyst for the hydrosilylation reaction.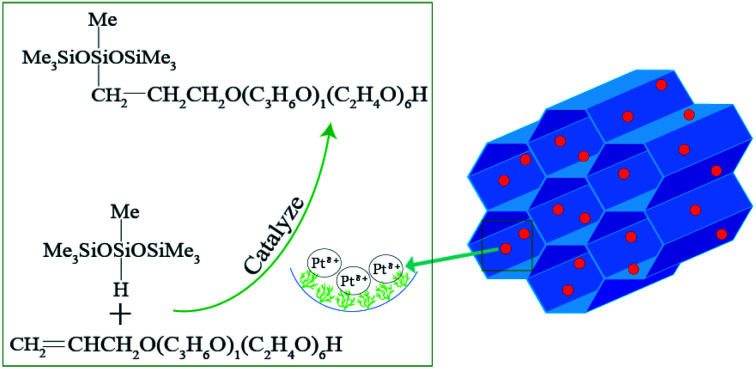
1. Introduction
Hydrosilylation of alkenes is one of the most important synthetic methods for industrial preparation of organosilicon compounds.1–6 Although many transition metal catalysts are used in a large number of organic synthesis reactions, few catalysts are utilized in hydrosilylation reactions. Among them, platinum catalysts such as the Speier catalyst7 and Karstedt catalyst8 are the most effective. However, the search for practical catalysts based on Earth abundant metals is a longstanding challenge owing to the high cost and deleterious environmental profile associated with platinum mining. These shortcomings have driven the development of heterogeneous catalysts, which are easily separated and recyclable.9–11
Organosilicon compounds can be prepared via a homogeneously catalyzed synthetic procedure, which benefits from fast reaction rate, high conversion rate, and low reaction resistance.12,13 However, separation of the products from catalyst is nearly impossible, hindering catalyst reusability.14 Consequently, precious metals are wasted, and impart a darker color to the synthesized product, shortening its shelf life. Heterogeneous metal catalysts15 can be separated from products of mixed reactants without contaminating the metal residues, making them more environment-friendly than homogenous ones and reusable. Common heterogeneous catalysts are prepared by fixing metal particles on the surface of inorganic materials, such as activated carbon, silica, alumina and titanium dioxide or by loading organometallic materials on the functionalized organic polymers.
Recent reports have shown that mesoporous silica is a good carrier of gas storage,16 separation,17 chemical sensing18 and catalysis.19 This is due to mesoporous silica possessing a larger specific surface area (up to several thousand m2 g−1) and higher volume, more controllable pore structure, etc. Furthermore, it has controlled size distribution and shows tremendous advantages in limiting metal nanoparticles (NPs). When the metal or metal oxide particles are confined in the mesoporous silica's cavities or porous channels, the, prepared catalytic materials have uniform particle dispersion,20,21 which enhances heterogeneous catalytic activity. However, the absence of functional groups and selective sites in the majority of stable mesoporous silica limits their uses as catalysis. In particular, SBA-15 type mesoporous silicon is a two-dimensional hexagonal mesoporous material, possessing a large surface area, multiple unsaturated metal sites and good thermal stability provided by multiple functionalization sites.22–25 Therefore, mesoporous silica is often used as a substrate for the preparation of catalysts. Ye et al.26 reported a highly efficient bifunctional catalyst MCM-41–(SH-Pt)–(Vi-Pt), where Pt nanoparticles are uniformly dispersed on mesoporous silica functionalized by mercapto and vinyl groups, displaying high catalytic performance in the hydrosilylation of alkenes. Xie et al.27 successfully encapsulated Pt nanoparticles (NPs) on the surfaces and channels of Chitosan modified mesoporous silica (CS–SiO2), producing highly efficient catalysts (Pt/CS–SiO2) for the hydrosilylation reaction. Furthermore, the catalyst has excellent stability and reusability, at least 7 times without significant reduction in efficiency. However, there have been no reports of aminated and carboxylated mesoporous silica supporting partially charged platinum as the catalyst for hydrosilylation reaction.
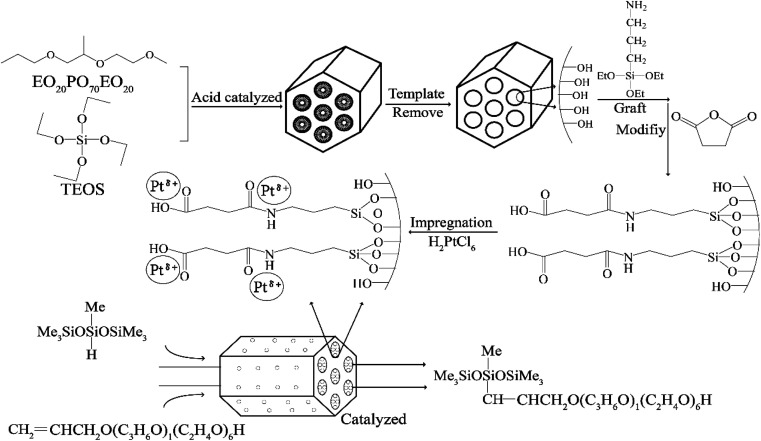
In the present research, aminated and carboxylated SBA-APTE-SA was successfully synthesized using (3-aminopropyl)triethoxysilane (APTE) and succinic anhydride (SA) functionalized SBA-15. By harnessing the unique properties of SBA-APTE-SA, Pt was uniformly dispersed on the surface and mesoporous channels of SBA-APTE-SA, generating a highly efficient catalyst for the hydrosilylation reaction (Fig. 1). In addition, we explore the commercial value of the catalytic products and show that this it is a promising candidate as a future green industrial catalyst.
Fig. 1. The strategy for the synthesis of 1.5% Ptδ+/SBA-APTE-SA catalysts using two-step modification SBA-15 and their application in the hydrosilylation process.
2. Experimental
2.1. Materials
1,1,1,3,5,5,5-Heptamethyltrisiloxane (MDHM, industrial grade, molecular weight = 222.5 g mol−1) was purchased from Nanchang tianrun new materials Co., Ltd, China. Allyloxy polyethylene glycol (APEG, industrial grade, average molecular weight = 380 g mol−1) and acrylic polyether (APEE, MW = 200 g mol−1) was purchased from Yangzhou chenhua new materials Co., Ltd, China. Chloroplatinic acid (H2PtCl6·6H2O, analytical reagent) was purchased from Shanghai Macklin biochemical Co. Ltd, China. Pluronic P123 (EO20PO70EO20) was obtained from Sigma Aldrich Co. Ltd. Hydrochloric acid (HCl, AR) was purchased from Guangzhou Chemical Reagent Factory. Tetraethoxysilane (TEOS) (AR, Aladdin) was purchased from Aladdin. (3-aminopropyl)triethoxysilane (APTES) and succinic anhydride (SA) were purchased from Aladdin.
2.2. Preparation of catalyst
Synthesis of mesoporous SBA-15
According to ref. 28, 3.0 g of P123 and 37.5 mL of HCl (weight% = 36–38%) were completely dissolved in 187.5 mL of deionized water at 40 °C with stirring (250 rpm) for 1 h. Then 6.0 g of TEOS was added to the solution dropwise, and the mixture stirred for 24 h before transferring to a polytetrafluoroethylene crystallizer at 100 °C for crystallization for 24 h, followed by filtration, washing, and drying at 50 °C. Finally, the template was separated by calcining at 550 °C for 5 h in a muffle furnace generating SBA-15.
Modification of mesoporous silica SBA-15
1.0 g of dry SBA-15 (dried at 110 °C for 24 h) was placed in a 30 mL solution containing 0.8 g of APTES in water-free toluene with continuous stirring for 24 h at 80 °C. After filtration, washing and drying, SBA-APTE was produced. Then 0.2 g of SBA-APTE was added to 60 mL of toluene and the solution was kept stirring at 50 °C until dissolved. Then, 0.1 g of SA was added and allowed to react overnight at room temperature. SBA-APTE-SA powders were separated from the reaction medium by filtration, followed by washing several times with toluene and ethanol, and then dried under vacuum at 50 °C.
Preparation of 1.5% Pt/SBA-APTE-SA
First, 0.1 g of vacuum dried SBA-APTE-SA was dispersed in 30 mL of absolute ethanol, and 0.41 mL of H2PtCl6–ethanol (0.05 mol L−1). The mixture was sonicated for 5 min in an ultrasonic bath (100 W) and vigorously stirred at 80 °C for 10 h. The solid product was filtered and washed with absolute ethanol, and dried at 80 °C under vacuum. The as-prepared samples were labeled 1.5% Pt/SBA-APTE-SA, where 1.5% denotes the nominal Pt loading. The Pt loading levels in this study were expressed as the mass percent of Pt in the catalyst, as confirmed by inductively coupled plasma (ICP-OES, PerkinElmer 8300) elemental analysis.
2.3. Catalyst characterization
The crystalline structure and phase composition were determined by X-ray powder diffraction (low-angle XRD; D8 Rigaku9000, λ = 0.154 nm, scanning rate 1° min−1, scanning range 2–15°) and (wide-angle XRD, D8 Rigaku9000, scanning rate 10° min−1, scanning range 10–80°). Fourier transforms infrared (FTIR) spectra were recorded on a Spectrum-100 FT-IR spectrometer using KBr wafer technique with scanning range of 4000–450 cm−1. Modification of SBA-15 was investigated by thermogravimetric analysis (TGA in an atmosphere of N2 from 40 to 800 °C with a temperature ramp of 10 °C min−1). The N2 adsorption–desorption isotherms and pore size distribution were obtained at 77 K using Quadrasord SI apparatus. After the sample was evacuated at 150 °C for 10 h, the Brunauer–Emmett–Teller (BET) surface area was calculated using the multiple-point BET method in the relative pressure range of P/P0 = 0.05–0.2, and the pore diameter distribution curves were obtained using the DFT calculations method. The morphology of the material, and the presence and distribution of Pt was observed by scanning electron microscopy (SEM; S4800) and transmission electron microscopy (TEM; Jeol 2100F). The surface electronic states were analyzed using X-ray photoelectron spectrometer (XPS; Thermo fisher Scientific K-Alpha+), and the XPS data were internally calibrated, fixing the binding energy of C 1s at 284.6 eV. The product conversion of various substrates was analyzed by gas chromatography-mass spectrometry (GC-MS) on an Agilent 6890 N instrument, equipped with a HP-5MS capillary column (30 m × 0.25 mm, 0.25 μm). An auto-injector was employed to inject the samples at 250 °C and was set as 10 : 1 split ratio. The carrier gas flow rate of helium was 1 mL min−1. The warming procedure was as follows: held at 50 °C for 2 min, ramped to 280 °C at a rate of 15 °C min−1 and held for 10 min. The ionization mode was EI (70 eV, 300 μA) and the ion source of the mass spectrometer was set to 230 °C. 1H NMR spectra were recorded on an Ascend 400 (400 MHz) NMR spectrometer using CDCl3 as the solvent. 29Si solid-state NMR spectra were recorded on a Agilent 600M NMR spectrometer. The Pt content of the catalyst was determined through Inductive Coupled Plasma Emission Spectrometer (ICP) measurement using Thermo Scientific (Agilent 720ES) spectrometer.
2.4. Catalytic performance evaluation
The hydrosilylation reaction step is as follows: a mixture of the catalyst (Ptδ+/SBA-APTE-SA) and an appropriate amount of APEG was placed in a 50 mL three-necked flask and vigorously stirred at 100 °C for 30 min. Then, 0.02 mol of MDHM was added dropwise and the mixture heated to the specified temperature. After the reaction was completed and cooled to room temperature, the product was isolated by centrifugation (6000 rpm, 20 min, 25 °C) and further characterized by GC-MS and 1H NMR (S2, S3, ESI†). Finally, a catalytic cycle experiment was carried out under the action of a recovered catalyst.
3. Results and discussion
3.1. Catalyst characterization
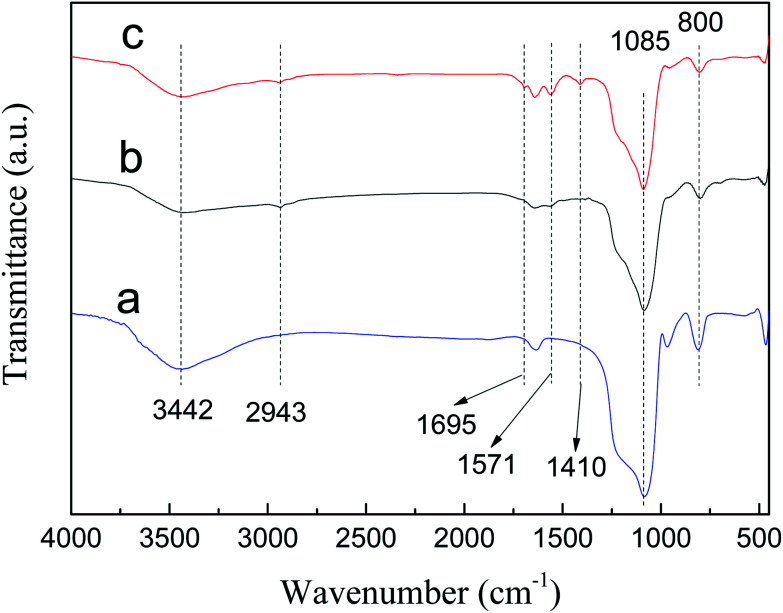
FT-IR spectra of SBA-15, SBA-APTE and SBA-APTE-SA are shown in Fig. 2. Unmodified SBA-15 shows typical vibration bands of siliceous materials, such as asymmetric stretching Si–O–Si at 1085 cm−1, symmetric stretching Si–O–Si at 800 cm−1, and stretching vibrations Si–OH at 3442 cm−1. By comparing Fig. 2a and b, three new characteristic peaks are observed in SBA-APTE modified with APTE. Among them, the weak absorption peak at 2943 cm−1 is associated with –CH2–CH2– stretching vibration, whereas the sharp peak at 1571 cm−1 corresponds to C–N stretching vibration. Comparison of Fig. 2c and b, shows that SBA-APTE-SA modified with SA displays two new characteristic peaks. The absorption peak at 1695 cm−1 related to –COO– tensile vibration and at 1410 cm−1 corresponding to –COO– anti-stretching vibration. The preliminarily analysis demonstrates that SBA-15 is successfully modified with APTE and SA.
Fig. 2. FT-IR spectra of SBA-15 (a), SBA-APTE (b) and SBA-APTE-SA (c).
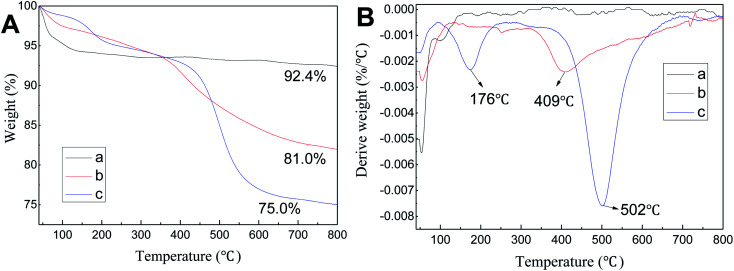
TGA curves of SBA-15, SBA-APTE and SBA-APTE-SA are shown in Fig. 3A(a–c). According to Fig. 3A, the loss of 40–100 °C is attributed to the elimination of water and residual water physically adsorbed on the channel's surface. From the Fig. 3A in the TG line, the final residues of SBA-15, SBA-APTE and SBA-APTE-SA are 92.4%, 81.0% and 75.01%, respectively. DTG curves of the three samples are shown in Fig. 3B(a–c). The curve of SBA-15 has no apparent peak after 150 °C, whereas SBA-APTE and SBA-APTE-SA have one and two decomposition peaks, respectively. SBA-APTE has a broad decomposition peak approx. 409 °C due to its amino group and carbon element undergoing rapid decomposition. SBA-APTE-SA possesses a decomposition peak at approx. 176 °C due to the residual SA. Similarly, SBA-APTE-SA displays a decomposition peak at approx. 502 °C, owing to the amino and carboxyl groups, and carbon element that rapidly decompose. Therefore, TGA and DTG analysis confirms that APTE and SA successfully modify SBA-15.
Fig. 3. TGA (A) and DTG (B) curves of SBA-15 (a) SBA-APTE (b) and SBA-APTE-SA (c).
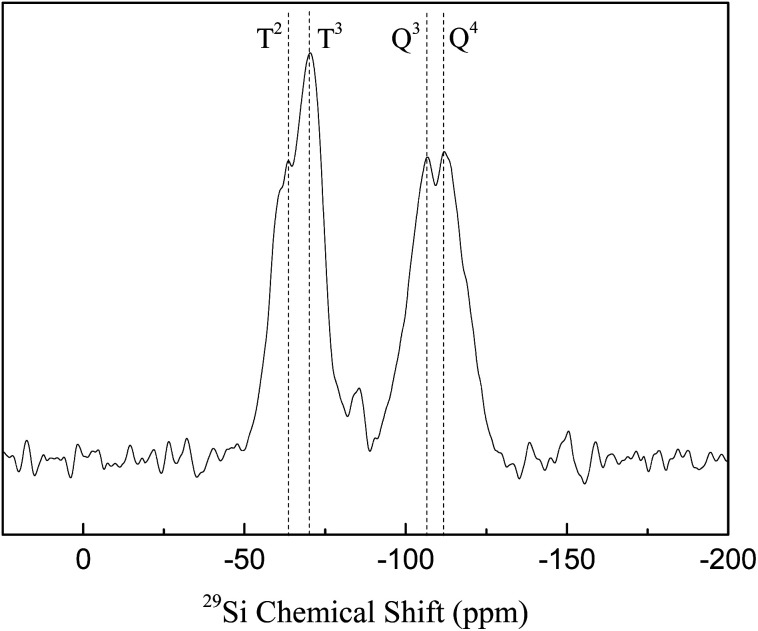
29Si solid-state NMR spectra are shown in Fig. 4. SBA-APTE-SA exhibits Q3, Q4, T2 and T3 bonds, indicating the presence of Si–O–H and Si–O–C bonds in the material.29 Addition of APTE and SA during the synthesis of SBA-APTE-SA, causes the presence of Si–O–C bonds (T2, T3). However, the existence of Si–O–H (Q3, Q4) proves that not all hydroxyl groups on SBA-15 are modified by APTE and SA.
Fig. 4. 29Si solid-state NMR spectra of SBA-APTE-SA.
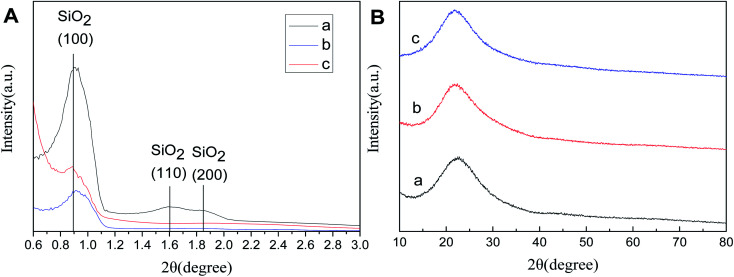
Fig. 5A(a–c) shows the low-angle XRD (LXRD) patterns of SBA-15, SBA-APTE-SA, and Ptδ+/SBA-APTE-SA. SBA-15 exhibits a characteristic peak at 2θ = 0.86, 1.61 and 1.84 of the crystal face of 100, 110 and 200, indicating that the prepared material is a two-dimensional hexagonal mesoporous type.30,31 The LXRD of modified or Pt loaded mesoporous silica show no obvious alterations, which proves that the modification and loading of Pt did not alter the mesostructure and orderliness of SBA-15. The peak intensities of (100) reflections in SBA-APTE gradually decrease from modified SBA-15, and the peak of (110) with (200) reflections disappear from modified SBA-15 due to the proper loading of an organic modifier and homogeneous complexes, respectively.32Fig. 5B shows the wide-angle X-ray diffraction (WXRD) patterns of the samples. SBA-15 displays a characteristic peak at 2θ = 15–30. vSBA-APTE-SA and 1.5% Ptδ+/SBA-APTE-SA WXRD patterns are similar to that of SBA-15 and only show the peak of amorphous silica, which is presumably due to Pt being evenly dispersed on SBA-APTE-SA or the cluster size of Pt is smaller than the detection limit of the X-ray.
Fig. 5. Low-angle XRD patterns (A) and wide angle XRD patterns (B) of SBA-15 (a), SBA-APTE-SA (b), and 1.5% Ptδ+/SBA-APTE-SA (c).
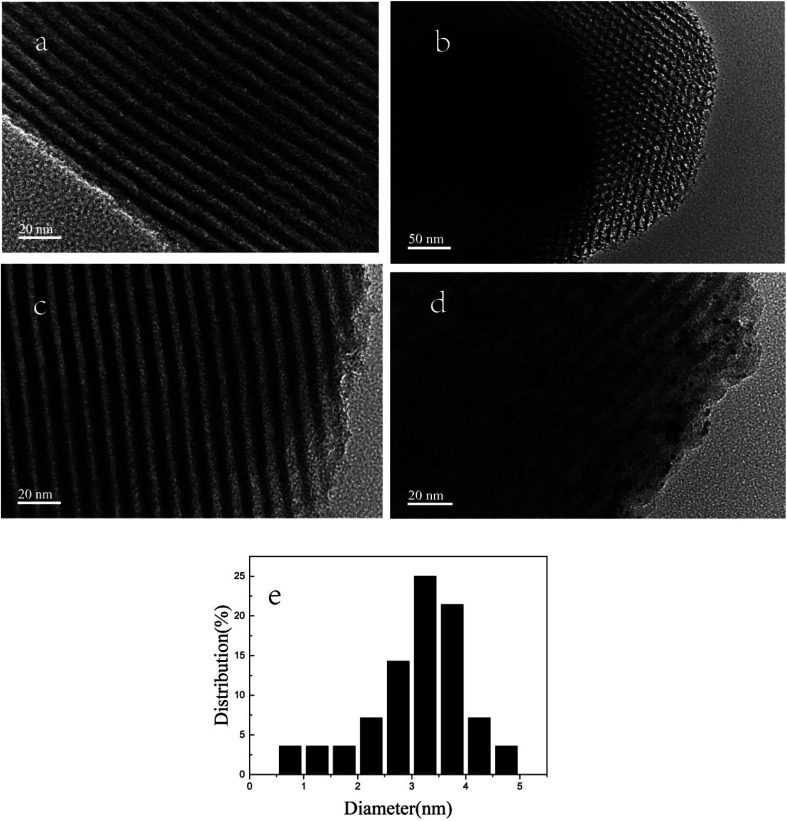
The surface morphology of SBA-15, SBA-APTE-SA and 1.5% Ptδ+/SBA-APTE-SA were characterized using TEM (Fig. 6). Fig. 6a and b display the hexagonal array of the well-ordered two-dimensional pore structure and the typical honeycomb resembling SBA-15.33–35 In Fig. 6c, the edges of the modified mesoporous silica are rough, due to modifications causing slight damage to some of the lattice structure of the mesoporous silica. This results are in agreement with XRD analysis. In addition, TEM analysis provided direct observation of the morphology and distribution of Ptδ+ nanoparticles in the Ptδ+/SBA-APTE-SA composite. Typical TEM images of SBA-15 shown in Fig. 6d clearly display uniform and highly dispersed Ptδ+ nanoparticles in the hexagonal channels. Therefore, Ptδ+ is well dispersed in the SBA-APTE-SA guest, has a narrow size distribution between 1–5 nm (Fig. 6f), and is concentrated approx. 3 nm. This is due to the stability of the structure of the crystal itself and the presence of a functional group attached to the skeleton.
Fig. 6. HR-TEM images of SBA-15 (a and b), SBA-APTE-SA (c) and 1.5% Ptδ+/SBA-APTE-SA (d) and the corresponding size distribution plot of Ptδ+ (e).
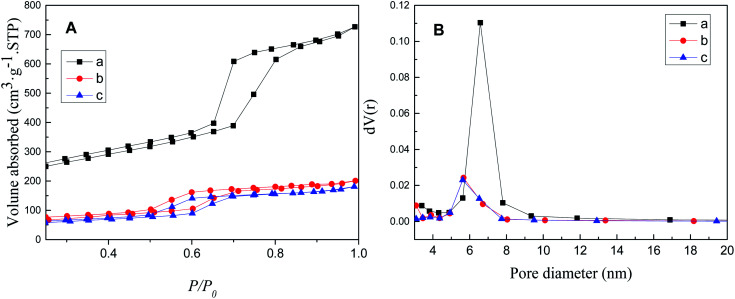
The N2 adsorption/desorption isotherm and pore size distribution of SBA-15, SBA-APTE-SA, and 1.5% Ptδ+/SBA-APTE-SA are depicted in Fig. 7. The isotherms of the samples indicate the Langmuir IV type adsorption (Fig. 7A).36 The hysteresis loops of these isotherms are obvious, indicating that the samples possess a large pore size,37 and belong to the type H2 loops.38 SBA-15 exhibits a 513 m2 g−1 surface area. However, it decreases to 211 m2 g−1 post modification with APTE and SA. After loading Ptδ+, its surface area is further reduced to 186 m2 g−1, indicating most Ptδ+ are dispersed inside the pores instead of being distributed on the outer surface. The pore diameter distribution was analyzed by the BJH method, and the distribution is shown in Fig. 7B and data parameters are listed in Table 1 with uniform pore diameter. Micropores are generated while calcining mesoporous SBA-15.39 The smaller pore diameter size is to blockage of micropores by APTE and SA or calcination collapsing the pores.40
Fig. 7. N2 adsorption/desorption isotherms (A) and pore size distribution (B) of SBA-15 (a), SBA-APTE-SA (b) and 1.5% Ptδ+/SBA-APTE-SA (c).
The pore structural parameters of SBA-15, SBA-APTE-SA and 1.5% Ptδ+/SBA-APTE-SA.
| Materials | Surface area (m2 g−1) | Pore diameter (nm) | Pore volume (m3 g−1) |
|---|---|---|---|
| SBA-15 | 513 | 6.577 | 0.918 |
| SBA-APTE-SA | 211 | 4.327 | 0.280 |
| 1.5% Ptδ+/SBA-APTE-SA | 186 | 4.304 | 0.259 |
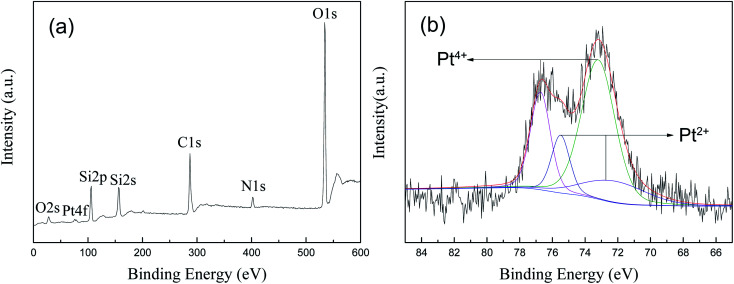
XPS analysis was performed to determine the chemical composition of the prepared 1.5% Ptδ+/SBA-APTE-SA nanoparticle and chemical status of Pt in the samples. Fig. 8a shows the presence of O, Si, N, and C elements, and the corresponding photoelectron peaks that appear at binding energies of 531 (O 1s), 28 (O 2s), 402 (N 1s), 156 (Si 2s), 106 (Si 2p) and 285 (C 1s). Nature and oxidation state of the Pt species (Pt0, Pt2+, and Pt4+) is normally determined by Pt (4f) peak study using XPS technique. As shown in Fig. 8b, the Pt 4f XRD spectra of Ptδ+/SBA-APTE-SA displays a doublet containing a low energy band (Pt 4f7/2) and high energy band (Pt 4f5/2). Pt4+ is 73.2 and 76.8 eV, and Pt2+ is 72.7 and 75.5 eV. As determined, the negative shift of Pt binding energies for Ptδ+/SBA-APTE-SA relative to that of Ptδ+ is present. This is due to Ptδ+ complexes with amino and carboxyl groups, causing a negative shift in the binding energy of platinum. To identify different chemical states of Pt, the spectra were fitted by two overlapping curves, named Pt4+ and Pt2+. In terms of kinetics, since the partially charged Ptδ+ electronic structure of Ptδ+/SBA-APTE-SA is produced before the catalytic reaction proceeds, additional formation to initiate the hydrosilylation reaction is not required compared with other forms. Thus, the Ptδ+/SBA-APTE-SA catalyst has a higher catalytic performance for the hydrosilylation of alkenes.
Fig. 8. XPS spectra of 1.5% Ptδ+/SBA-APTE-SA: survey spectrum (a) and high resolution of Pt spectrum (b).
3.2. Catalytic hydrosilylation of alkenes
Numerous reports have shown that platinum is an effective catalyst for hydrogenation of alkenes. However, considering environmental concerns and ecological protection, we employed the above catalyst as a representative substrate for MDHM to catalyze the hydrosilylation of APEG. The effects of Ptδ+/SBA-APTE-SA catalytic loading, as well as other factors on the catalytic activity of APEG and MDHM hydrosilylation reactions were investigated (Table 2). Under the same reaction time and amount of catalyst, the catalytic performance of the catalyst increases with increasing temperature (entries 3, 4, 5 and 6). Under the same reaction conditions, 1.5% Ptδ+/SBA-APTE-SA displays greater catalytic efficiency than 1% and 2% catalyst (entries 5, 7 and 8). Utilization of pure support SBA-APTE-SA or SBA-15, did not promote the reaction (approx. 3% and 4% conversion), implying that Pt is crucial (entries 1 and 2). When the hydrosilylation reaction is carried out at 100 °C with different catalyst loading (relative to the amount of Pt in MDHM) of Ptδ+/SBA-APTE-SA (1.5% Pt loading) catalyst. As the catalyst loading increases, the conversion rate of the substrate displays an upward trend, with 6.15, 8.21 and 10.24 mmol% showing enhanced conversion (entries 5, 9 and 10, respectively). This is because the unit catalyst and substrate used for the catalytic reaction at 8.57 mmol% forms a saturated state. Hence, further research was conducted under 8.57 mmol% catalyst loading. The reaction temperature was also investigated, at 80 and 90 °C for 225 min the conversion is only 73.84% and 80.00%, respectively, and further increasing the reaction temperature to 100 °C promotes a remarkable increase in the reaction rate producing 91% conversion (entries 3, 5 and 6).
Optimization of the hydrosilylation conversion of APEGa.
| Entry | Catalyst | Catalyst amount (mmol%) | Temperature (°C) | Time (min) | Conv. (%) |
|---|---|---|---|---|---|
| 1 | SBA-15 | — | 100 | 225 | 3.52 |
| 2 | SBA-APTE-SA | — | 100 | 225 | 4.69 |
| 3 | 1.5% Ptδ+/SBA-APTE-SA | 8.21 | 80 | 225 | 73.84 |
| 4 | 1.5% Ptδ+/SBA-APTE-SA | 8.21 | 90 | 225 | 80.00 |
| 5 | 1.5% Ptδ+/SBA-APTE-SA | 8.21 | 100 | 225 | 91.04 |
| 6 | 1.5% Ptδ+/SBA-APTE-SA | 8.21 | 110 | 225 | 91.52 |
| 7 | 1% Ptδ+/SBA-APTE-SA | 8.21 | 100 | 225 | 84.10 |
| 8 | 2% Ptδ+/SBA-APTE-SA | 8.21 | 100 | 225 | 91.38 |
| 9 | 1.5% Ptδ+/SBA-APTE-SA | 6.15 | 100 | 225 | 85.73 |
| 10 | 1.5% Ptδ+/SBA-APTE-SA | 10.26 | 100 | 225 | 90.22 |
Reaction condition: MDHM = 0.02 mol, APEG = 0.02 mol.  n0 = 20.0 mmol. n0 signifies the mole of original Si–H and nt signifies the mole of Si–H after the reaction.
  nMDHM = 0.02 mol.
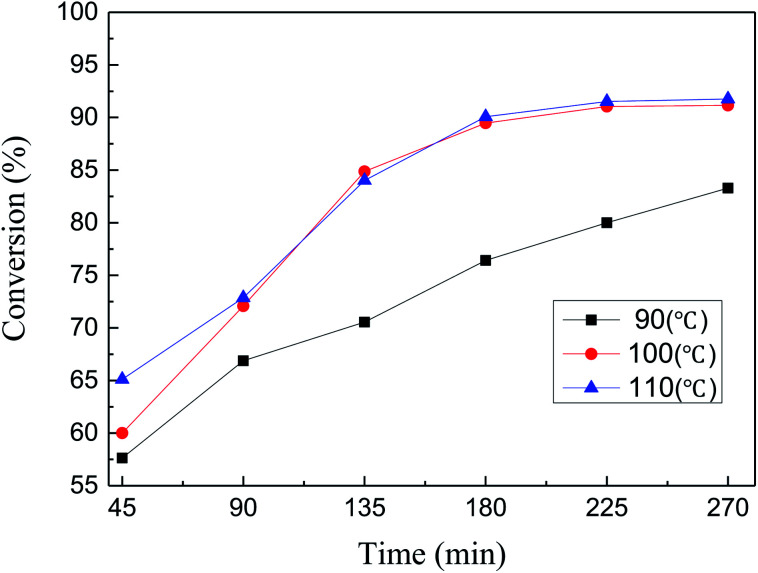
The conversion of MDHM in this catalytic reaction was further studied by taking samples every 45 minutes at 90, 100, and 110 °C. As the reaction time increases, each curve first rises and then begins to stabilize (Fig. 9). MDHM conversion at 100 and 110 °C increase more rapidly over a relatively short time, compared to 90 °C. Although the MDHM conversion at 100 and 110 °C is very close, lower temperature is better for the catalytic reactions. According to the above results, the optimum conversion is achieved at 100 °C (91.04% conversion).
Fig. 9. Effect of Ptδ+/SBA-APTE-SA on MDHM conversion at different temperatures (reaction conditions: MDHM, 0.02 mol; APEG, 0.02 mol; catalyst, 20 mg).
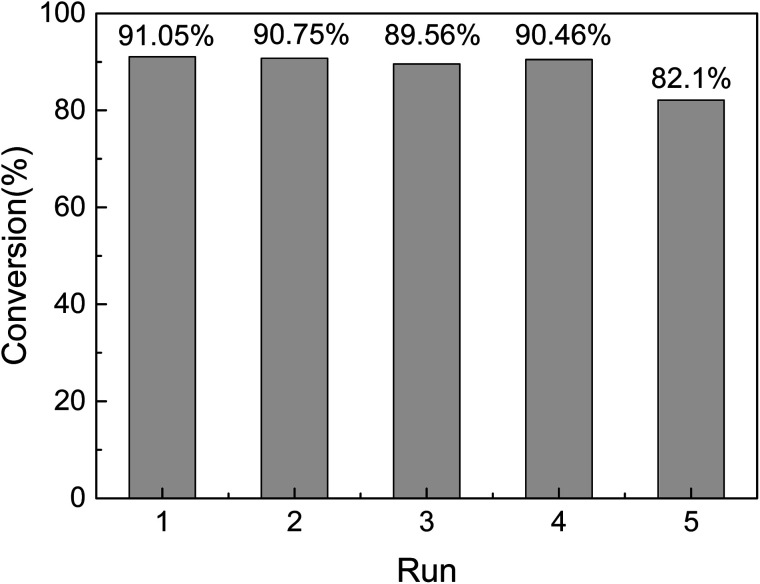
The reusability and stability of heterogeneous catalysts are important for industrial applications and green chemistry. Therefore, it must be easily separated from the reaction solution. In our case a simple centrifugal separation operation is performed, followed by washing with ethanol several times, and then a circulation test after vacuum drying. As shown in Fig. 8, the catalyst is highly stable after a series of continuous runs, and the catalytic activity is maintained at about 82% after 5 cycles (Fig. 10). The catalytic conversion rate decreases after the fifth cycle due to Ptδ+ drop on the surface of mesoporous silica. Finally, in order to explore the versatility of the catalyst, a series of different alkenes were successfully employed in the hydrosilylation reaction under optimal conditions (Table 3). The TON and TOF values were calculated for the reaction by the conversion of the product and amount of catalyst.41 Although the conversion and TON values vary depending on the molecular chain, the catalytic effect is satisfactory.
Fig. 10. Reusability of 1.5% Ptδ+/SBA-APTE-SA in the catalytic hydrosilylation of APEG (reaction conditions: MDHM, 0.02 mol; APEG, 0.02 mol; catalyst, 20 mg; temperature, 100 °C; time, 225 min).
Hydrosilylation of various alkenes and MDHM by Ptδ+/SBA-APTE-SA catalysta.
| Entry | Substrate | Catalyst amount (mmol%) | Temperature (°C) | Time (min) | Conv. (%) | TON | TOF (h−1) |
|---|---|---|---|---|---|---|---|
| 1 | Allyloxy polyethylene glycol (380) | 8.21 | 100 | 225 | 91.04 | 11 835 | 3156 |
| 2 | Acrylic polyethers (200) | 8.21 | 100 | 225 | 95.15 | 12 370 | 3299 |
| 3 | 1-Dodecene | 8.21 | 100 | 225 | 94.19 | 12 245 | 3265 |
| 4 | 1-Tetradecene | 8.21 | 100 | 225 | 90.54 | 11 770 | 3139 |
| 5 | Styrene | 8.21 | 100 | 225 | 97.35 | 12 656 | 3375 |
Reaction condition: MDHM = 0.02 mol; MDHM : alkene molar ratio, 1 : 1. 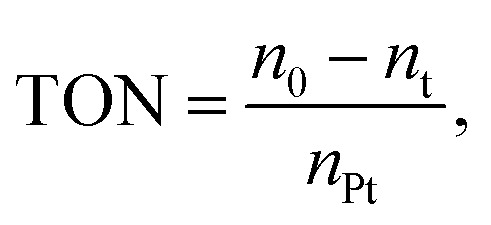 nPt signifies the mole of Pt,
  nMDHM = 0.02 mol.
4. Conclusion
In summary, we have developed a new and heterogeneous catalyst via the encapsulation of Ptδ+ into SBA-15 tunnels modified with APTE and SA. The unexpected properties of Ptδ+/SBA-APTE-SA are attributed to the unique partial valence electron structure and high degree of dispersion of the Pt species. The maximum adduct yield of 91.04% is attained with 8.21 mmol% of catalyst at 90 °C for 225 min. Partially charged Pt acts as a highly catalytic active site for the hydrosilylation of alkenes of SBA-APTE-SA and shows excellent reusability under mild reaction conditions. The catalyst is highly stable, maintaining 82% activity after 5 cycles. The stability of Ptδ+/SBA-APTE-SA reduces the consumption of precious platinum by increasing recycling capabilities, and greatly improving the atomic utilization efficiency in the form of highly dispersed Ptδ+.
Conflicts of interest
There are no conflicts to declare.
Supplementary Material
Acknowledgments
The project was supported by the National Natural Science Foundation of China (No. 21476272), Provincial Department of Agriculture Project of Guangdong [YueCaiNong (2018) 143 to Wenbin Hu] and the Graduate Education Innovation Program (KA180582712).
Electronic supplementary information (ESI) available. See DOI: 10.1039/c9ra09082g
References
- Du X. Zheng H. ACS Catal. 2017;7:1227–1243. doi: 10.1021/acscatal.6b02990. [DOI] [Google Scholar]
- Schuster C. H. Diao T. Pappas I. Chirik P. J. ACS Catal. 2016;6:2632–2636. doi: 10.1021/acscatal.6b00304. [DOI] [Google Scholar]
- Xie Z. Chen W. Chen X. Zhou X. Shu X. RSC Adv. 2019;9:20314–20322. doi: 10.1039/C9RA01408J. [DOI] [PMC free article] [PubMed] [Google Scholar]
- Shao D. Li Y. RSC Adv. 2018;8:20379–20393. doi: 10.1039/C8RA01828F. [DOI] [PMC free article] [PubMed] [Google Scholar]
- Bailly B. A. F. L. Thomas S. P. RSC Adv. 2011;1:1435–1445. doi: 10.1039/C1RA00476J. [DOI] [Google Scholar]
- Dongjie P. Yanlu Z. Xiaoyong D. Lei Z. Xuebing L. Walter M. D. Zheng H. J. Am. Chem. Soc. 2013;135:19154–19166. doi: 10.1021/ja404963f. [DOI] [PubMed] [Google Scholar]
- Speier J. L. Webster J. A. Barnes G. H. J. Am. Chem. Soc. 1957;79:974–979. doi: 10.1021/ja01561a054. [DOI] [Google Scholar]
- Lewis L. N. Stein J. Gao Y. Colborn R. E. Hutchins G. J. Organomet. Chem. 1996;521:221–227. doi: 10.1016/0022-328X(96)06247-X. [DOI] [Google Scholar]
- Rostamnia S. Morsali A. RSC Adv. 2014;4:10514–10518. doi: 10.1039/C3RA46709K. [DOI] [Google Scholar]
- Brahmachari G. Laskar S. Barik P. RSC Adv. 2013;3:14245–14253. doi: 10.1039/C3RA41457D. [DOI] [Google Scholar]
- Xin Z. Royer S. Hui Z. Huang Q. Xiang L. Valange S. Barrault J. Sep. Purif. Technol. 2011;80:163–171. doi: 10.1016/j.seppur.2011.04.024. [DOI] [Google Scholar]
- Mukherjee A. Milstein D. ACS Catal. 2018;8:11435–11469. doi: 10.1021/acscatal.8b02869. [DOI] [Google Scholar]
- Hudson R. Li C. J. Moores A. Green Chem. 2012;14:622. doi: 10.1039/C2GC16421C. [DOI] [Google Scholar]
- Ghaffar T. Adrian P. W. J. Mol. Catal. A: Chem. 2000;160:249–261. doi: 10.1016/S1381-1169(00)00253-3. [DOI] [Google Scholar]
- Siddiki S. M. Touchy A. S. Kon K. Shimizu K. I. Chemistry. 2016;22:6111–6119. doi: 10.1002/chem.201505109. [DOI] [PubMed] [Google Scholar]
- Chakraborty S. Colón Y. J. Snurr R. Q. Nguyen S. T. Chem. Sci. 2014;6:384–389. doi: 10.1039/C4SC02502D. [DOI] [PMC free article] [PubMed] [Google Scholar]
- Jang K. S. Kim H. J. Johnson J. R. Kim W. G. Koros W. J. Jones C. W. Nair S. Chem. Mater. 2011;23:3025–3028. doi: 10.1021/cm200939d. [DOI] [Google Scholar]
- Pengcheng X. Haitao Y. Xinxin L. Anal. Chem. 2011;83:3448–3454. doi: 10.1021/ac200015c. [DOI] [PubMed] [Google Scholar]
- Pal N. RSC Adv. 2014;4:9213–9222. doi: 10.1039/C3RA47464J. [DOI] [Google Scholar]
- Feng J. Heinz F. Chem. Commun. 2010;46:2920–2922. doi: 10.1039/B921820C. [DOI] [PubMed] [Google Scholar]
- Xu Y. Dan C. Liao S. Song H. Li Y. Fu Z. Su Y. J. Catal. 2012;291:36–43. doi: 10.1016/j.jcat.2012.04.013. [DOI] [Google Scholar]
- Liu Y. Liu Z. Gao J. Dai J. Han J. Wang Y. Xie J. Yan Y. J. Hazard. Mater. 2011;186:197–205. doi: 10.1016/j.jhazmat.2010.10.105. [DOI] [PubMed] [Google Scholar]
- Sanz R. Calleja G. Arencibia A. Sanz-Pérez E. S. Appl. Surf. Sci. 2010;256:5323–5328. doi: 10.1016/j.apsusc.2009.12.070. [DOI] [Google Scholar]
- Zhu J. Kailasam K. Xiao X. Schomaecker R. Thomas A. Chem. Mater. 2011;23:2062–2067. doi: 10.1021/cm1028639. [DOI] [Google Scholar]
- Sanjini N. S. Velmathi S. RSC Adv. 2014;4:15381–15388. doi: 10.1039/C3RA46303F. [DOI] [Google Scholar]
- Ye Z. Shi H. Shen H. Phosphorus, Sulfur Silicon Relat. Elem. 2015;190:1621–1631. doi: 10.1080/10426507.2015.1012202. [DOI] [Google Scholar]
- Xie H. Yue H. Zhang W. Hu W. Zhou X. Prinsen P. Luque R. Catal. Commun. 2018;104:118–122. doi: 10.1016/j.catcom.2017.09.025. [DOI] [Google Scholar]
- Dongyuan Z. Qisheng H. Jianglin F. Chmelka B. F. Stucky G. D. J. Am. Chem. Soc. 1998;136:6024–6036. [Google Scholar]
- Chang H. Y. Jang J. Wu K. C. W. Green Chem. 2011;13:2844. doi: 10.1039/C1GC15563F. [DOI] [Google Scholar]
- Jiang Q. Wu Z. Y. Wang Y. M. Cao Y. Zhou C. F. Zhu J. H. J. Mater. Chem. 2006;16:1536–1542. doi: 10.1039/B516061H. [DOI] [Google Scholar]
- Zhao D. Feng J. Huo Q. Melosh N. Fredrickson G. H. Chmelka B. F. Stucky G. D. Science. 1998;279:548–552. doi: 10.1126/science.279.5350.548. [DOI] [PubMed] [Google Scholar]
- Singh A. P. Prabhakaran V. Lazar A. New J. Chem. 2016;40:2423–2432. doi: 10.1039/C5NJ02686E. [DOI] [Google Scholar]
- Yang C. M. Liu P. H. Ho Y. F. Chiu C. Y. Chao K. J. Chem. Mater. 2003;15:275–280. doi: 10.1021/cm020822q. [DOI] [Google Scholar]
- Zhuqing W. Min W. Genhua W. Dayu W. Aiguo W. Dalton Trans. 2014;43:8461–8468. doi: 10.1039/C3DT53641F. [DOI] [PubMed] [Google Scholar]
- Kundu S. K. John M. Asim B. Dalton Trans. 2013;42:10515–10524. doi: 10.1039/C3DT50947H. [DOI] [PubMed] [Google Scholar]
- Rouquerol J., Rouquerol F., Llewellyn P., Maurin G., Sing K., Rouquerol J., Rouquerol F., Llewellyn P., Maurin G. and Sing K., Adsorption by Powders and Porous Solids, 2014 [Google Scholar]
- Pourdayhimi P. Pei W. K. Salleh M. M. Nur H. Lee S. L. Aust. J. Chem. 2016;69:790–797. doi: 10.1071/CH15495. [DOI] [Google Scholar]
- Kruk M. Jaroniec M. Chem. Mater. 2001;13:3169–3183. doi: 10.1021/cm0101069. [DOI] [Google Scholar]
- Yang C. M. Zibrowius B. Schmidt W. Schüth F. Chem. Mater. 2003;15:3739–3741. doi: 10.1021/cm031109j. [DOI] [Google Scholar]
- Zhao D. Feng J. Huo Q. Melosh N. Fredrickson G. H. Chmelka B. F. Stucky G. D. Science. 1998;279:548–552. doi: 10.1126/science.279.5350.548. [DOI] [PubMed] [Google Scholar]
- Fairlamb I. J. Kapdi A. R. Lee A. F. Sánchez G. López G. Serrano J. L. García L. Pérez J. Pérez E. Dalton Trans. 2004;23:3970–3981. doi: 10.1039/B413886D. [DOI] [PubMed] [Google Scholar]


