Abstract
Electroplating sludge (ES), a byproduct of the electroplating industry, is considered as hazardous waste because of the presence of several kinds of toxic heavy metals (HMs, i.e., Cr, Ni, Cu and Zn). The improper treatment of ES has resulted in the contamination of the environment and is ultimately harmful to the living biota. Solidification/stabilization is regarded as a promising technique to deal with hazardous wastes with the use of a geopolymer, an excellent material, in this technique. In this research, ES was solidified using fly ash (FA) and ordinary Portland cement together so that non-burnt bricks (NBBs) could be prepared. The risk assessment of these bricks was carried out in a homemade experimental device by simulating rainfall. The results showed that the compressive strength of NBBs was up to 15 MPa; hence, it could be used for construction purposes. The hazard quotient (HQ) of HMs (including Zn, Ni and Cu) was much less than the limit value, while both the HQ and cancer risk of Cr were over the corresponding limit values.
Electroplating sludge was solidified in alkali activated fly ash to prepare non-burnt bricks, and their risk to humans was assessed.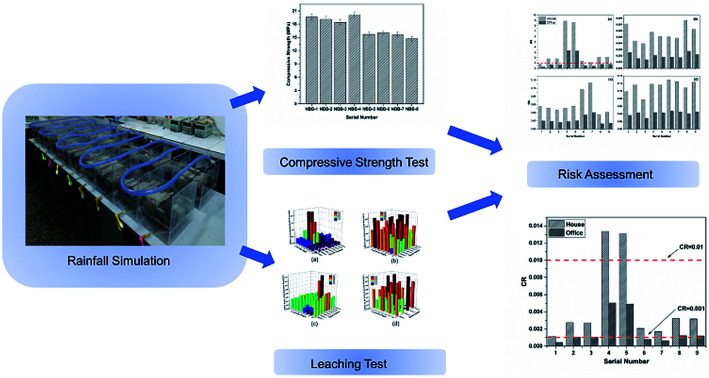
1. Introduction
Conventional methods, namely, flocculation, precipitation and filtration used for the treatment of wastewater from the electroplating industry result in the generation of solid hazardous waste called electroplating sludge (ES) or galvanic sludge waste (GSW).1,2 The toxicity of ES is due to the presence of heavy metals (HMs) such as Cr, Zn, Cu and Ni, which can contaminate the ecosystem and ultimately the living biota.3 In this scenario, ES management is a global concern that needs to be properly addressed.
Generally, some technologies including recycling and reuse, thermal treatment, and solidification/stabilization are used for the treatment of ES.4–6 The former two treatment methods cause secondary pollution and thermal treatment also consumes a lot of heat energy.5,7,8 In contrast, solidification/stabilization is not only an effective technique to cope with various kinds of the waste but also an economical method.9–11 This technique utilizes the different nature of cementitious materials, namely, Ordinary Portland Cement (OPC) and geopolymer to solidify wastes and HMs.
Alkali activators are used to activate the cementitious activity of the raw materials (containing Si, Al and Ca), such as fly ash (FA), clay, metakaolin and blast furnace slag (BFS), for the preparation of geopolymers. FA is a major solid waste from the coal-fired power plants, and mainly contains SiO2, Al2O3 and Fe2O3; hence, it is often served as a profitable substituent in the concrete trade.12–14 The dissolution, rearrangement, gelation and crystallization are sequence-wise steps involved in a geopolymerization process.15–17 In addition, geopolymers usually have lower CO2 emission, lower-cost raw materials, simpler preparation process, more energy-saving ability, much better chemical corrosion resistance and more effective immobilization of toxic HMs when compared with Ordinary Portland Cement (OPC).11,18–23 The addition of OPC is beneficial for the compressive strength development of fly ash geopolymers under ambient conditions, which is supported by some studies.24–28
According to the literature, several scientists have used geopolymers for the solidification of ES.29–33 According to Asavapisit and Chotklang, the leaching of Pb, Cd and Cu was in safe limits during solidification through fly ash-based geopolymers, but Cr had exceeded the critical limit when ES contents were >20%.29 Moreover, the compressive strength was reduced as compared to the control samples. In another study, Piyapanuwat and Asavapisit had used black rice husk ash (BHA) to immobilize Zn and Cr; both metals were in the safe limits during the leaching experiment and solidified bodies could be subjected to the landfill.31 Similarly, Zhang et al. also found that the mechanical and physical properties of the clay bricks were greatly influenced by the substitution of ES.33 Moreover, they stated that the ES content should be <8% in clay bricks to obtain eco-friendly bricks. However, a limited number of studies were carried out in the past to solidify the ES into non-burnt bricks (NBB) and assess them under long-term rainfall. Hence, the present study was aimed at the disposal of ES in NBBs, and their evaluation was carried out under long-term rainfall (a homemade artificial system was introduced for this purpose). The risk assessment of these bricks was mainly decided by the hazard quotient (HQ) of Zn, Ni and Cu and Cr and cancer risk (CR) of Cr, which were calculated according to RBCA. X-ray diffraction (XRD) analysis and scanning electron microscopy (SEM) were used to further explain the mechanism of the immobilization of HMs.
2. Materials and methods
2.1. Materials
Fly ash (FA) used for the preparation of geopolymers and electroplating sludge (ES) was brought from the Long Jian Metal Company, Chongqing Municipality, China. Ordinary Portland Cement (OPC) used in the experiment was fetched from a cement plant situated in Chongqing Municipality, China. The chemical compositions of FA, OPC and ES (before and after the recovery processing) are shown in Table 1, which were determined by X-ray fluorescence (XRF).
The chemical composition of the raw materials (wt%).
| Composition | Raw materials | |||||
|---|---|---|---|---|---|---|
| FA | OPC | ES-B1 | ES-B2 | ES-A1 | ES-A2 | |
| SiO2 | 49.74 | 17.72 | 3.04 | 4.15 | 11.46 | 11.36 |
| Al2O3 | 27.21 | 3.36 | 2.25 | 2.66 | 2.84 | 4.04 |
| Fe2O3 | 10.78 | 2.79 | 12.05 | 15.87 | 2.32 | 1.99 |
| CaO | 3.38 | 68.78 | 14.29 | 14.27 | 64.20 | 37.40 |
| TiO2 | 3.18 | 0.38 | — | — | 0.67 | 0.96 |
| Na2O | 1.46 | — | — | — | 0.17 | — |
| SO3 | 1.41 | 3.46 | 4.99 | 3.99 | 14.71 | 40.32 |
| K2O | 1.23 | 1.16 | 0.070 | 0.088 | 0.29 | 0.16 |
| MgO | 0.71 | 1.57 | 4.95 | 2.97 | 1.71 | — |
| Cr2O3 | — | — | 23.74 | 21.23 | 0.43 | 1.11 |
| NiO | — | — | 18.51 | 12.12 | 0.08 | 0.20 |
| P2O5 | — | 0.05 | 9.85 | 9.57 | 0.24 | 0.54 |
| ZnO | — | — | 2.96 | 10.68 | — | — |
| CuO | — | — | 0.71 | 0.62 | 0.03 | 0.05 |
| Cl | — | — | 0.48 | 1.26 | — | — |
Sodium silicate (Na2SiO3·9H2O) and sodium hydroxide (NaOH, 99% purity) were used as alkali activators to activate the pozzolanic activity of FA binder for solidification of ES.
2.2. Experimental device
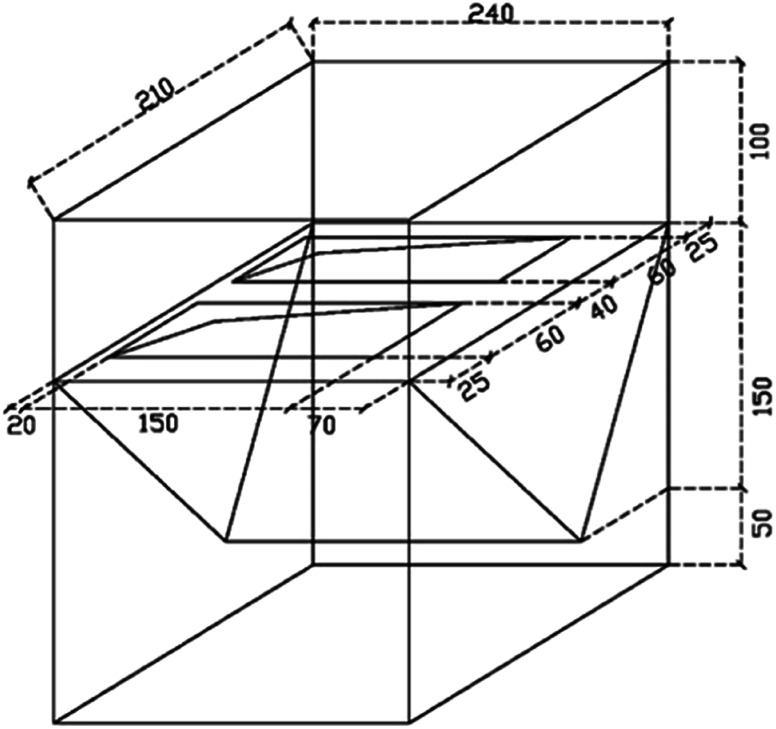
A homemade experimental device having a dimension of 240 mm × 210 mm × 300 mm was used to simulate the rainfall (Fig. 1). Two bricks (200 mm × 100 mm × 55 mm) could be placed in each device.
Fig. 1. The design of an experimental rainfall-simulation device.
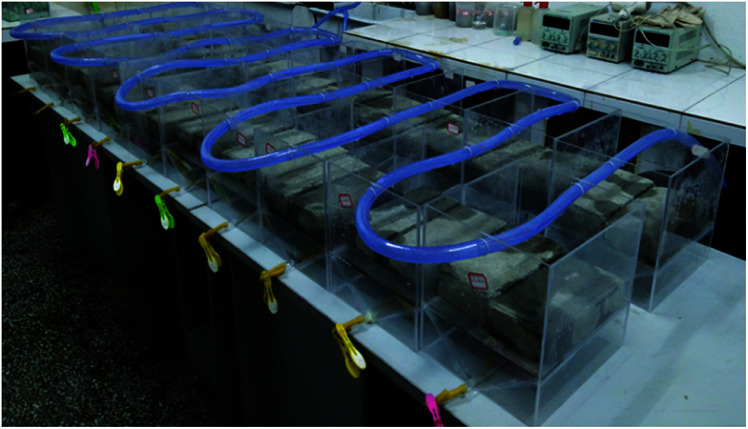
The rainfall was stimulated through perforated nylon braided flexible PVC hoses which were passed through the experimental setup device (Fig. 2). While water outlet was made to replace the water. The tap water was used for rainfall purposes.
Fig. 2. Experimental rainfall simulation device in operation.
2.3. Experimental method
2.3.1. Preparation of NBB
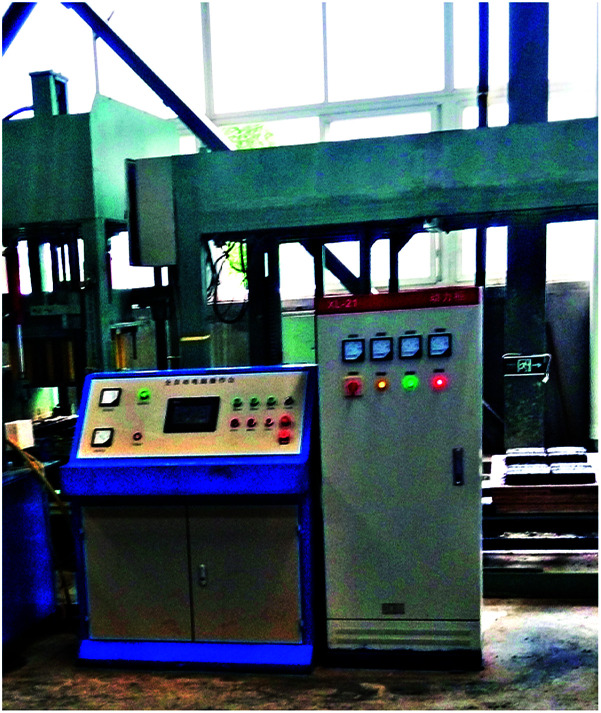
Basically, five components, namely, ES, FA, OPC, fine stone and sand were mixed in a mass ratio of 8 : 6 : 5 : 4 : 1 and then, NaOH and Na2SiO3 were added to the mixture (mass ratios of the alkali activators to FA were 1 : 75 and 1 : 30, respectively) and appropriate amount of water (liquid/solid = 0.30) was added afterward. The NBB production unit is presented in Fig. 3. Finally, these bricks were kept in ambient conditions for 28 d.
Fig. 3. The NBB machine and NBBs.
2.3.2. Assessment system of ES and NBB
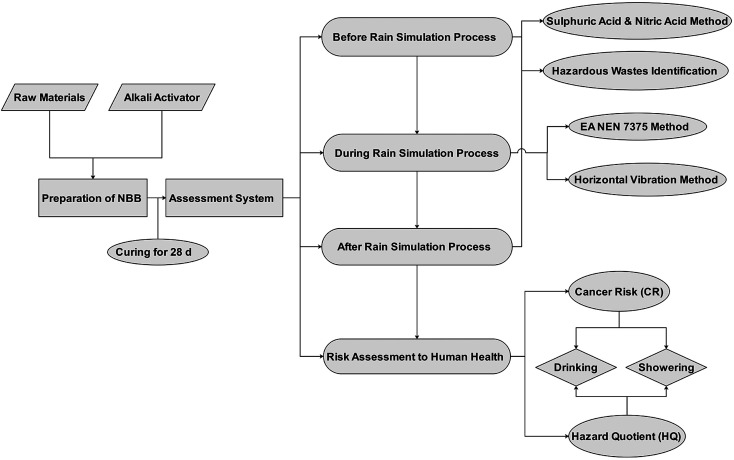
The risk assessment mainly includes 4 parts:
(a) Pollution characteristic identification of waste residue and NBBs before the rainfall simulation process (after 28 days of NBB synthesis).
(b) Pollution characteristic identification of NBBs during the rainfall simulation process at different time intervals (Table 2).
The timetable for liquid extraction.
| Leaching stage | Interval time/h | Cumulative time/d |
|---|---|---|
| 1 | 6 | 0.25 |
| 2 | 18 | 1 |
| 3 | 30 | 2.25 |
| 4 | 42 | 4 |
| 5 | 120 | 9 |
| 6 | 168 | 16 |
| 7 | 480 | 36 |
| 8 | 672 | 64 |
(c) Pollution characteristic identification of NBBs after the rainfall simulation process (after 64 days).
(d) Risk assessment to human health.
Regarding the risk assessment methodology, ‘solid waste-extraction procedure for leaching toxicity-sulphuric acid & nitric acid method’ (HJ/T 299-2007) and ‘identification standards for hazardous wastes-identification for extraction toxicity’ (GB 5085.3-2007) were used to determine the leaching concentrations of HMs in part (a) (before the rainfall simulation) and part (c) (after the rainfall simulation).34,35 While, ‘solid waste-extraction procedure for leaching toxicity-horizontal vibration method’ (HJ 557-2010) was used during the rainfall simulation process (part (b)) to determine the leaching toxicity.36 In addition, liquid extracts at different time intervals (Table 2) were collected according to NEN 7375.37 Regarding part (d), the risk assessment to human health was analysed through a risk-based corrective action (RBCA) which is based on two indictors, i.e., a hazard quotient (HQ) and carcinogenic risk (CR). The human body was exposed to the risk of drinking and showering water.38,39 The following calculations were used to analyse the results:
I. Risk assessment through drinking water
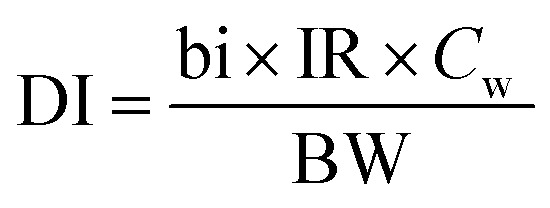
It considers the daily intake of drinking water and calculations are made defined by the American Petroleum Institute (API) and the formula is given below:
 |
1 |
The DI is the daily intake (mg kg−1 d−1) into the body via ‘drinking’. The IR indicates the average drinking water (L d−1) on a daily basis. Cw represents the concentration of contaminants in drinking water (mg L−1). BW and bi are the body weight (kg) and body absorption (mg mg−1), respectively, calculated within 100% of the conservative value.
II. Risk assessment through ‘showering’
The intake of showering water through the skin contact also poses a threat to human health. According to API, it is calculated through the formula that is given below:
 |
2 |
D abs indicates the daily absorption (mg kg−1 d−1) into the body via ‘skin contact’ during showering. Cw and SA are the concentrations of the contaminants in the groundwater (mg L−1) and the total skin area exposed (cm2), respectively. SPC: the skin permeability coefficient (cm h−1) is represented by SPC. ET and BW are the exposure time during showering (h per day) and body weight (kg). While 10−3 is the unit conversion (L cm−3).
III. Risk-based corrective action (RBCA)
According to the United States Environmental Protection Agency (US EPA), the RBCA model classifies the chemical substances into two categories, i.e., carcinogens and non-carcinogens. The cancer risk (CR) is used for the analysis of carcinogens. Whereas, 10−6 and 10−4 are the lower and upper acceptable cancer limits. The hazard quotient (HQ) is used for the analysis of non-carcinogenic substances and its criteria are set to 1. If HQ value is less than 1 then it is safe, otherwise, it is hazardous.39
The HQ formula for non-carcinogens is as follows:
 |
3 |
The CR formula for carcinogens is as follows:
 |
4 |
In the above formulas, the exposure frequency (mg d−1) is EF. The ED is the exposure duration (d). IR represents the intake ratio. BW is the body weight (kg). AT is the average time (d). The RfD is a reference dose (mg (kg d)−1), and SF is a carcinogenic slope factor ([mg (kg d)−1]−1).
The preparation of NBBs and assessment of ES and NBB processes are shown in Fig. 4.
Fig. 4. The main experimental flowchart.
2.3.3. Characterization
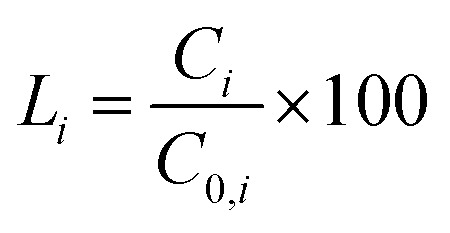
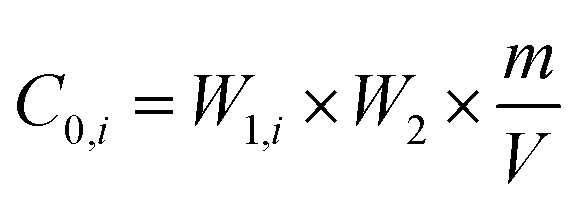
The phase analysis was performed through XRD (PANalytical X'Pert Powder, Holland) with CuKα radiation (λ = 1.54060 nm). The specimens were step-scanned as random powder mounts from 5° to 90° with step 0.026°. Subsequently, MDI jade 6.0 software was used to interpret the characteristic peaks. Morphology observations were performed by SEM (Tescan, Mira3 LMH) at an accelerating voltage of 15 kV. The compressive strengths of the samples (28 d curing time) were determined by a universal testing machine (AGN-250, Shimadzu, Japan), which was operated at a speed of 0.1 mm min−1. The concentrations of HMs (Cr, Zn, Cu, and Ni) were determined through a flame atomic absorption spectrometer (FAAS) by following GB 5085.3-2007 standards. Moreover, the leaching percentage of HMs was another way to evaluate the immobilization efficiency;22 % leaching of HMs was determined by the following formulae:
 |
5 |
 |
6 |
In these formulae, Li is the % leaching of HMs (1 ≤ i ≤ 4, which represents Cr, Zn, Cu, Ni respectively). C0,i (assuming 100% leaching) and Ci (leaching test result) are the leaching concentrations of HMs in the solidified bodies (mg L−1). W1,i is the mass ratio of HMs in ES, and W2 is the mass ratio of ES in solidified bodies (%). The term “m” refers to the mass of solidified bodies (mg). V is the volume of leaching extraction liquid (L).
3. Results and discussion
3.1. The chemical composition of raw materials
The chemical composition of FA, OPC and ES are presented in Table 1. The main chemical components of FA were SiO2, Al2O3 and Fe2O3, making up approximately 88% of this material. Moreover, 86.50% of OPC was composed of CaO and SiO2. ES-B1 and ES-B2 are the compositions of electroplating sludge before being subjected to the recovery process of elements, while ES-A1 and ES-A2 are the compositions after the recovery process. The concentrations of HMs (Cr, Ni, and Zn) were higher in ES-B. Moreover, the ES-B1 and ES-B2 were dominated by Cr2O3 with 23.74% and 21.23%, respectively, followed by NiO, CaO and Fe2O3. CaO and SO3 were the main chemical components in ES-A groups and the content of Cr and Ni dropped to a very low level (possibly due to the use of sulphuric acid in some valuable metals' recovery processing).
3.2. The XRD result and analysis
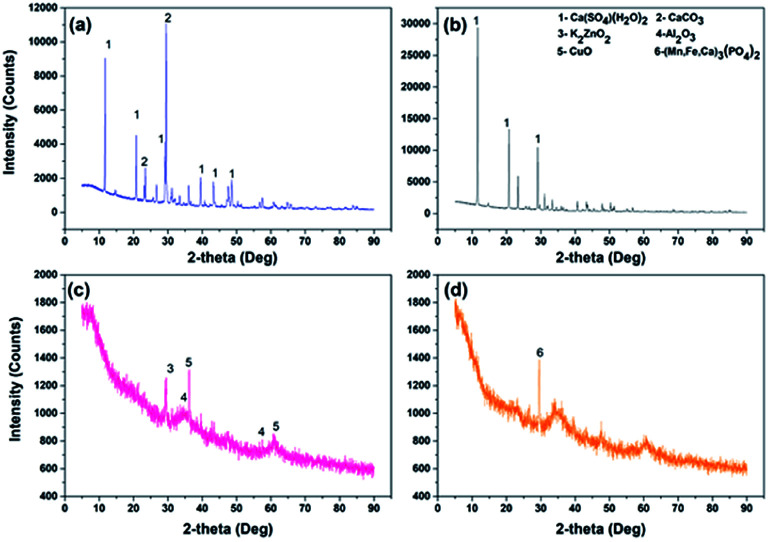
Notable differences were observed in ES-A and ES-B groups (Fig. 5). ES-B was dominated with amorphous phases. Moreover, some peaks corresponding to Al2O3 (PDF: 50-1496), K2ZnO2 (PDF: 76-0733), CuO (PDF: 78-0428) and (Mn, Fe, Ca)3(PO4)2 (PDF: 46-1353) were observed. Regarding ES-A, several sharp peaks corresponding to calcium compounds such as CaCO3 (PDF: 86-0174) and Ca(SO4)(H2O)2 (PDF: 70-0982) were observed, as seen in Fig. 5(a) and (b), and these results were consistent with XRF results (Table 1) which also showed the highest Ca content in ES-A groups.
Fig. 5. The XRD patterns of ES i.e. (a) ES-A1 and (b) ES-A2 (c) ES-B1 (d) ES-B2.
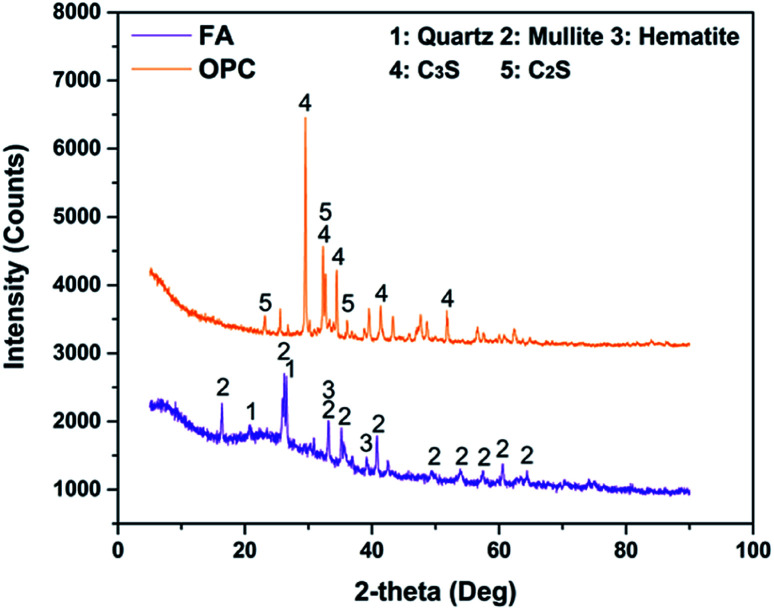
According to Fig. 6, FA exhibited some sharp peaks especially at 15–40° (2θ max, CuKα). In addition, mullite and quartz were principal phases and some phases of hematite were also found. These phases are composed of Si, Al and Fe and the presence of these elements were also verified in the chemical composition analysis (Table 1). While 3CaO·SiO2 (C3S, PDF: 49-0442) and 2CaO·SiO2 (C2S, PDF: 36-0642) were dominant phases in OPC.
Fig. 6. The XRD patterns of FA and OPC.
3.3. The compressive strength analysis
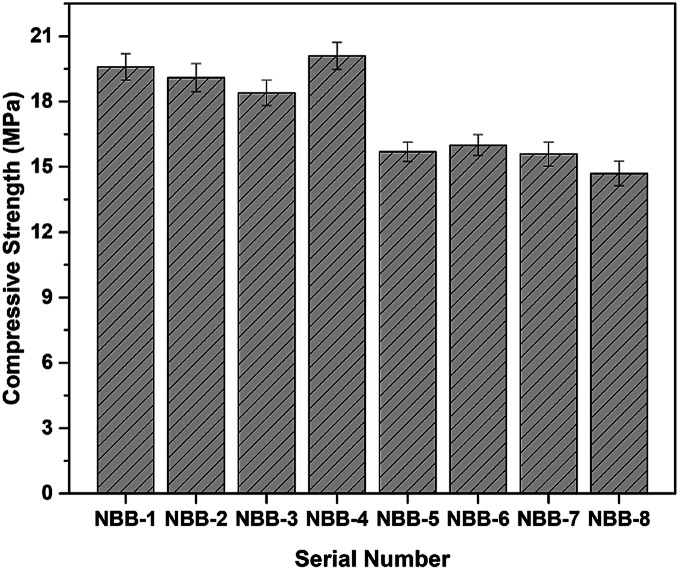
The compressive strengths were about 20 MPa for the 1st four groups (NBB-1 to NBB-4) which was higher than that of the next four groups (NBB-5 to NBB-8) having compressive strengths of 15 MPa (Fig. 7). The lower compressive strengths for the last four groups (ES after the metal recovering process) might be due to an excessive use of the S-containing acid in the extraction process. These results were supported by the chemical composition which indicated that element S in ES used after the metal recovery process (ES-A1 and ES-A2) was much higher than that in ES-B1 and ES-B2. The acids had a negative impact on the geopolymer process and ultimately influenced the compressive strength. Similar results were also found by Lv et al.40 However, the compressive strengths in all the bricks can meet MU 15 according to JC/T 422-2007 (a standard about non-fired rubbish gangue bricks).41
Fig. 7. The compressive strengths of NBB. NBB-1 to 4: bricks made from ES-B, NBB-5 to 8: bricks made from ES-A.
3.4. Microstructures of NBB
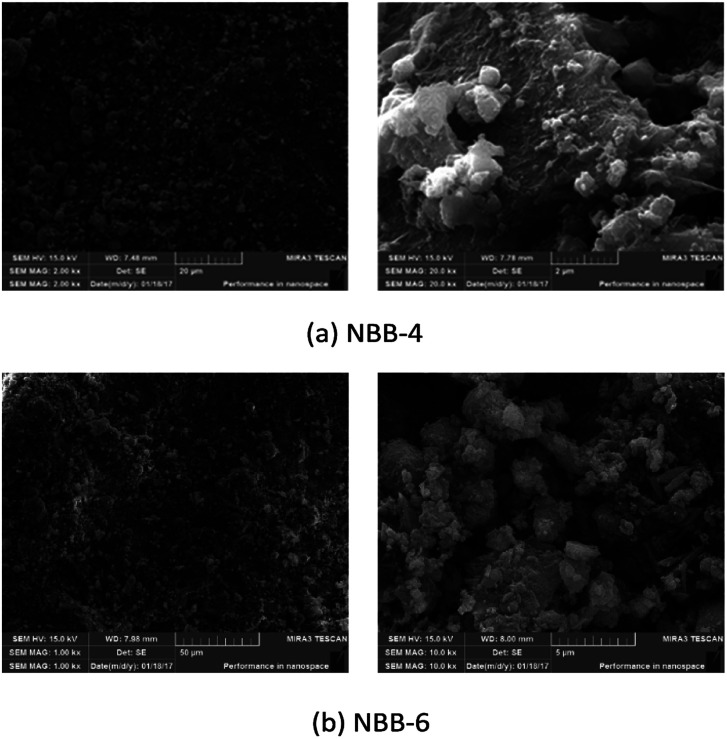
Two representative samples including NBB-4 and NBB-6 were selected for the microstructural analysis.
In Fig. 8(a), on the left side, loose-spherical glass particles could be observed on the surface, which indicates that the polymerization reaction was not complete. In addition, white aggregates in Fig. 8(b), right side, might be the hydrated N-A-S-H gels and C-S-H gels.11,24,28 While, the surface beneath the loose particles was compacted. In the case of NBB-6 (Fig. 8(b)), the abrasions and the loose particles on the surface were more as compared to those in NBB-4. These results explain why the compressive strengths in 1st four groups were higher as compared to those in the last four groups (NBB-5 to NBB-8).
Fig. 8. The microstructures of NBBs after 28 d.
3.5. Leaching and RBCA experiments analysis
3.5.1. Leaching analysis of raw ES
The Cr and Ni levels in ES-B1 and ES-B2 groups were higher than the critical limit defined by GB 5085.3-2007, and Zn & Cu were in the safe limit (Table 3). While, the above-mentioned HMs were lower than the corresponding standard limits in the case of ES-A1 and ES-A2.
Leaching concentrations of HMs from raw ES and corresponding limits.
| Serial number | Cr (mg L−1) | Zn (mg L−1) | Cu (mg L−1) | Ni (mg L−1) |
|---|---|---|---|---|
| ES-B1 | 17.97 | 16.95 | 8.55 | 17.40 |
| ES-B2 | 17.61 | 30.84 | 11.80 | 23.91 |
| ES-A1 | 1.78 | — | 1.24 | 1.33 |
| ES-A2 | 3.25 | — | 2.17 | 3.08 |
| Limitsa | 15 | 100 | 100 | 5 |
Limits in GB 5085.3-2007.
3.5.2. Leaching analysis of NBBs during the rainfall simulation process
I. Solid waste-extraction procedure for leaching toxicity by horizontal vibration method
From Table 4, we can see that all the leaching concentrations of these HMs were low (<0.1 mg L−1). However, when compared to ‘the environmental quality standards for surface water’ (GB 3838-2002),42 the concentrations of Cr in NBB-1, 3, 4 and 7 were higher than those in IV water (0.05 mg L−1), which just meets the V water (<0.1 mg L−1) level. The concentrations of Zn in all NBBs were below the limit value of 1 mg L−1 in II water. The concentrations of Cu in the all samples were much higher than 0.01 mg L−1 (I water) and below 1 mg L−1 (II water). Apparently for Ni, there is no standard limit in surface water. Meanwhile, according to ‘standard for groundwater’ (GB/T 14848-2017),43 the concentrations of Ni were all less than 0.1 mg L−1, which were the standard values in IV water and therefore it could be used in agriculture and industry.
Leaching concentrations and % leaching of HMs from NBBs using a horizontal vibration method and corresponding limits in accordance with GB 3838-2002.
| Serial number | Cr (mg L−1) | Zn (mg L−1) | Cu (mg L−1) | Ni (mg L−1) |
|---|---|---|---|---|
| NBB-1 | 0.060 | 0.064 | 0.071 | 0.044 |
| NBB-2 | 0.016 | 0.078 | 0.075 | 0.056 |
| NBB-3 | 0.080 | 0.076 | 0.079 | 0.064 |
| NBB-4 | 0.069 | 0.077 | 0.081 | 0.070 |
| NBB-5 | 0.032 | — | 0.061 | 0.035 |
| NBB-6 | 0.043 | — | 0.061 | 0.037 |
| NBB-7 | 0.051 | — | 0.065 | 0.044 |
| NBB-8 | 0.046 | — | 0.063 | 0.032 |
| I water* | 0.01 | 0.05 | 0.01 | — |
| II water* | 0.05 | 1 | 1 | — |
| III water* | 0.05 | 1 | 1 | — |
| IV water* | 0.05 | 2 | 1 | — |
| V water* | 0.1 | 2 | 1 | — |
| Serial number | L 1 (%) | L 2 (%) | L 3 (%) | L 4 (%) |
|---|---|---|---|---|
| NBB-1 | 0.0028 | 0.021 | 0.096 | 0.0023 |
| NBB-2 | 0.00076 | 0.025 | 0.10 | 0.0030 |
| NBB-3 | 0.0042 | 0.0068 | 0.12 | 0.0052 |
| NBB-4 | 0.0036 | 0.0069 | 0.13 | 0.57 |
| NBB-5 | 0.084 | — | 2.0 | 0.43 |
| NBB-6 | 0.11 | — | 2.0 | 0.45 |
| NBB-7 | 0.052 | — | 1.3 | 0.22 |
| NBB-8 | 0.047 | — | 1.2 | 0.16 |
The leaching percentages (Li (%)) of HMs were calculated according to eqn (5) and (6). It could be seen that Li (%) of metals have smaller values (<2%) which indicated that HWs were immobilized effectively.
II. Leaching concentration of HMs at different time intervals
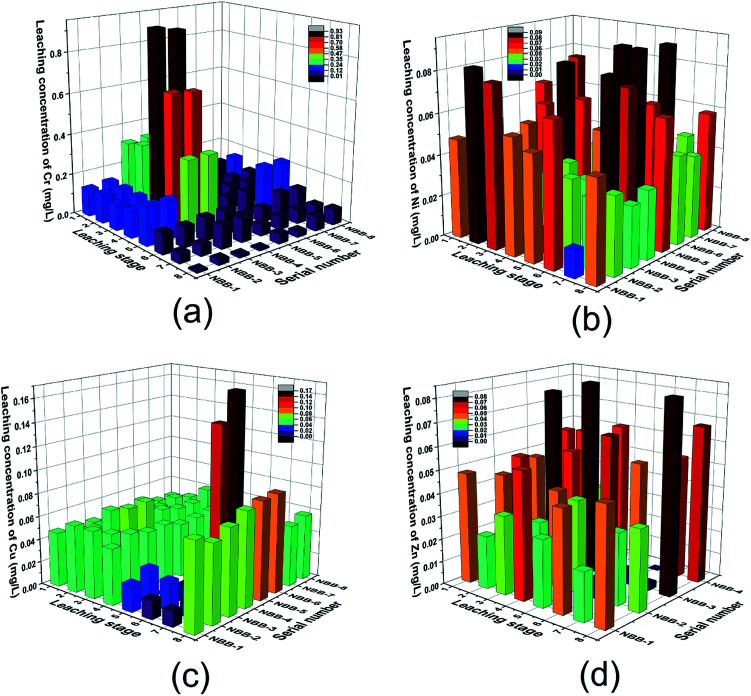
The results of 8 leaching stages of the four kinds of HMs (Cr, Ni, Cu, Zn) are displayed in Fig. 9.
Fig. 9. Leaching concentration of HMs at different leaching stages i.e. (a) Cr, (b) Ni, (c) Cu and (d) Zn.
a. Leaching of Cr
At stages 3 (2.25 d), 4 (4 d) and 5 (9 d), the Cr concentrations were >0.35 mg L−1 in NBB-3 and NBB-4 groups which could be seen in Fig. 9(a). Generally, the Cr concentration decreased with time which indicates that Cr was released from the surface. In addition, polymerization reactions might be proceeding with time and ultimately enhance the Cr solidification in NBB. These results were in agreement with those reported in previous studies.44–46 Pereira et al. also found that fly ash-based geopolymer had a higher solidification efficiency (99.7%) with Cr.45
b. Leaching of Ni
In Fig. 9(b), the leaching concentration of Ni at all the stages and in all the samples were below 0.1 mg L−1. The release pattern of Ni showed some differences with that of Cr. For NBB-1, 2, 3 and 4, the amount of release at the previous stages was higher than that in the later phase. However, the opposite situation happened in NBB-5, 6, 7 and 8. This phenomenon is not hard to explain. In the former groups (NBB-1, 2, 3 and 4), there were more Ni contents; thus, the concentrations were higher at the beginning and then, the Ni content became increasingly less over time. On the contrary, the Ni contents in the latter groups (NBB-5, 6, 7 and 8) were smaller, so the release was slower than that in the former. Besides, this also indicated that the geopolymer cannot effectively solidify Ni in the NBB-5, 6, 7 and 8 groups, which could have a relationship with the recovery process of ES and these negative effects got more obvious over time.
c. Leaching of Cu
As shown in Fig. 9(c), the leaching concentrations of Cu were mostly below 0.06 mg L−1; however, the concentration at stage 6 (16 d) of NBB-5 and 6 were somewhat higher (>0.12 mg L−1). In the first 5 stages, releases of Cu were at a lower level. Following this, particularly at stage 6 and 8 (64 d), the release increased slightly, which indicated that the solidified body showed a poor effect on the long-term stability of solidified Cu. The low-leaching concentrations of Cu indicated that it could be effectively immobilized in FA-based geopolymer, and similar findings were also observed by Asavapisit and Chotklang (the leaching concentration of Cu was below analytical detection limit).29
d. Leaching of Zn
As shown in Fig. 9(d), all the Zn-leaching concentrations were below 0.08 mg L−1. In addition, the leaching concentrations in NBB-3 and 4 were slightly higher than those in NBB-1 and 2, which were in agreement with the higher content of Zn in NBB-3 and 4 (Table 1). Considering the higher content and higher leaching concentrations for ES-B1 and B2 shown in Table 3, the solidification effect was great. Moreover, the solidified effect of Zn in NBBs was much higher than other metals. Li et al. also found that FA has a better immobilization ability on Zn than on Ni as found through the leaching test.47
3.5.3. Leaching test results of NBBs after the using process
Furthermore, after 64 days of leaching by a simulation device (Fig. 2), the bricks were tested by sulphuric acid & nitric acid method (HJ/T 299-2007) to decide whether they were hazardous waste or not; the collected data is shown in Table 5. It was clear that the leaching concentrations of these HMs in all the bricks were much lower compared to the limit values in GB 5085.3-2007. On the other hand, the Li (%) of these HMs were also smaller (<0.66%). These two aspects had verified that the geopolymer had an excellent immobilization efficiency.22 Apart from which, the release of these metal ions in the former 8 leaching stages was also responsible for the above phenomenon.
Leaching concentrations and % leachings of HMs from NBBs after using the process through a sulphuric acid & nitric acid methoda.
| Serial number | Cr (mg L−1) | Zn (mg L−1) | Cu (mg L−1) | Ni (mg L−1) |
|---|---|---|---|---|
| NBB-1 | 0.014 | 0.064 | 0.014 | 0.041 |
| NBB-2 | 0.016 | 0.054 | 0.012 | 0.048 |
| NBB-3 | 0.020 | 0.070 | 0.013 | 0.039 |
| NBB-4 | 0.023 | 0.062 | 0.013 | 0.032 |
| NBB-5 | N. D. | — | N. D. | 0.054 |
| NBB-6 | N. D. | — | N. D. | 0.032 |
| NBB-7 | N. D. | — | N. D. | 0.052 |
| NBB-8 | N. D. | — | N. D. | 0.067 |
| Limitsb | 15 | 100 | 100 | 5 |
N. D.: not detected.
Limits in GB 5085.3-2007.
| Serial number | L 1 (%) | L 2 (%) | L 3 (%) | L 4 (%) |
|---|---|---|---|---|
| NBB-1 | 0.00066 | 0.021 | 0.019 | 0.0022 |
| NBB-2 | 0.00076 | 0.017 | 0.016 | 0.0025 |
| NBB-3 | 0.0011 | 0.0063 | 0.020 | 0.0032 |
| NBB-4 | 0.0012 | 0.0056 | 0.020 | 0.0026 |
| NBB-5 | — | — | — | 0.66 |
| NBB-6 | — | — | — | 0.39 |
| NBB-7 | — | — | — | 0.25 |
| NBB-8 | — | — | — | 0.33 |
The human body exposure basic parameter definition and parameter values.
| Parameter definition | Unit | Values (in the house) | Values (in the office) |
|---|---|---|---|
| Average time for human exposure to carcinogensb | years | 70 | 70 |
| Average time for human exposure to non-carcinogensb | years | 30 | 25 |
| Average human body weightb | kg | 70 | 70 |
| Daily shower time with watera | h per day | 0.12 | 0.12 |
| Annual days of human exposure to non-carcinogensb | days per year | 350 | 250 |
| Human daily drinking volumeb | L per day | 2 | 1 |
| Daily exposure of the human body during bathinga | cm2 | 18 150 | 18 150 |
APIDSS, 1999, recommended values by the American Petroleum Institute.
Recommended reference value for ASTM, Standard Guide for Risk-Based Corrective Action, E 2081-00.
3.5.4. RBCA results and assessment of human health
I. The HQ analysis
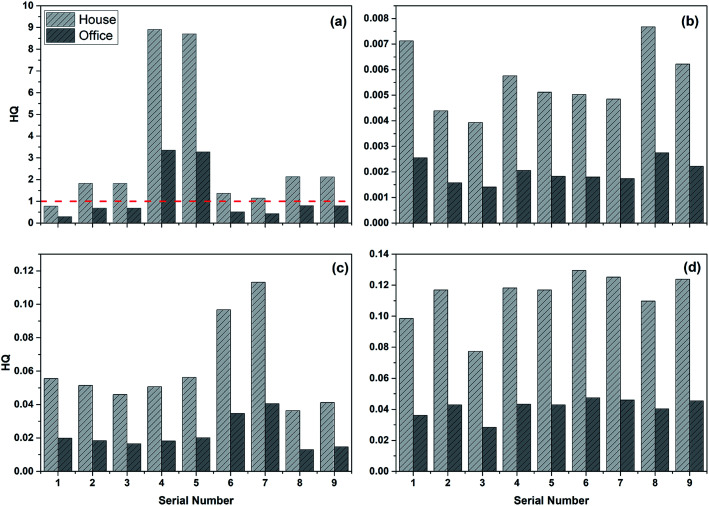
In this part, the samples with highest concentrations of HMs (Cr, Zn, Cu, Ni) obtained through the horizontal oscillation simulation experiment (defined as serial number 1) and in the eight stages of the dynamic simulation test (defined as serial number 2–9) were selected as the corresponding heavy metal concentrations in the groundwater to calculate the HQ for these HMs and CR of Cr in the two locations: a house and office. According to eqn (1)–(3), Tables 6 and 7, the results of HQ were calculated and shown in Fig. 10. From Fig. 10, it is clear that the HQ of Zn, Cu and Ni were all below the limit value “1” in both the house and office, which indicated that the non-carcinogenic risks of Zn, Cu, Ni were acceptable. However, the HQ of Cr was somewhat higher than the other HMs, most of HQ values in the house were over 1. In addition, except for no. 4 and 5, the HQ values of Cr in the office were below 1. In essence, the HQ in house was higher than that in the office, and all HMs' HQ were below 1 and their non-carcinogenic risks could be considered acceptable except for Cr.
Pollutant toxicological parametersa.
| Pollutants | Oral intake | Skin contact | |||
|---|---|---|---|---|---|
| RfD mg (kg d)−1 | SF [mg (kg d)−1]−1 | RfD mg (kg d)−1 | SF [mg (kg d)−1]−1 | SPC cm h−1 | |
| Cr(vi) | 0.003 | 0.5 | 0.000075 | 20 | 0.0013 |
| Zn | 0.3 | — | 0.3 | — | 0.0006 |
| Cu | 0.04 | — | 0.04 | — | 0.001 |
| Ni | 0.02 | — | 0.0008 | — | 0.001 |
ABSgi means ‘gastrointestinal absorption factor’, ABSgi(Cr(vi)) = 0.025; RfDskin = RfDoral × ABSgi; SFskin = RfDoral/ABSgi.
Fig. 10. The HQ of HMs i.e. (a) Cr, (b) Zn, (c) Cu and (d) Ni.
II. The CR analysis
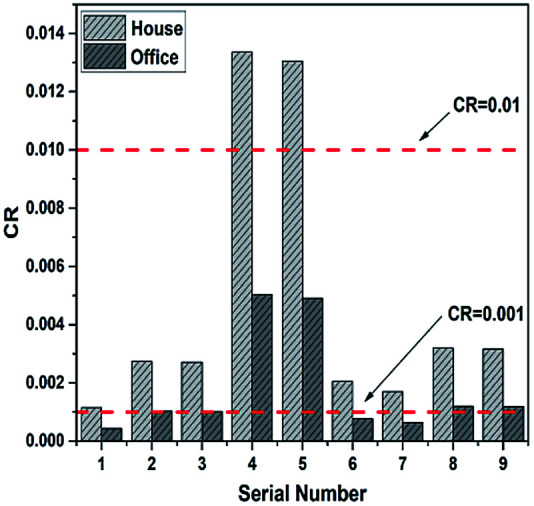
According to eqn (1), (2), (4), Tables 6 and 7, the results of CR were calculated and shown in Fig. 11. As can be seen from Fig. 11, although, most of the CR values of Cr in the office were less than 10−3, the values in the house were somewhat higher, and mainly concentrated in the range 10−3 to 10−2, and the sequence numbers 4 and 5 even exceeded 10−2. In short, the results showed that all values for CR of Cr exceeded the range recommended by the US EPA (10−6 to 10−4) and the limit value according to HJ 25.3-2014 (10−6), so the cancer risk of Cr was unacceptable.
Fig. 11. The CR of Cr.
4. Conclusions
The characteristics and risks of NBBs have been studied and assessed systematically, and the following conclusions were extracted from this study:
(I) From pollution characteristic identification of waste residue and NBBs before the use of the process, Cr, Zn, Cu and Ni were four main HMs in ES, and the leaching concentrations of Cr and Ni surpassed the corresponding limits. NBBs prepared in this experiment conformed to all indexes of the standard and the strength level was MU15. During the process evaluation of NBBs, all leaching concentrations and % leaching of HMs were at a relatively low level (<0.1 mg L−1 and <2%, respectively) using the horizontal vibration method. However, the concentration of Cr just meets that in V water (<0.1 mg L−1). The leaching concentrations of HWs (Cr, Zn, Cu and Ni) in NBBs are all below the corresponding limits after using the process, and % leaching of HMs was below 0.66%.
(II) Through numerous calculations, it has been found that both in the horizontal oscillation experiments and dynamic simulation experiments, the HQs of HMs (Zn, Cu, Ni) were all much lower than the limit value, 1, which indicated that the non-carcinogenic risk is completely acceptable. However, both the carcinogenic and non-carcinogenic risks of Cr were over the limit values; therefore, the risk of Cr is not acceptable.
(III) The results of SEM showed that the geopolymerization reaction leads to the formation of a compact structure. HMs in ES could replace Na+ and Ca2+ ions in N-A-S-H or C-S-H gel. In addition, the low leaching concentrations of HMs in water and aggressive environment both verified that these metals were physically and chemically immobilized effectively.
Conflicts of interest
There are no conflicts to declare.
Supplementary Material
Acknowledgments
This study was sponsored by Natural Science Foundation of Chongqing, China (No. cstc2019jcyj-bshX0028).
References
- Huang R. Huang K. L. Lin Z. Y. Wang J. W. Lin C. T. Kuo Y. M. J. Environ. Manage. 2013;129:586–592. doi: 10.1016/j.jenvman.2013.08.019. [DOI] [PubMed] [Google Scholar]
- Scarazzato T. Panossian Z. Tenorio J. A. S. Perez-Herranz V. Espinosa D. C. R. J. Cleaner Prod. 2017;168:1590–1602. doi: 10.1016/j.jclepro.2017.03.152. [DOI] [Google Scholar]
- Diao B. X., Study on roasted ceramsites mixed with electroplating sludge, PhD thesis, Donghua University, 2008 [Google Scholar]
- Chen M. Zhou J. Z. Zhang J. Zhang J. Chen Z. Ding J. Kong F. H. Qian G. R. Chen J. G. Appl. Catal., A. 2017;534:94–100. doi: 10.1016/j.apcata.2017.01.022. [DOI] [Google Scholar]
- Chou I. C. Wang Y. F. Chang C. P. Wang C. T. Kuo Y. M. J. Hazard. Mater. 2011;185:1522–1527. doi: 10.1016/j.jhazmat.2010.10.079. [DOI] [PubMed] [Google Scholar]
- Mao L. Q. Tang R. Z. Wang Y. C. Guo Y. N. Su P. Zhang W. Y. J. Cleaner Prod. 2018;187:616–624. doi: 10.1016/j.jclepro.2018.03.235. [DOI] [Google Scholar]
- Amrane C. Bouhidel K. E. Hydrometallurgy. 2018;177:34–40. doi: 10.1016/j.hydromet.2018.02.011. [DOI] [Google Scholar]
- Huyen P. T. Dang T. D. Tung M. T. Huyen N. T. T. Green T. A. Roy S. Hydrometallurgy. 2016;164:295–303. doi: 10.1016/j.hydromet.2016.06.028. [DOI] [Google Scholar]
- Huang X. Huang T. Li S. Muhammad F. Xu G. J. Zhao Z. Q. Yu L. Yan Y. J. Li D. W. Jiao B. Ceram. Int. 2016;42:9538–9549. doi: 10.1016/j.ceramint.2016.03.033. [DOI] [Google Scholar]
- Yoon I. H. Moon D. H. Kim K. W. Lee K. Y. Lee J. H. Kim M. G. J. Environ. Manage. 2010;91:2322–2328. doi: 10.1016/j.jenvman.2010.06.018. [DOI] [PubMed] [Google Scholar]
- Xia M. Muhammad F. Zeng L. H. Li S. Huang X. Jiao B. Q. Shiau Y. Li D. W. J. Cleaner Prod. 2019;209:1206–1215. doi: 10.1016/j.jclepro.2018.10.265. [DOI] [Google Scholar]
- Alvarez-Ayuso E. Querol X. Plana F. Alastuey A. Moreno N. Izquierdo M. Font O. Moreno T. Diez S. Vazquez E. Barra M. J. Hazard. Mater. 2008;154:175–183. doi: 10.1016/j.jhazmat.2007.10.008. [DOI] [PubMed] [Google Scholar]
- Hefni Y. Abd El Zaher Y. Wahab M. A. Constr. Build. Mater. 2018;172:728–734. doi: 10.1016/j.conbuildmat.2018.04.021. [DOI] [Google Scholar]
- Liu M. Constr. Build. Mater. 2010;24:1245–1252. doi: 10.1016/j.conbuildmat.2009.12.012. [DOI] [Google Scholar]
- Chindaprasirt P. Jaturapitakkul C. Chalee W. Rattanasak U. Waste Manag. 2009;29:539–543. doi: 10.1016/j.wasman.2008.06.023. [DOI] [PubMed] [Google Scholar]
- Duxson P. Fernandez-Jimenez A. Provis J. L. Lukey G. C. Palomo A. van Deventer J. S. J. J. Mater. Sci. 2007;42:2917–2933. doi: 10.1007/s10853-006-0637-z. [DOI] [Google Scholar]
- Muhammad F. Huang X. Li S. Xia M. Zhang M. L. Liu Q. Hassan M. A. S. Jiao B. Q. Yu L. Li D. W. J. Cleaner Prod. 2018;188:807–815. doi: 10.1016/j.jclepro.2018.04.033. [DOI] [Google Scholar]
- Huang X. Zhuang R. L. Muhammad F. Yu L. Shiau Y. C. Li D. W. Chemosphere. 2017;168:300–308. doi: 10.1016/j.chemosphere.2016.10.067. [DOI] [PubMed] [Google Scholar]
- Lee N. K. Lee H. K. Constr. Build. Mater. 2015;81:303–312. doi: 10.1016/j.conbuildmat.2015.02.022. [DOI] [Google Scholar]
- Santa R. A. A. B. Bernardin A. M. Riella H. G. Kuhnen N. C. J. Cleaner Prod. 2013;57:302–307. doi: 10.1016/j.jclepro.2013.05.017. [DOI] [Google Scholar]
- Luukkonen T. Heponiemi A. Runtti H. Pesonen J. Yliniemi J. Lassi U. Rev. Environ. Sci. Biotechnol. 2019;18:271–297. doi: 10.1007/s11157-019-09494-0. [DOI] [Google Scholar]
- El-Eswed B. I., in Solidification, ed. A. E. Ares, IntechOpen, 2018, pp. 77–110, https://10.5772/intechopen.72299 [Google Scholar]
- Xu Z. H. Jiang Z. Wu D. D. Peng X. Xu Y. H. Li N. Qi Y. J. Li P. Ceram. Int. 2017;43:4434–4439. doi: 10.1016/j.ceramint.2016.12.092. [DOI] [Google Scholar]
- Mehta A. Siddique R. Constr. Build. Mater. 2017;150:792–807. doi: 10.1016/j.conbuildmat.2017.06.067. [DOI] [Google Scholar]
- Moon J. Wang Z. Kim M. O. Chun S. C. Constr. Build. Mater. 2016;122:659–666. doi: 10.1016/j.conbuildmat.2016.06.111. [DOI] [Google Scholar]
- Nath P. Sarker P. K. Cement Concr. Compos. 2015;55:205–214. doi: 10.1016/j.cemconcomp.2014.08.008. [DOI] [Google Scholar]
- Pangdaeng S. Phoo-ngernkham T. Sata V. Chindaprasirt P. Mater. Des. 2014;53:269–274. doi: 10.1016/j.matdes.2013.07.018. [DOI] [Google Scholar]
- Phoo-ngernkham T. Sata V. Hanjitsuwan S. Ridtirud C. Hatanaka S. Chindaprasirt P. Constr. Build. Mater. 2015;98:482–488. doi: 10.1016/j.conbuildmat.2015.08.139. [DOI] [Google Scholar]
- Asavapisit S. Chotklang D. Cement Concr. Res. 2004;34:349–353. doi: 10.1016/j.cemconres.2003.08.012. [DOI] [Google Scholar]
- Perez-Villarejo L. Martinez-Martinez S. Carrasco-Hurtado B. Eliche-Quesada D. Urena-Nieto C. Sanchez-Soto P. J. Appl. Clay Sci. 2015;105:89–99. doi: 10.1016/j.clay.2014.12.022. [DOI] [Google Scholar]
- Piyapanuwat R. Asavapisit S. J. Environ. Manage. 2011;92:2222–2228. doi: 10.1016/j.jenvman.2011.04.004. [DOI] [PubMed] [Google Scholar]
- Silva M. A. R. Mater L. Souza-Sierra M. M. Correa A. X. R. Sperb R. Radetski C. M. J. Hazard. Mater. 2007;147:986–990. doi: 10.1016/j.jhazmat.2007.01.128. [DOI] [PubMed] [Google Scholar]
- Zhang M. T. Chen C. Mao L. Q. Wu Q. Constr. Build. Mater. 2018;159:27–36. doi: 10.1016/j.conbuildmat.2017.10.130. [DOI] [Google Scholar]
- Ministry of Ecology and Environment of the People's Republic of China, Solid waste-extraction procedure for leaching toxicity – sulphuric acid and nitric acid method, HJ/T 299-2007, 2007
- Ministry of Ecology and Environment of the People's Republic of China, Identification standards for hazardous wastes – identification for extraction toxicity, GB 5085.3-2007, 2007
- Ministry of Ecology and Environment of the People's Republic of China, Solid waste-extraction procedure for leaching toxicity-horizontal vibration method, HJ 557-2010, 2010
- Netherlands Normalisation Institute Standard, Leaching characteristics – determination of leaching of inorganic components with the diffusion test, EA NEN 7375:2004, 2004
- Liu J., Study on the release and transfer characteristics of heavy metals in pyrite slag, PhD thesis, Chongqing University, Chongqing, 2012 [Google Scholar]
- Ministry of Ecology and Environment of the People's Republic of China, Technical guidelines for risk assessment of contaminated sites, HJ 25.3-2014, 2014
- Lv Q. F. Jiang L. S. Ma B. Zhao B. H. Huo Z. S. Constr. Build. Mater. 2018;176:68–74. doi: 10.1016/j.conbuildmat.2018.05.013. [DOI] [Google Scholar]
- National Development and Reform Commission of the People's Republic of China, Non-fired rubbish gangue bricks, JC/T 422-2007, 2007
- Ministry of Ecology and Environment of the People's Republic of China, Environmental quality standards for surface water, GB 3838-2002, 2012
- Ministry of Ecology and Environment of the People's Republic of China, Standards for groundwater quality, GB/T 14848-2017, 2017
- Diaz-Loya E. I. Allouche E. N. Eklund S. Joshi A. R. Kupwade-Patil K. Waste Manag. 2012;32:1521–1527. doi: 10.1016/j.wasman.2012.03.030. [DOI] [PubMed] [Google Scholar]
- Pereira C. F. Luna Y. Querol X. Antenucci D. Vale J. Fuel. 2009;88:1185–1193. doi: 10.1016/j.fuel.2008.01.021. [DOI] [Google Scholar]
- Wang Y. G. Han F. L. Mu J. Q. Constr. Build. Mater. 2018;160:818–827. doi: 10.1016/j.conbuildmat.2017.12.006. [DOI] [Google Scholar]
- Li S. Huang X. Muhammad F. Yu L. Xia M. Zhao J. Jiao B. Q. Shiau Y. Li D. W. RSC Adv. 2018;8:32956–32965. doi: 10.1039/C8RA06634E. [DOI] [PMC free article] [PubMed] [Google Scholar]


