Abstract
A label-free quartz crystal microbalance (QCM) biosensor was developed for the selective and real-time estimation of carcinoembryonic antigen (CEA) through the present study. Graphene oxide-Au nanoparticles (GO-AuNPs) was in situ synthesised on the surface of the QCM electrode and the antibody of CEA (monoclonal anti-CEA from mouse) was covalently immobilized on this layer as the bioreceptor for CEA. Mercaptoacetic acid–EDC–NHS reaction mechanism was used for anti-CEA immobilization. The effect of oxygen plasma treatment of the QCM electrode surface before bioreceptor preparation on the performance of the biosensor was tested and was found promising. CEA solutions with various concentrations were analysed using the bioreceptors to estimate the sensitivity and detection limit of the biosensor. The biosensors selectively recognized and captured CEA biomolecules with a detection limit of 0.06 and 0.09 ng mL−1 of CEA for oxygen plasma-treated (E2) and untreated (E1) bioreceptors, respectively. The sensitivity was estimated at 102 and 79 Hz, respectively, for E2 and E1. Clinical serum samples were analysed and the results were found in good agreement with the ELISA analysis. Long term stability was also found to be excellent. Langmuir adsorption isotherm was also conducted using the experimental results.
A label-free quartz crystal microbalance (QCM) biosensor was developed for the selective and real-time estimation of carcinoembryonic antigen (CEA) through the present study.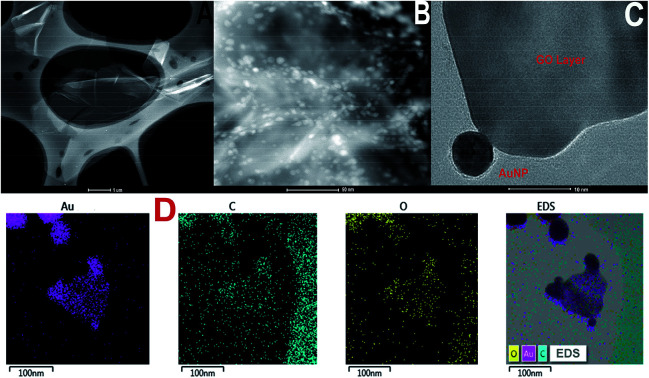
1. Introduction
Abnormally high level of carcinoembryonic antigen (CEA) in the human body is often attributed to the presence of cancer in any of the organs including colon, breast, lungs, gastrointestinal tract, and ovary.1 The average level of CEA in a healthy human body is 5 μg L−1. Any value of CEA higher than 20 μg L−1 is considered as an alarm signal for the presence of tumour cells in the body. The rapid, accurate, and periodical detection of CEA concentration provides helpful information about the stage, progression, and recurrence of cancer.2 A majority of present methods use antigen (analyte) and antibody (the receptor system) based detection strategy with detectors based on colorimetry, fluorescence, chemiluminescence, electrochemistry, surface-enhanced Raman scattering, etc.3,4
However, the sensitivity of many of these devices is a critical issue. Popular methods such as enzyme-linked immunosorbent assay (ELISA), radioimmunoassay, and Raman readouts have potential problems such as low sensitivity, long detection time, safety issues, and reproducibility of the results. Electrochemical methods have been studied extensively but the methods demand complicated labelling process to ensure high sensitivity.5,6 This makes the method labour-intensive and sometimes labelling may also hinder the activity of the biomolecules. In this perspective, label-free, highly sensitive, safe, and real-time analysis of tumour markers is still an active challenge for researchers.
Piezoelectric biosensors such as surface acoustic wave (SAW) sensors and quartz crystal microbalance (QCM) sensors are popular today.7 The QCM sensor is a priority tool for biomolecular analysis because of its unique advantages such as high sensitivity, low response time, easy operation, portable device, cost-effectiveness, and label-free and real-time detection ability.8 The QCM electrode consists of a quartz electrode sandwiched by metal (Au, Al, Ti, etc.) layers for electrical contact. Any mass deposition on the electrode tends to change the frequency response of the crystal. This can be detected by an analyser system with high accuracy.9 The QCM based biosensors are popular for the analysis of DNA molecules,10 proteins,11 cancer diagnosis, tumour marker detection,12 and differentiation between cancerous and normal cells.13 Chen and Tang have presented a QCM-based biosensor for the detection of CEA based on a bioreceptor prepared through non-covalent interactions.14 Yang et al. have described a QCM based CD44 biosensor for the analysis of metastatic potential of breast cancer cells.15 Recently, Uludag and Tothill reported a systematic approach for human serum sample analysis for tumour markers using QCM.16 The detection of E. coli O157: H7 was reported by Yu et al., which also suggested the effectiveness of the QCM tool for the detection of microorganisms.17 Another recent notable investigation in QCM based biosensors was by D. Tang.18 The study illustrated a systematic method for the determination of tumour necrosis factor alpha using a piezoelectric biosensor.
In the present study, a QCM based biosensor was prepared for the detection of CEA with good selectivity, sensitivity, stability, and reproducibility. The immobilization of anti-CEA on the QCM electrode surface is a vital and challenging part of the biosensor fabrication process. This is because the bioreceptor surface needs to act like an active and selective host for the CEA molecules from the analyte sample. This is possible only if we can immobilize a uniform anti-CEA layer on the QCM electrode surface. The study presents a novel method for bioreceptor preparation using a nanomaterial cluster of GO-AuNPs. The GO flakes are proven materials for biosensing as they provide easy transduction of signals from biochemical reactions to electrode outputs.19,20 AuNP can act as a reaction nucleus for the immobilization of anti-CEA by creating a covalent interactions with the sulphur atom of mercaptoacetic acid. A range of CEA concentration from 0.1 ng mL−1 to 120 ng mL−1 was used for immunoassay analysis in the present study. The mass of CEA deposited on the SAM was calculated using modified Souerbrey's equation for liquid state analysis.
2. Experimental
2.1. Materials and instruments
All the chemicals and biological samples including cancer-associated carcinoembryonic antigen (CEA), CEA monoclonal antibody (anti-CEA) produced in mouse, alpha-1-fetoprotein (AFP, Monoclonal Anti-α-Fetoprotein produced in mouse), and l-tryptophan ((S)-2-amino-3-(3-indolyl)propionic acid), bovine serum albumin (BSA, 96–99%), mercaptoacetic acid, ethyl-dimethyl-aminopropyl carbodiimide (EDC), N-hydroxy succinimide (NHS), sodium citrate, HAuCl4·3H2O, and all other common reagents were purchased from Sigma Aldrich, USA. Cancer antigen 125 (CA125, Biotinylated Human CA125/MUC16 Protein, Fc, Avitag) was purchased from Biosystem ACRO, USA. Clinical serum samples were supplied by Second People's Hospital, Shenzhen, China. The samples were collected from the patients who were suspected to be affected by colorectal cancer. A buffer solution with pH 7.4 was prepared using K2HPO4 and KHPO4. BSA solution with the concentration of 10 mg mL−1 was prepared and used. Both the solutions were prepared freshly for each use. The CEA solutions of concentrations in the range of 0.1 ng mL−1 to 100 ng mL−1 were prepared in PBS solution and stored in sterile conditions. The CEA sample obtained was tested for activity using ELISA method.
QCM with impedance measurement (QCM-I, MicroVacuum Ltd, Hungary) with electrode consists of AT cut optically polished circular quartz crystal (15 mm diameter, TiAuTi) was used for the measurements. The basic resonant frequency of the crystal was 5 MHz and the frequency shift of the normalized 5th overtone was used to quantify CEA during immunoassay experiments.
2.2. Electrode pre-treatment and bioreceptor preparation
The QCM electrode crystal was cleaned by sonication in ethanol for 10 minutes. The surface was degreased using piranha solution (1 : 3, H2O2 : H2SO4) for 20 minutes, followed by washing in deionised water (DI water) and ethanol. The surface was then dried at 80 °C in a vacuum oven under nitrogen flow. 0.05 g of GO was taken in a beaker containing 5 mL of DI water. The mixture was heated to 80 °C and 2.50 mL of 10.35 mg mL−1 of sodium citrate was added, followed by addition of 1 mL 5 mg mL−1 aqueous solution of HAuCl4·3H2O. The resulting precursor solution was sonicated for 5 minutes and added to 1 mL of the solution on the QCM electrode surface. The electrode was further incubated in a vacuum oven for 30 minutes at 80 °C under nitrogen atmosphere. The nanoparticle coated electrode was cooled using an ice bath, washed with DI water, followed by ethanol. SEM, TEM, and AFM images of the surfaces were taken to understand the morphology. Further, thioglycolic acid (5 mM) was introduced on the GO-AuNP surface and allowed to react for 2 hours. The surface was washed with ethanol, followed by DI water and dried under nitrogen flow. 2 mL solution mixture of 400 mM EDC and 100 mM NHS (1 : 1 v/v) in methanol was allowed to react with the surface in the next stage. In the next step, the surface was treated with 100 μg mL−1 of capture monoclonal anti-CEA and incubated at 4 °C and 50 ± 5% relative humidity for 12 hours. The concentration of monoclonal anti-CEA was optimized through QCM analysis after immobilization with various concentrations and theoretical calculation of fractional coverage of electrode surface (the results are given in the supportive data, Table S4†). The surface was cleaned with PBS solution and dried under nitrogen flow after the incubation period. The electrode crystals were stored at 4 °C and 50 ± 5% under sterile conditions to avoid any contamination. The bioreceptor surface was characterized using scanning electron microscopy (SEM, Zeiss EVO-MA), atomic force microscopy (Bruker NanoWizard® 4), optical/fluorescence microscopy (Ningbo Sunny Technology Co. Ltd, CX40 Biological optical/fluorescence microscope), and contact angle study (United Test Co., Ltd, CAG100 Contact Angle Goniometer).
Oxygen plasma treatment
The chemically cleaned Au surface using piranha solution was treated with O2 plasma using RGC-100 Series Digital Vacuum Gauge, Agilent Technologies. The power of oxygen plasma and time of exposure were optimized to 120 watts and 10 minutes, respectively. Immediately after the plasma exposure, the surface underwent bioreceptor preparation processes as discussed in the above section. The hypothesis behind oxygen plasma treatment is that ionized oxygen can activate the electrode surface and provide good adhesion with the nanomaterial cluster. The plasma treatment may also provide better effective surface area for the bioreceptor preparation and potential reaction sites as compared with the untreated QCM electrode surface.
2.3. Biosensing using QCM
The frequency shift of each immunoassay run was recorded as a function of response time at an interval of 5 seconds using a data acquisition system connected to a computer with the QCM instrument. The flow rate of the sample for the entire experiment was optimized to 0.05 mL per minute. Newly prepared biosensors were treated with BSA before immunoassay runs to minimize unwanted adsorptions. Fixed volumes of CEA solutions with variable concentrations ranging from 0.1 ng mL−1 to 120 ng mL−1 were allowed to flow through the receptor cell of the QCM instrument till a stable plateau was obtained. At the end of each immunoassay analysis, the bioreceptor was washed with PBS solution. The final average values of equilibrium frequency shift with standard deviation are reported in a previous study.21 After each immunoassay measurement, regeneration of SAM was conducted by running a buffer solution of HCl (0.8 M), KCl (0.06 M), and glycine (0.06 M) for half an hour or till getting a stable plateau. The frequency shift was converted to the amount of CEA deposited on the bioreceptor through calculation using modified Sauerbrey's equation for liquid phase experiments.22–24
3. Results and discussion
3.1. Characterization of nanomaterial coated QCM surface
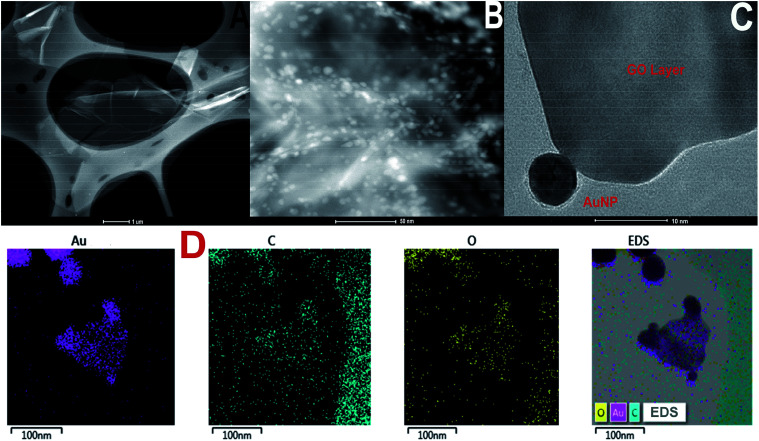
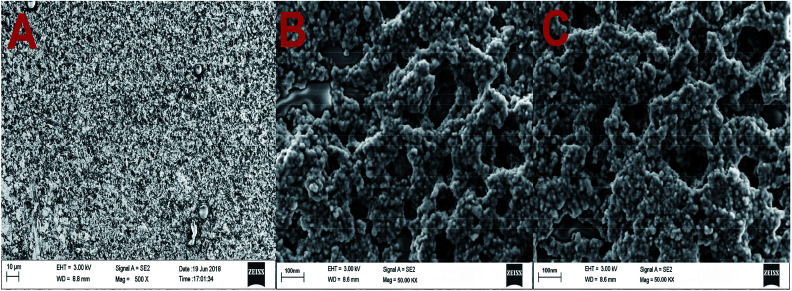
TEM images of GO and GO-AuNP are given in Fig. 1A and B. The 2D single layers of GO prepared through modified Hummer's method are clearly detectable from the TEM images. The separate layers of GO have an average surface dimension of 40 × 60 nm. AuNP of dimension around 5–10 nm were found to be formed on the GO layers as given in Fig. 1B. The brighter spots on the GO layers represent the AuNP. This has been further confirmed by using the SEM images. The SEM figures of GO-AuNP coated QCM electrodes are given in Fig. 2A–C. Fig. 2A represents the surface of piranha treated QCM electrode. Fig. 2B and C represent the GO-AuNP coated surfaces of E1 and E2, respectively. Well formed AuNP on the GO layers are visible within the figures and number density of the particles was found to be better on the E2 electrode than that of E1. The oxygen plasma may enhance the energy state of the Ti coated electrode surface and may provide better adhesion for the nanoparticles during the in situ formation process. This may be the reason for better particle density on the E2 electrode surface.
Fig. 1. (A) TEM of graphene oxide synthesised by modified Hummer's method (B and C) TEM of GO-AuNP synthesised in the present study (D) TEM-EDS elemental mapping of GO-AuNP.
Fig. 2. (A) Surface morphology of piranha treated QCM electrode (B) GO-AuNP synthesised on the QCM electrode E1 and (C) GO-AuNP synthesised on the QCM electrode E2.
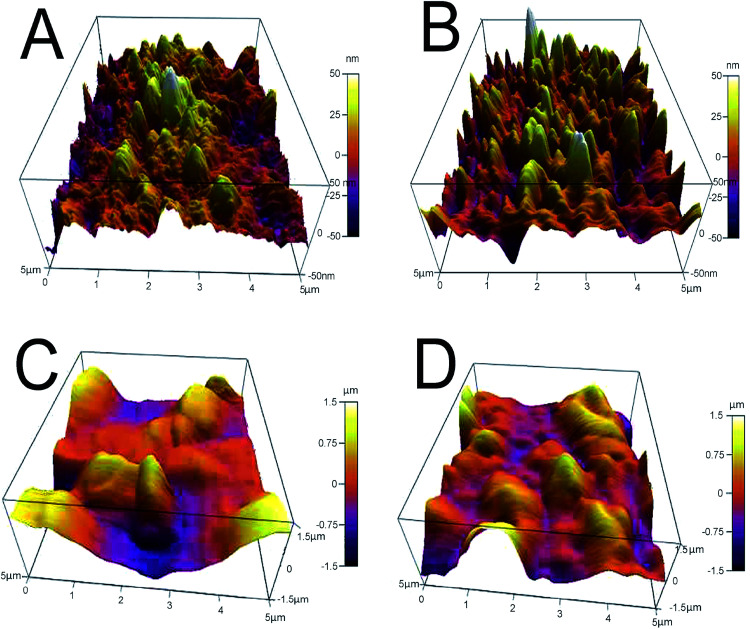
AFM analysis provides additional evidence for the formation of GO-AuNP coating on the QCM electrode, as given in Fig. 3A and B. The AFM figures give an idea about the thickness of the thin film of the nanoparticles formed on the electrode surfaces. An average of 50 nm thickness was observed for both the methods of electrode preparations. The pillar-like structures in the AFM images represent the coated nanoparticles on the surface. The thickness of the nanoparticle layers suggests that 3–4 GO-AuNP layers were deposited on the electrode surface.
Fig. 3. (A) E1 electrode after coating with GO-AuNP (B) E2 electrode after coating with GO-AuNP (C) E1 electrode after bioreceptor preparation (D) E2 electrode after bioreceptor preparation.
3.2. Characterization of self-assembled monolayer (SAM) bioreceptor
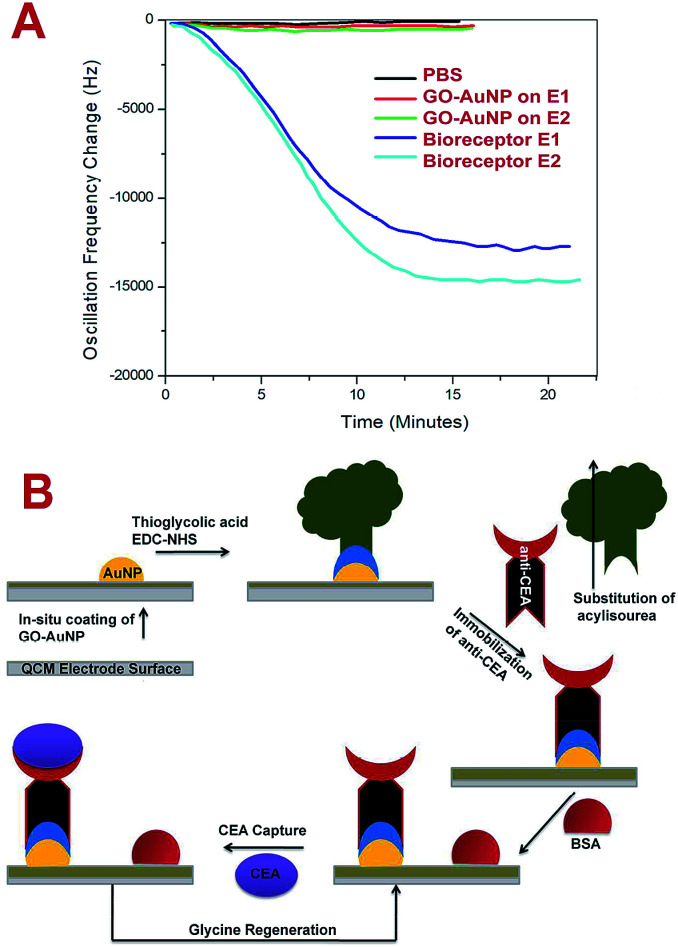
The bioreceptor preparation steps were monitored using QCM analysis to study the deposition of nanomaterial and biomolecular film on the electrode surface. Fig. 4A represents the frequency response towards the PBS run before and after the SAM preparation for E1 and E2 electrodes. After the GO-AuNP thin film coating, the frequency shift of E2 changed to an average value of about −165 Hz and after the immobilization of anti-CEA to about −15 623 Hz. E1 responded to the PBS solutions at −111 Hz and −13 567 Hz, respectively, after the GO-AuNP thin film coating and anti-CEA immobilization. The reduced frequency shift points to the successful addition of GO-AuNP thin film and immobilization of anti-CEA bioreceptor film on the surface of the QCM electrode crystal. The higher deviation in the frequency in the case of E2 than for E1 is due to better wetting of the QCM electrode surface by nanoparticles after oxygen plasma treatment. More number of AuNPs on the surface ultimately provide higher number of reaction sites to immobilize anti-CEA molecules. The high energy plasma particles may activate the Ti atoms from the electrode surface and can adhere with larger number of reaction nanoparticles than that under normal conditions. This may end up in a denser anti-CEA film on the bioreceptor surface.
Fig. 4. (A) Frequency shift of QCM after GO-AuNP coating and bioreceptor preparation PBS flow (pH – 7.4) at room temperature. (B) The scheme of biosensing used in the present study.
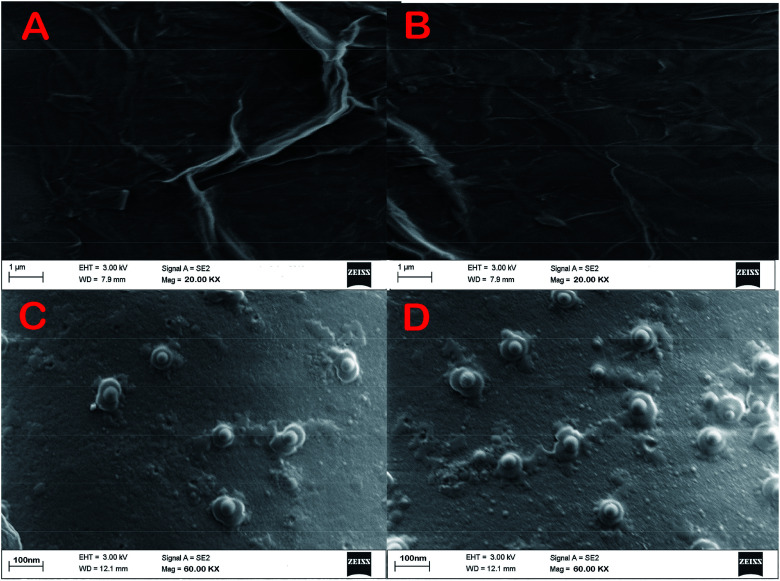
SEM images of E1 and E2 (Fig. 5A and B, respectively) display a well-formed new layer of SAM on the electrode crystal. The rough morphology of the nanomaterial coated electrode crystal shows it to be covered with a thin film of biological molecule based SAM. The magnified figures of each surface (60k×) are given in Fig. 5C and D. Individual reactive nuclei created by the immobilization of anti-CEA are visible in the figures. The number of reactive nuclei on the bioreceptor surface was observed to be higher for E2 than E1. The AFM images also suggest the formation of a new layer of SAM on the surface of QCM electrode, which is depicted in Fig. 3C and D, respectively, for E1 and E2. The topographic images of E1 and E2 have many ‘ups and downs’ due to the presence of immobilized anti-CEA molecules. The thickness of the newly formed layer is about 1000–1200 nm, which suggests the formation of a monolayer of anti-CEA molecules on the bioreceptor surface.
Fig. 5. (A) and (B) Morphology of the bioreceptor prepared on E1 and E2 (C) and (D) magnified morphology of E1 and E2.
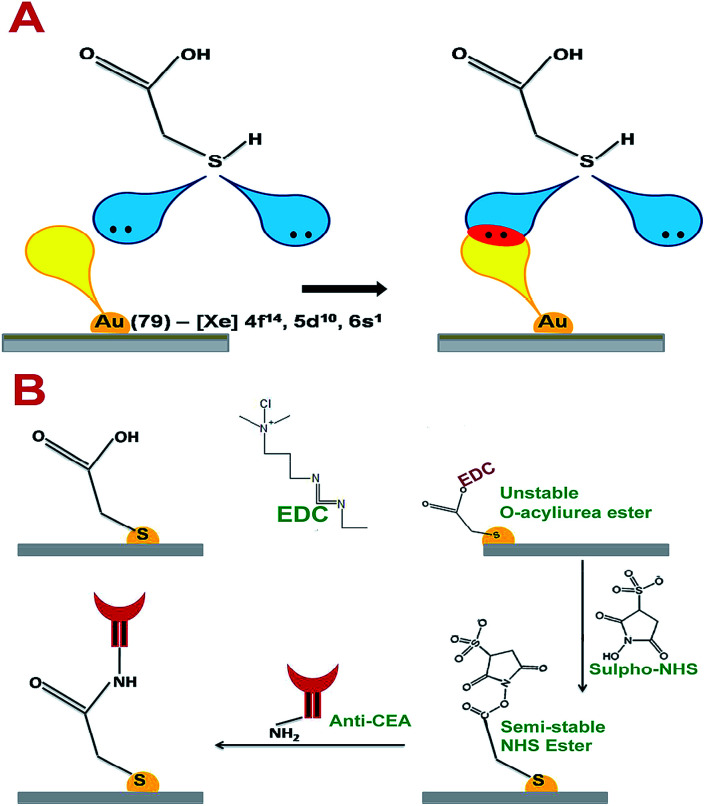
Thioglycolic acid has the capability to interact with AuNPs on the surface of the electrode crystal with stable chemical and physical bonds. According to T. Bürgi, sulphur molecules can form coordination bonds with transition metal elements.25 The vacant outermost orbital of Au can interact with lone pairs of sulphur to form a stable coordination linkage between AuNP on the electrode crystal surface and thioglycolic acid. The maximum bond energy reported for S–Au linkage is 184 kJ mol−1.25 Further, the thin layer of carboxylic acid terminated thioglycolic acid can be activated through the EDC–NHS coupling agent to form semi-stable acylamino ester intermediates, as given in Fig. 6A and B. These acylamino ester groups can interact with the primary amine groups of anti-CEA molecules to undergo substitution reaction to form a covalently bonded stable bioreceptors for CEA capture.
Fig. 6. (A) The interactive pattern of AuNP and thioglycolic acid (B) the chemistry behind the anti-CEA immobilization.
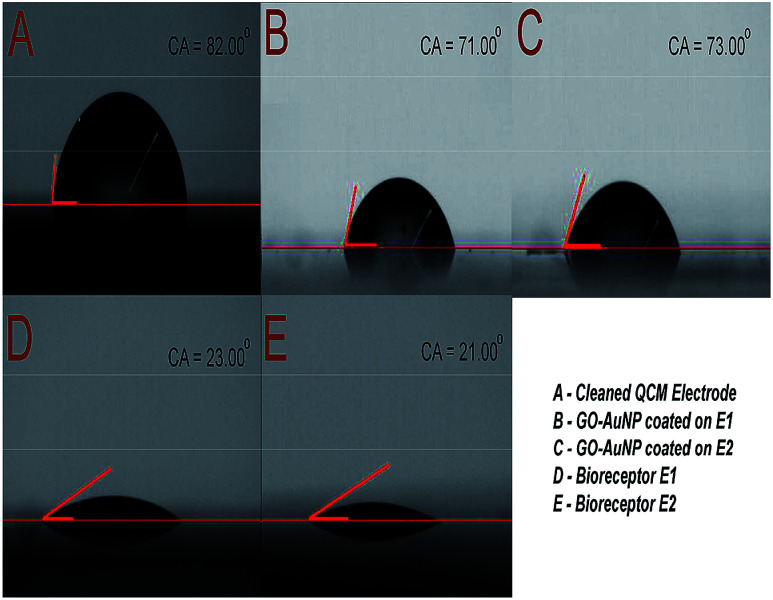
The immobilization of anti-CEA also has an effect on the hydrophilic characteristics of the electrode surface. The same was characterized and the results are depicted in Fig. 7. The clean Au surface had a contact angle of 82°, which was reduced to 71° and 73° after nanomaterial coating and further reduced to 23° and 21° after anti-CEA immobilization, respectively, for E1 and E2. The presence of polar hydrophilic biological molecules tends to enhance the hydrophilicity of the electrode surface after the formation of the bioreceptor. This further confirms the successful formation of biofilm on the QCM electrode surface through the method used in the present study.
Fig. 7. (A) Contact angle of piranha cleaned QCM electrode surface (B) contact angle of E1 surface after GO-AuNP coating (C) contact angle of E2 surface after GO-AuNP coating (D) E1 bioreceptor after anti-CEA immobilization (E) E2 bioreceptor after anti-CEA immobilization.
3.3. Immunoassay run for CEA solutions
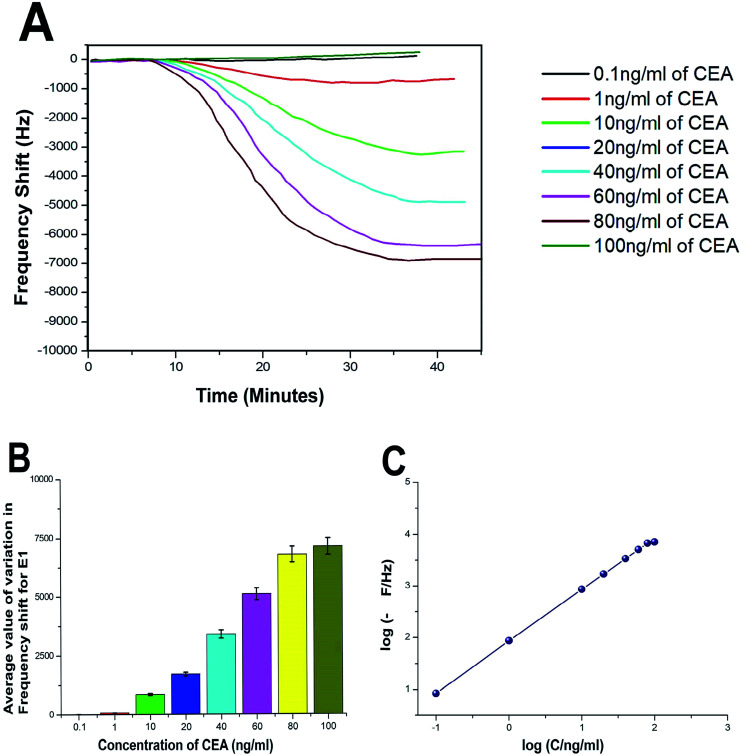
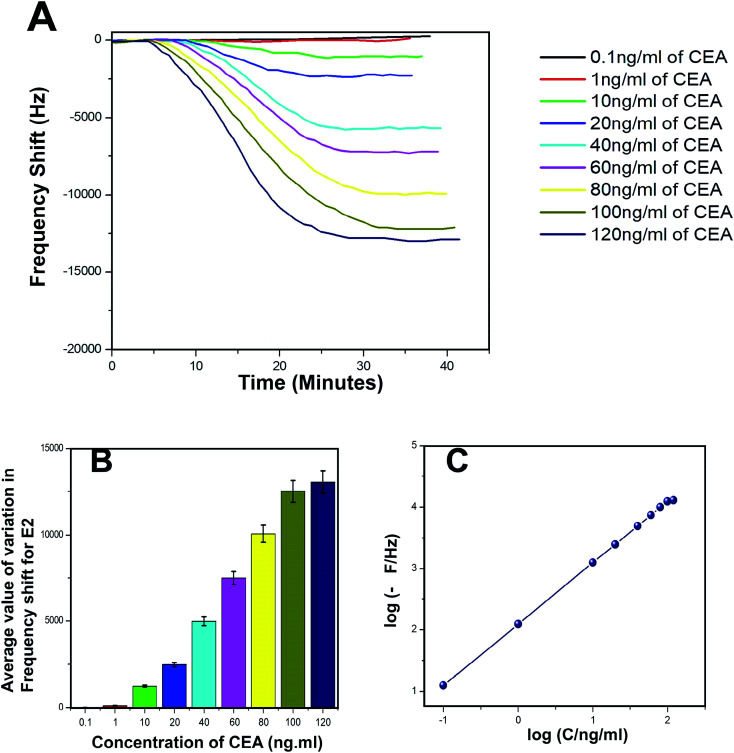
The biosensing capability and limit of detection of the newly prepared biosensors were estimated by performing a series of immunoassay runs with different stock solutions of CEA prepared in PBS at pH 7.4. The general principle of biosensing of CEA in the present research is depicted in Fig. 4B. The prepared biosensor was treated with BSA solution prior to immunoassay experiments to reduce the non-specific adsorption of CEA. Multiple immunoassay runs were conducted for each concentration of CEA stock solution and the representative image of the immunoassay response of the biosensors are depicted in Fig. 8A and 9A, respectively, for E1 and E2. The corresponding average values of variation in the frequency response for each CEA concentration from the base frequency of the respective biosensors are given in Fig. 8B and 9B (standard deviations (S.D.) are shown as error bars). The calibration curves as log–log plots to determine the lower and upper limit of detection are given in Fig. 8C and 9C. The final value of frequency shift was obtained after PBS washing at the end of each immunoassay run. The bioreceptor E2 was responded linearly with increase in the concentration of CEA, as the frequency response decreased from 0.1 ng mL−1 CEA to 120 ng mL−1. The immunoassay experiment was conducted for 0.01 ng mL−1 CEA as well. However, the solution could not create any considerable variation in the base frequency of the biosensor E2. Hence, the corresponding frequency response is not given in the figure. The biosensor E2 responded to 0.1 ng mL−1 of CEA with variation in the equilibrium frequency from the base frequency of about −12.5 Hz. Further, the frequency shifted to the lower side consistently with increasing CEA concentration and a maximum value of deviation at the frequency shift −13 260 Hz was recorded for 120 ng mL−1. Similarly, biosensor E1 also responded to the CEA stock solutions (Fig. 8A and C); however, the values are comparably lower to that of E2 for each concentration of CEA stock solutions. The E1 bioreceptor responded to 0.1 ng mL−1 stock solution with an oscillation frequency of 8.5 and 7120 Hz for 100 ng mL−1 solution. Oxygen plasma treatment at the beginning of bioreceptor preparation may end up providing a better effective area for the bioreceptor and better accessibility for prey CEA molecules during the immunoassay run, thereby giving lower oscillation frequency. As expected, the Ti atoms may get excited to an energetically higher state under oxygen plasma and more nanoparticles may adhere on the surface. A higher number of AuNP can react with thioglycolic acid, which ultimately creates more reaction sites for CEA immobilization as compared with the untreated one. This tends to create better effective surface for the bioreceptor E2 with more immobilized anti-CEA molecules than that for E1. This may be the reason for higher frequency shift for E2 than for E1 during the immunoassay analysis.
Fig. 8. (A) Immunoassay response of E1 (B) average value of variation in oscillation frequency from base value of E1 (C) calibration curves of E1.
Fig. 9. (A) Immunoassay response of E2 (B) average value of variation in oscillation frequency from base value of E2 (C) calibration curves of E2.
The response time of the bioreceptor was also found to be good and comparable or better than some of the reported values by various researchers.26–29 In the present study, the equilibrium plateau was attained for each immunoassay run within a minimum time period of 15–30 minutes. The limit of detection for both the biosensors was calculated as blank frequency response by PBS + 3× noise (standard deviation).30 The detection limit of E1 was calculated as 0.45 ng mL−1 of CEA concentration and that of E2 was better with a value of 0.33 ng mL−1. The upper saturation points of the biosensors were calculated from the log–log plots and for E1, the value obtained was about 91 ng mL−1 and that for E2 was about 113 ng mL−1. The LOD values are better than that of many reported studies and a comparison with some of the piezoelectric biosensors for CEA detection is given in the supportive data as Table S2.† The performance of both the biosensor methods was also evaluated through the calculation of total mass deposition on the electrode crystal using experimental values and theoretical calculation using the concentration of CEA solutions. Since the concentrations of solutions used for the immunoassay run are known, the weight of total CEA in each sample was calculated for the total flow of the sample and the obtained values were compared with the experimental results achieved through modified Sauerbrey's equation. The comparison is listed in Table S1† as supportive data. According to the values obtained, the accuracy of the biosensor was found to be good and the results show less than 10% deviation from the theoretical values. The sensitivity of the biosensors was calculated using Sauerbrey's equation and impressive values of 87 and 123 Hz ng−1 of CEA were found, respectively, for E1 and E2. The reproducibility study was conducted as per the studies reported by M. Y. Emran et al.31–34 The results were found to be in good agreement for both the bioreceptors. Both the bioreceptors did not show much difference in performance till the 8th immunoassay run and in subsequent runs, the frequency shift started deteriorating. The average values of variation in the immunoassay response as a function of reproducibility are given in Fig. S1.†
3.4. Sorption equilibrium of CEA on the bioreceptor sensing interphase
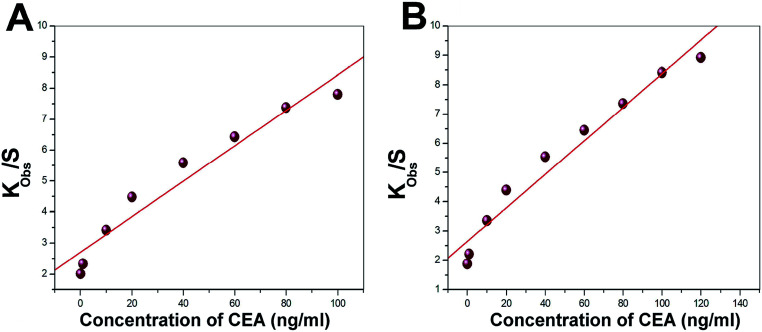
Langmuir isotherm was used to understand the favourable nature of adsorption of CEA on the bioreceptor. The experimental data fit well with the Langmuir adsorption isotherm, as depicted in Fig. 10A and B for both E1 and E2, respectively. A linear fit for kobsversus C for both E1 and E2 suggests that the sorption follows Langmuir adsorption isotherm. The isotherm enables to calculate the kinetic constants of adsorption (ka) and desorption (kd) as 2991 ± 524 L mol−1 s−1 and (6.83 ± 1.81) × 10−4 s−1, respectively, as the slope and intercept of the graph for E1. A non-zero value for kd implies an existing equilibrium within the A-CEA–CEA interface. For E2, on the other hand, the most significant observation noted is the low kd ((8.95 ± 1.75) × 10−5 s−1) value and increased ka (3672 ± 341 L mol−1 s−1), as compared to the untreated immunoassay samples. This further suggests increased activity of the bioreceptor interface through oxygen plasma treatment and shifted equilibrium of anti-CEA–CEA interaction, which is more towards the forward reaction side (association). In other words, the equilibrium attained with reduced dissociation rate may be due to the stronger anti-CEA–CEA interaction facilitated by the increased stability of bioreceptor E2.
Fig. 10. Representative Langmuir adsorption plot for the bioreceptors (A) E1 and (B) E2.
The observations from the isotherm study are in good correlation with the frequency response study, as discussed in the prior section, since there is considerably higher depression in frequency for oxygen plasma treated electrode crystal, E2, than that of its untreated counterpart, E1. Better interaction with the bioreceptor and ligand may tend to reduce the rate of backward reaction. This can end as a higher equilibrium deposited mass on E2 and the corresponding increase in the frequency shift towards more negative side.
Also, the free energy of sorption process was calculated and negative values for E1 and E2 were obtained. However, ΔGsorption for E2 is observed as a more negative value than that of E1, which also supports the concept of better ease for anti-CEA–CEA association on the oxygen plasma treated bioreceptor interface. ΔGsorption reported for E1 is −6.1 ± 0.36 kcal mol−1 and that for E2 is −6.6 ± 0.52 kcal mol−1. These values are observed to be higher than that of the previous studies that report similar experiments.29,30 The negative ΔGsorption values suggest favourable sorption process of CEA on the newly prepared SAM based bioreceptors surfaces. Additional evidence for the same has been obtained by finding the type of Langmuir sorption isotherm using the factor RL, a dimensionless constant separation factor (L mmol−1).
| RL = 1/(1 + bC0) | 1 |
According to the concept, if RL > 1, the sorption is unfavourable, while 0 < RL < 1 suggests favourable conditions for sorption, and RL = 0 suggests irreversible reaction. The RL values calculated for E1 are reported in the range of 0.74–0.93 and that of E2 are in the range of 0.65–0.85 L mmol−1.
3.5. Long-term stability and selectivity of the biosensor
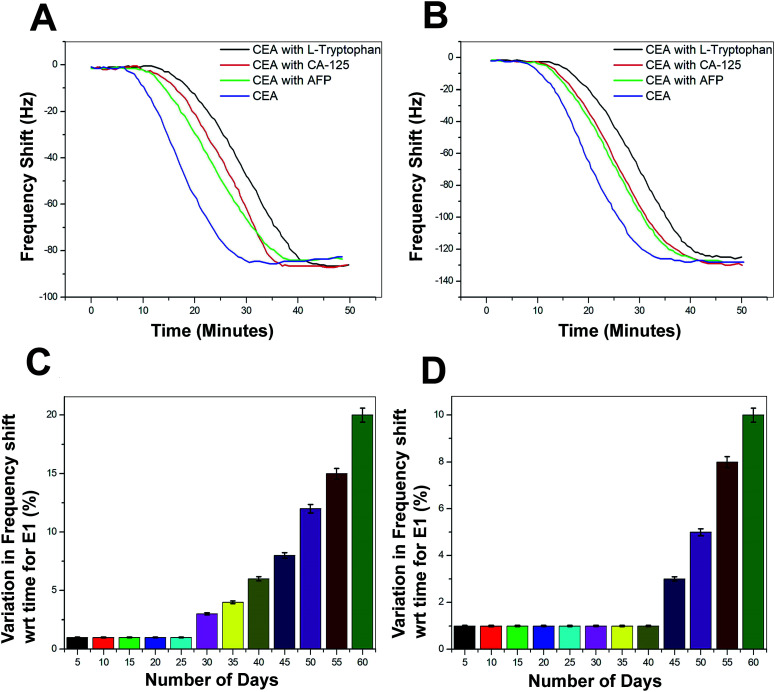
The selectivity of the biosensor was tested using other non-specific proteins such as alpha-1-fetoprotein (AFP), cancer antigen 125 (CA125), and l-tryptophan. These proteins were added in different concentrations to 1 ng mL−1 of CEA and the frequency response was recorded (Fig. 11A and B). The performance of both the biosensors E1 and E2 is free from the interference of non-specific adsorption of other protein molecules presented in the sample solutions. The frequency response was recorded in a similar region as that for the 1 ng mL−1 CEA stock solutions. However, the response time was delayed by 15–20 minutes, as compared to the stock solution analysis. The combinations of protein solutions are listed in the supportive data, Table S3.† The long-term stability of the biosensor was tested by repeated immunoassay runs with 1 ng mL−1 of CEA solution for 60 days. After a regular interval of 5 days, the biosensor was tested and the results are given as the average values of variation in the frequency shift for E1 and E2 in the Fig. 11C and D, respectively.
Fig. 11. (A) Immunoassay response during the selectivity study of the biosensors with various combinations of tumour marking proteins (Table S3†) for E1 (B) E2 (C) average values of the decrease in biosensing performance with time in terms of variation in frequency shift for E1 and (D) E2.
The biosensor receptors were stored at sterile conditions at 4 °C after each immunoassay experiment. The regeneration of SAM was conducted through a glycine buffer solution run after each immunoassay experiment. During the initial 25 days of the immunoassay run, the variation in the frequency shift was recorded to be negligible and for another 10 days, the variation was not more than 2–3% for E1. However, the variation in frequency response increased steadily from 35th day onwards and at the 60th day, an average difference of 18% was recorded for the bioreceptor E1. On the other hand, E2 recorded exceptionally high stability since till the 40th day the decrease in performance was negligible and a maximum of 17% decrease in efficiency was observed for E2 at the end of the analysis period. The bioreceptor E2 has shown high resistivity towards the initiation in performance decrease till the 40th day as compared to the bioreceptor E1. This may be due to the additional stability of the bioreceptor obtained through oxygen plasma treatment, as proposed in the previous sections.
3.6. Real-time detection of clinical serum samples
The real-time application of the newly developed biosensor was examined using clinical serum samples. A total of 10 serum samples were subjected to the immunoassay run using the biosensor and were also tested through ELISA method. The collected samples were mainly from patients who were in the early stages of colorectal cancer development. Prior to the measurement, 0.5 mL of the serum sample was added to 2 mL of PBS solution with pH 7.4. Further, the immunoassay run and the calculation of the deposited mass on the electrode surface was conducted as per the above-discussed methods. The results are depicted in Table 1 in comparison with the results obtained through the ELISA method. The study found no significant difference in the results given by the two methods. Also, the biosensor reported better consistency in the results, which is proved by the smaller standard deviations values than those for the ELISA results. Also, the response time is much faster for the biosensor (40–50 minutes) than that of the ELISA method (6–8 hours).
Clinical serum sample analysis results for bioreceptors E1 and E2 in comparison with the ELISA method.
| No. | Biosensor E1 (ng mL−1) | Biosensor E2 (ng mL−1) | ELISA (ng mL−1) |
|---|---|---|---|
| 1 | 25.1 ± 2.48 | 25.4 ± 2.33 | 25.3 ± 3.12 |
| 2 | 20.1 ± 2.46 | 20.3 ± 2.15 | 20.8 ± 2.81 |
| 3 | 34.4 ± 2.31 | 34.3 ± 2.16 | 34.1 ± 3.44 |
| 4 | 37.6 ± 3.62 | 37.3 ± 3.35 | 37.1 ± 3.96 |
| 5 | 21.0 ± 3.54 | 21.3 ± 3.29 | 21.3 ± 4.23 |
| 6 | 37.7 ± 3.33 | 37.5 ± 3.15 | 38.0 ± 4.12 |
| 7 | 34.4 ± 2.61 | 34.7 ± 2.36 | 34.4 ± 3.23 |
| 8 | 30.3 ± 2.34 | 30.9 ± 2.04 | 31.4 ± 2.34 |
| 9 | 29.9 ± 3.45 | 29.5 ± 3.15 | 30.3 ± 3.77 |
| 10 | 33.8 ± 2.46 | 34.2 ± 2.11 | 34.0 ± 3.51 |
4. Conclusions
QCM biosensor for the real-time detection of CEA was successfully prepared through a SAM-based biosensor. The study proposes a simple, sensitive, efficient, and highly selective piezoelectric immunosensing method for CEA detection and estimation. The limit of detection of the biosensor was found to be 0.06 and 0.09 ng mL−1 of CEA concentration for the bioreceptors prepared with and without oxygen plasma treatment, respectively. The bioreceptors were prepared through GO-AuNP coating on the QCM electrode by in situ synthesis method and systematic integration of thioglycolic acid coupling unit through EDC–NHS reaction mechanism. Oxygen plasma treatment of the electrode surface in the initial stage of bioreceptor preparation provided additional stability and sensitivity to the biosensor. Also, theoretical analysis using Langmuir sorption isotherm kinetics allowed to calculate ka, kd, and ΔG during the immunoassay run and suggested a stable bioreceptor – prey molecule interaction. The biosensor is suitable for multiple immunoassay runs since the standard deviation of the test results were found to be small and till the 45th day of biosensor preparation, the decrease in the biosensing efficiency was found to be less than 2%. The selectivity of the biosensor was also observed to be satisfactory with other common tumor marking proteins such as AFP, CA125, and l-tryptophan. Clinical serum sample analysis has suggested the biosensor to be promising for the real-time detection of CEA. The test result was validated using the ELISA method and found to be comparable but with faster response time.
Conflicts of interest
The authors do not have any conflict of interest regarding this publication.
Supplementary Material
Acknowledgments
The authors gratefully acknowledge the support of Research and Development Program of China (Grant no. 2016YFB0402705). Project supported by State Key Laboratory of Powder Metallurgy, Central South University, Changsha, China, National Natural Science Foundation of China (NSFC Grant no. 11704261, 11575118), Shenzhen Science & Technology Project (Grant no. JCYJ20170817100658231, JCYJ20180507182439574, JCYJ20180305124317872), Shenzhen Key Lab Fund (ZDSYS20170228105421966), UK Engineering and Physical Sciences Research Council (EPSRC) EP/P018998/1, Newton Mobility Grant (IE161019) from the UK Royal Society and the National Natural Science Foundation of China, and Royal Academy of Engineering UK-Research Exchange with China and India.
Electronic supplementary information (ESI) available. See DOI: 10.1039/c9ra09963h
References
- Gua X. Sheb Z. Mab T. Tiana S. Kraatz H. B. Biosens. Bioelectron. 2018;102:610–616. doi: 10.1016/j.bios.2017.12.014. [DOI] [PubMed] [Google Scholar]
- Wang Y. Zhao G. Zhang Y. Pang X. Cao W. Du B. Wei Q. Sens. Actuators, B. 2018;266:561–569. doi: 10.1016/j.snb.2018.03.178. [DOI] [Google Scholar]
- Shu H. Wen W. Xiong H. Zhang X. Wang S. Electrochem. Commun. 2013;37:15–19. doi: 10.1016/j.elecom.2013.09.018. [DOI] [Google Scholar]
- Blixt O. Bueti D. Burford B. Allen D. Julien S. Hollingsworth M. Gammerman A. Fentiman I. Taylor-Papadimitriou J. Burchell J. M. Breast Cancer Res. 2011;13:1–16. doi: 10.1186/bcr2841. [DOI] [PMC free article] [PubMed] [Google Scholar]
- Qiu Z. Shu J. Liu J. Tang D. Anal. Chem. 2019;91:1260–1268. doi: 10.1021/acs.analchem.8b05455. [DOI] [PubMed] [Google Scholar]
- Yu Z. Tang Y. Cai G. Ren R. Tang D. Anal. Chem. 2019;91:1222–1226. doi: 10.1021/acs.analchem.8b04635. [DOI] [PubMed] [Google Scholar]
- Skladal P. Piezoelectric biosensors. Trends Anal. Chem. 2016;79:127–133. doi: 10.1016/j.trac.2015.12.009. [DOI] [Google Scholar]
- Liao J. Lu M. Tang D. Biochem. Eng. J. 2016;114:276–282. doi: 10.1016/j.bej.2016.07.016. [DOI] [Google Scholar]
- Tang D. Li Q. Tang J. Su B. Chen G. Anal. Chim. Acta. 2011;686:144–149. doi: 10.1016/j.aca.2010.11.054. [DOI] [PubMed] [Google Scholar]
- Choi J. W. Chun B. S. Oh B. K. Lee W. Lee W. H. Colloids Surf., B. 2005;40:173–177. doi: 10.1016/j.colsurfb.2004.10.020. [DOI] [PubMed] [Google Scholar]
- Zhang X. Chen J. Liu H. Zhang S. Biosens. Bioelectron. 2015;65:341–345. doi: 10.1016/j.bios.2014.10.055. [DOI] [PubMed] [Google Scholar]
- Wang X. Yu H. Lu D. Zhang J. Deng W. Sens. Actuators, B. 2014;195:630–634. doi: 10.1016/j.snb.2014.01.027. [DOI] [Google Scholar]
- Chronaki D. Stratiotis D. I. Tsortos A. Anastasiadou E. Gizeli E. Sens. Biosensing Res. 2016;11:99–106. doi: 10.1016/j.sbsr.2016.10.001. [DOI] [Google Scholar]
- Chen Z. G. Tang D. Y. Bioprocess Biosyst. Eng. 2007;30:243–249. doi: 10.1007/s00449-007-0120-5. [DOI] [PubMed] [Google Scholar]
- Yang X. Zhou R. Hao Y. Yang P. Sci. Bull. 2017;62:923–930. doi: 10.1016/j.scib.2017.05.022. [DOI] [PubMed] [Google Scholar]
- Uludag Y. Tothill I. E. Talanta. 2010;82:277–282. doi: 10.1016/j.talanta.2010.04.034. [DOI] [PubMed] [Google Scholar]
- Yu X. Chen F. Wang R. Li Y. J. Biotechnol. 2018;266:39–49. doi: 10.1016/j.jbiotec.2017.12.011. [DOI] [PubMed] [Google Scholar]
- Tang D. Zhang B. Tang J. Hou L. Chen G. Anal. Chem. 2013;85:6958–6966. doi: 10.1021/ac401599t. [DOI] [PubMed] [Google Scholar]
- Gao L. Zhang H. Cui H. Biosens. Bioelectron. 2014;57:65–70. doi: 10.1016/j.bios.2014.01.057. [DOI] [PubMed] [Google Scholar]
- Vlamidis Y. Gualandi I. Tonelli D. J. Electroanal. Chem. 2017;799:285–292. doi: 10.1016/j.jelechem.2017.06.012. [DOI] [Google Scholar]
- Wang R. Wang L. Callaway Z. T. Lu H. Huang T. J. Li Y. Sens. Actuators, B. 2017;240:934–940. doi: 10.1016/j.snb.2016.09.067. [DOI] [Google Scholar]
- Kankare J. Langmuir. 2002;18:7092–7094. doi: 10.1021/la025911w. [DOI] [Google Scholar]
- Kenneth A. M. Biomacromolecules. 2003;4:1099–1120. doi: 10.1021/bm020116i. [DOI] [PubMed] [Google Scholar]
- Vogt B. D. Lin E. K. Wu W. l. White C. C. J. Phys. Chem. B. 2004;108:12685–12690. doi: 10.1021/jp0481005. [DOI] [Google Scholar]
- Bürgi T. Nanoscale. 2015;7:15553–15567. doi: 10.1039/C5NR03497C. [DOI] [PubMed] [Google Scholar]
- Li S. Wan Y. Su Y. Fan C. Bhethanabotla V. R. Biosens. Bioelectron. 2017;95:48–54. doi: 10.1016/j.bios.2017.04.012. [DOI] [PubMed] [Google Scholar]
- Omidi M., Choolaei M., Haghiralsadat F., Azhdari M., Moghadam N. D. and Yazdian F., Proceedings of the International Conference on Biomedical Electronics and Devices (BIODEVICES-2014), 2014, pp. 134–139 [Google Scholar]
- Zheng D. Xiong J. Guo P. Li Y. Wang S. Gu H. Mater. Res. Bull. 2014;59:411–415. doi: 10.1016/j.materresbull.2014.07.054. [DOI] [Google Scholar]
- Stobiecka M. Hepel M. Biosens. Bioelectron. 2011;26:3524–3530. doi: 10.1016/j.bios.2011.01.038. [DOI] [PubMed] [Google Scholar]
- Karpovich D. S. Blanchard G. J. Langmuir. 1994;10:3315–3322. doi: 10.1021/la00021a066. [DOI] [Google Scholar]
- Emran M. Y. Shenashen M. A. Morita H. El-Safty S. A. Biosens. Bioelectron. 2018;109:237–245. doi: 10.1016/j.bios.2018.03.026. [DOI] [PubMed] [Google Scholar]
- Emran M. Y. Mekawy M. Akhtar N. Shenashen M. A. EL-Sewify I. M. Faheem A. El-Safty S. A. Biosens. Bioelectron. 2018;100:122–131. doi: 10.1016/j.bios.2017.08.050. [DOI] [PubMed] [Google Scholar]
- Emran M. Y. El-Safty S. A. Shenashen M. A. Minowa T. Sens. Actuators, B. 2019;284:456–467. doi: 10.1016/j.snb.2018.12.142. [DOI] [Google Scholar]
- Emran M. Y. Shenashen M. A. Morita H. El-Safty S. A. Adv. Healthcare Mater. 2018;7:1701459. doi: 10.1002/adhm.201701459. [DOI] [PubMed] [Google Scholar]
Associated Data
This section collects any data citations, data availability statements, or supplementary materials included in this article.


