Abstract
Different nanostructured surfaces have bactericidal properties that arise from the interaction between the bacteria and the nanostructured surface. In this study, we focused on the relationship between bacterial motility and bactericidal properties. The motility of Escherichia coli (E. coli) was tuned by genetic engineering, and four types of E. coli (wild type (WT), lacking flagella, and flagellated with deficient motility or deficient chemotaxis) were used to evaluate the adhesion and bactericidal properties of nanostructured surfaces. Cicada (Cryptotympana facialis) wings and Si nano-pillar array substrates were used as natural and artificial nanostructured surfaces, respectively. Differences in motility and chemotaxis strongly influenced the adhesion behavior and to some extent, the damage to the cell membrane. These results suggest that the bactericidal properties of nanostructured surfaces depend on bacterial motility.
Bactericidal effect derived from nanostructured surface was evaluated in the point of view of the motility of E. coli. The results suggest that the properties strongly depend on bacterial motility.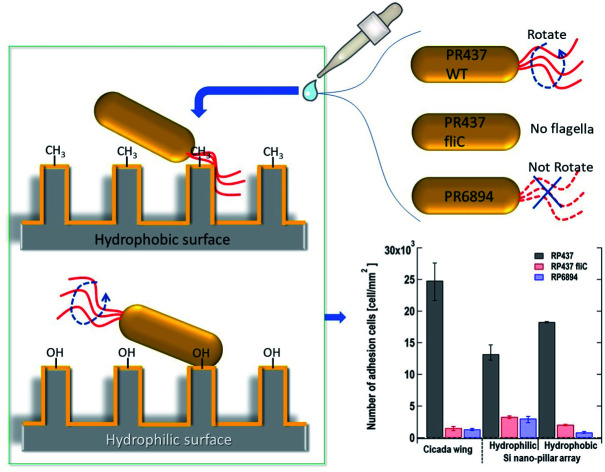
1. Introduction
Human beings have developed many kinds of bactericidal materials to overcome infection by microorganisms. Currently, many household articles, such as furniture, sanitary goods, and dishes with antibacterial properties, are commercially available to the public. Most bactericidal materials consist of different chemical substances, such as nanosized metals,1–3 antibiotic agents4–6 and antimicrobial compounds.7–9 These materials have disadvantages such as short stability, cost, and being harmful to human beings. Recently, microorganisms presenting antimicrobial resistance have become a serious threat, causing approximately 700 000 deaths per year. Additionally, it has been estimated that the number of antimicrobial resistance-related deaths will increase to 10 million by 2050.10 Nanostructure-based bactericidal materials, including Si pillar arrays and polymer pillar arrays, can kill bacteria with antimicrobial resistance because the principle underlying their bactericidal effects is different from that of the bactericidal chemical materials.
The bactericidal effect of the nanostructures was discovered by studying natural nanostructured surfaces such as cicada wings,11–15 dragonfly wings,12,16,17 and gecko fingers.18,19 Later it was discovered that artificial nanostructured surfaces composed of inorganic materials, such Si11,15,20,21 and carbon nanotubes (CNT),22 and organic materials,23–26 also have bactericidal properties. The bactericidal activity on a nanostructure originates from its physical instead of from its chemical properties; the cell membranes are stretched by the nanostructured surface, which causes cell break. It is possible to estimate cell death occurrence using commercially available DNA-staining reagents such as SYTO 9 and propidium iodide (PI), which indicate cell membrane damage.11–19 This technology gives us information about cell membrane damage. It is noted that some population of bacteria inactivated by various methods such as UV and heat treatment to destroy micro-organisms can still survive as injured cells.27–29 Injured cells are defined as cells exposed to physical and chemical stresses. They are not destroyed after sterilization but their life and death are judged by additional broth condition after the sterilization.
Our group reported that the cicada wing surface caused the effusion of intercellular fluid of Escherichia coli (E. coli) cells adhered to it.15 To prove this, we measured the decrease in a fluorescent protein expressed by E. coli, which indicated that the lysis of cells adhering to the nanostructure. The changes in fluorescence intensity were classified into three stages: just trapped in the nanostructure, small effusion, and large effusion. The same phenomenon was observed on an artificial nanostructured surface. From these results, we hypothesized that the cell membrane was damaged after the attachment, which led to intercellular fluid effusion into the environment and finally to cell death. In fact, E. coli trapped in the nanostructure resulted in death. Therefore, we used SYTO 9 and PI as reagents to analyze the cell death in real time.
An important step for bactericidal behavior is the adhesion of bacteria to the nanostructured material surface because adhesion is the first step on the nanostructure-based bactericidal material. Our group reported that the number of attached cells depended on presence or absence of nanostructure and the surface wettability.15 The number of attached cells increased with the contact angle for water (WCA: water contact angle) and that on the nanostructured surface was about twice compared to the flat surface at the same WCA. To develop an application in the field of sanitary engineering, it is important to increase the number of attached cells to improve the bactericidal and antibacterial properties of the nanostructured surface. Thus, we focused on bacterial characteristics that could affect attachment. Flagella play an important role in the adhesion to a surface because they can sense its physicochemical properties.30 In this study, we evaluated the relationship between attachment to the nanostructured surface and cell damage after attachment using a wild type (WT) E. coli strain and three genetically modified strains with deficit of flagella, deficit of flagellar motility (cells with non-motile flagella), and deficit of chemical sensors (those that lead the cells toward nutrient-rich environments).
2. Materials and methods
2.1. Chemicals
PI, hydrogen peroxide, sulfonic acid, nitric acid, hydrochloric acid, sodium hydrogen carbonate, sodium hydrogen phosphate, sodium dihydrogen phosphate and ammonia water were purchased from WAKO Chemicals (Tokyo, Japan). SYTO 9 and Cy3 were obtained from Thermo Fisher Scientific (Tokyo, Japan). Hydrofluoric acid was obtained from Daikin Industries, Ltd. (Osaka, Japan). Polystyrene (PS) beads (diameter: 200 nm) were purchased from Funakoshi Co., Ltd. (Tokyo, Japan). P-type Si wafer (crystal orientation: 100, diameter: 101.6 mm) was purchased from SUMCO Co. (Tokyo, Japan).
2.2. Preparation of cicada wings
Cicada (Cryptotympana facialis) specimens were collected from the university area. Their wings were separated from the bodies and kept in a vacuum chamber after sonication in ethanol. Before the bactericidal test, a second sonication in ethanol was performed. Afterward, the wings were dried, cut using a cutter, and fixed on a glass plate with double-sided tape.
2.3. Preparation of glass and Si nano-pillar array substrate
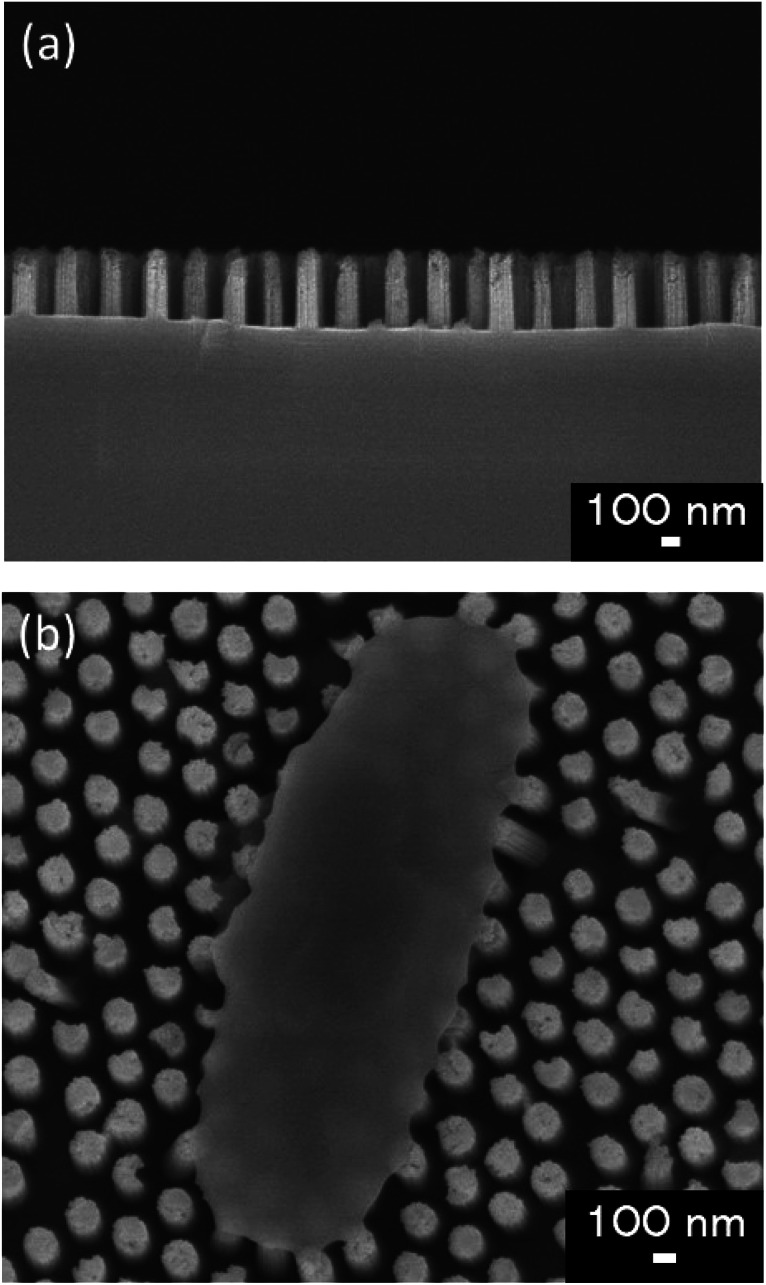
We used glass substrates to analyze adhesion properties of four types of E. coli strains via microscopy. The glass substrate (24 × 36 mm, thickness: 0.15 mm) was exposed to oxygen plasma (PDC-32G, Harrick Plasma, NY, USA) for 1 min to get hydrophilic surface. WCA of the glass substrate before and after the plasma treatment were 69.5 ± 1.5° and 16.7 ± 1.9° respectively. On the bactericidal property test, the Si nano-pillar array substrate was fabricated and used as an artificial nanostructure. Our group had reported that Si nano-pillar arrays could be obtained by colloidal lithography and metal-assisted chemical etching (MacEtch),15,31 which allow controlling the nanopillar array dimensions. The gap of the nano-pillar was controlled by changing the diameter of PS beads. The diameter of the nano-pillar was controlled by changing the dry etching time of PS beads. The depth of the nano-pillar was controlled by changing the wet etching time on the MacEtch. Fig. 1(a) shows a cross-section scanning electron microscopy (SEM) image of the fabricated nano-pillar array. Fig. 1(b) shows a top view of the nano-pillar array after the cell attachment. The pillars had a cylindrical shape and spread all over the surface. The diameter and depth of nano-pillars were approximately 150 nm and 450 nm, respectively. The size of the Si nano-pillar array substrate was 30 × 30 mm. After MacEtch, the surface was hydrophilic because Si was oxidized with hydrogen peroxide. After etching the SiO2 thin layer by dipping it in a buffer solution of HF and NH4F, the contact angle increased from 23.1 ± 1.0° to 78.3 ± 1.3°. Forward in the text, hydrophilic surface means that there was a thin SiO2 layer on the Si nano-pillar array and hydrophobic surface means that the thin SiO2 layer was removed.
Fig. 1. (a) Cross-section SEM image the nano-pillar array fabricated in this study. (b) Surface SEM image of E. coli adhering on the fabricated nano-pillar array.
2.4. Preparation of E. coli strains
We used four E. coli strains, three of which were genetically engineered and had specific traits (Table 1). RP437 (courtesy of Dr Y. Sowa, Hosei Univ.) was the WT strains. This strain could swim in the culture media using flagellar rotation, and chemical sensors, called chemoreceptors, controlled the swimming direction toward a nutrient-rich environment.32 RP437 fliC (constructed by T. Sagawa) lacked flagella, and, therefore, had no motility. RP6894 (courtesy of Dr H. Fukuoka, Osaka Univ.) had flagella, but the flagella did not rotate, meaning that the strain lacked motility.33 UU2612 (courtesy of Dr S. Nishiyama, Hosei Univ.) lacked all chemoreceptors. This strain could move but could not identify the nutrient-rich environment. Consequently, the direction of the movement was random.34
E. coli strains and their characteristics. + and − indicate that the strain had and lacked the characteristic listed in the leftmost column. “Flagellated” means that the cell had flagella. “Motile” means that the cell could swim in a liquid environment. “Chemotaxis” means that the cell could move toward a nutrient-rich environment.
| Characteristic/strain | RP437 (WT) | RP437 fliC | RP6894 | UU2612 |
|---|---|---|---|---|
| Flagellated | + | − | + | + |
| Motile | + | − | − | + |
| Chemotaxis | + | − | − | − |
E. coli cells were grown in tryptone broth (TB) (1% bactotryptone, 0.5% NaCl) at 30 °C with shaking at 170 rpm, until reaching OD550 = 0.6. Cultured cells were suspended in motility buffer (10 mM potassium phosphate buffer pH 7.0; 0.1 mM EDTA-2K pH 7.0; 10 mM NaCl; and, 75 mM KCl) twice. The cell suspension was diluted with motility buffer to an OD600 = 0.2.
The cells were stained with SYTO 9 and PI for the cell membrane damage test. 1 mL of the diluted cell suspension was mixed with 3.3 mM SYTO 9-DMSO solution and 10 mM PI-DMSO solution. After mixing, the cell suspension was allowed to stand for 15 min. We only used SYTO 9 staining for the cell adhesion test. The preparation procedure was the same as above without adding PI.
The cells were stained with fluorescent reagent of Cy3 to observe the cell movements on the glass substrate after adhesion. After the cell growth until OD550 = 0.6, cultured medium was centrifuged with 10 krpm for 1 min, then the cell suspension was diluted with p-buffer (pH = 7.0). Here, p-buffer consists of 1/15 mM sodium hydrogen phosphate and 1/15 mM sodium dihydrogen phosphate. 45 μL of the diluted cell suspension was mixed with 5 μL of Cy3 dye solution (20 μg μL−1) and 2.5 μL of sodium hydrogen carbonate (1 M) solution. After stirring with rotation at 100 rpm for 90 min, 1 mL of phosphate buffered saline (PBS) with 0.5 wt% glucose was added to the solution, then it was centrifuged at 10 krpm for 1 min. Finally, after the supernatant solution was removed, 200 μL of PBS with 0.5 wt% glucose was added.
2.5. Observation of attached cells
After the cell suspension (20 μL) was dropped either on the cicada wing or the Si nano-pillar substrates, a coverslip (18 × 18 mm, thickness: 0.15 mm) was put over it and fixed using double-sided tape (0.1 mm thick). The dropped suspension was pushed out by the coverslip to ensure that the cell suspension covered the whole area of the nanostructured surfaces. The chamber was held for 1 min to allow cell adherence onto the nanostructured surfaces. Then, the chamber was turned over to prevent gravity from making the cells fall from the solution onto the cicada wing or nano-pillar surface during the observation.
The cell membrane damage of the cells adhered to the nanostructured surfaces was assessed by fluorescence microscopy (Eclipse Ti-E, Nikon, Tokyo, Japan) equipped with 20× objective lens (CFI S Plan Fluor ELWD 20X, N.A.0.45, Nikon, Tokyo, Japan) and 2.5× C-mount relay lens (VM2.5X, Nikon). E. coli cells stained with SYTO 9/PI were illuminated with epi-fluorescence from a mercury lamp. We used the GFP HQ filter set (excitation filter: 470/40 nm, dichroic mirror: 495 nm, emission filter: 525/50 nm; Nikon, Tokyo, Japan) to observe SYTO 9 fluorescence and the FITC filter set (excitation filter: 540/25 nm, dichroic mirror: 565 nm, emission filter: 605/55 Nikon, Tokyo, Japan) to observe PI fluorescence. The fluorescence images were captured using a CCD camera (DMK23G618; The Imaging Source, Bremen, Germany). Excitation light was irradiated for 1 s for each capturing process to reduce photobleaching.
On the cell movement observation, the cell suspension was dropped on the glass plate, the coverslip was put over it and fixed using the double-sided tape as described in the cell membrane damage test. Cell movement was monitored using the same fluorescence microscopy described above excepting the objective lens and the camera. In this case, 60× oil immersion lens (Plan Apolambda 60X oil, N.A.1.40, Nikon, Tokyo, Japan) and CMOS camera (Rolera bolt, QImagingBC, Canada) were used. We used the GFP HQ filter set to observe Cy3 fluorescence as same as the SYTO 9 observation. The fluorescence images were captured by 100 ms, and 50 images were tracked in total. Excitation light was irradiated for 30 μs for each capturing process to reduce fluorophore quenching.
2.6. Analysis of cell membrane damage in E. coli cells
The time course of the active cell ratio, which was calculated as the number of SYTO 9-stained cells divided by the number of attached cells (green- and red-stained cells), was analyzed by ImageJ.35,36
2.7. Antibacterial property test
A protocol based on JIS (Japan Industrial Standards) Z 2801, which was based on ISO (International Organization for Standard) 22 196, was applied to evaluate the antibacterial properties of the Si nano-pillar array substrate (30 × 30 mm). The four E. coli strains described in Table 1 were used in this assay. The bacteria concentration was adjusted to OD0.6 = 0.1 in 0.2% LB broth. Each sample was coated with 0.16 mL of a test solution including viable bacteria. Then, the sample were covered with film (Esclinicap, Sekisui Chemical Co. Ltd., Japan). The samples were kept at 35 °C for different culture times (1, 2, 4, 8, and 24 hours). After cultivation, the test solution was rinsed away with 9.84 mL of a sterilized saline solution, and a total volume of 10 mL was analyzed. The test solution was diluted to 1/100, 1/10 000, and 1/1 000 000, and 1 mL of the diluted solution was dropped onto bacterium counting sheets (JNC Corporation, Japan), which were incubated at 35 °C for 24 hours. After incubation, the number of colonies was counted, and the active cell ratio was calculated using the equation below:
An alive cell ratio below 1% indicated that the tested material had antibacterial properties against the tested strain.
3. Results and discussions
3.1. E. coli adhesion to the glass surfaces depends on bacterial behavior
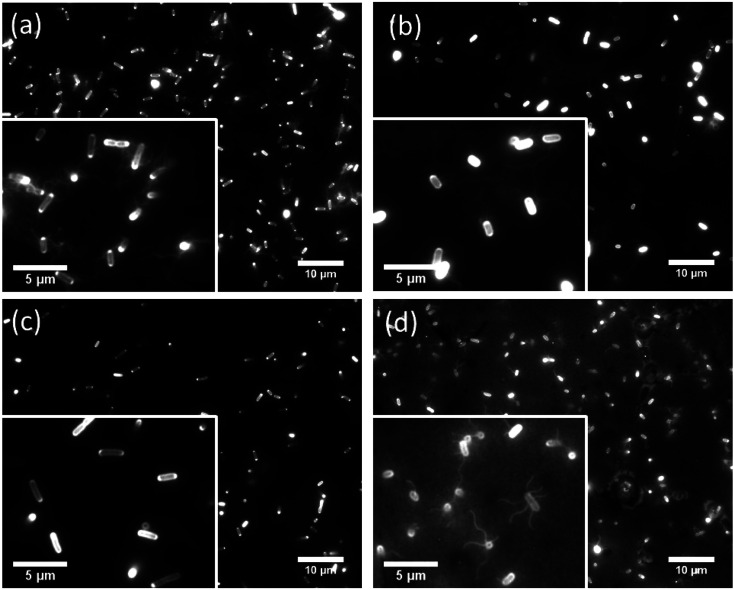
We observed the cell movement behavior dependent with E. coli strains and wettability of the flat glass substrate by fluorescence microscopy. WCAs of the glass surface before and after the plasma treatment were 69.5 ± 1.5° and 16.7 ± 1.9°, respectively. The microscopy images of adhered cells on the hydrophobic glass surface were shown in Fig. 2. We could confirm that cells of RP437 (Fig. 2(a)), UU2612 (Fig. 2(b)) and RP6894 (Fig. 2(d)) had flagella but that of RP437 fliC did not have flagella (Fig. 2(c)). In this case, flagella adhered on the surface then they could not move at all (see ESI Movies 1(a)–(d)†). On the hydrophilic glass surface, body of all types of the cells attached to the surface due to hydrophilic interaction. Then, flagella of RP437 and UU2612 moved (see ESI Movies 2(a) and (b)†). Flagella of RP6894 did not moved because of its own trait. The cells of RP437 fliC and RP6894 moved randomly due to Brownian motion (data not shown). These results indicate that main contact area of E. coli to solid surface was strongly dependent with wettability of the solid surface, because the body of the E. coli cell is negatively charged and has hydrophilicity due to long glycan chains37 and flagella have hydrophobicity due to four hydrophobic segments of motor protein MotoA.38
Fig. 2. Fluorescent microscopy images of Cy3 labelled genetically modified cells attached on the hydrophobic glass surface. Scale bars in each photo show 10 μm. (a) RP437, (b) UU2612, (c) RP437 fliC, (d) RP6894. Enlarged views were inserted in each photo. In this case, scale bars show 5 μm.
3.2. E. coli adhesion to the nanostructured surfaces depends on bacterial behavior
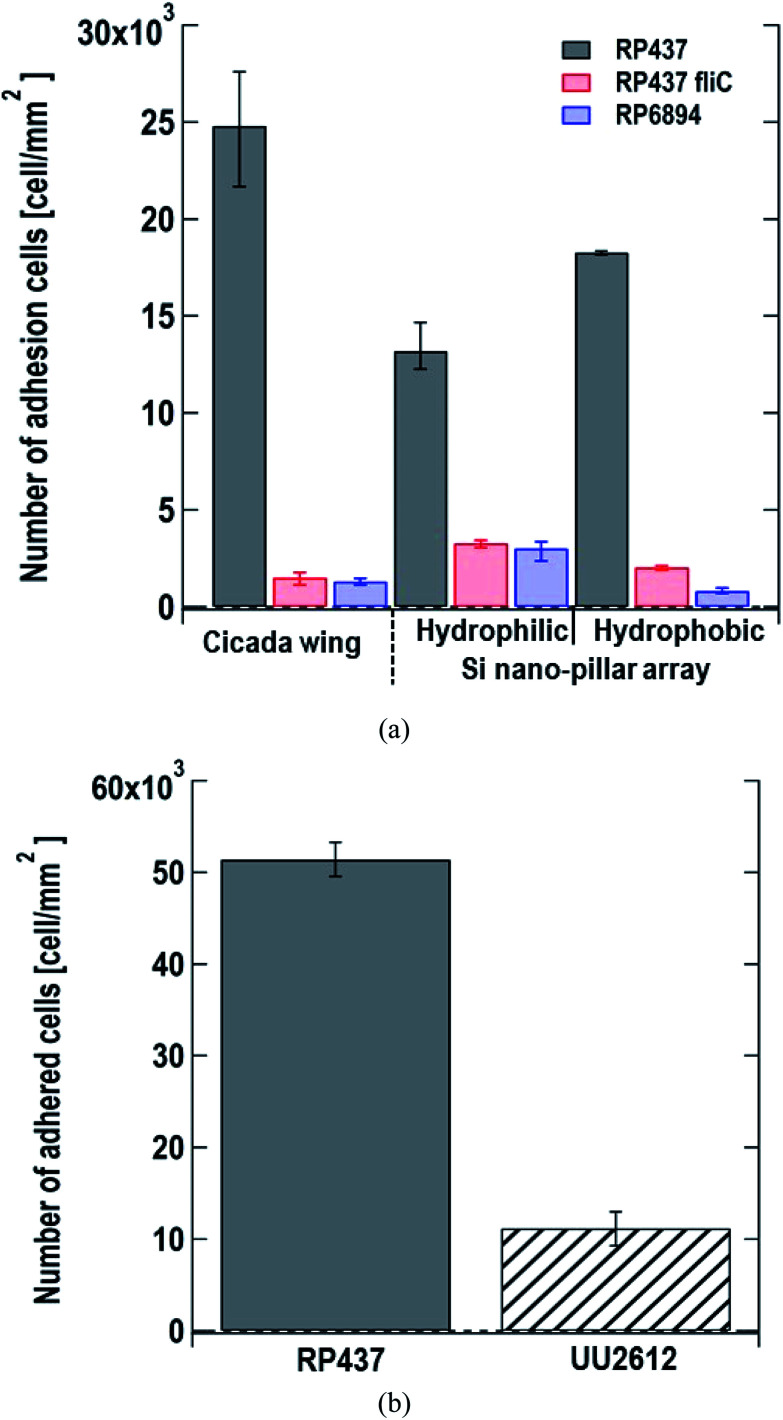
We monitored the changes in the number of E. coli cells adhered to the nanostructured surface by microscopy. We used cicada wings as a natural nanostructured surface and Si nano-pillar array substrates with hydrophilic and hydrophobic surfaces as artificial nanostructured surfaces. Fig. 3(a) shows the number of adhered cells per unit area 60 s after dropping the suspension of three of E. coli strains on the nanostructured surfaces. Here, each data shows the average with error bars (N = 3) by counting adhered cells on different view fields. Gray, red and blue bars represent the strains of E. coli strains RP437 (WT), RP437 fliC, and RP6894, respectively. Our results showed that WT strain cells had higher adherence to each sample than the genetically engineered strains. The WCAs on the cicada wings, hydrophobic Si nano-pillar array, and hydrophilic Si nano-pillar array were 140 ± 2.6°, 78.3 ± 1.3° and 23.1 ± 1.0°, respectively, which suggests that the amount of adhered WT cells increased with the WCA. These results agreed well with our previous report showing that the number of adhered cells on the artificial nanostructured surface increased with WCA.15
Fig. 3. (a) Number of adhered cells per unit area 60 s after dropping the suspension of three E. coli strains on the nanostructured surfaces. Gray, red and blue bars represent E. coli strains, RP437 (WT), RP437 fliC (absence of flagella), and RP6894 (presence of flagella but deficit of motility), respectively. Each data shows the average (N = 3) with error bars. (b) Number of adhered cells per unit area 60 min after dropping the suspension of two E. coli strains on the nanostructured surfaces. Gray and patterned bars represent E. coli strains, RP437 and UU2612 (absence of chemotaxis), respectively. Each data shows the average (N = 3) with error bars.
The number of adhered cells of the non-motile strains (RP437 fliC and RP6894) was higher in hydrophilic surface. These contrasting results in motility and hydrophobicity might indicate that different cell structures interacted with the sample surface in the different strains. For the motile WT strain, flagella may play an important role in cell adhesion, and they prefer to attach to hydrophobic surfaces.15,33 In contrast, the interaction between the cell membrane and hydrophilic nanostructures may be important in non-motile strains, and E. coli is a Gram-negative bacteria whose cell membrane is negatively charged and consequently hydrophilic as mentioned above. Among the non-motile strains, RP6894 had flagella, but they could not move. Therefore, in the non-motile strains, the interaction between the cellular membrane and the sample surface might be preferred to that of the flagella and the sample surface. Moreover, the number of adhered cells in the non-motile strains, RP437 fliC and RP6894, was considerably lower than that in the WT strains. These results show that not only having flagella but also flagellar motility is important for the adhesion to the material surface.
Next, we evaluated the relation between cell adhesion and cellular behavior in terms of motility, directed or undirected, toward nutrients. We compared the WT strain, which moved toward a nutrient-rich environment using chemical sensors and the UU2612 strain, which had a random movement because its chemical sensors were defective. The hydrophobic surface of the Si nano-pillar array substrate was used for the test. Since the cells of the UU2612 strain took a long time to adhere the surface, we counted the number of adhered cells per unit area 60 min after dropping the suspension. The results showed that the number of adhered WT cells was approximately 5 times that of adhered UU2612 cells (Fig. 3(b)), suggesting that directed motility toward nutrients accelerates bacterial adhesion onto the surface. The contribution of motile direction might reflect the fact that WT cells move toward dead cells, which constitute a nutrient source and adhere to the surface of the nanostructure. This directed cell motility called chemotaxis, might be used in the construction of sterile materials by leading bacterial cells efficiently to the nanostructured surfaces.
3.3. Cell membrane damage depended on the E. coli strains
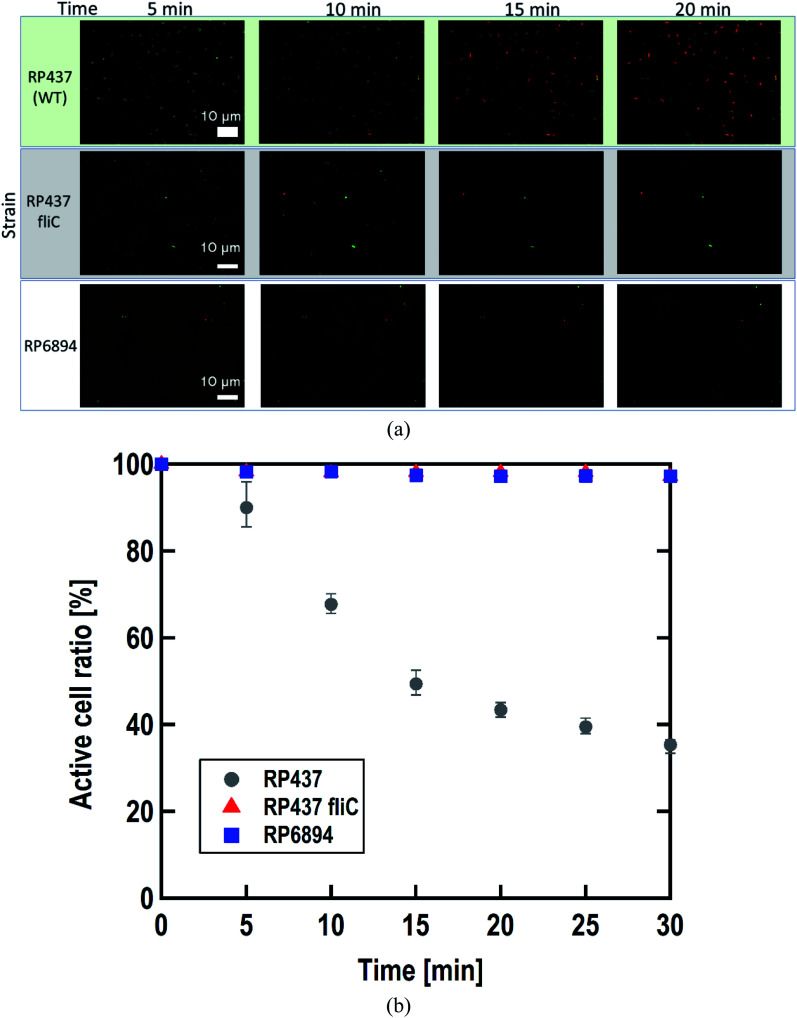
As written above, SYTO 9 diffuses into the cell cytoplasm through the cell membrane and stains DNA green. In contrast, PI enters the cell cytoplasm and stains DNA red when the cell membrane is damaged. Therefore, adhered cells without membrane damage were colored green. Fig. 4(a) shows representative fluorescence microscopy images recorded every 5 minutes, and Fig. 4(b) shows the time-dependent active cell ratio of the hydrophobic nano-pillar array substrate derived from Fig. 4(a), the active cell ratio was calculated using the following equation:
Fig. 4. (a) Representative images obtained by the fluoresce microscopy, recorded every 5 minutes after dropping the suspension of three E. coli strains. (b) Time-dependent active cell ratio of the hydrophobic nano-pillar array substrate dependent on the strains. Gray circles, red triangles, and blue squares represent the strain RP437 (WT), RP437 fliC (absence of flagella), and RP6894 (presence of flagella but deficit of motility), respectively. Each data shows the average (N = 3) with error bars.
Fig. 4(b) clearly shows that the active cell ratio decreased drastically on WT cells but little on RP437 fliC and RP6894 cells. From these results, we concluded that membrane damage strongly depended on bacterial cell motility. We checked the cell membrane damage on the flat Si surface by using WT cells. The time-dependent active cell ratios on the hydrophilic and hydrophobic surface are plotted on Fig. S1(a).† In addition, the time-dependent active cell ratios with/without nano-pillar array on the hydrophobic surface are displayed on Fig. S1(b).† Active cell ratios of WT cells on the flat surfaces rarely decreased without regard to surface wettability, which means that cell membrane was little damaged on the flat surface. These results confirm that the cell membrane damage was occurred on the nanostructure. In addition, we confirmed that the nano-pillars penetrated the cell after the cell membrane damage test as shown in Fig. S2.† This SEM image explained the cell membrane was damaged and deformed.
3.4. Macroscopic antibacterial properties depended on the E. coli strains
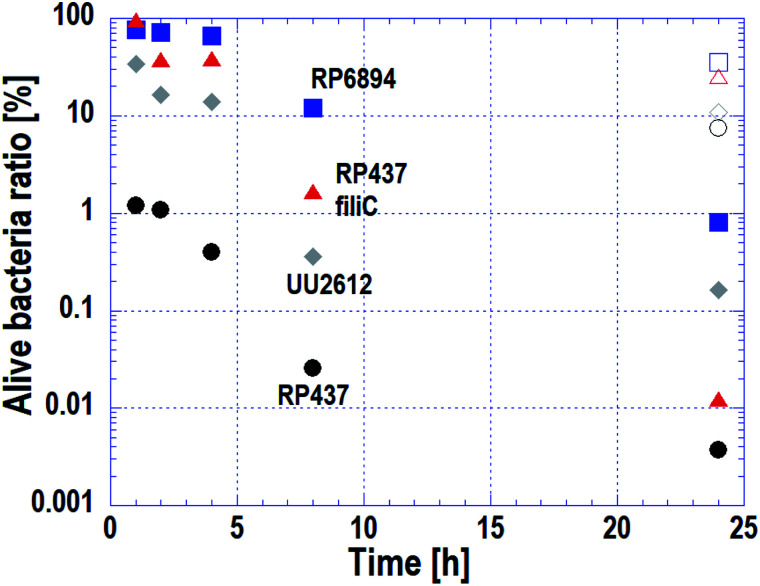
As stated in Subsection 3.3, the cell membrane of motile strains was damaged quickly, whereas cells without motility adhered to the nanostructured surface but cell membrane damage progressed slowly. The macroscopic antibacterial properties on each E. coli strains were evaluated in the long-term. This evaluation is important in terms of industrial applications. The results are plotted on Fig. 5. Circles, triangles, squares and diamonds represent E. coli strains WT (RP437), RP437 fliC, RP6894 and UU2612, respectively. Closed symbols plotted against incubation time show the alive cell ratio obtained on the Si nano-pillar array substrate. Opened symbols show the alive cell ratio after a 24 h incubation obtained on the flat Si substrate, which served as a reference.
Fig. 5. Time-dependent alive cell ratio of four E. coli strains evaluated by the macroscopic bactericidal property test. Circles, triangles, squares, and diamonds represent E. coli strains RP437 (WT), RP437 fliC (absence of flagella), RP6894 (presence of flagella but deficit of motility), and UU2612 (absence of chemotaxis), respectively. Closed symbols plotted against incubation time show the alive cell ratio obtained on the Si nano-pillar array substrate. Opened symbols show the alive cell ratio after a 24 h incubation obtained on the flat Si substrate, which served as a reference.
The alive cell ratio on the flat surface was over 1% for all strains, showing that the Si flat surface did not have antibacterial properties. In contrast, the alive cell ratio on the nanostructured surface for all strains was below 1% after 24 hours of incubation, showing that the nanostructured surface had antibacterial properties against all strains. The alive cell ratio of WT strain was the lowest at every incubation time and reached approximately 1% after 1 hour of incubation.
The alive cell ratio of the RP6894 and RP437 fliC strains decreased gradually and was lower than that of the reference. This behavior is attributed to the motility of the cells because cells without motility adhered to the nanostructure by gravity, it took them a long-time to adhere. The alive cell ratio of the UU2612 strain was lower than that of the RP6894 and RP487 fliC strains before 8 hours. This result could be explained because the UU2612 strain also has the ability to swim toward the nanostructured surfaces. These data indicate that the antibacterial properties of the nanostructured surface depended on cellular motility, in addition to the adhesion properties. Moreover, the alive cell ratio of the UU2612 strain was higher than that of the WT strains before 8 hours. This difference between the strains can be explained by differences in the motile direction as discussed in Subsection 3.2.
In our previous study, we proposed the following model of bactericidal effect of the nanostructured surface: a bacterium searches for its favorite hydrophobic surface relying on sensors present on its flagella. Consequently, the flagella are the first cellular structures to make contact with the nanostructure and adhere to it. Then, the flagella get entangled in the nanostructure, but the cell can still move. Then, the cell hits the nanostructure and suffers abrasions that cause the cell cytoplasm to effuse gradually. Over time, the small abrasions grow into major scars that cause the cytoplasm to effuse drastically. Finally, the cell dies. The proposed mechanism agrees with the results of this study in the case of WT strain. Bandara et al. reported that motility after adhesion is a key point leading to cell death.39 Our results showed that cells without motility died slowly while cells with motility died fast. The results of this study suggest that there are two mechanism of bactericidal nanostructured surfaces, the first depends on bacterial motility as described above, and the second is due to the disruption of the bacterial wall and nanosized bactericidal colloids.40 The bactericidal speed of the later mechanism is lower than that of the first mechanism because it depends on the speed of cell development. Thus, bactericidal speed depended on bacterial motility.
4. Conclusion
We evaluated the adhesion properties of E. coli strains with different behaviors by deleting genes related to cell motility and adhesion. The number of adhered cells with motility defects were markedly lower than that of WT cells with motility. The motile and non-motile strains preferred to adhere to hydrophobic and hydrophilic surfaces, respectively. From these results, we proposed that not only the presence of flagella but also flagellar motility play a role in the adherence to nanostructured surfaces. Moreover, we found that directed movement toward nutrients accelerated the adhesion of the cell to the nanostructured surface. This motile behavior might be applied to sterile materials by collecting bacterial cells efficiently on the nanostructured surfaces. In addition to cell adhesion, we confirmed that bactericidal speed was also dependent on cell motility. From these results, we proposed two bactericidal mechanisms: that the cell membrane is damaged by contact with the nanostructure after the adhesion, and that an imbalance in cellular development leads to cell crash as well as bactericidal colloids.
Conflicts of interest
There are no conflicts to declare.
Supplementary Material
Acknowledgments
This work was partially supported by JSPS KAKENHI Grant Number JP18K19008, CASIO Science Promotion Foundation, and MEXT-Supported Program for the Strategic Research Foundation at Private Universities, “Creation of 3D nano-micro structures and its application to biomimetics and medicine”, 2015–2019.
Electronic supplementary information (ESI) available. See DOI: 10.1039/c9ra08282d
References
- Marambio-Jones C. Hoek E. M. V. A. J. Nanopart. Res. 2010;12:1531–1551. doi: 10.1007/s11051-010-9900-y. [DOI] [Google Scholar]
- Suresh A. K. Pelletier D. A. Wang W. Moon J.-W. Gu B. Mortensen N. P. Alison D. P. Joy D. C. Phelps T. J. Doktycz M. J. Environ. Sci. Technol. 2010;44:5210–5215. doi: 10.1021/es903684r. [DOI] [PubMed] [Google Scholar]
- Azam A. Ahmed A. S. Oves M. Khan M. S. Memic A. Int. J. Nanomed. 2012;7:3527–3535. doi: 10.2147/IJN.S29020. [DOI] [PMC free article] [PubMed] [Google Scholar]
- Oda Y. Kanaoka S. Sato T. Aoshima S. Kuroda K. Biomacromolecules. 2011;12:3581–3591. doi: 10.1021/bm200780r. [DOI] [PubMed] [Google Scholar]
- Ghosh C. Manjunath G. B. Akkapeddi P. Yulagadda V. Hoque J. Uppu D. S. S. M. Konai M. M. Haldar J. J. Med. Biochem. 2014;57:1428–1436. doi: 10.1021/jm401680a. [DOI] [PubMed] [Google Scholar]
- Parhi A. K. Zhang Y. Saizonz K. W. Pradhan P. Kaul M. Trivedi K. Pilch D. S. LaVoie E. J. Bioorg. Med. Chem. Lett. 2013;23:4968–4974. doi: 10.1016/j.bmcl.2013.06.048. [DOI] [PMC free article] [PubMed] [Google Scholar]
- Condell O. Iversen C. Cooney S. Power K. A. Walsh C. Burgess C. Fanning S. Appl. Environ. Microbiol. 2012;78:3087–3097. doi: 10.1128/AEM.07534-11. [DOI] [PMC free article] [PubMed] [Google Scholar]
- Ferreira C. Pereira A. M. Pereira M. C. Melo L. F. Simões M. J. Antimicrob. Chemother. 2011;66:1036–1043. doi: 10.1093/jac/dkr028. [DOI] [PubMed] [Google Scholar]
- Elshaarawy R. F. M. Janiak C. Eur. J. Med. Chem. 2014;75:31–42. doi: 10.1016/j.ejmech.2013.09.029. [DOI] [PubMed] [Google Scholar]
- Tripathy A. Sen P. Su B. Briscoe W. H. Adv. Colloid Interface Sci. 2017;248:85–104. doi: 10.1016/j.cis.2017.07.030. [DOI] [PMC free article] [PubMed] [Google Scholar]
- Ivanova E. P. Hasan J. Webb H. K. Truong V. K. Watson G. S. Watson J. A. Baulin V. A. Pogodin S. Wang J. Y. Tobin M. J. Lobbe C. Crawford R. J. Small. 2012;8:2489–2494. doi: 10.1002/smll.201200528. [DOI] [PubMed] [Google Scholar]
- Ivanova E. P. Hasan J. Webb H. K. Gervinskas G. Juodkazis S. Truong V. K. Wu A. H. F. Lamb R. N. Baulin V. A. Watson G. S. Watson J. A. Mainwaring D. E. Crawford R. J. Nat. Commun. 2013;4:2838. doi: 10.1038/ncomms3838. [DOI] [PMC free article] [PubMed] [Google Scholar]
- Kelleher S. M. Habimana O. Lawler J. O'Reilly B. Daniels S. Casey E. Cowley A. ACS Appl. Mater. Interfaces. 2016;8:14966–14974. doi: 10.1021/acsami.5b08309. [DOI] [PubMed] [Google Scholar]
- Nowlin K. Boseman A. Covell A. LaJeunesse D. Interface. 2014;12:20140999. doi: 10.1098/rsif.2014.0999. [DOI] [PMC free article] [PubMed] [Google Scholar]
- Nakade K. Jindai K. Sagawa T. Kojima H. Shimizu T. Shingubara S. Ito T. ACS Appl. Nano Mater. 2018;1:5736–5741. doi: 10.1021/acsanm.8b01340. [DOI] [Google Scholar]
- Mainwaring D. E. Nguyen S. H. Webb H. Jakubov T. Tobin M. Lamb R. N. Wu A. H.-F. Marchant R. Crawford R. J. Evanova E. P. Nanoscale. 2016;8:6527–6534. doi: 10.1039/C5NR08542J. [DOI] [PubMed] [Google Scholar]
- Bandara C. D. Singh S. Afara I. O. Wolff A. Tesfamichael T. Ostrikov L. Oloyede A. ACS Appl. Mater. Interfaces. 2017;9:6746–6760. doi: 10.1021/acsami.6b13666. [DOI] [PubMed] [Google Scholar]
- Watson G. S. Green D. W. Schwarzkopf L. Li X. Cribb B. W. Myhra S. Watson J. A. Acta Biomater. 2015;21:109–122. doi: 10.1016/j.actbio.2015.03.007. [DOI] [PubMed] [Google Scholar]
- Green D. W. Lee K. K. Watson J. A. Kim H.-Y. Yoon K.-S. Kim E.-J. Lee J.-M. Watson G. S. Jung H.-S. Sci. Rep. 2014;7:41023. doi: 10.1038/srep41023. [DOI] [PMC free article] [PubMed] [Google Scholar]
- Tripathy A. Sreedharan S. Bhaskarla C. Majumdar S. Kumar Peneti S. Nandi D. Sen P. Langmuir. 2017;33:12569–12579. doi: 10.1021/acs.langmuir.7b02291. [DOI] [PubMed] [Google Scholar]
- Michalska M. Gambacorta F. Divan R. Arason I. S. Sokolov A. Noirot P. Laible P. D. Nanoscale. 2018;10:6639–6650. doi: 10.1039/C8NR00439K. [DOI] [PubMed] [Google Scholar]
- Kang S. Pinault M. Pfefferle L. D. Elimelech M. Langmuir. 2007;23:8670–8673. doi: 10.1021/la701067r. [DOI] [PubMed] [Google Scholar]
- Minoura K. Yamada M. Mizoguchi T. Kaneko T. Nishiyama K. Ozminskyj M. Koshizuka T. Wada I. Suzutani T. PLoS One. 2017;12:e0185366. doi: 10.1371/journal.pone.0185366. [DOI] [PMC free article] [PubMed] [Google Scholar]
- Yamada M. Minoura K. Mizoguchi T. Nakamatsu K. Taguchi T. Kameda T. Sekiguchi M. Suzutani T. Konnno S. PLoS One. 2018;13:e0198300. doi: 10.1371/journal.pone.0198300. [DOI] [PMC free article] [PubMed] [Google Scholar]
- Dickson M. N. Liang E. I. Rodriguez L. A. Vollereaux N. Yee A. F. Biointerfaces. 2015;10:021010. doi: 10.1116/1.4922157. [DOI] [PMC free article] [PubMed] [Google Scholar]
- Tripathy A. Pahal S. Mudakavi R. J. Raichur A. M. Varma M. M. Sen P. Biomacromolecules. 2018;19:1340–1346. doi: 10.1021/acs.biomac.8b00200. [DOI] [PubMed] [Google Scholar]
- Han J.-H. Song W.-J. Kang D.-H. J. Appl. Microbiol. 2019;126:1923–1930. doi: 10.1111/jam.14263. [DOI] [PubMed] [Google Scholar]
- Wang X. Devileghere F. Geeraerd A. Uyttendaele M. Int. J. Food Microbiol. 2017;243:70–77. doi: 10.1016/j.ijfoodmicro.2016.12.008. [DOI] [PubMed] [Google Scholar]
- Xi L. Zhang C. Xu P. Wang X. C. J. Environ. Sci. 2018;65:356–366. doi: 10.1016/j.jes.2017.07.006. [DOI] [PubMed] [Google Scholar]
- Friedlander R. S. Vogel N. Aizenberg J. Langmuir. 2015;31:6137–6144. doi: 10.1021/acs.langmuir.5b00815. [DOI] [PubMed] [Google Scholar]
- Ito T. Nakade K. Asai N. Shimizu T. Shingubara S. ECS Trans. 2017;75:1–5. doi: 10.1149/07553.0001ecst. [DOI] [Google Scholar]
- Parkinson J. S. Houts S. E. J. Bacteriol. 1982;151:106–113. doi: 10.1128/JB.151.1.106-113.1982. [DOI] [PMC free article] [PubMed] [Google Scholar]
- Nishino Y. Onoue Y. Kojima S. Homma M. J. Bacteriol. 2015;4:323–331. doi: 10.1002/mbo3.240. [DOI] [PMC free article] [PubMed] [Google Scholar]
- Zhou Q. Ames P. Parkinson J. S. Mol. Microbiol. 2011;80:596–611. doi: 10.1111/j.1365-2958.2011.07577.x. [DOI] [PMC free article] [PubMed] [Google Scholar]
- Schneider C. A. Rasband W. S. Eliceiri K. W. Nat. Methods. 2012;9:671–675. doi: 10.1038/nmeth.2089. [DOI] [PMC free article] [PubMed] [Google Scholar]
- Abramoff M. D. Magalhães P. J. Ram S. J. Biophot. Int. 2004;11:36–42. [Google Scholar]
- Bouhss A. Trunkfield A. E. Bugg T. D. H. Mengin-Lecreulx D. FEMS Microbiol. Rev. 2008;32:208–233. doi: 10.1111/j.1574-6976.2007.00089.x. [DOI] [PubMed] [Google Scholar]
- Zhou J. Fazzio R. T. Blair D. F. J. Mol. Biol. 1995;251:237–242. doi: 10.1006/jmbi.1995.0431. [DOI] [PubMed] [Google Scholar]
- Bandara C. D. Singh S. Afara I. O. Wolff A. Tesfamichael T. Ostrikov K. Oloyede A. ACS Appl. Mater. Interfaces. 2017;9:6746–6760. doi: 10.1021/acsami.6b13666. [DOI] [PubMed] [Google Scholar]
- Kenawy E.-R. Worley S. D. Broughton R. Biomacromolecules. 2007;8:1359–1384. doi: 10.1021/bm061150q. [DOI] [PubMed] [Google Scholar]
Associated Data
This section collects any data citations, data availability statements, or supplementary materials included in this article.


