

Abstract
The conversion of carbonyl compounds into alcohols or their derivatives via the catalytic transfer hydrogenation (CTH) process known as Meerwein–Ponndorf–Verley reduction is an important reaction in the reaction chain involved in biomass transformation. The rational design of efficient catalysts using natural and renewable materials is critical for decreasing the catalyst cost and for the sustainable supply of raw materials during catalyst preparation. In this study, a novel hafnium-based catalyst was constructed using naturally existing tannic acid as the ligand. The prepared hafnium–tannic acid (Hf–TA) catalyst was characterized by scanning electron microscopy (SEM), transmission electron microscopy (TEM), X-ray diffraction (XRD), Fourier transform infrared spectroscopy (FTIR), and thermogravimetry (TG). Hf–TA was applied in the conversion of furfuraldehyde (FD) to furfuryl alcohol (FA) using isopropanol (2-PrOH) as both the reaction solvent and the hydrogen source. Both preparation conditions and the effects of the reaction parameters on the performance of the catalyst were studied. Under the relatively mild reaction conditions of 70 °C and 3 h, FD (1 mmol) could be converted into FA with a high yield of 99.0%. In addition, the Hf–TA catalyst could be reused at least ten times without a notable decrease in activity and selectivity, indicating its excellent stability. It was proved that Hf–TA could also catalyze the conversion of various carbonyl compounds with different structures. The high efficiency, natural occurrence of tannic acid, and facile preparation process make Hf–TA a potential catalyst for applications in the biomass conversion field.
A novel and efficient Hf–TA catalyst was constructed using sustainable plant-derived tannic acids (TA) as the raw material to catalyze the hydrogenation of carbonyl compounds.
Introduction
During the catalytic conversion of biomass, the hydrogenation of carbonyl compounds into alcohols or their derivatives is an important reaction step. The catalytic transfer hydrogenation (CTH) process also known as Meerwein–Ponndorf–Verley (MPV) reduction using isopropanol as the hydrogen source is commonly used. Various catalysts, such as Ni,1 Co–Pd,2 Cu,3 Ru,4,5 Fe,6 Ir,7 beta zeolite,8 and Pd,9 have been applied for the CTH reaction of carbonyl compounds. The common transition metal-based catalysts often suffer from complex preparation processes and high reaction temperatures.10,11 Generally, noble metal-based catalysts perform well under milder conditions, but their costs are often high. In recent years, the use of zirconium-based catalysts, such as ZrO2,12 Zr–lignosulfonate polyphenolic polymers,13 ZrO(OH)2,14 Zr-SBA-15,15–17 Zr-PhyA,18 Zr-SRf,19 Zr-MOF,20,21 and Zr-beta,22,23 has attracted great attention. These catalysts have high efficiency for hydrogen transfer in biomass-derived carbonyl compounds under relatively milder conditions. Recently, hafnium-based catalysts were developed with even higher efficiencies than those of Zr-based catalysts under mild conditions for the CTH reactions.13 For example, Corma et al. reported hafnium-based metal–organic frameworks (MOFs) for the CTH of furfuraldehyde in isopropanol (2-PrOH), with which a 97% yield of furfuryl alcohol was obtained.24 Song et al. found that the CTH reaction of levulinic acid and its ester to produce γ-valerolactone could proceed over a hafnium-based catalyst prepared using an amino tri(methylene phosphonic acid)-containing phosphate group.25 Wu et al. discovered that a phosphonate-hafnium solid catalyst played a key role in the transfer hydrogenation of ethyl levulinate (EL) to γ-valerolactone (GVL).26 Zhang and coworkers designed a hafnium-based DUT-67 (Zr6O6(OH)2(tdc)4(Ac)2) catalyst that enhanced the efficiency of the CTH of EL to GVL.27 In spite of the effectiveness of these catalysts, several obstacles still exist and need to be overcome. These include low stability of the catalyst, high reaction temperature, long reaction time and high preparation temperature. Besides, the organic ligands developed for the preparation of hafnium-based catalysts are still very limited, and most of the reported hafnium catalysts are prepared using carboxyl group-containing functional chemicals, which are often obtained from fossil resources. A few reports have focused on the construction of hafnium catalysts for the hydrogenation reaction using phenolic hydroxyl groups. Therefore, exploring novel organic ligands, especially those derived from renewable biomass resources, is highly desirable for the construction of hafnium-based catalysts.
Tannic acids (or tannins, TA) as naturally existing macromolecules, often derived from a variety of plants, including monocots, dicots and ferns.28 Depending on their structure and properties, tannins can be classified into two major groups, hydrolysable and condensed tannins. Commercially, hydrolysable tannins are extracted from Chinese gall, Sicilian sumac leaves, Turkish gall, Tara pods, myrobalan nuts and chestnuts.29 Hydrolysable tannins contain abundant phenolic hydroxyl groups in their structures.20 It has been proven that the hydroxyl group on the benzene rings in TA can coordinate with metal ions.30 Bulut et al. used the OH groups in TA to reduce Ag+ to Ag0, producing silver nanoparticles with average sizes between 40–70 nm.31 Sahiner et al. used TA as a biopolymer to obtain poly(TA) (p(TA)) microgels by cross-linking TA with trimethylolpropane triglycidyl ether (TMPGDE) in a water-in-oil microemulsion system.32 Most tannins have multiple hydroxyl groups, and can combine metal ions through coordination interaction. Therefore, TA is an excellent candidate for the construction of organic–inorganic hybrid catalysts.
In this work, TA was used as an organic ligand to construct a hafnium-based catalyst. The prepared Hf–TA catalyst was applied in the CTH reaction of biomass-derived carbonyls with isopropanol (2-PrOH) as the hydrogen source and solvent (Scheme 1). Both the preparation conditions and the effects of the reaction parameters on the performance of the catalyst were studied. The prepared Hf–TA catalyst exhibited high activity and stability for the CTH reaction of furfuraldehyde (FD), as well as other carbonyl compounds with different structures. With the advantages of high efficiency and the sustainable supply of TA, the Hf–TA catalyst may find potential applications in CTH reactions implicated in the field of biomass conversion.
Scheme 1. (a) The structure of tannin acids (TA) and (b) the preparation procedure of the Hf–TA catalyst.

Material and methods
Materials
Furfuraldehyde (FD, 99%), furfuryl alcohol (FA, 98%), isopropyl alcohol (2-PrOH, 99.9%), tannic acid (TA, 98%), N,N-dimethyl formamide (DMF, 99.9%), hafnium chloride (HfCl4, ≥98%), n-decane (98.5%), aluminum chloride (AlCl3, 99%), iron chloride (FeCl3, ≥99.9%), copper chloride (CuCl2, 98%), tin chloride (SnCl4, 99%) and chromium chloride (CrCl3, 98%) were purchased from Beijing Innochem Technology Co. Ltd. Ethyl levulinate (EL, 99%) and γ-valerolactone (GVL, 98%) were bought from Beijing J&K Scientific Ltd. Trimethylamine and ethyl alcohol were obtained from the Beijing Institute of Chemical Reagents. Ethanol (AR) and triethylamine (AR) were obtained from Sinopharm Reagent Co. Ltd.
Preparation of the catalysts
The catalyst developed in this work was prepared as follows. HfCl4 (4 mmol) and TA (0.5 mmol) were added into DMF (100 mL) and stirred until completely dissolved. Then, triethylamine (37.5 mmol) was dissolved into DMF (40 mL). Next, the solution of trimethylamine was added dropwise in the mixed solution of TA and HfCl4 and stirred for 3 h at room temperature, which played the role of deprotonation of the TA linker.33 Then, the mixtures were aged under static conditions at 60 °C for 5 h. Finally, the light brown precipitate was separated by filtration, thoroughly washed with DMF and ethanol, dried at 80 °C under vacuum for 20 h, and then, ground into powder for use (denoted as Hf–TA). The ratios of the hafnium precursor and trimethylamine to TA were varied to optimize the preparing condition of the catalyst. Similar preparation processes were adopted for the other M–TA catalysts (M = Zr, Al, Fe, Cr, Sn, and Cu).
Catalyst characterization
Scanning electron microscopy (SEM) was conducted using a Hitachi SU8220 scanning electron microscope operated at 20 kV and equipped with an energy dispersive spectrometer (EDS) apparatus. The transmission electron microscopy (TEM) images were captured using a JEOL JEM-2010 instrument. The Hf elemental composition in Hf–TA was determined by inductively coupled plasma-optical emission spectroscopy (ICP-OES) on a PerkinElmer optimum 5300 DV instrument. The X-ray diffraction (XRD) patterns of the powder were collected on a Rigaku D/tex Ultra 250 X-ray diffractometer using Cu Kα (λ = 0.154 nm) radiation in the 2θ range from 5° to 130°. The Fourier transform infrared (FT-IR) spectra were obtained using a Nexus 870 spectrometer, and the samples were prepared by the KBr pellet method in the wavenumber range of 400–4000 cm−1. The thermal property of solid samples was investigated by thermogravimetry (TG) analysis on a HENVEN instrument under N2 at a flow rate of 25 °C min−1 in a programmed temperature range of 25–900 °C and a heating rate of 10 °C min−1. X-ray photoelectron spectroscopy (XPS) analysis was carried out on a ThermoScientific ESCALAB 250Xi spectrometer, and the C 1s orbital (284.6 eV) was used to correct the binding energies. The acidity property of the catalyst was studied via the temperature-programmed desorption of NH3 (NH3-TPD) using a Micromeritics AutoChem II 2920 chemisorption analyzer coupled with a thermal conductivity detector. Briefly, 100 mg of the sample was degassed at 150 °C for 2 h and cooled to 50 °C under 10 mL min−1 He. NH3 was adsorbed for 1 h, after which He (50 mL min−1) was introduced to purge the system and remove physically adsorbed NH3 for 1 h. The resulting sample was heated to 250 °C at a rate of 10 °C min−1 under a He flow of 50 mL min−1.
In the present study, the prepared Hf–TA catalyst was used to catalyze the conversion of furfuraldehyde (FD) to furfuryl alcohol (FA). The reaction was conducted in a 10 mL Teflon-lined stainless steel autoclave equipped with a magnetic stirrer. A mixture of 1.0 mmol FD, 5 mL 2-PrOH, and 200 mg catalyst was added into the autoclave and placed into a pre-heated oil bath at a set temperature of 70 °C. After the reactor was sealed, the reaction mixture was stirred at the desired temperature for the desired time. When the reaction was complete, the reactor was cooled down using ice water to quench the reaction, and the reaction solution was transferred and diluted with 2-PrOH. The products were analyzed quantitatively using a gas chromatography (GC, Techcomp 7900) system equipped with a flame ionization detector (FID) and using decane as the internal standard (42.7 mg). Substrate conversion, product yield and selectivity were calculated according to the product analysis methods presented in the ESI.† The products were identified by GC-MS (Agilent 7890B-7000D), as well as by comparing the retention times with the respective standards in GC traces. In order to investigate the heterogeneity of the catalyst, the solid catalysts were removed from the reaction mixture by centrifugation after reacting for a certain period of time, and the supernatant obtained after separation was allowed to react to determine if the product yield of the reaction continued to increase in the absence of the solid catalyst. To check the reusability of Hf–TA, the catalyst was recovered by centrifugation and washed with 2-PrOH (5 mL × 3 times). After drying under vacuum at 80 °C for 20 h, the recovered catalyst was reused for the next cycle.
Results and discussion
Catalyst screening and characterization
Firstly, the preparation conditions of the catalyst were investigated in this study. The catalysts were prepared using different mole ratios of tannic acid and hafnium chloride, including 1 : 2, 1 : 4, 1 : 6, 1 : 8, and 1 : 10. The results are shown in Fig. 1a. The performance of the Hf–TA catalyst prepared using a 1 : 8 mole ratio of TA and HfCl4 was higher than those of the other Hf–TA catalysts. Trimethylamine played a key role in the preparation of the catalyst. It can be seen from Fig. 1b that the catalytic activity of the catalysts increased with the content of triethylamine. The molar ratio of 1 : 75 for tannic acid and triethylamine was selected to prepare the catalyst. Fig. 1c shows the influence of the solvent used in the preparation process on the activity of the catalyst. The conversion of FD and the yield and selectivity of FA of the catalyst prepared using DMF as the solvent were obviously higher than those of the catalyst prepared using water. Fig. 1d shows the performance of the Hf–TA catalyst under different aging times. It could be seen that the conversion was the highest when the aging time was 5 h. Thus, Hf–TA prepared under the conditions of 1 : 8 molar ratio of TA to HfCl4 1 : 8, 1 : 75 molar ratio of TA to triethylamine, DMF as the solvent, and aging under 60 °C for 5 h was characterized and used for further studies.
Fig. 1. Effects of the preparation conditions on the performance of the as-prepared Hf–TA catalyst, different molar ratios of tannic acid : HfCl4 (a), molar ratios of tannic acid : triethylamine (b), preparation of catalyst solvent types (c), aging time (d). Reaction conditions: FD 1 mmol, 2-PrOH 5 mL, catalyst 200 mg, reaction temperature 70 °C, reaction time 5 h (a–c), reaction time 1 h (d).

The prepared Hf–TA sample was characterized by SEM, TEM, XRD, and SEM-EDS, as shown in Fig. 2 and S1.† From the SEM and TEM images, it could be seen that Hf–TA was composed of spherical particles34 with an average particle size of around 68.4 nm. EDS mapping characterization showed that the elements Hf, O, and C were distributed uniformly in the catalyst (Fig. S1†). The Hf content in Hf–TA was detected by ICP-OES, and the composition of Hf–TA was analyzed by elemental analysis. The results showed that the elemental contents were 39.0 wt% Hf, 33.2 wt% C, 26.8 wt% O, and 1.0 wt% H, and thus the chemical formula of Hf–TA could be speculated approximately to be Hf6C76O46H2. The powder XRD pattern (Fig. 2c) indicated that Hf–TA had low crystallinity, probably due to the irregular connectivities of Hf–TA and the non-uniform structure of the TA molecules.35 The specific surface area and pore structure were analyzed by the nitrogen adsorption–desorption isotherms (Fig. 2c–e). The result showed that Hf–TA was porous with mesopores and micropores centered at about 30 nm and 0.8 nm, respectively. The BET specific surface area, average pore size, and average pore volume of Hf–TA were calculated to be 87.7 m2 g−1, 12.8 nm, and 0.28 cm3 g−1, respectively. The micropores could have formed from the skeleton structure of TA, and the mesopores of Hf–TA might have been caused by the gap between the aggregated particles.36
Fig. 2. (a) SEM image, (b) TEM image, (c) powder XRD patterns, (d) nitrogen adsorption–desorption isotherm, (e) the pore size distribution of mesopores, and (f) the pore size distribution of micropores of Hf–TA.

As shown in Fig. 3, the chemical state of the Hf species in Hf–TA was examined by XPS and compared with that in HfO2. The binding energy values of Hf 4f and O 1s in Hf–TA were higher than those in HfO2, inferring higher positive charge on the Hf atoms in TA–Hf, which would result in stronger Lewis acidity.37 The FT-IR spectra of TA and Hf–TA displayed the interaction mode between TA and Hf (Fig. 3c). The bending vibration of the hydroxyl group at 1318 cm−1 and the breathing vibrations of the aromatic ring at 1612 and 1533 cm−1 had blue-shifted to 1364, 1658, and 1585 cm−1 in Hf–TA,35 respectively. The absorption peaks at 1201 and 1084 cm−1 originated from the vibration of the substituted benzene rings.38,39 Compared to TA, the intensity of the C–OH stretching or –OH bending peak at 1028 cm−1 decreased, implying the combination of Hf4+ with the organic ligand.40,41 On the other hand, the peak at 1499 cm−1 corresponded to –N–CH3 stretching.42 The characteristic peak of the C–N bonds was observed for Hf–TA, indicating that the solvent DMF was not completely removed during the catalyst preparation process.42,43 The bands around 758 and 835 cm−1 were assigned to the Hf–O bonds in Hf–TA.44,45 Although the characteristic band of the Hf–O bond in Hf–TA at 758 cm−1 partially overlapped with that of the phenyl ring vibration (742 cm−1), the distinct blue-shift of the band from 669 cm−1 in HfO2 to 693 cm−1 in Hf–TA showed the existence of the Ar–O–Hf bonds, i.e. Hf4+ had connected with the phenolic hydroxyl groups in TA.46 TG analysis was conducted to study the thermal stability of TA and Hf–TA in the range of 50–750 °C. The thermal decomposition of TA could be divided into three stages. Below 203 °C, the weight loss was 3% and most probably due to the loss of bound water and organic solvents, and the weight loss between 203 and 300 °C was due to the decomposition of oxygen-containing functional groups, such as the hydroxyl and ester groups.46–50 Beyond 300 °C, tannic acid continued to break down and was carbonized.51 As seen in Fig. 3d, the TG result indicated that the introduction of Hf metal salts increased the thermal stability of the TA compound, and the Hf–TA catalyst was stable enough at the reaction temperature (<100 °C).
Fig. 3. XPS spectra of (a) Hf 4f and (b) O 1s in Hf–TA and HfO2, and (c) FT-IR and (d) TG of TA and the prepared Hf–TA catalyst.

Several different metal ions that are commonly used to construct MPV catalysts according to the literature were also prepared.25 As observed from Table S1,† the prepared Hf–TA catalyst showed the best catalytic activity (Table S1,† entry 1), with an FD conversion of 97.2%, a yield of 96.2% and selectivity of 98.9% at 70 °C in a reaction time of 5 h. For comparison, other metal (Zr, Al, Cr, Sn, Fe, Cu)–TA ligands with similar structural characteristics were synthesized.18 Al–TA (Table S1,† entry 3), Cr–TA (Table S1,† entry 4), Sn–TA (Table S1,† entry 5), Fe–TA (Table S1,† entry 6) and Cu–TA (Table S1,† entry 7) exhibited low activity for the CTH reaction of FD to FA. The Zr–TA catalyst (Table S1,† entry 2) showed moderate activity with an FD conversion of 62.6% and an FA yield of 45.4%. Hf(OH)4 showed the lowest activity with an FA yield of 1.0% (Table S1,† entry 10), while HfO2 showed an FA yield of 4.0%, and HfCl4 showed an FA yield of 3.6%. The strong acidic property of HfCl4 led to poor selectivity for the reaction under identical reaction conditions due to the formation of humins.24 The results in Table S1† indicated that Hf–TA was highly efficient in FA production via the MPV reduction (CTH reaction) of FD.
The prepared Hf–TA catalyst was compared with analogues reported in the literature (Table 1). The Hf–TA catalyst (Table 1, entries 1–2) performed well under much milder conditions than the other Hf- or Zr-based catalysts (Table 1, entries 3–9). Compared with other hydrogenation catalysts, the prepared Hf–TA catalyst showed higher TOF (5.6 h−1) at a lower temperature (70 °C) (Table 1, entry 1). These results in Table 1 indicated that Hf–TA could catalyze the CTH reaction of FD under mild conditions with high efficiency.
MPV reaction of FD to FA catalyzed by various catalysts.
| Entry | Catalysts | T (°C) | t (h) | Conversion (%) | Yield (%) | Selectivity (%) | TOFc (h−1) | Ref. |
|---|---|---|---|---|---|---|---|---|
| 1a | Hf–TA | 50 | 10 | 81.2 | 80.3 | 98.9 | 1.4 | This work |
| 2b | Hf–TA | 70 | 3 | 96.2 | 94.8 | 98.5 | 5.6 | This work |
| 3 | PhP–Hf | 120 | 2 | 99.2 | 97.6 | 98.4 | 1.7 | 46 |
| 4 | FDCA–Hf | 100 | 2 | 100 | — | >99 | 4.7 | 35 |
| 5 | Zr–LS | 80 | 3 | 97 | 96 | 97 | 0.3 | 13 |
| 6 | Zr–HAs | 70 | 9 | 98.0 | 80.0 | 81.6 | 0.04 | 47 |
| 7 | Hf-MOF-808 | 100 | 2 | — | 97 | — | 5.2 | 24 |
| 8 | MZCCP | 140 | 2 | 99.9 | 98.2 | 98.2 | 0.95 | 52 |
| 9 | BZC | 80 | 5 | 97.7 | 96.7 | 98.9 | 0.4 | 53 |
Reaction conditions: furfuraldehyde 1 mmol, 2-PrOH 5 mL, catalyst 100 mg.
Reaction conditions: furfuraldehyde 1 mmol, 2-PrOH 5 mL, catalyst 200 mg.
TOF is defined as mol (main product)/[mol (total metal added) × h (time)].
Subsequently, the effects of the reaction conditions on the performance of Hf–TA were investigated (Fig. 4). It could be seen that both catalyst dosage and the temperature had a significant influence on the performance of Hf–TA. As shown in Fig. 4a, with increasing catalyst dosage, both conversion and yield increased obviously, which was contributed to the increasing number of available catalytic sites during the reaction.25 As seen in Fig. 4b, the conversion, selectivity, and yield increased with an increase in the reaction temperature. In order to both shorten the reaction time and reduce energy consumption, it seemed that the reaction temperature of 70 °C was high enough under the present conditions. Therefore, we chose an Hf–TA dosage of 0.2 g and 70 °C reaction temperature to study the effect of reaction time. From Fig. 4c, it is evident that the conversion and yield of the reaction increased almost linearly with the reaction time within the initial 2 h, indicating that the reaction proceeded fast in the initial stage. After 2 h, the increase in conversion and yield was not very obvious, and nearly all of the substrate could be converted at 3 h.
Fig. 4. The effects of reaction parameters on the performances of Hf–TA: (a) the amount of catalyst, (b) reaction temperature, and (c) reaction time. Typical reaction condition: FD 1 mmol, 2-PrOH 5 mL, other conditions as shown in the figures.

The reusability and heterogeneity of Hf–TA in the catalytic reaction process were investigated (Fig. 5). It could be seen that there was no obvious decrease in FD conversion, FA yield, and selectivity after ten cycles compared to the first (Fig. 5a). Interestingly, the activity of Hf–TA increased gradually in the initial three cycles. To disclose the possible reasons for the increase in activity, fresh and recycled Hf–TA catalysts were characterized. Based on SEM (Fig. S2a†) and TEM (Fig. S2b†) characterization, the morphology of the recycled catalysts had no obvious changes. XRD indicated that the skeleton structure was maintained well after reuse, as shown in Fig. S3a.† The BET surface areas and pore structures of the fresh and recycled Hf–TA catalysts are compared in Table S2.† The BET surface area of the recycled catalyst showed a slight decrease compared with that of the fresh sample. The Hf 4f and O 1s XPS spectra (Fig. S4†) showed that the chemical states of the elements Hf and O had no obvious changes after the reaction. FTIR analysis (Fig. 6a) showed that the NH2 stretching vibration (1560 cm−1) and C–N stretching vibration (1454 cm−1) of DMF were obvious for fresh Hf–TA,42,54,55 but they were found to weaken and gradually disappear after 3 reuses. TG indicated that the weight loss of the fresh catalyst was slightly higher than that of the reused catalysts under identical temperatures (Fig. 6b). In combination with the FTIR result of the fresh catalyst (Fig. 6a), it was inferred that there was DMF residual in the pore structures of the catalyst after preparation, and the residual DMF was hard to be completely removed during the drying process. During the initial uses, the residual DMF in the pore structures could be replaced by 2-PrOH gradually, and more active sites could contact 2-PrOH, leading to an increase in activity. The conversion and yield decreased slightly with the increasing of after the 4th use, and it could be attributed to the catalyst loss during the centrifugation recycling processes. The performance for the 10th use was still better than that for the first use. The heterogeneity of the catalyst was also studied. The reaction was stopped at 0.5 h by removing the solid catalyst from the reaction mixture, and the solution was allowed to react under the same reaction conditions to see if the FA yield further increased without the solid catalyst. However, there was no further increase in the FA yield after the solid catalyst was removed (Fig. 5b). The Hf contents in the fresh and recycled catalysts were analyzed by ICP-OES, and there was no obvious decrease after recycling (Table S2†). This result confirmed that the active sites in Hf–TA did not leach into the reaction mixture, and it was a heterogeneous catalytic process. Based on the above results, the prepared Hf–TA catalyst exhibits excellent stability in terms of both structure and performance during the recycling process.
Fig. 5. (a) Reusability and (b) heterogeneity of the Hf–TA catalyst. Reaction conditions: FD 1 mmol, 2-PrOH 5 mL, catalyst 200 mg, reaction temperature 70 °C, reaction time 0.5 h, and DMF solvent.

Fig. 6. (a) FT-IR spectra of the fresh Hf–TA and recycled Hf–TA catalysts after 1, 3 and 10 cycles; (b) TG curves of the fresh Hf–TA and recycled Hf–TA catalyst after 10 cycles.

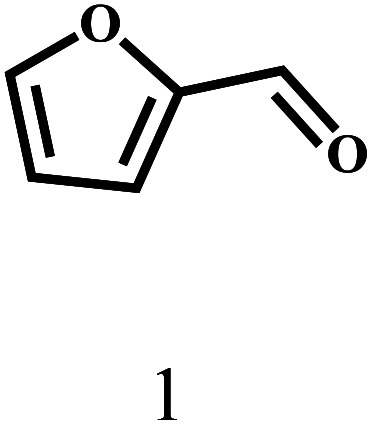
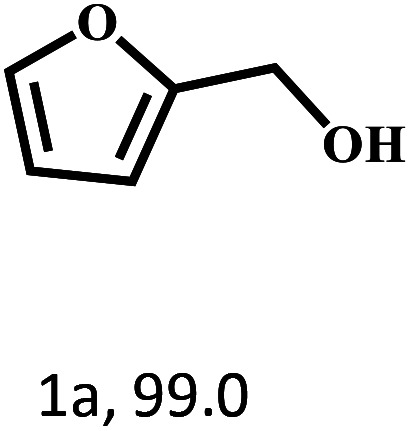
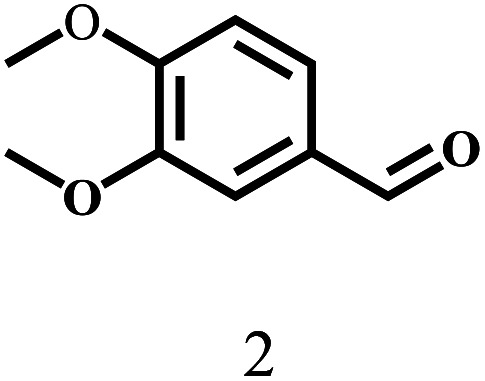
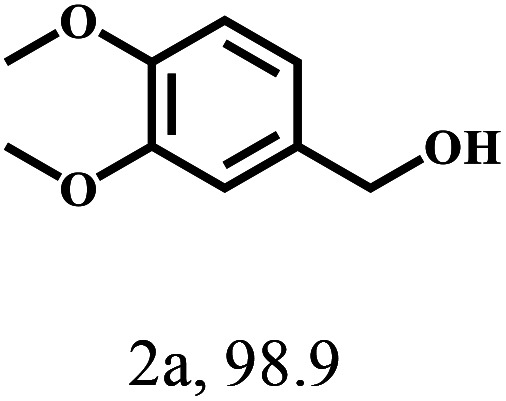
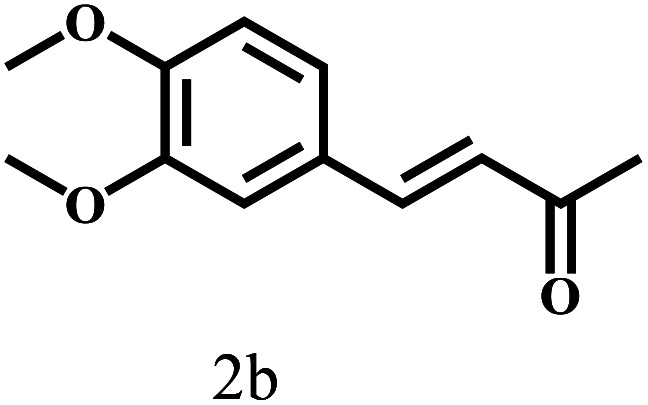
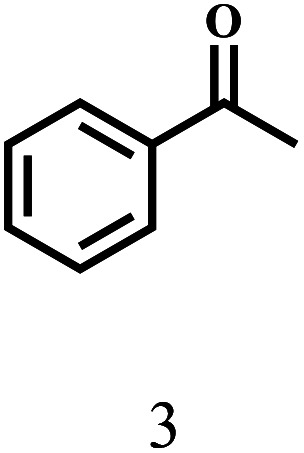
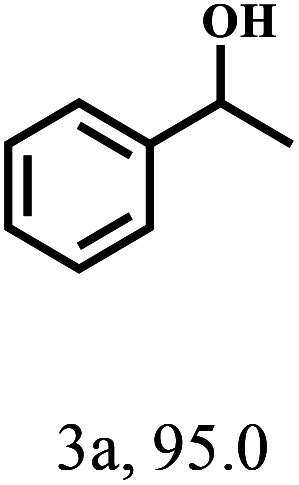
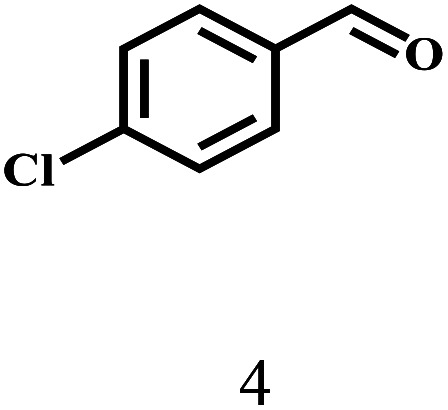
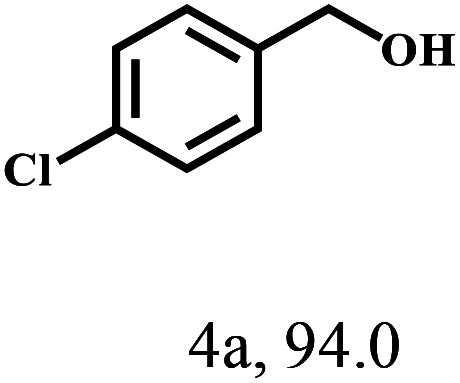
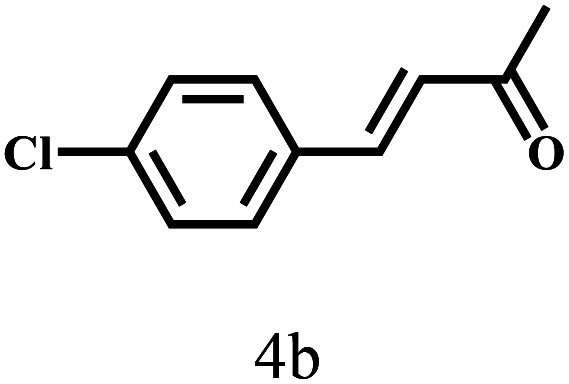
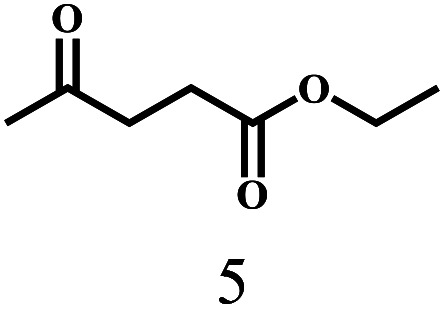
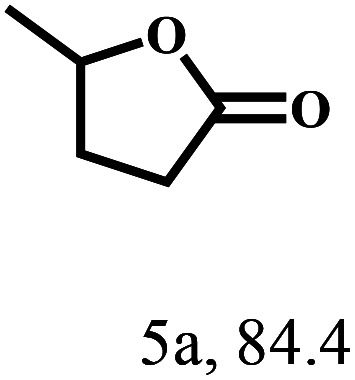
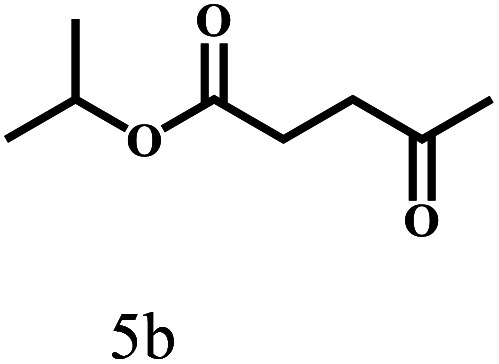
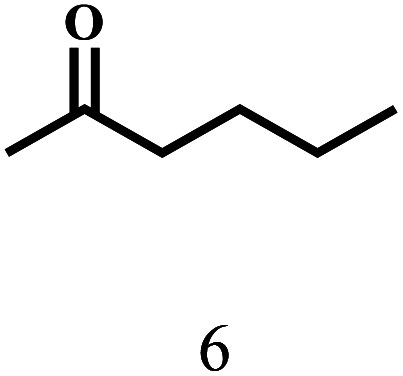
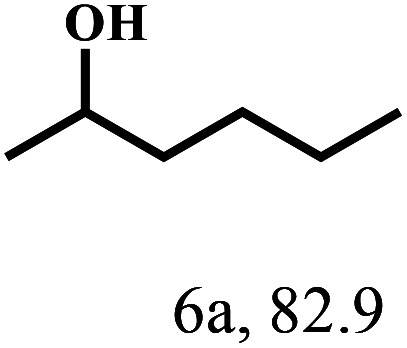
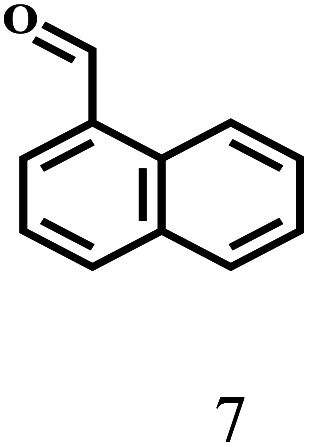
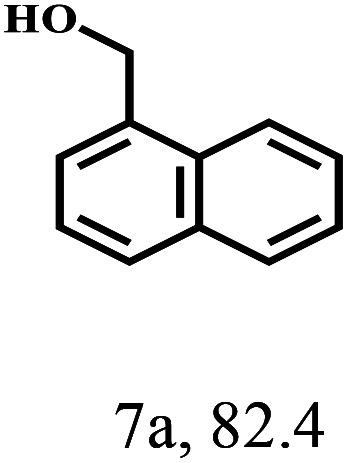
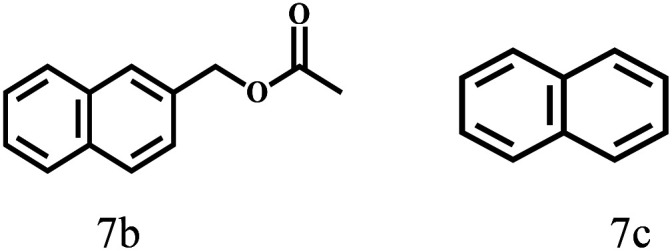
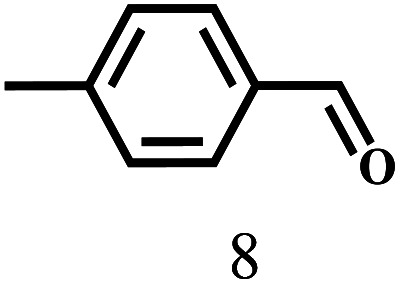
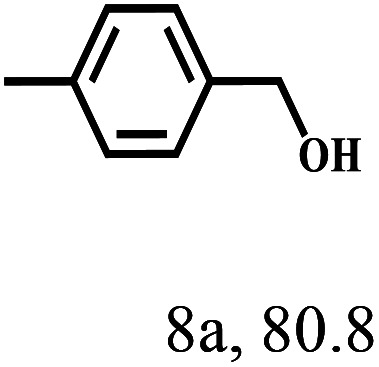
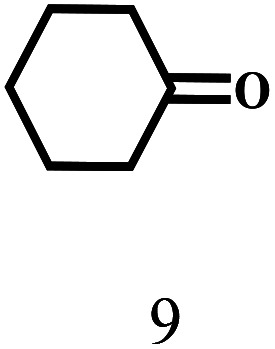
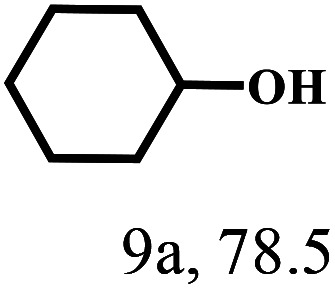
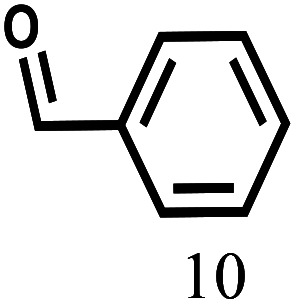
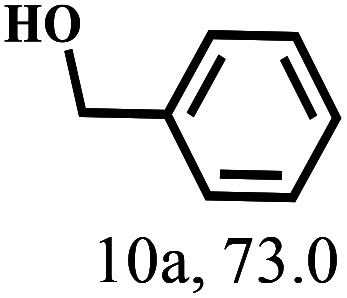
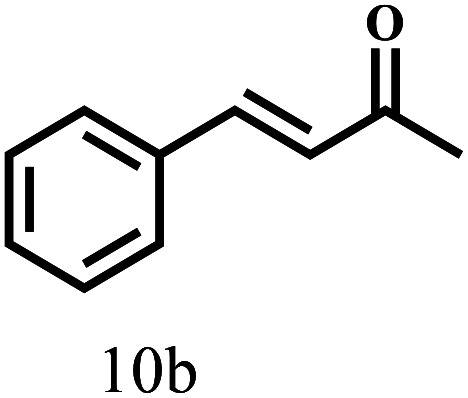
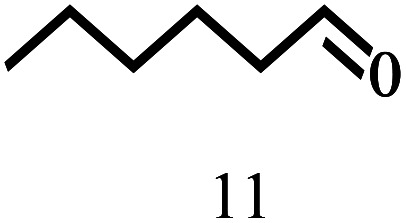
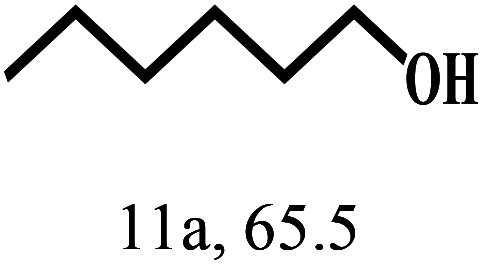
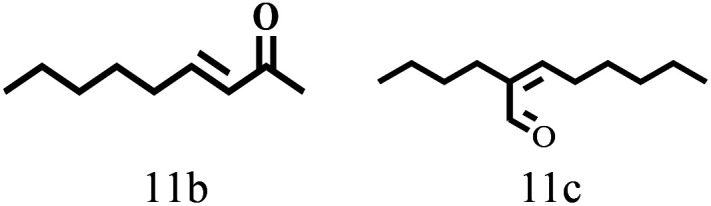
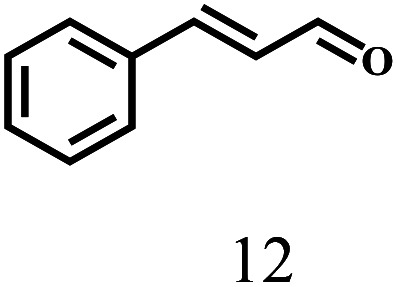
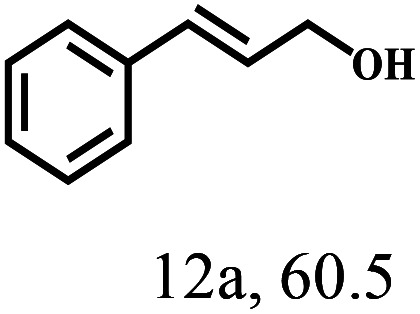
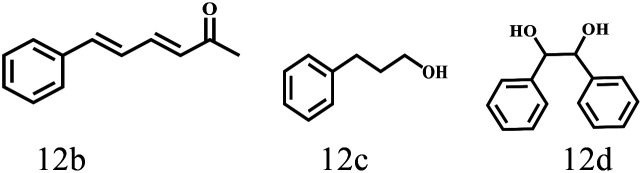
Besides FD, the highly efficient MPV reduction of other carbonyl compounds is also of great significance. In order to broaden the substrate scope, the CTH reactions of different substrates were investigated with the prepared Hf–TA catalyst. The structures of the products were analyzed by GC-MS. As shown in Table 2, it could be seen that Hf–TA could catalyze the CTH reactions of all the substrates studied, but the product distribution was different for different substrates. For the conversion of FD, no obvious byproducts were detected using GC-MS. For veratraldehyde (Table 2, entry 2), phenylacetaldehyde (Table 2, entry 3), and 4-chlorobenzaldehyde (Table 2, entry 4), high yields of 98.9%, 95.0%, and 94.0% were obtained, respectively. For substrates 2 and 4, small amounts of byproducts formed by the aldehyde–ketone condensation of the reactant with the co-product acetone were detected, while for the main products 2a and 4a, yields higher than 90% were achieved. Similar byproducts were also detected for a few other substrates (10, 11 and 12). For by-product 12c, it was probably to imply that the cinnamaldehyde molecule containing conjugated C C and C O group had the strongest adsorption on Ar–O–Hf sites, followed by the hydrocinnamaldehyde molecule containing an isolated C O group and further being hydrogenated into 12c.56 It has been reported that the introduction of electron-withdrawing substituents in benzaldehyde causes a change in the reduction rate,57 which could be inferred from Table 2 (entries 4, 8 and 10). For EL, product 5a and by-product 5b were produced from the hydrogenation and transesterification of EL with 2-PrOH, respectively, in the reaction process.24,58 The reaction was also tested with 2-hexanone (Table 2, entry 6), and the yield of 2-hexanol (6a) was 82.9%. The hydrogenation of 1-naphthaldehyde was conducted and produced a yield of 82.4%, and the detected by-products included an aldehyde–ketone condensation product (7b) and naphthalene (7c) (Table 2, entry 7). The by-product 7c might have formed from 7 by a decarbonylation reaction in the presence of the Lewis acid sites of Ar–O–Hf and the solvent 2-PrOH.59 Besides the target product and the detectable byproducts mentioned above, humins were another important class of byproducts (3b, 6b, 8b and 9b).60 Overall, these results showed that Hf–TA was efficient for the conversion of various substrates with different structures.
CTH reduction of different carbonyl compounds to alcoholsa.
| Entry | Reactant | T (°C) | t (h) | Conv. (%) | Main productb | By-productc |
|---|---|---|---|---|---|---|
| Number, yield (%) | Number | |||||
| 1 |
|
70 | 4 | 99.1 |
|
— |
| 2 |
|
110 | 7 | 99.9 |
|
|
| 3 |
|
110 | 12 | 99.9 |
|
Humin |
| 3b | ||||||
| 4 |
|
100 | 6 | 98.9 |
|
|
| 5 |
|
160 | 46 | 92.2 |
|
|
| 6 |
|
150 | 24 | 92.8 |
|
Humin |
| 6b | ||||||
| 7 |
|
110 | 12 | 98.3 |
|
|
| 8 |
|
110 | 10 | 99.5 |
|
Humin |
| 8b | ||||||
| 9 |
|
100 | 6 | 97.7 |
|
Humin |
| 9b | ||||||
| 10 |
|
110 | 7 | 97.2 |
|
|
| 11 |
|
100 | 10 | 96.7 |
|
|
| 12 |
|
100 | 10 | 98.0 |
|
|
Reaction conditions: substrate 1 mmol, 2-PrOH 5 mL, and Hf–TA catalyst 200 mg.
Conversion (Conv.) and yield were quantified by GC using decane as the internal standard.
By-products were qualitatively analyzed using GC-MS.
Mechanism
Through the characterization of NH3-TPD (Fig. S5†) techniques, it was speculated that the formation of acid–base catalytic sites in Hf–TA. The acid sites mainly originated from the Hf4+ and the basic sites resulted mainly from O2− in the phenate groups.61 Based on the experimental results and some previous reports,18,50,61,62 a possible mechanism for the CTH reaction of FD to produce FA over Hf–TA has been proposed (Scheme 2). In the first step, 2-PrOH is adsorbed on Hf–TA, resulting in its dissociation into the corresponding alkoxide and hydrogen at the Ar–O–Hf sites.63 Meanwhile, the deprotonation of 2-PrOH is enhanced by the basic phenate O2− ions, and the carbonyl group of FD is activated by the catalytic Hf4+ sites.43 The activated aldehyde group interacts with the nearby activated 2-PrOH to form a six-linked intermediate.45 The alcohol product is formed, and 2-PrOH is converted into acetone. In the second step Ar–O–Hf sites interacted with the C–O group of acetone, increasing its polarization and facilitating the alcohol group of by-product was attacked.64 The carbonyl species of substrate was able to react with acetone resulted the aldol condensation to form the main byproduct (2b, 4b, 7b, 10b, 11b and 12b).18,56 These results indicated that the designed Hf–TA catalyst in this study was active for the hydrogenation and aldol conversion of carbonyl compounds with different structure.
Scheme 2. Possible mechanism of the Hf–TA-catalyzed CTH reaction of FD.

Conclusions
In summary, we used naturally existing tannic acids to construct a novel catalyst (Hf–TA) for the MPV reaction of furfuraldehyde. Both preparation and reaction conditions were studied, and the catalyst was well-characterized. The results showed that the prepared Hf–TA catalyst was efficient in the selective hydrogenation of different carbonyl compounds via MPV reaction under mild conditions. The Hf–TA catalyst had excellent stability and could be reused with consistent performance for at least ten cycles. The approach presented in this paper promotes the use of renewable and natural resources to construct efficient and environment-friendly Hf-based catalysts, which might be helpful in the construction of catalysts for biomass conversion.
Conflicts of interest
There are no conflicts to declare.
Supplementary Material
Acknowledgments
This work was supported by the National Natural Science Foundation of China (21968021, 21606134, 21676149, 21868021, 21566028, 21868020), CAS “Light of West China” Program, and the Innovative and Entrepreneurial Talents Grassland Talents Engineering of Inner Mongolia.
Electronic supplementary information (ESI) available. See DOI: 10.1039/c9ra10317a
Notes and references
- Hu F. Wang Y. Xu S. Zhang Z. Chen Y. Fan J. Yuan H. Gao L. Xiao G. Catal. Lett. 2019;149:2158–2168. doi: 10.1007/s10562-019-02766-y. [DOI] [Google Scholar]
- Pendem S. Bolla S. R. Morgan D. J. Shinde D. B. Lai Z. Nakka L. Mondal J. Dalton Trans. 2019;48:8791–8802. doi: 10.1039/C9DT01190K. [DOI] [PubMed] [Google Scholar]
- Zhang X. Han M. Liu G. Wang G. Zhang Y. Zhang H. Zhao H. Appl. Catal., B. 2019;244:899–908. doi: 10.1016/j.apcatb.2018.12.025. [DOI] [Google Scholar]
- Gao X. Zhu S. Dong M. Wang J. Fan W. Appl. Catal., B. 2019;259:118076–118084. doi: 10.1016/j.apcatb.2019.118076. [DOI] [Google Scholar]
- Ftouni J. Muñoz-Murillo A. Goryachev A. Hofmann J. P. Hensen E. J. M. Lu L. Kiely C. J. Bruijnincx P. C. A. Weckhuysen B. M. ACS Catal. 2016;6:5462–5472. doi: 10.1021/acscatal.6b00730. [DOI] [Google Scholar]
- Shi D. Yang Q. Peterson C. Lamic-Humblot A.-F. Girardon J.-S. Griboval-Constant A. Stievano L. Sougrati M. T. Briois V. Bagot P. A. J. Wojcieszak R. Paul S. Marceau E. Catal. Today. 2019;334:162–172. doi: 10.1016/j.cattod.2018.11.041. [DOI] [Google Scholar]
- Cao W. Lin L. Qi H. He Q. Wu Z. Wang A. Luo W. Zhang T. J. Catal. 2019;373:161–172. doi: 10.1016/j.jcat.2019.03.035. [DOI] [Google Scholar]
- Li Y. Wang X. Lu J. Wang K. Zhang H. Shen D. J. Taiwan Inst. Chem. Eng. 2019;102:190–196. doi: 10.1016/j.jtice.2019.05.028. [DOI] [Google Scholar]
- Ortiz-Cervantes C. Flores-Alamo M. García J. J. ACS Catal. 2015;5:1424–1431. doi: 10.1021/cs5020095. [DOI] [Google Scholar]
- Alamillo R. Tucker M. Chia M. Pagán-Torres Y. Dumesic J. Green Chem. 2012;14:1413–1419. doi: 10.1039/C2GC35039D. [DOI] [Google Scholar]
- Nakagawa Y. Tamura M. Tomishige K. ACS Catal. 2013;3:2655–2668. doi: 10.1021/cs400616p. [DOI] [Google Scholar]
- Chia M. Dumesic J. A. Chem. Commun. 2011;47:12233–12235. doi: 10.1039/C1CC14748J. [DOI] [PubMed] [Google Scholar]
- Zhou S. Dai F. Xiang Z. Song T. Liu D. Lu F. Qi H. Appl. Catal., B. 2019;248:31–43. doi: 10.1016/j.apcatb.2019.02.011. [DOI] [Google Scholar]
- Hao W. Li W. Tang X. Zeng X. Sun Y. Liu S. Lin L. Green Chem. 2016;18:1080–1088. doi: 10.1039/C5GC01221J. [DOI] [Google Scholar]
- Kuwahara Y. Kaburagi W. Osada Y. Fujitani T. Yamashita H. Catal. Today. 2017;281:418–428. doi: 10.1016/j.cattod.2016.05.016. [DOI] [Google Scholar]
- Luo Y. Zhou Y. Lin Y. Huang Y. ChemistrySelect. 2018;3:11071–11080. doi: 10.1002/slct.201802176. [DOI] [Google Scholar]
- Luo Y. Zhou Y. Huang Y. Catal. Lett. 2019;149:292–302. doi: 10.1007/s10562-018-2599-6. [DOI] [Google Scholar]
- Song J. Zhou B. Zhou H. Wu L. Meng Q. Liu Z. Han B. Angew. Chem., Int. Ed. 2015;54:9399–9403. doi: 10.1002/anie.201504001. [DOI] [PubMed] [Google Scholar]
- Zhang B. Hao J. Sha Y. Zhou H. Yang K. Song Y. Ban Y. He R. Liu Q. Fuel. 2018;217:122–130. doi: 10.1016/j.fuel.2017.12.064. [DOI] [Google Scholar]
- Rimoldi M. Howarth A. J. DeStefano M. R. Lin L. Goswami S. Li P. Hupp J. T. Farha O. K. ACS Catal. 2016;7:997–1014. doi: 10.1021/acscatal.6b02923. [DOI] [Google Scholar]
- Ji P. Feng X. Veroneau S. S. Song Y. Lin W. J. Am. Chem. Soc. 2017;139:15600–15603. doi: 10.1021/jacs.7b09093. [DOI] [PubMed] [Google Scholar]
- Melero J. Morales G. Iglesias J. Paniagua M. López-Aguado C. Wilson K. Osatiashtiani A. Green Chem. 2017;19:5114–5121. doi: 10.1039/C7GC01969F. [DOI] [Google Scholar]
- Li W. Liu S. Wang H. Gao B. Tu C. Luo Y. Catal. Commun. 2020;133:105845–105849. doi: 10.1016/j.catcom.2019.105845. [DOI] [Google Scholar]
- Rojas-Buzo S. García-García P. Corma A. ChemSusChem. 2018;11:432–438. doi: 10.1002/cssc.201701708. [DOI] [PubMed] [Google Scholar]
- Xie C. Song J. Zhou B. Hu J. Zhang Z. Zhang P. Jiang Z. Han B. ACS Sustainable Chem. Eng. 2016;4:6231–6236. doi: 10.1021/acssuschemeng.6b02230. [DOI] [Google Scholar]
- Wu W. Li Y. Li H. Zhao W. Yang S. Catalysts. 2018;8:264–278. doi: 10.3390/catal8070264. [DOI] [Google Scholar]
- Cai Z. Li W. Wang F. Zhang X. J. Taiwan Inst. Chem. Eng. 2018;93:374–378. doi: 10.1016/j.jtice.2018.08.002. [DOI] [Google Scholar]
- Chowdhury S. P. Khanna S. Verma S. C. Tripathi A. K. J. Appl. Microbiol. 2004;97:1210–1219. doi: 10.1111/j.1365-2672.2004.02426.x. [DOI] [PubMed] [Google Scholar]
- Xu L. Q. Pranantyo D. Neoh K. G. Kang E.-T. Fu G. D. ACS Sustainable Chem. Eng. 2016;4:4264–4272. doi: 10.1021/acssuschemeng.6b00760. [DOI] [Google Scholar]
- Fei X. Wei W. Zhao F. Zhu Y. Luo J. Chen M. Liu X. ACS Sustainable Chem. Eng. 2016;5:596–603. doi: 10.1021/acssuschemeng.6b01967. [DOI] [Google Scholar]
- Bulut E. Ozacar M. Ind. Eng. Chem. Res. 2009;48:5686–5690. doi: 10.1021/ie801779f. [DOI] [Google Scholar]
- Sahiner N. Sagbas S. Aktas N. RSC Adv. 2015;5:18183–18195. doi: 10.1039/C5RA00126A. [DOI] [Google Scholar]
- Rao H. Schmidt L. C. Bonin J. Robert M. Nature. 2017;548:74–77. doi: 10.1038/nature23016. [DOI] [PubMed] [Google Scholar]
- Xue Z. Zhang Y. Li G. Wang J. Zhao W. Mu T. Catal. Sci. Technol. 2016;6:1070–1076. doi: 10.1039/C5CY01123J. [DOI] [Google Scholar]
- Li H. Yang T. Fang Z. Appl. Catal., B. 2018;227:79–89. doi: 10.1016/j.apcatb.2018.01.017. [DOI] [Google Scholar]
- Wang T. Hu A. Xu G. Liu C. Wang H. Xia Y. Catal. Lett. 2019;149:1845–1855. doi: 10.1007/s10562-019-02748-0. [DOI] [Google Scholar]
- Fakhri A. Naghipour A. Ghasemi Z. H. Solid State Sci. 2018;83:107–114. doi: 10.1016/j.solidstatesciences.2018.07.010. [DOI] [Google Scholar]
- Zhao S. Xie S. Zhao Z. Zhang J. Li L. Xin Z. ACS Sustainable Chem. Eng. 2018;6:7652–7661. doi: 10.1021/acssuschemeng.8b00497. [DOI] [Google Scholar]
- Sahiner N. Sagbas S. Sahiner M. Silan C. Aktas N. Turk M. Int. J. Biol. Macromol. 2016;82:150–159. doi: 10.1016/j.ijbiomac.2015.10.057. [DOI] [PubMed] [Google Scholar]
- Liu M. Cai C. Li J. Zhao J. Teng W. Liu R. J. Colloid Interface Sci. 2018;528:1–9. doi: 10.1016/j.jcis.2018.05.070. [DOI] [PubMed] [Google Scholar]
- Lee H. Y. Hwang C. H. Kim H. E. Jeong S. H. Carbohydr. Polym. 2018;186:290–298. doi: 10.1016/j.carbpol.2018.01.056. [DOI] [PubMed] [Google Scholar]
- Sagbas S. Butun S. Sahiner N. Carbohydr. Polym. 2012;87:2718–2724. doi: 10.1016/j.carbpol.2011.11.064. [DOI] [Google Scholar]
- Hu L. Dai X. Li N. Tang X. Jiang Y. Sustainable Energy Fuels. 2019;3:1033–1041. doi: 10.1039/C8SE00545A. [DOI] [Google Scholar]
- Král R. Zemenová P. Vaněček V. Bystřický A. Kohoutková M. Jarý V. Kodama S. Kurosawa S. Yokota Y. Yoshikawa A. Nikl M. J. Therm. Anal. Calorim. 2019;138:1853–1861. doi: 10.1007/s10973-019-08475-3. [DOI] [Google Scholar]
- Dzhardimalieva G. I. Pomogailo S. I. Golubeva N. D. Pomogailo A. D. Macromol. Symp. 2011;304:101–108. doi: 10.1002/masy.201150614. [DOI] [Google Scholar]
- Li H. Li Y. Fang Z. Smith R. L. Catal. Today. 2019;319:84–92. doi: 10.1016/j.cattod.2018.04.056. [DOI] [Google Scholar]
- Sha Y. Xiao Z. Zhou H. Yang K. Song Y. Li N. He R. Zhi K. Liu Q. Green Chem. 2017;19:4829–4837. doi: 10.1039/C7GC01925D. [DOI] [Google Scholar]
- Sahiner N. Sagbas S. Aktas N. Mater. Sci. Eng. 2015;49:824–834. doi: 10.1016/j.msec.2015.01.076. [DOI] [PubMed] [Google Scholar]
- Wang H. Kong Q. Wang Y. Deng T. Chen C. Hou X. Zhu Y. ChemCatChem. 2014;6:728–732. doi: 10.1002/cctc.201301067. [DOI] [Google Scholar]
- Huang Y. Luo Y. Wang F. Nanomaterials. 2019;9:1128–1142. doi: 10.3390/nano9081128. [DOI] [PMC free article] [PubMed] [Google Scholar]
- Tang C. Yu P. Tang L. Wang Q. Bao R. Liu Z. Yang M. Yang W. Ecotoxicol. Environ. Saf. 2018;165:299–306. doi: 10.1016/j.ecoenv.2018.09.009. [DOI] [PubMed] [Google Scholar]
- Hu L. Li T. Xu J. He A. Tang X. Chu X. Xu J. Chem. Eng. J. 2018;352:110–119. doi: 10.1016/j.cej.2018.07.007. [DOI] [Google Scholar]
- Ma M. Hou P. Cao J. Liu H. Yan X. Xu X. Yue H. Tian G. Feng S. Green Chem. 2019;21:5969–5979. doi: 10.1039/C9GC03033F. [DOI] [Google Scholar]
- Devi N. S. Singh L. J. Devi S. P. Singh R. K. B. Singh R. K. H. Rajeswari B. Kadam R. M. J. Coord. Chem. 2011;64:4108–4121. doi: 10.1080/00958972.2011.635789. [DOI] [Google Scholar]
- Patil K. C. Nesamani C. Pai Verneker V. R. Synth. React. Inorg. Met.-Org. Chem. 1982;12:383–395. doi: 10.1080/00945718208063122. [DOI] [Google Scholar]
- Shen H. Tang H. Yan H. Han W. Li Y. Ni J. RSC Adv. 2014;4:30180–30185. doi: 10.1039/C4RA04811C. [DOI] [Google Scholar]
- Kilic A. Kayan C. Aydemir M. Durap F. Durgun M. Baysal A. Tas E. Gümgüm B. Appl. Organomet. Chem. 2011;25:390–394. doi: 10.1002/aoc.1779. [DOI] [Google Scholar]
- Li F. France L. J. Cai Z. Li Y. Liu S. Lou H. Long J. Li X. Appl. Catal., B. 2017;214:67–77. doi: 10.1016/j.apcatb.2017.05.013. [DOI] [Google Scholar]
- An N. Ainembabazi D. Reid C. Samudrala K. Wilson K. Lee A. F. Voutchkova-Kostal A. ChemSusChem. 2019;12:1–10. doi: 10.1002/cssc.201802948. [DOI] [PubMed] [Google Scholar]
- Wiesfeld J. J. Peršolja P. Rollier F. A. Elemans-Mehring A. M. Hensen E. J. M. Mol. Catal. 2019;473:110400–110410. doi: 10.1016/j.mcat.2019.110400. [DOI] [Google Scholar]
- Song J. Wu L. Zhou B. Zhou H. Fan H. Yang Y. Meng Q. Han B. Green Chem. 2015;17:1626–1632. doi: 10.1039/C4GC02104E. [DOI] [Google Scholar]
- Xue Z. Jiang J. Li G. Zhao W. Wang J. Mu T. Catal. Sci. Technol. 2016;6:5374–5379. doi: 10.1039/C5CY02215K. [DOI] [Google Scholar]
- Zhou S. Dai F. Chen Y. Dang C. Zhang C. Liu D. Qi H. Green Chem. 2019;21:1421–1431. doi: 10.1039/C8GC03710H. [DOI] [Google Scholar]
- Jia L. Pedersen C. M. Qiao Y. Deng T. Zuo P. Ge W. Qin Z. Hou X. Wang Y. Phys. Chem. Chem. Phys. 2015;17:23173–23182. doi: 10.1039/C5CP02169C. [DOI] [PubMed] [Google Scholar]
Associated Data
This section collects any data citations, data availability statements, or supplementary materials included in this article.