Abstract
A novel magnetic microsphere was prepared by simple microemulsion polymerization for protein drug delivery systems. The Fe3O4 magnetic nanoparticles were successfully encapsulated in chitosan microspheres, which endowed the chitosan microspheres with good magnetism. The drug loading performance results indicated that the prepared magnetic chitosan microspheres exhibited a superior drug loading capacity, and the drug loading amount reached 947.01 mg g−1. Furthermore, the magnetic chitosan microspheres also showed a higher drug release rate (87.8%) and evident sustained-release performance in vitro. The magnetic microsphere carrier will be widely used in the biomedical field as a promising drug carrier.
A novel magnetic microsphere was prepared by the simple microemulsion polymerization for protein drug delivery systems. This magnetic microsphere exhibited good magnetism and superior drug loading capacity and evident sustained-release performance.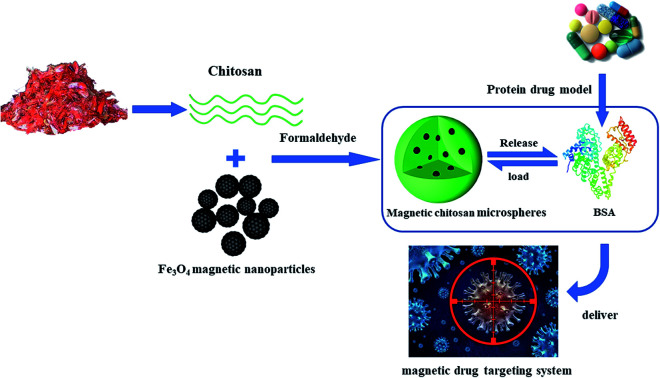
1. Introduction
With the continuous development of human civilization and living standards in modern society, health issues have been paid more and more attention. Therefore, the higher requirements for the safety of modern drug delivery systems have been put forward. Compared with traditional drug delivery systems, biomass-based drug delivery systems exhibit superior drug safety due to their negligible pharmacological effects with the matrix.1 Among these numerous biomass-based drug delivery systems, significant attention has been focused on the chitosan-based drug delivery systems due to their nontoxicity, superior biocompatibility, appropriate biodegradability and excellent antibacterial properties in recent years.2–5
Up to now, chitosan with different dosage forms such as tablets,6,7 nanoparticles,8 nanofibers,9–11 beads,12 films,13 hydrogels,14,15 conjugates16 and microspheres17–19 have been designed and developed by many researchers for drug delivery systems. Among the above dosage forms, microspheres have been widely used in the controlled and sustained drug delivery systems due to their large specific surface area, excellent drug loading efficiency and high mucus affinity. Furthermore, various preparation methods such as solvent evaporation,20 ionic gelation,21 spray drying22 and emulsion polymerization23 have been used to synthesize chitosan microspheres. However, the pure chitosan microspheres also present some disadvantages, such as the inability to target therapy at the focal position, which has significantly restricted their application in the delivery system.24 Recently, many researchers have found that the introduction of magnetic nanoparticles to the microsphere delivery system allows drugs to selectively reach lesion locations, which had high efficiency and low toxicity. Fang et al.25 reported that doxorubicin-loaded magnetic PLGA (poly(lactic-co-glycolic acid)) microspheres applied as a synergistic platform for chemo-thermal therapy. In another study, the magnetic polylactide microspheres loaded with anti-inflammatory drug ibuprofen were synthesized and characterized.26 Cheng et al.27 also fabricated magnetic silica microspheres for doxorubicin loading. Therefore, if the magnetic nanoparticles with the unique characteristic of oriented movement in the magnetic field can be introduced into the chitosan microspheres, it would be an excellent delivery system using for external manipulation with a magnetic field in the biomedical field.28
In this work, Fe3O4 magnetic nanoparticles were prepared by the simple hydrothermal method and then encapsulated in chitosan using a microemulsion technique. The magnetic chitosan microspheres were characterized in detail by X-ray diffraction (XRD), Fourier transform infrared spectroscopy (FTIR), scanning electron microscopy (SEM), transmission electron microscope (TEM) and vibrating sample magnetometer (VSM). Furthermore, Bovine Serum Albumin (BSA) was used as a model protein drug to explore their loading properties and release properties.
2. Experimental section
2.1. Materials
BSA was obtained from Huashun Biotechnology Co., Ltd. (Wuhan, China). Chitosan ((C6H11NO4)N) and iron chloride hexahydrate (FeCl3·6H2O), trisodium citrate dihydrate (Na3C6H5O7·2H2O), formaldehyde (CH2O), sodium dihydrogen phosphate dihydrate (NaH2PO4·2H2O), disodium hydrogen phosphate dodecahydrate (Na2HPO4·12H2O) were all purchased from Sinopharm Chemical Reagent Co., Ltd. (Shanghai, China). All other chemical reagents were analytical grade, and no further purification was required. In addition, the deionized water was used throughout all experiments.
2.2. Sample preparation
2.2.1. Synthesis of Fe3O4 magnetic nanoparticles
Fe3O4 magnetic nanoparticles were prepared by an improved hydrothermal method.29 In brief, FeCl3·6H2O (2 mmol), Na3C6H5O7·2H2O (8 mmol), and urea (12 mmol) were dissolved in 80 mL deionized water. Then PAM (0.3 g) was added under continuous stirring until it was dissolved completely. After that, the solution was transferred into a Teflon-lined stainless-steel autoclave (100 mL capacity), sealed, and autoclaved at 473 K for 12 h. Finally, after the autoclave was cooled to room temperature naturally, the black precipitate was collected by magnet and washed with deionized water and ethanol and then dried by vacuum at 333 K for 10 h. The obtained black product was identified as the Fe3O4 magnetic nanoparticles.
2.2.2. Synthesis of magnetic chitosan microspheres
Magnetic chitosan microspheres were prepared by water-in-oil (W/O) microemulsion polymerization. Chitosan (0.8 g) was added into 2% acetic acid solution (40 mL) until it was dissolved completely. Then the Fe3O4 magnetic nanoparticles were dispersed in the chitosan acetic acid solution with ultrasonic dispersion for 30 min. And then, the above-mixed solution was slowly dropped into the microemulsion containing emulsifier (Span-80, 16 mL) and liquid paraffin (320 mL), and stirred at room temperature for 30 min. After that, the formaldehyde solution (16 mL) was added and stirred at high speed for 1 h. When the temperature was raised to 298 K, the sodium hydroxide solution (1 mol L−1) was slowly added to adjust the pH value to 9–10, and then the reaction was continued for 4 h. Lastly, the black products were collected by the magnet and washed several times with petroleum ether, deionized water and ethanol in sequence and then dried by vacuum at 333 K. The obtained final product was identified as the magnetic chitosan microspheres.
2.3. Sample characterization
The crystal structures of the samples were identified by XRD (Empyrean, PANalytical B.V., Nederland, Cu Kα). The surface functional groups of the samples were analyzed with FTIR (Vertex 70, Bruker, Germany, KBr). The morphology and particle diameter of the samples were analyzed using SEM (Nova 400, FEI, America) and TEM (Tecnai G2 F20, FEI, America). The magnetic properties of the samples were studied on VSM (PPMS-9, Quantum Design, America).
2.4. Protein load and in vitro release experiments
The drug-loading and release properties of the magnetic chitosan microspheres as a carrier for protein drugs were explored according to previously reported methods.30 BSA was selected as a protein drug model in the experiments. Briefly, the sample (50 mg) was added into a phosphate buffer solution (PBS, 0.01 mol L−1, 50 mL) containing BSA (1.0 mg L−1). Then the solution was shaken at 310 K. And the equilibrium was investigated by changing the load time and pH of the BSA solution. The residual protein concentration in the filtrate was determined by absorbance at a wavelength of 280 nm using a UV-ultraviolet spectrophotometer (UV-1800PC, MAPADA, China). The BSA loading was calculated based on the difference between the initial and residual protein concentrations.
For the release test, the dried BSA-loaded sample (50 mg) was added into 5 mL of PBS (0.02 mol L−1, pH 7.4). Then the solution was placed in a shaker bath at 150 rpm min−1 (at 310 K) for in vitro release experiments. Periodically, the release buffer was withdrawn, and the equal volume of fresh PBS was added. The amount of the BSA in the release buffer was also determined by a UV-ultraviolet spectrophotometer like above.
3. Results and discussion
3.1. XRD analysis
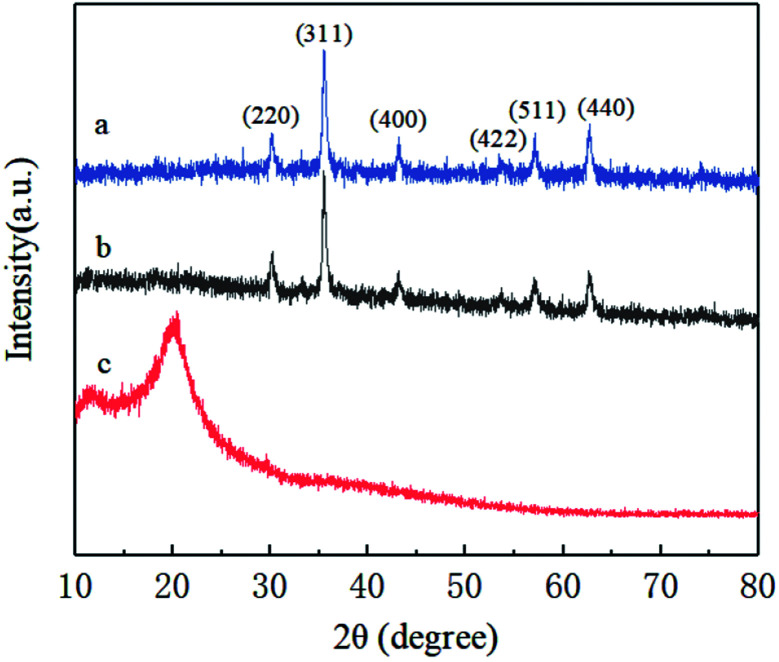
XRD patterns were performed to characterize the crystal structure and composition of Fe3O4 magnetic nanoparticles and magnetic chitosan microspheres (Fig. 1). As shown in the pattern of Fe3O4 magnetic nanoparticles (Fig. 1a), six diffraction characteristic peaks appeared at 2θ of 30.08°, 35.44°, 43.12°, 53.42°, 57.13°, 62.71°, corresponding to the crystal plane indices of (220), (311), (400), (422), (511) and (440). These peaks are well matched to the standard Fe3O4 of the spinel structure (JCPDS card: 19-0629), indicating that the prepared nanoparticles are pure Fe3O4 with a spinel structure.31 By comparison, the pattern of magnetic chitosan microspheres showed the same diffraction pattern as that of Fe3O4 magnetic nanoparticles (Fig. 1b), revealing that the chitosan coating process did not lead to the phase transition of Fe3O4 magnetic nanoparticles. Additionally, there were no characteristic diffraction peaks in Fig. 1c, further illustrating that Fe3O4 magnetic nanoparticles were successfully encapsulated into chitosan microspheres. Therefore, Fe3O4 magnetic nanoparticles maintained their magnetic properties after being coated with chitosan, which is suitable for targeted drug delivery systems.
Fig. 1. XRD patterns of (a) Fe3O4 magnetic nanoparticles, (b) magnetic chitosan microspheres and (c) chitosan.
3.2. FT-IR analysis
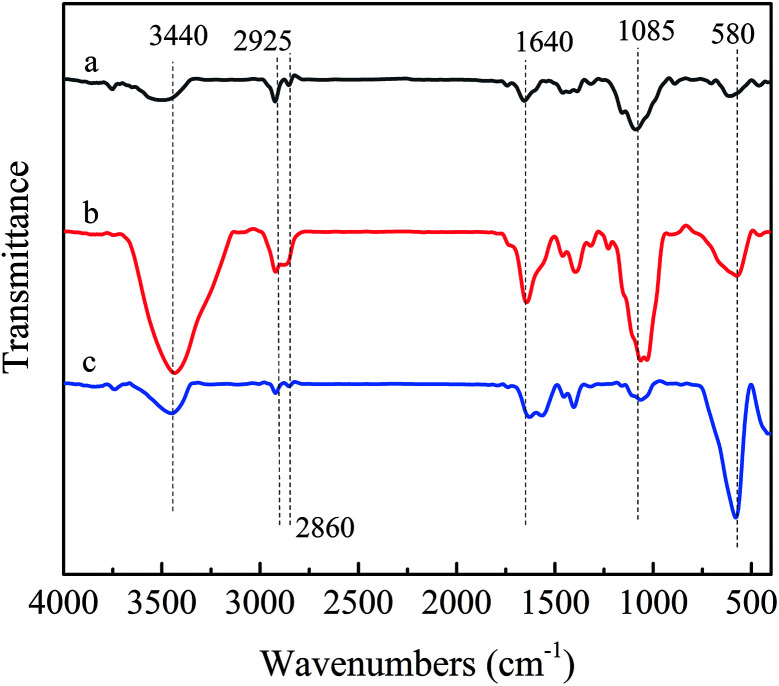
The FT-IR spectra of Chitosan, Fe3O4 magnetic nanoparticles and magnetic chitosan microspheres were shown in Fig. 2. In the FT-IR spectrum of chitosan (Fig. 2a), the broad band at 3440 cm−1 was related to the stretching vibration of the O–H bonds of the hydroxyl group. The C–H bond stretching vibration of the pyranose ring was expressed by two characteristic absorption peaks at 2925 cm−1 and 2860 cm−1. The absorption peak at 1085 cm−1 was attributed to the C–O stretching vibration of glycosidic bonds. Compared with the FT-IR spectrum of chitosan, the enhanced characteristic peak at 1640 cm−1 could be observed in the spectrum of the magnetic chitosan microspheres (Fig. 2b) due to the C N stretching vibration of the imine group. These indicated that the Schiff base was formed due to the reaction between the aldehyde group of formaldehyde and the amine group of chitosan.32 Furthermore, the peak at 3440 cm−1 in the spectrum of the magnetic chitosan microspheres (Fig. 2b) also presented enhanced intensity, which was attributed to the exposure of more active hydroxyl groups during chitosan microspheroidization. In addition, similar to the FT-IR spectrum of Fe3O4 magnetic nanoparticles (Fig. 2c), the spectrum of magnetic chitosan microspheres also showed a characteristic absorption peak at 580 cm−1 due to the Fe–O stretching vibration of Fe3O4.33 As a consequence, it can be inferred that Fe3O4 magnetic nanoparticles were successfully encapsulated into chitosan.
Fig. 2. FTIR spectra of (a) chitosan, (b) magnetic chitosan microspheres and (c) Fe3O4 magnetic nanoparticles.
3.3. Morphological analysis
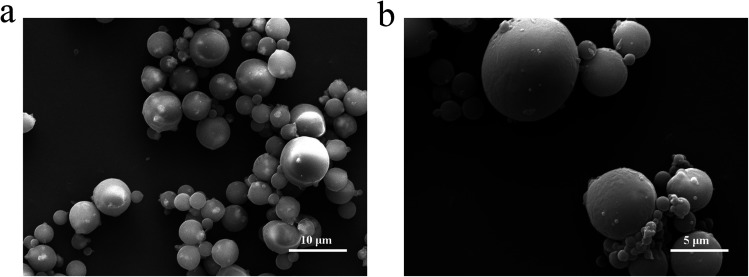
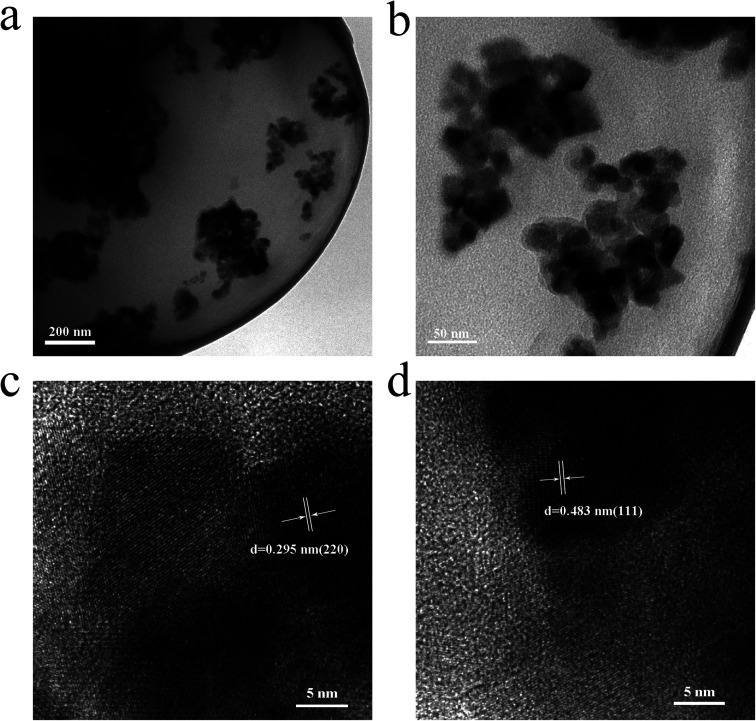
SEM was used to observe the morphology and microstructure of the magnetic chitosan microspheres. As shown in Fig. 3, the prepared magnetic chitosan microspheres exhibited a typical spherical shape with 2–6 μm diameter, the surface of which was smooth without any apparent defects, implying that Fe3O4 magnetic nanoparticles were well wrapped in chitosan. The TEM images of magnetic chitosan microspheres in Fig. 4a and b clearly showed that the surface of magnetic chitosan microspheres was relatively smooth. Simultaneously, many agglomerated Fe3O4 magnetic nanoparticles with a diameter of about 200–300 nm were encapsulated into the chitosan microspheres. Additionally, Fe3O4 magnetic nanoparticles inside magnetic chitosan microspheres were analyzed by HRTEM (Fig. 4c and d). By calculation, the lattice spacings were 0.295 nm and 0.483 nm, which were consistent with the crystal planes (220) and (111) lattice distances of standard Fe3O4 crystal, respectively. These results further confirmed that Fe3O4 magnetic nanoparticles were well coated by chitosan microspheres.
Fig. 3. SEM images of (a) ×5000 and (b) ×10 000 magnetic chitosan microspheres.
Fig. 4. TEM images of (a) and (b) magnetic chitosan microspheres; HRTEM image of (c) and (d) magnetic chitosan microspheres.
3.4. Magnetic properties evaluation
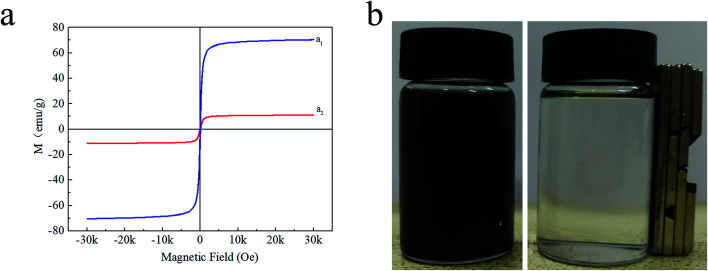
The magnetic hysteresis loops (Fig. 5a) indicated that magnetic chitosan microspheres possessed the same superparamagnetism as that of Fe3O4 magnetic nanoparticles. The saturation magnetizations of Fe3O4 magnetic nanoparticles and magnetic chitosan microspheres were 70.364 and 11.069 emu g−1, respectively. Although the saturation magnetization of magnetic chitosan microspheres was significantly reduced due to the presence of non-magnetic components (chitosan) in magnetic chitosan microspheres, their saturation magnetization was sufficient to permit effective separation from aqueous solution by an applied magnetic field (Fig. 5b). This well magnetic property allows the magnetic chitosan microspheres to respond quickly to the applied magnetic field, ensuring that they can be used as drug carriers for targeted therapy.34
Fig. 5. The magnetic hysteresis loops of (a1) Fe3O4 magnetic nanoparticles and (a2) magnetic chitosan microspheres; (b) photographs of magnetic chitosan microspheres dispersed in water before and after magnetic separation.
3.5. In vitro study of drug loading and release properties
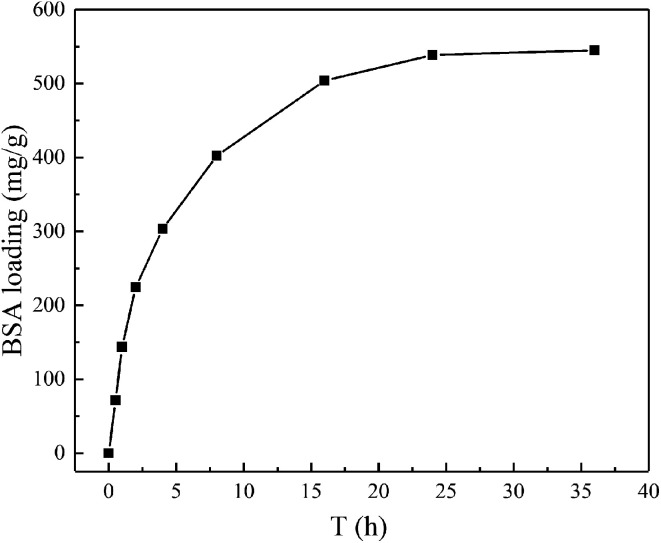
The BSA loading property was examined at the conditions of pH 7.4 and 310 K to investigate the load kinetics of magnetic chitosan microspheres, and the experiment results were illustrated in Fig. 6. As shown, the slope of the kinetic curve was the highest from 0 to 1 h, suggesting the fastest loading rate. During this time, BSA molecules can easily approach magnetic chitosan microspheres because of the lower mass transfer resistance. From 1 to 24 h, the slope was gradually lower. It means that the loading rate also decreased until to reach load saturation. This decrease was due to the increase of the steric hindrance caused by the increase of BSA molecules bound to magnetic chitosan microspheres.35 After 24 h, the slope was closed to zero, meaning the loading to BSA reached equilibrium approximately.
Fig. 6. The load kinetic curve of magnetic chitosan microspheres for BSA.
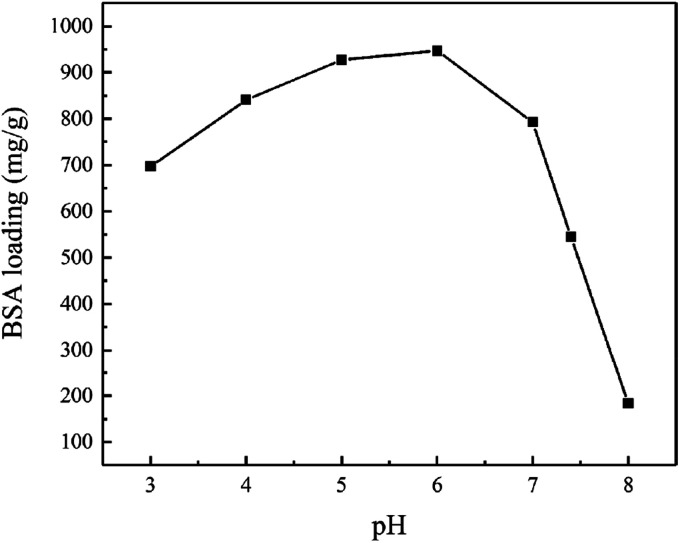
The effect of pH on BSA loading of magnetic chitosan microspheres was presented in Fig. 7. The experiments were carried out using 1.0 mg mL−1 BSA at various pH values adjusted with phosphate buffer solutions. It can be found that pH shows a significant effect on the BSA loading of magnetic chitosan microspheres. The maximum BSA loading was observed at pH 6.0. With the increase of pH from 6.0 to 8.0, the BSA loading of magnetic chitosan microspheres decreased significantly. When the pH decreased from 6.0 to 3.0, the BSA loading of magnetic chitosan microspheres also decreased.
Fig. 7. Effect of pH on the BSA loading of magnetic chitosan microspheres.
Generally, protein loading is a complex phenomenon. The BSA molecules can be bound to magnetic chitosan microspheres via ion electrostatic attraction, van der Waals forces, hydrogen bonding and hydrophobic interactions.36 Ion electrostatic attraction plays a leading role in the BSA loading.37 As previously mentioned, Fe3O4 magnetic nanoparticles were well wrapped in chitosan. Therefore, a possible explanation for the pH effect on the BSA loading of magnetic chitosan microspheres may be related to the net charge of chitosan and Fe3O4 magnetic nanoparticles and BSA molecules. The acid dissociation constant (pKa) of chitosan is 6.5,38 and the isoelectric point (pI) of Fe3O4 magnetic nanoparticles and BSA is 6.8 and 4.7, respectively.39,40 The positive charge (NH3+) content of chitosan and BSA increases with decreasing pH due to the protonation of the amino groups (NH2 + H+ ⇌ NH3+). In addition, the negative charge (COO−) content of BSA increases with increasing pH due to the dissociation of carboxyl groups (COOH ⇌ COO− + H+). A similar mechanism also applies to Fe3O4 magnetic nanoparticles, with the isoelectric point (pI 6.8) indicating the neutral charge point.
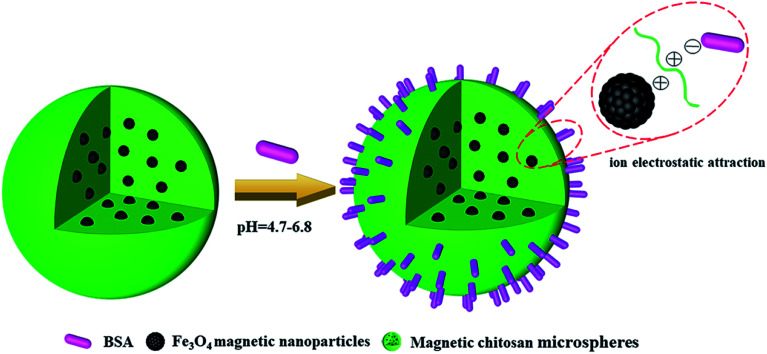
It means that, at pH < 4.7, chitosan, Fe3O4 magnetic nanoparticles and BSA all presented a positive charge, so the electrostatic repulsion between them was not conducive to the BSA loading of magnetic chitosan microspheres. Similarly, at pH > 6.8, chitosan, Fe3O4 magnetic nanoparticles and BSA all presented a negative charge, also resulting in a decrease of the BSA loading of magnetic chitosan microspheres. As shown in Fig. 8, BSA possessed a negative charge while chitosan and Fe3O4 magnetic nanoparticles both possessed a positive charge at pH = 4.7–6.8. Therefore, the sizeable electrostatic attraction between them can promote the BSA loading of magnetic chitosan microspheres. As previously reported in the literature,39 BSA possessed the maximum α-helix content at pH = 4.7 (the isoelectric point of BSA). This indicated that BSA molecules were in the densest state and resulted in the smallest intermolecular repulsion, which means higher BSA loading. In this work, the experimental results illustrated that the maximum BSA loading (947.01 mg g−1, pH = 6.0) was observed at pH = 4.7–6.8. These results have been well confirmed by the previous suggestion.
Fig. 8. Schematic illustration of ion electrostatic attraction between magnetic chitosan microspheres and BSA.
Additionally, the comparison of magnetic chitosan microspheres with other drug carriers was analyzed as shown in Table 1. It can be seen that magnetic chitosan microspheres exhibit relatively better drug loading performance than that of other drug carriers. As been tested, the value for loading per weight of magnetic chitosan microspheres (947.01 mg g−1) was much higher than those reported by other drug carriers such as the porous dextran microspheres and TCFs (tubular carbon nanofibers), but slightly lower than CQCM (cross-linked quaternized chitosan microspheres). And compared with other types of magnetic microspheres, such as poly(St–AA)/Fe3O4 (poly(styrene-co-acrylic acid)/Fe3O4) microspheres, CB–EDA–PMMA (Cibacron Blue F3GA–ethylenediamine–poly(methyl methacrylate)) magnetic microspheres and Fe3O4@P(DVB-co-CMS)–PDMAEMA (Fe3O4@poly(divinylbenzene-co-chloromethylstyrene)–poly(2-(dimethylamino)ethyl methacrylate)) microspheres, the magnetic chitosan microspheres not only showed better drug loading properties but also exhibited superior biocompatibility and biodegradability due to the addition of the chitosan component. In addition to ionic electrostatic attraction, the other interactions also exert an effect on the BSA loading of magnetic chitosan microspheres. As the FTIR results given above, the active hydroxyl groups exposed during chitosan microspheroidization provided more contact sites for hydrogen bonding with the amino groups of BSA. Furthermore, Fe3O4 magnetic nanoparticles also play a vital role in the process of loading BSA. As reported in the ref. 36, although Fe3O4 magnetic nanoparticles exhibited nonionic properties, their contribution to loading of BSA can not be ignored. According to the acid–base theory of Lewis, the iron atom on Fe3O4 magnetic nanoparticles as the Lewis acid can coordinate with the amine and carboxylate groups of the BSA molecule as the Lewis base, which helps to improve the drug loading capacity of magnetic chitosan microspheres. Therefore, both the microspheroidization and the magnetization contributed to the improvement of the BSA loading capacity of chitosan, which provided the feasibility of applying magnetic chitosan microspheres to protein drug carriers.
Comparison of the loading of bovine serum albumin (BSA) by various drug carriers.
| Carriers | Experimental conditions | Drug loading (mg g−1) | Ref. | ||
|---|---|---|---|---|---|
| pH | Temp. (K) | Conc. (mg mL−1) | |||
| Porous dextran microspheres | 7.5 | 310 | 0.25 | 138.90 | 2012 (ref. 43) |
| Poly(St–AA)/Fe3O4 microspheres | 4.7 | 310 | 3.0 | 105 | 2014 (ref. 44) |
| CB–EDA–PMMA | 5.0 | 303 | 1.5 | 114.0 | 2016 (ref. 45) |
| Fe3O4@P(DVB-co-CMS)–PDMAEMA | 5.0 | 303 | 1.0 | 665 | 2015 (ref. 46) |
| TCFs | 7.0 | 298 | 0.1 | 541.99 | 2018 (ref. 47) |
| CQCM | 7.0 | 298 | 1.0 | 1070 | 2011 (ref. 48) |
| Magnetic chitosan microspheres | 6.0 | 310 | 1.0 | 947.01 | This work |
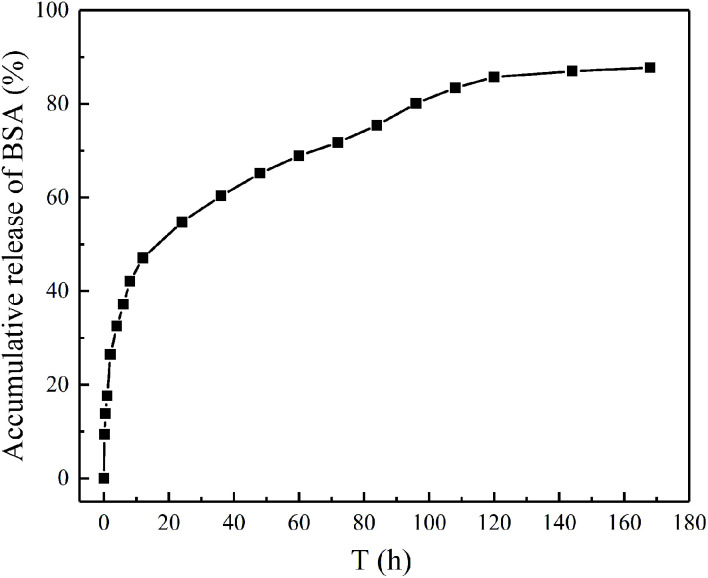
The in vitro release behaviors of BSA from magnetic chitosan microspheres were shown in the accumulative release profiles (Fig. 9). The initial burst release of BSA was 47.1% in the first 12 h, followed by a steady constant release from 12 to 120 h. After 120 h, the release rate of BSA became slow until the equilibrium. The total accumulative release of BSA was 87.8%. These results could be explained that the weaker adsorption force of BSA leads to the burst release effect in the initial stage.41 Nevertheless, the release rate of BSA relatively decreased after the initial burst, which is due to the strong ion electrostatic attraction between BSA and magnetic chitosan microspheres.42 From the above experimental results, it was apparent that the BSA-loaded magnetic chitosan microspheres exhibited better drug release properties in the application.
Fig. 9. The accumulative release of BSA from magnetic chitosan microspheres.
4. Conclusion
A novel magnetic microsphere was prepared by the simple microemulsion polymerization for protein drug delivery systems. The characterization results indicated that Fe3O4 magnetic nanoparticles were successfully encapsulated in chitosan by the reaction, which endowed chitosan microspheres with good magnetism. Compared with non-magnetic drug carriers, the magnetism of magnetic chitosan microspheres is an essential advantage for drug delivery systems. Furthermore, the prepared magnetic chitosan microspheres also possessed excellent drug loading performance, and the drug loading amount of magnetic chitosan microspheres reached 947.01 mg g−1. Additionally, the magnetic chitosan microspheres also showed a higher drug release rate (87.8%) and evident sustained-release performance in vitro. Consequently, the magnetic microsphere carrier in this case will be widely used in the biomedical field as a promising drug carrier.
Conflicts of interest
There are no conflicts of interest to declare.
Supplementary Material
Acknowledgments
This work is supported by support from the National Natural Science Foundation of China (21473126), the National Key R&D Program of China (2017YFB0304300 & 2017YFB0304303), Fund of Hubei Provincial Department of Education (B2014094) and Open Research Fund of Hubei Province Key Laboratory of Coal Conversion and New Carbon Material (WKDM201705).
References
- Pal K. Behera B. Roy S. Ray S. S. Thakur G. Soft Mater. 2013;11:125–142. doi: 10.1080/1539445X.2011.586082. [DOI] [Google Scholar]
- VandeVord P. J. Matthew H. W. DeSilva S. P. Mayton L. Wu B. Wooley P. H. J. Biomed. Mater. Res. 2002;59:585–590. doi: 10.1002/jbm.1270. [DOI] [PubMed] [Google Scholar]
- Tomihata K. Ikada Y. Biomaterials. 1997;18:567–575. doi: 10.1016/S0142-9612(96)00167-6. [DOI] [PubMed] [Google Scholar]
- Ali A. Ahmed S. Int. J. Biol. Macromol. 2018;109:273–286. doi: 10.1016/j.ijbiomac.2017.12.078. [DOI] [PubMed] [Google Scholar]
- Muzzarelli R. A. A. Mattioli-Belmonte M. Tietz C. Biagini R. Ferioli G. Brunelli M. A. Fini M. Giardino R. Ilari P. Biagini G. Biomaterials. 1994;15:1075–1081. doi: 10.1016/0142-9612(94)90093-0. [DOI] [PubMed] [Google Scholar]
- Ofori-Kwakye K. Mfoafo K. A. Kipo S. L. Kuntworbe N. Boakye-Gyasi M. E. Saudi Pharm. J. 2016;24:82–91. doi: 10.1016/j.jsps.2015.03.005. [DOI] [PMC free article] [PubMed] [Google Scholar]
- Li L. Li J. Si S. Wang L. Shi C. Sun Y. Liang Z. Mao S. Asian J. Pharm. Sci. 2015;10:314–321. doi: 10.1016/j.ajps.2014.09.002. [DOI] [Google Scholar]
- Luque-Alcaraz A. G. Lizardi-Mendoza J. Goycoolea F. M. Higuera-Ciapara I. Argüelles-Monal W. RSC Adv. 2016;6:59250–59256. doi: 10.1039/C6RA06563E. [DOI] [Google Scholar]
- Ardeshirzadeh B. Anaraki N. A. Irani M. Rad L. R. Shamshiri S. Mater. Sci. Eng., C. 2015;48:384–390. doi: 10.1016/j.msec.2014.12.039. [DOI] [PubMed] [Google Scholar]
- Jayakumar R. Prabaharan M. Nair S. V. Tamura H. Biotechnol. Adv. 2010;28:142–150. doi: 10.1016/j.biotechadv.2009.11.001. [DOI] [PubMed] [Google Scholar]
- Sasmal P. Datta P. J. Drug Delivery Sci. Technol. 2019;52:559–567. doi: 10.1016/j.jddst.2019.05.018. [DOI] [Google Scholar]
- Anal A. K. Stevens W. F. Int. J. Pharm. 2005;290:45–54. doi: 10.1016/j.ijpharm.2004.11.015. [DOI] [PubMed] [Google Scholar]
- Tang C. Guan Y. X. Yao S. J. Zhu Z. Q. Int. J. Pharm. 2014;473:434–441. doi: 10.1016/j.ijpharm.2014.07.039. [DOI] [PubMed] [Google Scholar]
- Bhattarai N. Gunn J. Zhang M. Adv. Drug Delivery Rev. 2010;62:83–99. doi: 10.1016/j.addr.2009.07.019. [DOI] [PubMed] [Google Scholar]
- Martinez-Martinez M. Rodriguez-Berna G. Bermejo M. Gonzalez-Alvarez I. Gonzalez-Alvarez M. Merino V. Eur. J. Pharm. Biopharm. 2019;136:174–183. doi: 10.1016/j.ejpb.2019.01.009. [DOI] [PubMed] [Google Scholar]
- Liu Y. Li K. Pan J. Liu B. Feng S. S. Biomaterials. 2010;31:330–338. doi: 10.1016/j.biomaterials.2009.09.036. [DOI] [PubMed] [Google Scholar]
- Patil S. B. Sawant K. K. Colloids Surf., B. 2011;84:384–389. doi: 10.1016/j.colsurfb.2011.01.030. [DOI] [PubMed] [Google Scholar]
- Jyoti K. Bhatia R. K. Martis E. A. F. Coutinho E. C. Jain U. K. Chandra R. Madan J. Colloids Surf., B. 2016;148:674–683. doi: 10.1016/j.colsurfb.2016.09.044. [DOI] [PubMed] [Google Scholar]
- Díaz A. G. Quinteros D. A. Llabot J. M. Palma S. D. Allemandi D. A. Ghersi G. Zylberman V. Goldbaum F. A. Estein S. M. Mater. Sci. Eng., C. 2016;62:489–496. doi: 10.1016/j.msec.2016.01.084. [DOI] [PubMed] [Google Scholar]
- Sinha V. R. Singla A. K. Wadhawan S. Kaushik R. Kumria R. Bansal K. Dhawan S. Int. J. Pharm. 2004;274:1–33. doi: 10.1016/j.ijpharm.2003.12.026. [DOI] [PubMed] [Google Scholar]
- Quan H. Zhu F. Han X. Xu Z. Zhao Y. Miao Z. Med. Hypotheses. 2009;73:205–206. doi: 10.1016/j.mehy.2009.02.018. [DOI] [PubMed] [Google Scholar]
- Shen K. T. Chen M. H. Chan H. Y. Jeng J. H. Wang Y. J. Food Chem. Toxicol. 2009;47:1864–1871. doi: 10.1016/j.fct.2009.04.044. [DOI] [PubMed] [Google Scholar]
- Varma S. Sadasivan C. Biomed. Pharmacother. 2014;68:225–230. doi: 10.1016/j.biopha.2013.08.009. [DOI] [PubMed] [Google Scholar]
- Li P. Song Y. Liu C. Li X. Zhou G. Fan Y. Mater. Lett. 2014;114:132–135. doi: 10.1016/j.matlet.2013.09.111. [DOI] [Google Scholar]
- Fang K. Song L. Gu Z. Yang F. Zhang Y. Gu N. Colloids Surf., B. 2015;136:712–720. doi: 10.1016/j.colsurfb.2015.10.014. [DOI] [PubMed] [Google Scholar]
- Zhang X. Xue L. Wang J. Liu Q. Liu J. Gao Z. Yang W. Colloids Surf., A. 2013;431:80–86. doi: 10.1016/j.colsurfa.2013.04.021. [DOI] [Google Scholar]
- Cheng L. Liu Y. Zou B. Yu Y. Ruan W. Wang Y. Mater. Sci. Eng., C. 2017;75:829–835. doi: 10.1016/j.msec.2017.02.105. [DOI] [PubMed] [Google Scholar]
- Zhang H. Chen J. Zhang Y. Pan P. Zhang Q. Mater. Lett. 2014;119:143–145. doi: 10.1016/j.matlet.2014.01.008. [DOI] [Google Scholar]
- Cheng W. Tang K. Qi Y. Sheng J. Liu Z. J. Mater. Chem. 2010;20:1799. doi: 10.1039/B919164J. [DOI] [Google Scholar]
- Xu Y. An L. Chen L. Xu H. Zeng D. Wang G. Adv. Powder Technol. 2018;29:1042–1048. doi: 10.1016/j.apt.2018.01.008. [DOI] [Google Scholar]
- Song Z. Hu Y. Qi L. Xu T. Yang Y. Xu Z. Lai X. Wang X. Zhang D. Li S. Carbohydr. Polym. 2018;195:558–565. doi: 10.1016/j.carbpol.2018.04.108. [DOI] [PubMed] [Google Scholar]
- Fan S. Huang Z. Zhang Y. Hu H. Liang X. Gong S. Zhou J. Tu R. Bioresour. Technol. 2019;274:48–55. doi: 10.1016/j.biortech.2018.11.078. [DOI] [PubMed] [Google Scholar]
- Xie W. Wang J. Biomass Bioenergy. 2012;36:373–380. doi: 10.1016/j.biombioe.2011.11.006. [DOI] [Google Scholar]
- Xu B. Zheng H. Zhou H. Wang Y. Luo K. Zhao C. Peng Y. Zheng X. J. Mol. Liq. 2018;256:424–432. doi: 10.1016/j.molliq.2018.02.061. [DOI] [Google Scholar]
- Zhou J. Wang Y. Ma Y. Zhang B. Zhang Q. Appl. Surf. Sci. 2019;486:265–273. doi: 10.1016/j.apsusc.2019.04.159. [DOI] [Google Scholar]
- Mahdavinia G. R. Soleymani M. Etemadi H. Sabzi M. Atlasi Z. Int. J. Biol. Macromol. 2018;107:719–729. doi: 10.1016/j.ijbiomac.2017.09.042. [DOI] [PubMed] [Google Scholar]
- Kim U. J. Lee Y. R. Kang T. H. Choi J. W. Kimura S. Wada M. Carbohydr. Polym. 2017;163:34–42. doi: 10.1016/j.carbpol.2017.01.052. [DOI] [PubMed] [Google Scholar]
- Prata A. S. Grosso C. R. F. Carbohydr. Polym. 2015;116:292–299. doi: 10.1016/j.carbpol.2014.03.056. [DOI] [PubMed] [Google Scholar]
- Peng Z. G. Hidajat K. Uddin M. S. J. Colloid Interface Sci. 2004;271:277–283. doi: 10.1016/j.jcis.2003.12.022. [DOI] [PubMed] [Google Scholar]
- Peng Z. G. Hidajat K. Uddin M. S. Colloids Surf., B. 2004;33:15–21. doi: 10.1016/j.colsurfb.2003.08.007. [DOI] [PubMed] [Google Scholar]
- Zhou S. Deng X. Li X. J. Controlled Release. 2001;75:27–36. doi: 10.1016/S0168-3659(01)00379-0. [DOI] [PubMed] [Google Scholar]
- Xu Z. Feng Y. Liu X. Guan M. Zhao C. Zhang H. Colloids Surf., B. 2010;81:503–507. doi: 10.1016/j.colsurfb.2010.07.048. [DOI] [PubMed] [Google Scholar]
- Dai C. Wang Y. Hou X. Carbohydr. Polym. 2012;87:2338–2343. doi: 10.1016/j.carbpol.2011.11.004. [DOI] [Google Scholar]
- Liu X. Y. Zheng S. W. Hong R. Y. Wang Y. Q. Feng W. G. Colloids Surf., A. 2014;443:425–431. doi: 10.1016/j.colsurfa.2013.11.025. [DOI] [Google Scholar]
- Zhang D. H. Chen N. Yang M. N. Dou Y. F. Sun J. Liu Y. D. Zhi G. Y. J. Mol. Catal. B: Enzym. 2016;133:136–143. doi: 10.1016/j.molcatb.2016.08.007. [DOI] [Google Scholar]
- Yan X. Kong J. Yang C. Fu G. J. Colloid Interface Sci. 2015;445:9–15. doi: 10.1016/j.jcis.2014.12.022. [DOI] [PubMed] [Google Scholar]
- Yang Z. Xu J. Wang J. Zhang Q. Zhang B. Chem. Eng. J. 2019;373:923–934. doi: 10.1016/j.cej.2019.05.129. [DOI] [Google Scholar]
- Zhang W. Sun C. Zhao Y. Lu X. Int. J. Biol. Macromol. 2011;49:688–692. doi: 10.1016/j.ijbiomac.2011.06.030. [DOI] [PubMed] [Google Scholar]


