Abstract
An ultrasensitive sandwich-type electrochemical immunosensor based on AuBP@Pt nanostructures and AuPd-PDA nanozyme was developed for the detection of apolipoprotein E4 (APOE4) which was an important risk factor for Alzheimer's disease (AD). In this work, gold nanobipyramid coated Pt (AuBP@Pt) nanostructures were prepared and applied to electrochemical immunosensors as a substrate material. AuBP@Pt nanostructures have advantages of electrical conductivity and large electroactive area, which could greatly increase electron transfer rate. In previous work, we designed AuPd alloy modified polydopamine (AuPd-PDA) nanozyme which catalyzed the decomposition of hydrogen peroxide (H2O2). AuPd-PDA nanozyme was used to label detection antibody due to excellent catalytic capability and stability in this new paper. And the concentration of APOE4 could be detected quantitatively by variation for transient current. As a result, the electrochemical immunosensor based on AuBP@Pt and AuPd-PDA exhibited a wide linear range from 0.05 to 2000 ng mL−1 and low detection limit of 15.4 pg mL−1 (S/N = 3). Furthermore, the designed biosensor displayed good selectivity in phosphate buffer saline (PBS) buffer solution or commercial goat serum, which provided a promising tool for early diagnosis of AD.
An ultrasensitive sandwich-type electrochemical immunosensor based on AuBP@Pt nanostructures and AuPd-PDA nanozyme was developed for the detection of apolipoprotein E4 (APOE4) which was an important risk factor for Alzheimer's disease (AD).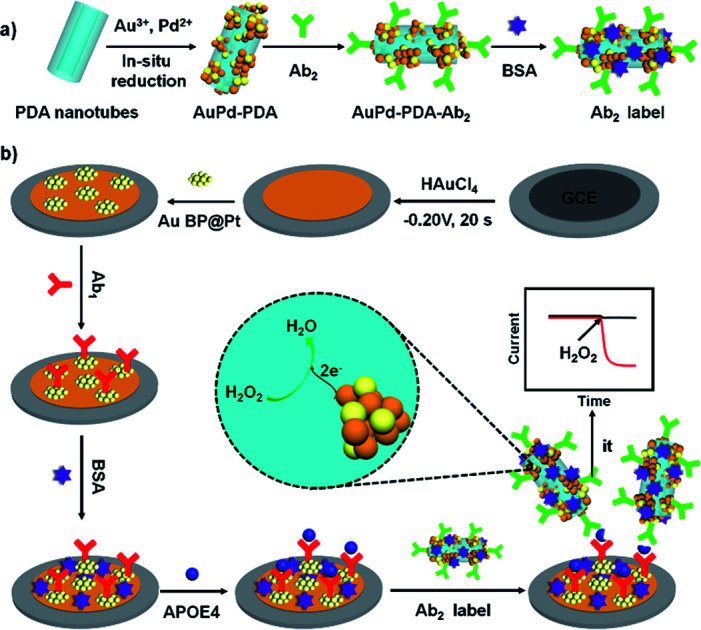
Introduction
Human apolipoprotein E4 (APOE4), a 34-kDa protein containing 299 amino acids, exacerbates Alzheimer's disease (AD) through promoting the formation of cerebral extracellular amyloid plaques and inhibiting the clearance of Aβ aggregates. Furthermore, APOE4 increased permeability of blood–brain barrier (BBB) and finally led to BBB breakdown.1–3 Lots of evidence including biochemical, cellular and clinical studies have demonstrated that APOE4 is closely related to AD pathogenesis.4,5 Based on the key role in AD pathogenesis, APOE4 has been widely recognized as a potential biomarker for AD diagnosis. Therefore, timely and accurate detection of APOE4 is significant for prevention and early diagnosis of AD and it is very necessary to develop ultrasensitive, high selectivity and easy detection methods.
In the past few years, some traditional techniques such as mass spectrometry (MS),6,7 enzyme-linked immunosorbent assays (ELISA) and western-blot analysis8,9 were used to detect APOE. However, these methods are flawed due to being low sensitivity, time-consuming, with high cost and requirement of specific equipment. In recent years, some new technologies including microarray technology,10 surface plasmon resonance (SPR),11 and electrochemistry immunosensors12 were applied to detect human APOE. Among these methods, electrochemical immunosensors have caused widespread attention due to many superiorities including rapid detection, high sensitivity and low cost.13,14 With the rapid development of nanotechnology, nanomaterials have been widely applied to electrochemical biosensing by reason of their large electroactive area, excellent biocompatibility and unique physical/chemical properties, which makes ultrasensitive detection possible. So far, a lot of studies proved that many nanomaterials with interesting morphologies, such as 3D metal–organic frameworks,15 nanoparticles,16 nanowires,17 quantum dots,18 fractal structures12 and large amounts of nanocomposites,19–21 significantly enhanced the sensitivity of the electrochemical biosensor and decreased the detection limit.
Recently, bimetallic nanostructures have caught more attention due to their integration of physicochemical properties including plasmonic functionality, optical property, magnetism, catalytic performance and electrical conductivity.22,23 For instance, Au–Pd alloy could catalyze organic reactions.24 Yan Liu et al. designed a sandwich-like electrochemical immunosensor for the detection of carbohydrate antigen based on hierarchical AuPd nanochain networks.25 Recently, our group reported a H2O2 electrochemical sensor based on AuPd alloy-modified polydopamine nanotubes (AuPd-PDA).26 AuPd-PDA nano-enzyme showed excellent catalytic activities and good stability, which could be applied to biosensor in replace of HRP in some ways. Not only that, PDA nanotubes also had many advantages including good biocompatibility, large specific surface area and unique optoelectronic properties,27,28 which could be applied for signal acquisition and signal amplification as a carrier and thus improved the sensitivity of electrochemical immunosensors.
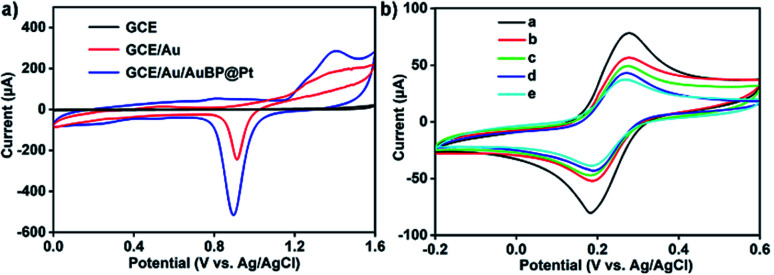
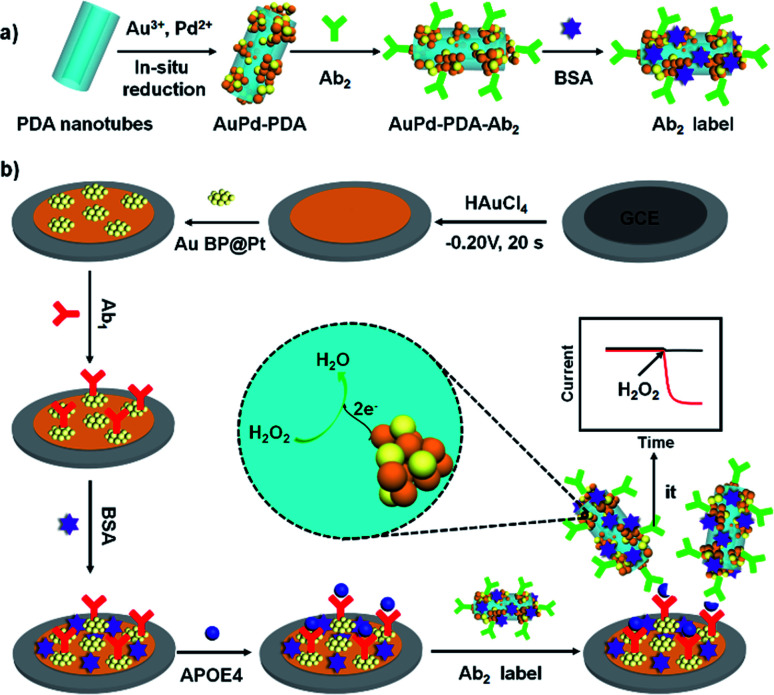
In this work, another bimetallic nanostructure, gold nanobipyramid coated Pt (AuBP@Pt) was prepared. AuBP@Pt nanostructures have good conductivity and could increase the electroactive area due to porous surface though its catalytic activity was bad (Fig. 3a and S1†). Therefore, AuBP@Pt was used to modify the electrode as a substrate material, which could greatly increase the sensitivity of sensor. Furthermore, detection antibody labelled AuPd-PDA (Ab2 label) was used to amplify signal again as a whole because of the excellent catalytic capabilities for H2O2 (ref. 26) and large surface areas. The fabrication procedure for Ab2 label was shown in Fig. 1a. In the sensing system, AuPd-PDA replaced the traditional bio-enzyme which had drawback of easier deactivation. According to previous report,29 the combination of AuPd-PDA and Ab2 was characterized by FTIR as seen in Fig. S2.† The detailed description was shown in ESI.†
Fig. 3. (a) Cyclic voltammograms of GCE, GCE/Au and GCE/Au/AuBP@Pt electrode in aqueous 0.5 M H2SO4 solution. (b) The characterization of surface-modification on GCE/Au/AuBP@Pt electrode: cyclic voltammograms of the GCE/Au/AuBP@Pt electrode (curve a) modified with Ab1 (curve b), Ab1 + BSA (curve c), Ab1 + BSA + APOE4 (curve d) Ab1 + BSA + APOE4 + Ab2 label (curve e). The cyclic voltammograms are carried out in 5 mM [Fe(CN)6]3−/[Fe(CN)6]4− at scan rates of 50 mV·s−1.
Fig. 1. The constructed process of Ab2 label (a) and the schematic illustration of the APOE4 electrochemical immunosensor (b).
Based on AuBP@Pt nanomaterials and AuPd-PDA nanozyme, we constructed an APOE4 electrochemical immunosensor, which exhibited high sensitivity and low detection limit in phosphate buffered saline (PBS) or commercial goat serum. The schematic illustration of the fabricated APOE4 electrochemical immunosensor was shown in Fig. 1b. The electrochemical immunosensor included working electrode and electrochemical detection system. Firstly, Au nanoparticles that had advantages of good biocompatible and excellent conductivity were electrodeposited on the surface of GCE, which increased the binding site of primary antibody (Ab1) and accelerated the electron transfer.30,31 Secondly, AuBP@Pt nanoparticles were dropped on the surface of electrode, and then the working electrode was obtained. In the electrochemical detection system, AuPd-PDA, as a nanozyme, could catalyze hydrogen peroxide (H2O2) decomposition, during which the change of current was monitored.26 The detection limit of our designed electrochemical immunosensor is 15.4 pg mL−1 and the available linear range is from 0.05 ng mL−1 to 2000 ng mL−1. This result made a tremendous progress compared to our previous work, which provided potential detection method for early diagnosis of AD.
Experimental section
Apparatus and reagents
The morphology of Au BPs and AuBP@Pt nanostructures was characterized by scanning electron microscopic (SEM, Quanta 250, FEI, USA), transmission electron microscopic (JEOL 200CX TEM, JEOL Ltd., Tokyo, Japan), energy dispersive X-ray (EDX) elemental mapping analysis (Quanta 250, FEI, USA) and UV-vis spectrum (HITACHI, U-4100). Electrochemical measurements were all performed using a CHI760e electrochemical analyzer (ChenHua Instruments, Shanghai, China). The FTIR spectrum was performed by a Nicolet 6700 spectrophotometer (Thermo, USA).
Monoclonal human APOE4 antibody (Ab1), polyclonal human apolipoprotein E4 antibody (Ab2), human APOE4 protein and bovine serum albumin (BSA) were purchased from Novus Biologicals Ltd. Hydrogen tetrachloroaurate(iii) trihydrate (HAuCl4·3H2O), palladium chloride (PdCl2), chloroplatinic acid (H2PtCl6·6H2O) and dopamine were obtained from Sigma-Aldrich. The phosphate-buffered saline (PBS, 0.01 M, pH = 7.4) was used as incubating and washing buffer solution. All chemicals were of analytical grade and used without further purification. All solvents were ultrapure water (Milli-Q, 18.2 MΩ cm).
Preparation of AuBP@Pt
Firstly, the Au BPs were prepared by seed-mediated growth according to the ref. 32. In this work, the longitudinal plasmon wavelength of our used Au BPs was about 808 nm (Fig. S3†). Secondly, the AuBP@Pt nanostructure was prepared by adding Au BPs (OD = 2, 2 mL) with a longitudinal plasmon wavelength of 808 nm into a growth solution including CTAB (6 mL, 0.03 M), ascorbic acid (0.24 mL, 0.1 M), and H2PtCl4 (0.12 mL, 0.01 M). The obtained solution was mixed and then placed in the oven at 65 °C for 6 h. Finally, AuBP@Pt nanostructures could be obtained. In this experiment, the preparation method referred to the previous research about the preparation of Au nanorod core–Pd shell nanostructures.33
Fabrication of GCE/Au/AuBP@Pt electrode
Firstly, glassy carbon electrode (GCE, 3 mm) was polished and sonicated in ethanol and ultrapure water successively for 10 min. And then the GCE electrode was dried by N2. Secondly, the GCE electrode was electrodeposited with Au nanoparticles. The electrodeposition was proceeded by 20 s in H2SO4 (0.5 M) containing 10 mg mL−1 HAuCl4 at −0.2 V. Finally, 10 μL AuBP@Pt solution (1 mg mL−1) was dropped on the surface of electrode surface.
Fabrication of the electrochemical immunosensor
The GCE/Au/AuBP@Pt electrode was rinsed with ultrapure water for one minute and then was dried by N2 flow. The construction of sensing interface was carried out on the GCE/Au/AuBP@Pt surface by successive self-assembling procedures. First of all, 10 μL Ab1 (100 μg mL−1) was dropped onto the surface of GCE/Au/AuBP@Pt electrode and incubated 1.0 h at 37 °C. Secondly, bovine serum albumin (BSA, 1.0 mg mL−1) was applied to block non-specific binding sites of electrode surface. Thirdly, APOE4 of certain concentration (6 μL) dripped on the surface of electrode and incubated for 1.0 h at 37 °C. Finally, 50 μg mL−1 Ab2 label were added and incubated 1.0 h at 37 °C. After each step, the surface was washed three times by PBS (0.01 M).
The measurements of analytical performance
All electrochemical analysis was carried out through three-electrode system. The GCE/Au/AuBP@Pt electrode modified by Ab1 served as working electrode and Ag/AgCl electrode was used for reference electrode. The counter electrode used platinum electrode. The electrochemical assay was performed by amperometric measurements in 15 mL PBS buffer at −0.25 V under constant stirring. When transient currents tended to a steady-state value, 150 μL of H2O2 (400 mM) was rapidly added to the PBS buffer solution. The change of momentary current was monitored.
The selectivity of fabricated electrochemical biosensor was investigated by the same procedure in PBS buffer containing other proteins, such as BSA, APOE2 and APOE3. Moreover, commercial goat serum containing various proteins was used to prove the specificity and potential application value. The detailed procedures were as follows. 10 μL Ab1 (100 μg mL−1) was dropped onto the surface of GCE/Au/AuBP@Pt electrode and incubated at 37 °C for 1.0 h. Then, 6 μL BSA (1 mg mL−1) was applied to block the non-specific adsorption sites. Thirdly, a 6 μL diluted goat serum containing different concentration of APOE4 (1 ng mL−1, 10 ng mL−1, 100 ng mL−1) was dropped onto the surface of electrode at 37 °C for 1 h. Finally, 10 μL Ab2 label (50 μg mL−1) were added and incubated at 37 °C for 1 h. Beyond the incubation, other experiments were all performed at room temperature.
Results and discussion
Characterization of the AuBP@Pt nanostructures
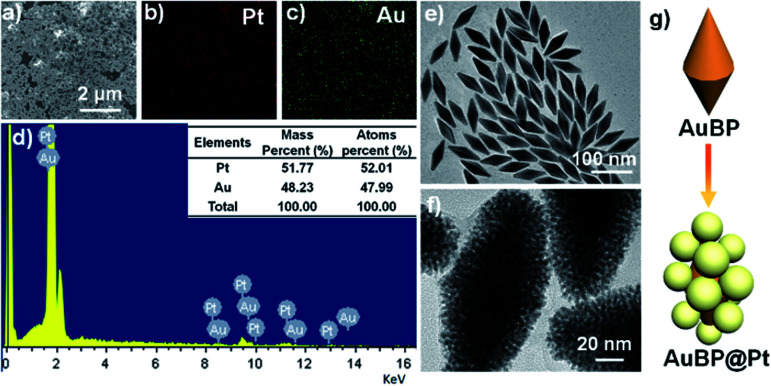
Before the preparation of AuBP@Pt nanostructures, the Au BPs were prepared by seed-mediated growth according to the ref. 32. The morphology and extinction spectrum were shown in Fig. 2e and S3.† The result demonstrated that the size of Au BPs was about 80 nm length and 30 nm width (Fig. 2e) and the Au BPs had a longitudinal plasmon wavelength of ∼808 nm (Fig. S3†).
Fig. 2. The EDX mapping analysis (a–d) and TEM image (f) of AuBP@Pt nanostructures. (e) The SEM image of AuBP. (g) The schematic illustrating the variation from AuBP to AuBP@Pt.
And then, the AuBP@Pt nanostructures were prepared by adding Au BPs into a mixed solution including CTAB, ascorbic acid, and H2PtCl4 at 65 °C for 6 h. The detailed concentration of each component was seen in the Experimental section. The characterization of the AuBP@Pt nanostructures was shown in Fig. 2. Overall, the AuBP@Pt exhibited a nano bipyramid morphology with about 100 nm length and 50 nm width (Fig. 2f). The surface of AuBP@Pt nanostructures was composed of many Pt nanoparticles with a diameter of 2 nm according to the typical TEM images Fig. 2f, which was porous. The porous nanostructures further increased the binding sites of primary antibody. Not only that, the porous nanostructures also enhanced the electron transfer rate, which contributed to enhance the sensitivity of sensor. Moreover, the EDX mapping analysis was carried out and the distribution of Au and Pt elements on the surface was shown in Fig. 2a–d. The result of EDX spectrum showed that the atomic ratio of Au/Pt on the surface of AuBP@Pt was about 48 : 52 (Fig. 2d). No other metallic element was observed, which proved the purity of the AuBP@Pt nanostructures.
Fabrication of GCE/Au/AuBP@Pt electrode and sensing interface
After the preparation of AuBP@Pt nanostructure, the GCE/Au/AuBP@Pt electrode was constructed by following procedures. Firstly, the GCE electrode was polished and then was electrodeposited with Au nanoparticles according to the ref. 31. And the detailed process was seen in Experimental section. Finally, 5 μL AuBP@Pt solution was dropped onto the electrode surface. Now a good electrode based on GCE/Au/AuBP@Pt was obtained by a series of procedures above.
As Fig. 3a showed, when Au nanoparticles were electrodeposited on the surface of GCE, the electroactive area significantly increased. After the AuBP@Pt was dropped onto the Au nanoparticles surface, the electroactive area further got larger. Therefore, the introduction of Au/AuBP@Pt nanostructures enhanced the sensitivity of the sensor to some extent. After the construction of the GCE/Au/AuBP@Pt electrode, the electrochemical immunosensor was constructed through successively self-assembly procedures and the process was studied by CV measurements and electrochemical impedance spectroscopy (EIS). As shown in Fig. 3b, the peak current gradually reduced from curve a to curve f. The GCE/Au electrode showed a peak current of 75 μA (Fig. 3b, curve a). After the GCE/Au/AuBP@Pt electrode was modified with Ab1, the peak current decreased significantly (Fig. 3b, curve b), which demonstrated that Ab1 hindered the electron transfer of electrode surface in some way. And then BSA was used to block the non-specific adsorption sites on the surface. At the moment, the peak current was down to 50% of initial value (Fig. 3b, curve c), which indicated that non-specific binding sites on the surface had been blocked. As shown blue and cyan curve (curve d and e) in Fig. 3b, the peak current decreased again with the modification of APOE4 protein and Ab2 to the GCE/Au/AuBP@Pt surface.
To further proved the process of assembly, electrochemical impedance spectroscopy (EIS) was carried out as shown in Fig. S7.† The bare GCE/Au/AuBP@Pt exhibits a small resistance (Fig. S7,† curve a). When Ab1 (Fig. S7,† curve b), BSA (Fig. S7,† curve c), APOE4 (Fig. S7,† curve d) and Ab2 label (Fig. S7,† curve e) were immobilized layer by layer on the surface of electrode, the resistance increased gradually due to the modified protein. This result was consistent with the conclusion of the CVs. According to above analysis, it was inferred that the sensing interface was constructed successfully. At last, the quantification of APOE4 was monitored by chronoamperometry in the presence of H2O2.
The study of sensing performance
To obtain better sensing performance for detection of APOE4, the experimental conditions including the volume of AuBP@Pt solution and the concentration of H2O2 were optimized. As shown in Fig. S4,† the electrochemical current response for the reduction of H2O2 in PBS was largest when the volume of AuBP@Pt was 10 μL. It is inferred that appropriate volume of AuBP@Pt could efficiently improve the analytical performance when the concentration of AuBP@Pt was constant. We inferred that excessive AuBP@Pt could block the electron transfer. Therefore, an optimal volume was 10 μL. Moreover, the concentration of H2O2 was optimized and the result was shown in Fig. S5.† The optimal concentration of H2O2 was 2 mM. Because higher H2O2 concentration had strong oxidability, which could destroy the interaction of antigen and antibody. In addition, the results about stability was shown in Fig. S6.† The initial response decreased only 5.1% after a storage of 7 days in refrigerator at 4 °C, which indicated the sensor had good stability.
Under the optimal conditions, the developed electrochemical immunosensor based on AuBP@Pt and AuPd-PDA was applied to detect quantitatively APOE4. According to our previous report,26 the AuPd-PDA nanotubes could catalyze hydrogen peroxide (H2O2) decomposition and the optimal potential was −0.25 V, during which the changes of electrochemical signal (reductive current) could be monitored. Based on this principle, the APOE4 could be detected quantitatively by the change value of current.
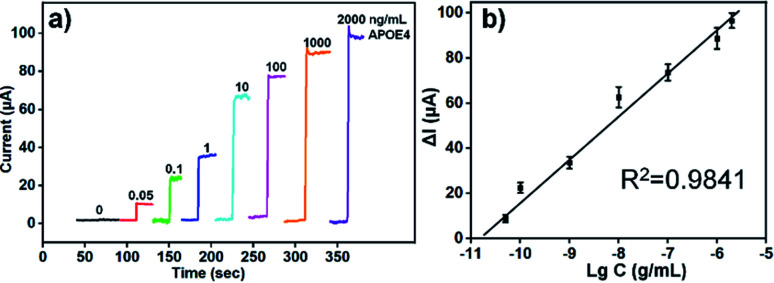
The change value of current response (ΔI) were monitored by chronoamperometry when different concentration of human APOE4 were added. According to our previous study, the optimized concentrations of Ab1 were 100 μg mL−1 and the concentration of Ab2 was about 50 μg mL−1. As shown in Fig. 4a, the transient current reached a steady state rapidly with add of H2O2 and the change value enhanced with the increase of APOE4 concentration. Fig. 4b showed the relationship between change value of current and logarithm of human APOE4 concentration. The ΔI and logarithm of APOE4 concentration from 0.05 ng mL−1 to 2000 ng mL−1 existed linear relationship. And the detection limit of our developed electrochemical immunosensor was about 15.4 pg mL−1 (S/N = 3). According to previous report, the concentration of human APOE4 in serum was about μg mL−1 level for the individuals who had APOE4 allele.34 And thus, the detection limit of our designed electrochemical immunosensor based on AuBP@Pt and AuPd-PDA could satisfy the requirements of clinical application in this respect.
Fig. 4. (a) Amperometric i–t results of the APOE4 immunosensor for reduction of H2O2 (2 mM) under constant stirring when detecting different concentrations of human APOE4 protein range from 0.05 ng mL−1 to 2000 ng mL−1. (b) Calibration curve of the designed immunosensor for the detection of APOE4. The equation: ΔI = 18.191 lg C + 200.78, R2 = 0.9841. Error bar = relative standard deviation (n = 3).
Furthermore, compared to the previous methods for the detection of APOE or APOE4, the designed electrochemical immunosensor had a wider linear range from 0.05 ng mL−1 to 2000 ng mL−1 and lower detection limit of 15.4 pg mL−1. And the detailed comparison was shown in Table S1.† In this work, porous Au/AuBP@Pt substrate materials could increase the binding sites of antibody and electron transfer rate, which enhanced the sensitivity of sensor. What's more, AuPd-PDA, as a nanoenzyme, could catalyze hydrogen peroxide (H2O2) decomposition replacing the traditional bio-enzyme, which was more stable than traditional bio-enzyme. Therefore, our designed APOE4 electrochemical immunosensor based on AuBP@Pt nanomaterials and AuPd-PDA nanoenzyme exhibited excellent sensing performance.
The selectivity, reproducibility of constructed electrochemical immunosensor
The selectivity of developed APOE4 electrochemical immunosensor based on AuBP@Pt and AuPd-PDA was tested. Fig. 5a presented the histogram of the change value of instantaneous current in the presence of 1 ng mL−1 APOE4, 1 μg mL−1 BSA, 1 μg mL−1 APOE2 or 1 μg mL−1 APOE3 and the PBS buffer as a control. There was an obvious signal response only if human APOE4 existed, which was an average of 32.33 μA. But the ΔI for BSA, APOE2 and APOE3 were 0.68, 1.80, 2.03 μA, which accounted for 2.1%, 5.6%, and 6.2% of the ΔI for APOE4, respectively. This result indicated that the selectivity of as-fabricated electrochemical immunosensor was acceptable.
Fig. 5. (a) Current change value of the APOE4 electrochemical immunosensor for different protein including BSA, APOE2, APOE3, APOE4. (b) The current response of APOE4 electrochemical immunosensor for goat serum containing different concentration human APOE4. (c) The histogram of current change value of (b). The error bars represent relative standard deviation (n = 5).
To evaluate reproducibility and clinical potential of the electrochemical immunosensor, the commercial goat serum diluted with PBS buffer was used as electrolyte to detect the APOE4. Three groups of GCE/Au/AuBP@Pt electrodes (each group include 5 electrodes) were used to detect different concentration of human APOE4 protein (1.0, 10 and 100 ng mL−1) in goat serum. As shown in Fig. 5b and c, a good response for human APOE4 protein in goat serum was observed, which further proved that the APOE4 electrochemical immunosensor had a good selectivity. Moreover, the recovery and RSD for five electrodes were calculated and the result was shown in Table S2.† The RSD of the three groups was all less than 6%, which manifested that the sensor had a good reproducibility and potential application value in the real biological sample.
Conclusions
In conclusion, an ultrasensitive electrochemical immunosensor based on AuBP@Pt nanostructures and AuPd-PDA nanozyme was developed for the detection of APOE4. Porous AuBP@Pt nanomaterials could enhance the binding sites of antibody and electron transfer rate due to large electroactive area and good conductivity. More importantly, AuPd-PDA nanozyme was used to label detection antibody due to excellent catalytic capability and stability, which further amplified the detected signals and increased the sensitivity. Based on these advantages of AuBP@Pt and AuPd-PDA, the constructed electrochemical biosensor exhibited a low detection limit of 15.4 pg mL−1 (S/N = 3) and a wide linear range from 0.05 ng mL−1 to 2000 ng mL−1. Besides, the biosensor displayed good specificity and reproducibility in PBS buffer or commercial goat serum. This work not only provides a strong support for the prevention and early diagnosis of AD susceptible populations but also offers a promising tool for bioanalysis.
Conflicts of interest
There are no conflicts to declare.
Supplementary Material
Acknowledgments
The work was supported by Natural Science Foundation of Education Department of Henan Province (18B150011, 19A430018), Natural Science Foundation of China (Grant No. 51902123).
Electronic supplementary information (ESI) available: The Reproducibility, selectivity, stability of the electrodes and some additional supporting information. See DOI: 10.1039/d0ra00298d
Notes and references
- Liu C.-C. Zhao N. Fu Y. Wang N. Linares C. Tsai C.-W. Bu G. Neuron. 2017;96:1024–1032. doi: 10.1016/j.neuron.2017.11.013. [DOI] [PMC free article] [PubMed] [Google Scholar]
- Bell R. D. Winkler E. A. Singh I. Sagare A. P. Deane R. Wu Z. Holtzman D. M. Betsholtz C. Armulik A. Sallstrom J. Berk B. C. Zlokovic B. V. Nature. 2012;485:512–516. doi: 10.1038/nature11087. [DOI] [PMC free article] [PubMed] [Google Scholar]
- Nishitsuji K. Hosono T. Nakamura T. Bu G. J. Michikawa M. J. Biol. Chem. 2011;286:17536–17542. doi: 10.1074/jbc.M111.225532. [DOI] [PMC free article] [PubMed] [Google Scholar]
- Kanekiyo T. Xu H. Bu G. Neuron. 2014;81:740–754. doi: 10.1016/j.neuron.2014.01.045. [DOI] [PMC free article] [PubMed] [Google Scholar]
- Liu C.-C. Kanekiyo T. Xu H. Bu G. Nat. Rev. Neurol. 2013;9:106–118. doi: 10.1038/nrneurol.2012.263. [DOI] [PMC free article] [PubMed] [Google Scholar]
- Wang M. Chen J. Turko I. V. Anal. Chem. 2012;84:8340–8344. doi: 10.1021/ac3018873. [DOI] [PMC free article] [PubMed] [Google Scholar]
- Sullivan P. M. Han B. Liu F. Mace B. E. Ervin J. F. Wu S. Koger D. Paul S. Bales K. R. Neurobiol. Aging. 2011;32:791–801. doi: 10.1016/j.neurobiolaging.2009.05.011. [DOI] [PubMed] [Google Scholar]
- Vincent-Viry M. Schiele F. Gueguen R. Bohnet K. Visvikis S. Siest G. Clin. Chem. 1998;44:957–965. doi: 10.1093/clinchem/44.5.957. [DOI] [PubMed] [Google Scholar]
- Taddei K. Clarnette R. Gandy S. E. Martins R. N. Neurosci. Lett. 1997;223:29–32. doi: 10.1016/S0304-3940(97)13394-8. [DOI] [PubMed] [Google Scholar]
- Morales-Narváez E. Montón H. Fomicheva A. Merkoçi A. Anal. Chem. 2012;84:6821–6827. doi: 10.1021/ac301369e. [DOI] [PubMed] [Google Scholar]
- Yi X. Xia Y. Ding B. Wu L. Hu S. Wang Z. Yang M. Wang J. ACS Sens. 2018;3:2402–2407. doi: 10.1021/acssensors.8b00845. [DOI] [PubMed] [Google Scholar]
- Liu Y. Xu L.-P. Wang S. Yang W. Wen Y. Zhang X. Biosens. Bioelectron. 2015;71:396–400. doi: 10.1016/j.bios.2015.04.068. [DOI] [PubMed] [Google Scholar]
- Shui B. Tao D. Cheng J. Mei Y. Jaffrezic-Renault N. Guo Z. Analyst. 2018;143:3549–3554. doi: 10.1039/C8AN00527C. [DOI] [PubMed] [Google Scholar]
- Negandary M. Heli H. Talanta. 2019;198:510–517. doi: 10.1016/j.talanta.2019.01.109. [DOI] [PubMed] [Google Scholar]
- Guanhui Z. Yaoguang W. Xiaojian L. Qi Y. Xue D. Bin D. Wei C. Qin W. Anal. Chem. 2019;91:1989–1996. doi: 10.1021/acs.analchem.8b04332. [DOI] [PubMed] [Google Scholar]
- Shu T. Su L. Wang J. Li C. Zhang X. Biosens. Bioelectron. 2015;66:155–161. doi: 10.1016/j.bios.2014.10.073. [DOI] [PubMed] [Google Scholar]
- Li B. R. Hsieh Y. J. Chen Y. X. Chung Y. T. Pan C. Y. Chen Y. T. J. Am. Chem. Soc. 2013;135:16034–16037. doi: 10.1021/ja408485m. [DOI] [PubMed] [Google Scholar]
- Xu R. Wei D. Du B. Cao W. Fan D. Zhang Y. Wei Q. Ju H. Biosens. Bioelectron. 2018;122:37–42. doi: 10.1016/j.bios.2018.09.030. [DOI] [PubMed] [Google Scholar]
- Zengqiang G. Yueyun L. Chunyan Z. Shuan Z. Yilei J. Faying L. Hui D. Xinjin L. Zhiwei C. Qin W. ACS Appl. Mater. Interfaces. 2019;11:12335–12341. doi: 10.1021/acsami.9b01445. [DOI] [PubMed] [Google Scholar]
- Qin J. Cho M. Lee Y. ACS Appl. Mater. Interfaces. 2019;11:11743–11748. doi: 10.1021/acsami.8b21425. [DOI] [PubMed] [Google Scholar]
- Wang Y. Fan D. Zhao G. Feng J. Wei D. Zhang N. Cao W. Du B. Wei Q. Biosens. Bioelectron. 2018;120:1–7. doi: 10.1016/j.bios.2018.08.026. [DOI] [PubMed] [Google Scholar]
- Gilroy K. D. Ruditskiy A. Peng H.-C. Qin D. Xia Y. Chem. Rev. 2016;116:10414–10472. doi: 10.1021/acs.chemrev.6b00211. [DOI] [PubMed] [Google Scholar]
- Zhang L. Xie Z. Gong J. Chem. Soc. Rev. 2016;45:3916–3934. doi: 10.1039/C5CS00958H. [DOI] [PubMed] [Google Scholar]
- Sarina S. Zhu H. Jaatinen E. Xiao Q. Liu H. Jia J. Chen C. Zhao J. J. Am. Chem. Soc. 2013;135:5793–5801. doi: 10.1021/ja400527a. [DOI] [PubMed] [Google Scholar]
- Liu Y. Weng X. Wang K.-K. Xue Y. Wang A.-J. Wu L. Feng J.-J. Sens. Actuators, B. 2017;247:349–356. doi: 10.1016/j.snb.2017.03.024. [DOI] [Google Scholar]
- He G. Gao F. Li W. Li P. Zhang X. Yin H. Yang B. Liu Y. Zhang S. Anal. Methods. 2019;11:1651–1656. doi: 10.1039/C8AY02743A. [DOI] [Google Scholar]
- Liu Y. Ai K. Lu L. Chem. Rev. 2014;114:5057–5115. doi: 10.1021/cr400407a. [DOI] [PubMed] [Google Scholar]
- Wang S. Guan B. Y. Yu L. Lou X. W. Adv. Mater. 2017;29:1702724. doi: 10.1002/adma.201702724. [DOI] [PubMed] [Google Scholar]
- Hu W. He G. Zhang H. Wu X. Li J. Zhao Z. Qiao Y. Lu Z. Liu Y. Li C. M. Anal. Chem. 2014;86:4488–4493. doi: 10.1021/ac5003905. [DOI] [PubMed] [Google Scholar]
- Wei Y. Li Y. Li N. Zhang Y. Yan T. Ma H. Wei Q. Biosens. Bioelectron. 2016;79:482–487. doi: 10.1016/j.bios.2015.12.082. [DOI] [PubMed] [Google Scholar]
- Zhang X. Li Y. Lv H. Feng J. Gao Z. Wang P. Dong Y. Liu Q. Zhao Z. Biosens. Bioelectron. 2018;106:142–148. doi: 10.1016/j.bios.2018.02.001. [DOI] [PubMed] [Google Scholar]
- Li Q. Zhuo X. Li S. Ruan Q. Xu Q.-H. Wang J. Adv. Opt. Mater. 2015;3:801–812. doi: 10.1002/adom.201400505. [DOI] [Google Scholar]
- Chen H. Wang F. Li K. Woo K. C. Wang J. Li Q. Sun L.-D. Zhang X. Lin H.-Q. Yan C.-H. ACS Nano. 2012;6:7162–7171. doi: 10.1021/nn302220y. [DOI] [PubMed] [Google Scholar]
- Lefranc D. Vermersch P. Dallongeville J. Daems-Monpeurt C. Petit H. Delacourte A. Neurosci. Lett. 1996;212:91–94. doi: 10.1016/0304-3940(96)12774-9. [DOI] [PubMed] [Google Scholar]
Associated Data
This section collects any data citations, data availability statements, or supplementary materials included in this article.


