Abstract
Respiration monitoring equipment has wide applications in daily health monitoring and modern medical diagnosis. Despite significant progress being made in humidity sensors for respiration monitoring, the fabrication of the humidity sensors with low-cost, simple manufacturing process and easy integration remains a challenge. This work reports a facile and inexpensive laser printing fabrication of PEDOT:PSS micron line as a humidity sensor for respiration monitoring. Laser printing technology can process any material into an arbitrary pattern. The PEDOT:PSS micron line humidity sensor has a fast response–recovery time (0.86 s/0.59 s), demonstrating excellent performance for real-time monitoring of human respiration. Furthermore, the PEDOT:PSS micron line humidity sensor can also monitor the respiration of rats under different physiological conditions along with the drug injection. The PEDOT:PSS micron line humidity sensor features simple manufacturing process with commercial materials, and easy integration with wearable devices. This work paves an important step in real-time monitoring of human health and further physiology and pharmacology study.
This work reports a facile and inexpensive laser printing fabrication of PEDOT:PSS micron line as a humidity sensor for respiration monitoring.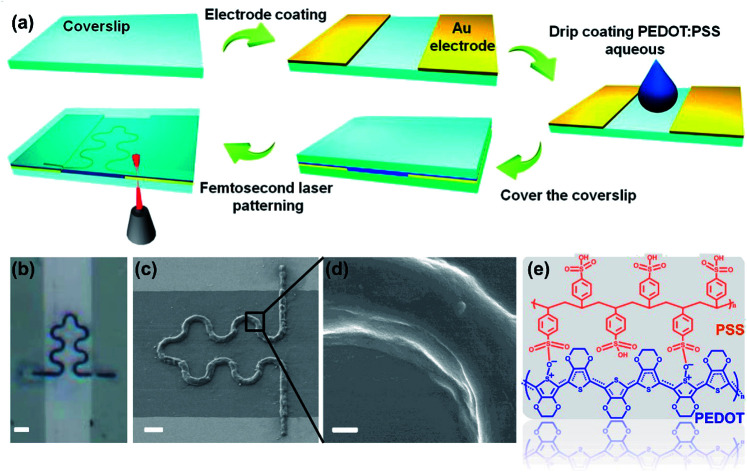
Introduction
Wearable sensors have received widespread attention arising from their enormous potential in motion data collection and real-time health monitoring.1 Wearable sensors enable the human health monitoring by real-time measurement of physiological parameters, such as blood pressure, heartbeat, body temperature, respiration, and bodily motions.2 Respiration is an important physiological activity of the human, which not only reflects people's exercise state, but also is one of the important health indicators.3 The external symptoms of pneumonia, asthma, obstructive sleep apnea and many other diseases include respiratory abnormalities. A variety of advanced respiration monitoring devices have been developed for health monitoring and medical diagnosis.4 Although the traditional respiration monitoring devices are generally functional, their portability and expenses are still challenges. Therefore, the design of epidermal real-time monitoring devices has broad application prospects.
There is a significant change in the concentration of water molecules during the respiration process. Regardless of the relative humidity of the environment, the inhalation process causes the local relative humidity to drop due to the airflow carrying away the water vapor in the air, while exhalation process will cause local relative humidity to rise due to the exhaled water. Therefore, monitoring respiration with a humidity sensor is less affected by the environment when compared with conventional air flow meters, mechanical sensors,5 and thermal sensors.6 To date, a flurry of research studies have been made towards developing humidity sensors to monitor respiration. Ren et al. successfully grew graphene by CVD and modified porous graphene for wearable respiration monitoring equipment.7 Long et al. prepared electrospinning Ag/alginate nanofibers to create a smart mask that can monitor respiration in real-time.8 Kano et al. used a cosputtering method to prepare all-inorganic Si NCs to create a humidity sensor with ultra-fast response–recovery time to monitor human respiration and water evaporation on skin in real-time.9 Choi et al. used a spin coating method to deposit poly lactic glycolic acid (PLGA) ink on a flexible substrate to make an all-range sensitive and biocompatible humidity sensor for wearable health monitoring.10 These studies have paven the way for wearable humidity sensors to monitor the progress of respiration. However, the current developments in this field still face many challenges. So for, the humidity sensors for respiration monitoring are mainly fabricated by spin coating, spray coating,11 drop-casting,12 and CVD growth.13 These methods are generally suitable for large-area macroscopic devices; unfortunately, such methods don't support micron-scale miniaturized devices manufacture, limiting their integration with other functional devices. Recent works have reported effective approaches to fabricate miniaturized sensors, including silicon bulk micromachining,14,15 LIGA16 and EBL17etc. However, these approaches are costly, complicated, and with restricted material selection. Many humidity sensor studies focus on material synthesis, which is often complex and time consuming.18 Therefore, a simple and fast manufacturing process and commercial materials are sought for manufacturing a small size micro-humidity sensor. This is of great significance for reducing costs and promoting the development of humidity sensors. Furthermore, the current studies generally monitor human respiration, and few studies monitor animal respiration. In medical research cases, it is necessary to monitor the respiration of small experimental animals to study physiological and pharmacological subjects, such as brain nerve activity and drug delivery during respiration.19 Therefore, it is meaningful to develop a sensor capable of monitoring the respiration of small experimental animals.
Femtosecond laser printing is a micro–nanofabrication technology combining the advantages of high precision, arbitrary patterning and wide processing materials choice.20,21 Microsensors fabricated by femtosecond laser printing feature small size, easy integration, low power consumption, economical for raw materials and non-intrusive. In this contribution, a micron line humidity sensor was fabricated by printing a commercial conductive polymer PEDOT:PSS with femtosecond laser. The PEDOT:PSS micron line humidity sensor demonstrates a macro device size of about 6 mm2, which is easy to assemble into a wearable respiration monitoring device with a mask. The PEDOT:PSS micron line humidity sensor has a micro effective working area of less than 100 μm2, which is convenient for integration with other functionalized sensing chips. The PEDOT:PSS micron line humidity sensor has small humidity hysteresis and fast response–recovery time of 0.86 s and 0.59 s, respectively. The PEDOT:PSS micron line humidity sensor achieves real-time monitoring of human respiration; it can distinguish different respiratory rates. More importantly, the PEDOT:PSS micron line humidity sensor achieves respiration monitoring of rats. The difference in respiration between rats before and after drug injection were clearly differentiated and monitored in real time. This feature demonstrates the enormous potential of the PEDOT:PSS micron line humidity sensor in physiology and pharmacology research.
Experimental
Fabrication of PEDOT:PSS micron line humidity sensor
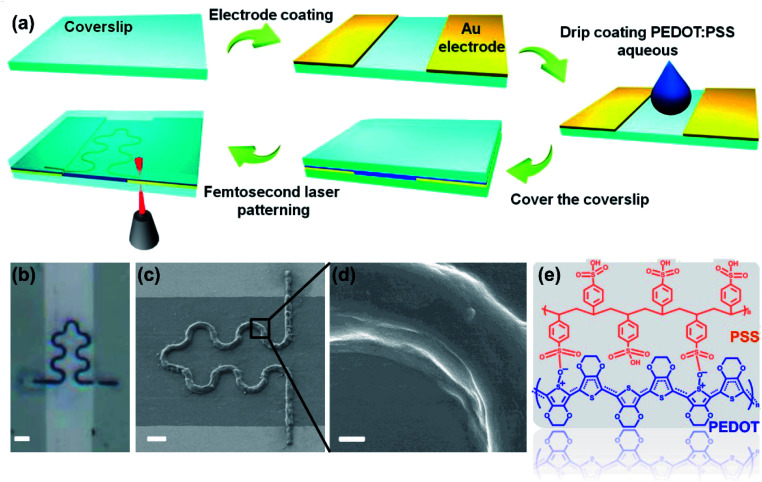
Gold electrode was evaporated on the surface of clean cover glass with a thickness of 30 nm. The channel width between two electrodes is about 30 μm. The cover glass with the gold electrode was placed on the sample stage of the femtosecond laser printing system (Fig. S1†), which includes a 60× oil mirror with a numerical aperture of 2.5 and an 800 nm femtosecond laser with laser power of 5 mW. The details of the laser printing system were elaborated in our previous work.22,23 Commercial PEDOT:PSS aqueous solution was dropped in the middle of the electrodes channel. After covering the droplets with another clean cover slip, the PEDOT:PSS aqueous solution filled the entire channel (Fig. 1a). Designed S-shaped pattern was input into the computer, which controlled the sample stage to complete the laser printing of the sample.24 Then the sample was rinsed by deionized water to remove the unprocessed PEDOT:PSS solution. The device can be cut to proper size according to specific application. Silver wire was fixed on the electrode with silver conductive adhesives for subsequent measurement (Fig. 2).
Fig. 1. (a) Fabrication schematic of the PEDOT:PSS micron line humidity sensor. (b) Optical microscope photograph of the PEDOT:PSS micron line humidity sensor (scale bar represents 10 μm). (c) SEM image of the S-shaped PEDOT:PSS micron line (scale bar represents 5 μm). (d) Zoomed in SEM image of the bend portion in the PEDOT:PSS micron line (scale bar represents 500 nm). (e) Molecular structure of PEDOT:PSS.
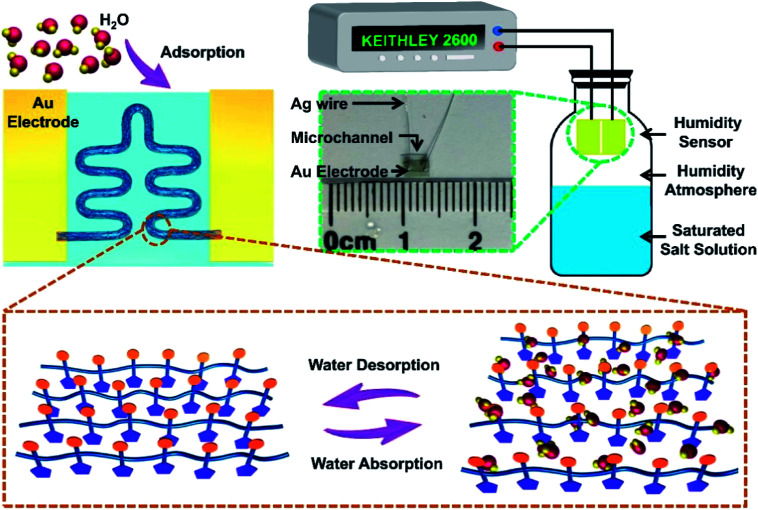
Fig. 2. The sensing mechanism of PEDOT:PSS micron line humidity sensor. Measurement system of the PEDOT:PSS micron line humidity sensor and photograph of the sensor.
Characterization and measurement
SEM images were taken by a JEOL JSM-7500 field-emission scanning electron microscope (FE-SEM). Different saturated salt solutions in equilibrium states produce different humidity environments including LiCl for 11% RH, CH3COOK for 23% RH, MgCl2 for 33% RH, K2CO3 for 43% RH, NaBr for 59% RH, and KI for 69% RH.25 The measurement system of the humidity sensors is shown in Fig. 2.26 Current–time curves of the PEDOT:PSS micron line humidity sensors were measured with a Keithley 2600 SourceMeter characterization system. Informed consent has been obtained for any experimentation with human subjects.
Real-time respiration monitoring of SD rats
Adult male SD rats with weights of 180–220 g were purchased from the Animal Experiment Center of Jilin University (Changchun, China). The rats were kept at a standard room temperature of 22 ± 3 °C, 45 ± 10% humidity, and 12 h light/dark cycles. The rats were supplied with standard laboratory food and had free access to tap water before experiments. Urethane (1 g kg−1 i.p.) was used to anesthetize the rats. When a rat entered into deep anesthesia, the humidity sensor was placed at a distance of about 3 mm from its mouth to monitor the rat's respiratory condition. Another rat was anesthetized, and after deep anesthesia, 0.3 mL nikethamide was injected (0.25 g mL−1 nikethamide injection was used to selectively excite the medullary respiratory center and increase the respiratory center's carbon dioxide sensitivity, which made the breathing deeper). Then the changes in respiratory status of anesthetized rats were monitored. All animal procedures were performed following the National Institute of Health Guide for the Care and Use of Laboratory Animals. Also, the rat experiments received approval from the Medical Ethics Committee of Basic Medical College of Jilin University.
Results and discussion
Fig. 1a shows the schematic diagram of a humidity sensor fabricated by femtosecond laser printing a PEDOT:PSS aqueous solution. The spot of the femtosecond laser is focused at the interface of the PEDOT:PSS aqueous solution and the glass substrate. The plasma-enhanced photothermal effect of the focused spot at the interface caused the solvent to evaporate at the spot, in which microbubbles were then generated and solutes were precipitated from the solution. The microbubble captured and immobilized the PEDOT:PSS solute on the glass substrate through coordinated actions of surface tension, gas pressure, and substrate adhesion. Through the movement of the laser focused spot, patterned deposition of PEDOT:PSS microstructure was achieved.27 We processed the S-shaped curve to demonstrate the ability of the laser printing system to fabricate arbitrary two-dimensional patterns of the PEDOT:PSS aqueous solution. In flexible stretchable devices, the use of an S-shaped (serpentine) pattern helps improve the mechanical stability of the device.28 At the same time, the use of a serpentine interconnect can minimize the effect of strain on the sensor performance during deformation.29 Although flexible devices are not shown in this work, laser printing technology can be applied to the process on flexible substrates. This work uses the serpentine pattern to pave the way for future integration of PEDOT:PSS on flexible devices. It is worth noting that this work is the first report of femtosecond laser printing PEDOT:PSS aqueous solution. Fig. 1b is the optical microscope photograph of the PEDOT:PSS micron line. It can be seen that the S-shaped curve is completely in the non-conducting channel, and the two straight lines perpendicular to the channel respectively connect the two ends of the S-shaped curve to the two electrodes. Fig. 1c is the SEM image of the PEDOT:PSS micron line showing the smoothness of the curved portion of the PEDOT:PSS micron line without break points. Meanwhile, PEDOT:PSS micron line tightly connected to the electrodes, without breaks, also close to the substrate binding, like “welding” in general. Fig. 1d is the zoomed in SEM image of the curved line in Fig. 1c. It can be seen that the PEDOT:PSS micron line has a smooth surface and a solid texture without pores. Laser scanning confocal microscope and atomic force microscopy images show the three-dimensional morphology of the PEDOT:PSS micron line (Fig. S2 and S3†). Fig. 1e demonstrates the molecular structure of PEDOT:PSS. Raman spectrum of the PEDOT:PSS micron line fabricated via laser printing is shown in Fig. S4;† the peak observed at 1435 cm−1 corresponds to the symmetric stretching of the thiophene skeleton Cα Cβ (–O).
The sensing mechanism of the PEDOT:PSS micron line humidity sensor is illustrated in Fig. 2. The working mechanism of the sensor belongs to physical adsorption. Specifically, the PEDOT:PSS micron line adsorbs water molecules as the ambient humidity increases, resulting in resistance change of the sensor. The conduction in the conjugated polymer PEDOT:PSS mainly relies on the hopping of electrons among PEDOT chains, while the PSS chains are responsible for water absorption due to its hydrophilic properties. Diffusion of H2O into PEDOT:PSS micron line causes micron line swelling due to protonation of SO3H+ groups at the PEDOT–PSS interface, resulting in the formation of H3O+ PSS(SO3)− (eqn (1)).30 Along with the absorption of water in PSS chains (humidity increases from 11% to 69%), the distance between adjacent PEDOT chains increases. As a result, the hopping conduction of charges among PEDOT chains becomes more difficult to achieve with the increased humidity.31 The electrical resistivity of PEDOT:PSS increases linearly as RH increases (RH < 70%).
| H2O + PSS(HSO3) → H3O+ + PSS(SO3)− | 1 |
The sensing performance test system of the PEDOT:PSS micron line humidity sensor is shown in Fig. 2. Different saturated salt solutions in equilibrium state produce different humidity environments. Insert the humidity sensor into a closed jar and place it above the level of the saturated salt solution. The Keithley 2600 test system provides a constant 2 V voltage to test the current change of the sensor in different humidity environments. The inset of Fig. 2 is a photograph of the device with a size of approximately 3 mm × 2 mm. The device consists of gold electrodes, a microchannel, and silver wires. The laser printed PEDOT:PSS micron line is in the microchannel between the two gold electrodes. The silver wire is connected to the gold electrode by a silver conductive adhesives.
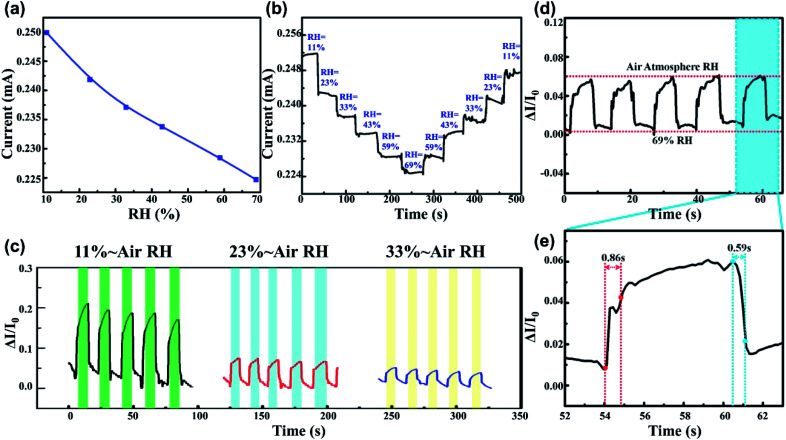
Fig. 3 demonstrates the humidity sensing performance of the PEDOT:PSS micron line humidity sensor. At room temperature, the relative humidity rose from 11% to 69%, while the current of the humidity sensor decreased almost linearly (Fig. 3a). Sensitivity S is defined by S = (ΔR/R0(%))/ΔRH(%), where R0 is the resistance of the sensor at 11% RH, ΔR is the change in resistance, and ΔRH is the RH change. S = 0.19, represents 0.19% per 1% humidity change. Fig. 3b performs a continuous humidity switching test on the humidity sensor. The humidity sensor is stable under continuous stepwise relative humidity increase and decrease. Whether in the adsorption process with increased humidity or the desorption process with decreased humidity, the test current values of the humidity sensor keep consistent at the same relative humidity. The maximum difference between the moisture absorption and desorption processes of the humidity sensor is defined as the humidity hysteresis. Fig. 3b demonstrates that the PEDOT:PSS micron line humidity sensor has a lower humidity hysteresis. Moreover, three different relative humidity environments (11%, 23%, 33%) were chosen to switch to the air atmosphere (RH was approximately 42%) to test five cycles response–recovery process. Each individual adsorption or desorption period was measured to be no more than 9 s as shown in Fig. 3c. The difference of the ΔI/I0 is significant under different humidity condition as shown in Fig. 3c. The baseline and final values of the response during the five dynamic measurement cycles at a certain RH do not show significant drift, indicating exceptional stability and reproducibility of the device. The five cycle tests under each RH were completed in 85 seconds, and all three curves showed a clear platform. Compared to the five cycles of dynamic testing in other works that take ten minutes or even more to obtain a clear platform, our devices demonstrate superior performance in terms of fast response and high stability. The 69% RH was switched to the ambient atmosphere (RH was approximately 42%) and the five-cycle response–recovery process was tested as shown in Fig. 3d. One dynamic cycle of the response–recovery process was amplified to obtain Fig. 3e. The time taken by the current to reach 90% of the total change during adsorption process is the response time. Similarly, the time cost during desorption process is the recovery time. Fig. 3e shows that the PEDOT:PSS sensor has a response time of 0.86 s and a recovery time of 0.59 s. Compared to previous reports, the PEDOT:PSS micron line humidity sensor exhibits better performance in response/recovery speed.
Fig. 3. (a) Current changes of the PEDOT:PSS micron line humidity sensor versus relative humidity. (b) Current change of the sensor under humidity ranging from 11% RH to 69% RH. (c) Five circles dynamic sensing response of the sensor under 11%, 23%, and 33% RH (from air RH). (d) The response and recovery curves for five cycles. (e) Amplified response and recovery curve in the linear coordinate system.
Wearable sensors demonstrate a popular trend to monitor human health and collect motion data.32,33 Recent advances have enabled the development of monitoring devices, such as sports bracelets, sleep respiration monitors, and so on. As mentioned above, the PEDOT:PSS micron line is very sensitive to ambient humidity and has a fast response–recovery rate, which can be used for real-time monitoring of human respiration. Compared to traditional respiration monitors, the PEDOT:PSS micron line humidity sensor is more portable and easier to integrate with other features due to the small size. The side view of the tester wearing the PEDOT:PSS micron line humidity sensor is shown Fig. 4a, which is barely visible due to the small size of the device. Fig. 4b present a zoomed in view of with the frontal portion of the tester. We placed the humidity sensor on the skin under the nose of the tester and the sensor does not affect the normal activity of the tester. The current versus time curve during respiration is shown in Fig. 4c. When the tester takes a deep breath, the respiratory rate is slower, corresponding to the “Slow” portion of Fig. 4c. When the tester is sitting or walking at a constant speed, the respiratory rate is medium, corresponding to the “Normal” portion of Fig. 4c. When the tester is running or strenuous exercise, the respiratory rate is faster, corresponding to the “Fast” portion of Fig. 4c. It can be proved that the PEDOT:PSS micron line humidity sensor can effectively monitor the respiratory rate of human motion in real-time. The “Fast” portion of the curve in Fig. 4c is dense, and this part is zoomed in to calculate the respiratory rate during exercise. The corresponding curve in blue rectangle of Fig. 4d represents the inhalation process, while the curve in red rectangle represents the exhalation process. As people exhale, the exhalation channel is highly moisturized by our lungs causing an increase in humidity above the sensor. During inhalation, inhaling airflow from the environment will reduce the level of humidity around the sensor. This is consistent with our conclusions from the basic sensor performance experiments in which the PEDOT:PSS micron line resistance increases and the current decreases as humidity increases. Fig. 4e can be obtained by calculating the respiratory rate from Fig. 4c and d. The respiratory rates in the “Slow”, “Normal” and “Fast” modes are 6.8 min−1, 13.2 min−1, 50.4 min−1, respectively. Fig. 4f can be obtained by extracting the individual respiratory process data of the three modes (Fig. S5†). The inhalation duration in the “Slow” “Normal” and “Fast” modes is 1.68 s, 1.44 s, and 0.48 s, while the exhalation duration in the three modes is 0.96 s, 0.72 s, and 0.48 s, respectively. The PEDOT:PSS micron line humidity sensor provides real-time reflection of data in the respiratory rate, demonstrating its potential for real-time respiration monitoring. Besides respiration monitoring, the sensor can also be used to track other physiological humidity signals, such as fast and sensitive response with finger sweep over the sensor (non-contacting, Fig. S6†).
Fig. 4. Photographs of the PEDOT:PSS micron line humidity sensor on skin (under nose) (a) side view, (b) front view. (c) Responses of the sensor at different respiratory rate (d) amplified view of (c) curve in the linear coordinate system. (e) Respiratory rates in three modes. (f) The duration of the inhalation process and exhalation process in the three modes.
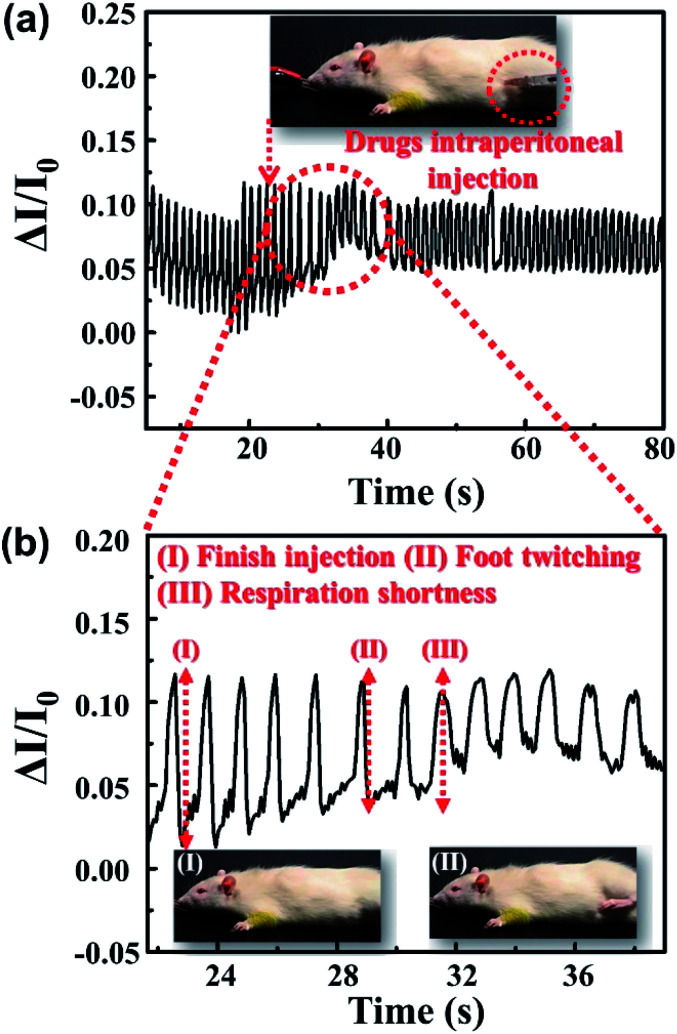
The vital capacity of an adult male is about 3500–4000 mL, while the experimental rat of about 200 g has a vital capacity of only 1–2 mL. Therefore, the change of humidity during the respiration of the rat is smaller, and a lower threshold respiratory detector is imperative. Fig. S7† shows the real-time monitoring of the rat's respiration after anesthesia with the PEDOT:PSS micron line humidity sensor. When the sensor was removed from the mouth of the rat after anesthesia, the current showed a significant change. The PEDOT:PSS micron line humidity sensor enables real-time and non-invasive monitoring of rat's respiration. Nikethamide is a clinically used drug for indications of central respiratory depression and respiratory depression caused by various causes. It can selectively excite the medullary respiratory center and accelerate the respiration. Fig. 5a shows the changes of respiration before and after injection of nikethamide injection into deep anesthetized rat. It is apparent that the rat respiratory current curve becomes shorter after injection of nikethamide injection as shown in Fig. 5a, demonstrating that the sensor can monitor the respiratory effects of the injected drug on the rat. The ability of the sensor to detect rapid respiration in the rat also demonstrates high sensitivity. To investigate in detail the effect of the injected drug on the physiological characteristics of anesthetized rat, a partial curve of Fig. 5a is zoomed in, as shown in Fig. 5b. Fig. 5b(I) corresponds to 22.81 seconds when nikethamide injection into anesthetized rat is completed. After nikethamide injection, the rat first appears sufficient jitter physiological response at the time of 28.89 seconds as shown in Fig. 5b(II). Fig. 5b(III) shows that the current curve of the rat's respiratory begins to change significantly after the injection of nikethamide. At this time, the respiration of the rat is considerably faster, and the corresponding time was 31.54 seconds. It can be seen that after 6.08 seconds of nikethamide injection, the rat first had a stress reflex in the foot. After another 2.65 seconds, the drug exerted an effect on the central respiratory, and the rat showed obvious tachypnea. Apparently, there is no obvious change in the current curve of the rats' respiratory during 8.73 seconds between the states of Fig. 5b(I) and (III), which presents the absorption process of nikethamide (Video S1†). Through real-time monitoring of the respiratory process in rat, the sensor provides a visual representation, accurate record of the respiratory central drugs delivery, and the effects on animal physiological activities. The sensor plays an imperative role in physiological and pharmacological research ranging from motion/respiration monitoring to pharmacological study of small animals. Meanwhile, the actual operating area of the device is less than one hundred square microns, which greatly facilitates the integration of the device with other functional biosensing systems. In the future, it has broad application prospects in the field of bioelectronics.
Fig. 5. (a) Respiratory monitoring curves of anesthetized rat before and after injection of nikethamide. (b) Amplified view of (a) curve in the linear coordinate system.
Conclusions
In summary, a PEDOT:PSS micron line humidity sensor for respiration monitoring has been prepared by femtosecond laser printing method. The PEDOT:PSS micron line humidity sensor is small in size, leading to the easy integration with wearable devices and other functional sensing chips. The sensing performance test demonstrates that the PEDOT:PSS micron line humidity sensor features good stability, low humidity hysteresis and fast response–recovery time. The PEDOT:PSS micron line humidity sensor monitors human respiration and further distinguishes respiratory rate. In addition, the PEDOT:PSS micron line humidity sensor also demonstrates the real-time respiratory changes in rat before and after nikethamide injection. The sensor fulfils real-time monitoring of respiratory changes in rat, which provides new practical equipment for physiology and pharmacology study. Taking into account the simple manufacturing process, readily available materials, excellent response speed and easy integration, PEDOT:PSS micron line humidity sensor will have broad application prospects in real-time monitoring of human and animal health.
Conflicts of interest
There are no conflicts to declare.
Supplementary Material
Acknowledgments
This work was supported by the National Natural Science Foundation of China (Grant No. 61435005, 61590930, and 51335008) and Graduate Interdisciplinary Research Fund of Jilin University (No. 10183201844).
Electronic supplementary information (ESI) available. See DOI: 10.1039/c9ra10409g
References
- Li K. He Q. Wang J. Zhou Z. Li X. Microsyst. Nanoeng. 2018;4:24. doi: 10.1038/s41378-018-0024-3. [DOI] [PMC free article] [PubMed] [Google Scholar]
- Lou Z. Wang L. Shen G. Adv. Mater. Technol. 2018;3:1800444. doi: 10.1002/admt.201800444. [DOI] [Google Scholar]
- Peng C. K. Mietus J. E. Liu Y. Lee C. Hausdorff J. M. Stanley H. E. Goldberger A. L. Lipsitz L. A. Ann. Biomed. Eng. 2002;30:683–692. doi: 10.1114/1.1481053. [DOI] [PubMed] [Google Scholar]
- Bhattacharjee M. Nemade H. B. Bandyopadhyay D. Biosens. Bioelectron. 2017;94:544–551. doi: 10.1016/j.bios.2017.03.049. [DOI] [PubMed] [Google Scholar]
- Tao L. Q. Zhang K. N. Tian H. Liu Y. Wang D. Y. Chen Y. Q. Yang Y. Ren T. L. ACS Nano. 2017;11:8790–8795. doi: 10.1021/acsnano.7b02826. [DOI] [PubMed] [Google Scholar]
- Liao F. Zhu Z. Yan Z. Yao G. Huang Z. Gao M. Pan T. Zhang Y. Li Q. Feng X. Lin Y. J. Breath Res. 2017;11:036002. doi: 10.1088/1752-7163/aa757e. [DOI] [PubMed] [Google Scholar]
- Pang Y. Jian J. Tu T. Yang Z. Ling J. Li Y. Wang X. Qiao Y. Tian H. Yang Y. Ren T. L. Biosens. Bioelectron. 2018;116:123–129. doi: 10.1016/j.bios.2018.05.038. [DOI] [PubMed] [Google Scholar]
- Zhang J. Wang X. X. Zhang B. Ramakrishna S. Yu M. Ma J. W. Long Y. Z. ACS Appl. Mater. Interfaces. 2018;10:19863–19870. doi: 10.1021/acsami.8b01718. [DOI] [PubMed] [Google Scholar]
- Kano S. Kim K. Fujii M. ACS Sens. 2017;2:828–833. doi: 10.1021/acssensors.7b00199. [DOI] [PubMed] [Google Scholar]
- Soomro A. M. Jabbar F. Ali M. Lee J. W. Mun S. W. Choi K. H. J. Mater. Sci.: Mater. Electron. 2019;30:9455–9465. doi: 10.1007/s10854-019-01277-1. [DOI] [Google Scholar]
- Li B. Xiao G. Liu F. Qiao Y. Li C. M. Lu Z. J. Mater. Chem. C. 2018;6:4549–4554. doi: 10.1039/C8TC00238J. [DOI] [Google Scholar]
- Wu J. Sun Y. M. Wu Z. Li X. Wang N. Tao K. Wang G. P. ACS Appl. Mater. Interfaces. 2019;11:4242–4251. doi: 10.1021/acsami.8b18599. [DOI] [PubMed] [Google Scholar]
- Zhen Z. Li Z. Zhao X. Zhong Y. Zhang L. Chen Q. Yang T. Zhu H. Small. 2018;14:1703848. doi: 10.1002/smll.201703848. [DOI] [PubMed] [Google Scholar]
- Zou H. Wang J. Li X. J. Microelectromech. Syst. 2017;26:879–885. [Google Scholar]
- Wang J. C. Rong W. B. Li X. X. Sun L. N. Opt. Precis. Eng. 2008;16:636–641. [Google Scholar]
- Shew B. Y. Kuo C. H. Huang Y. C. Tsai Y. H. Sens. Actuators, A. 2005;120:383–389. doi: 10.1016/j.sna.2005.01.004. [DOI] [Google Scholar]
- Samà J. Domènech-Gil G. Gràcia I. Borrisé X. Cané C. Barth S. Steib F. Waag A. Pradesa J. Romano Rodríguez A. Sens. Actuators, B. 2019;286:616–623. doi: 10.1016/j.snb.2019.01.040. [DOI] [Google Scholar]
- Zhang D. Zong X. Wu Z. Zhang Y. ACS Appl. Mater. Interfaces. 2018;10:32631–32639. doi: 10.1021/acsami.8b08493. [DOI] [PubMed] [Google Scholar]
- Katsuhiko A. Lvov Y. M. Kohsaku K. Qingmin J. Hill J. P. Adv. Drug Delivery Rev. 2011;63:762–771. doi: 10.1016/j.addr.2011.03.016. [DOI] [PubMed] [Google Scholar]
- Zhang Y. L. Chen Q. D. Xia H. Sun H. B. Nano Today. 2010;5:435–448. doi: 10.1016/j.nantod.2010.08.007. [DOI] [Google Scholar]
- Xu B. B. Xia H. Niu L. G. Zhang Y. L. Sun K. Chen Q. D. Xu Y. Lv Z. Q. Li Z. H. Misawa H. Sun H. B. Small. 2010;6:1762–1766. doi: 10.1002/smll.201000511. [DOI] [PubMed] [Google Scholar]
- Zhang Y. Guo L. Wei S. He Y. Xia H. Chen Q. Sun H. B. Xiao F. S. Nano Today. 2010;5:15–20. doi: 10.1016/j.nantod.2009.12.009. [DOI] [Google Scholar]
- Xia H. Wang J. Tian Y. Chen Q. D. Du X. B. Zhang Y. L. He Y. Sun H. B. Adv. Mater. 2010;22:3204–3207. doi: 10.1002/adma.201000542. [DOI] [PubMed] [Google Scholar]
- Li L. Lin H. Qiao S. Huang Y. Z. Li J. Y. Michon J. Gu T. Alosno Ramos C. Vivien L. Yadav A. Richardson K. Lu N. Hu J. Light: Sci. Appl. 2018;7:17138. doi: 10.1038/lsa.2017.138. [DOI] [PMC free article] [PubMed] [Google Scholar]
- Han D. D. Zhang Y. L. Jiang H. B. Xia H. Feng J. Chen Q. D. Xu H. L. Sun H. B. Adv. Mater. 2015;27:332–338. doi: 10.1002/adma.201403587. [DOI] [PubMed] [Google Scholar]
- Zhao H. Zhang T. Qi R. Dai J. Liu S. Fei T. ACS Appl. Mater. Interfaces. 2017;9:28002–28009. doi: 10.1021/acsami.7b05181. [DOI] [PubMed] [Google Scholar]
- Lin L. Peng X. Mao Z. Li W. Yogeesh M. N. Rajeeva B. B. Perillo E. P. Dunn A. K. Akinwande D. Zheng Y. Nano Lett. 2016;16:701–708. doi: 10.1021/acs.nanolett.5b04524. [DOI] [PMC free article] [PubMed] [Google Scholar]
- Hua Q. Sun J. Liu H. Bao R. Yu R. Zhai J. Pan C. Wang Z. L. Nat. Commun. 2018;9:244. doi: 10.1038/s41467-017-02685-9. [DOI] [PMC free article] [PubMed] [Google Scholar]
- Zou Z. Zhu C. Li Y. Lei X. Zhang W. Xiao J. Sci. Adv. 2018;4:eaaq0508. doi: 10.1126/sciadv.aaq0508. [DOI] [PMC free article] [PubMed] [Google Scholar]
- Muckley E. S. Lynch J. Kumar R. Sumpter B. Ivanov I. N. Sens. Actuators, B. 2016;236:91–98. doi: 10.1016/j.snb.2016.05.054. [DOI] [Google Scholar]
- Benchirouf A. Palaniyappan S. Ramalingame R. Raghunandan P. Jagemann T. Müller C. Hietschold M. Kanoun O. Sens. Actuators, B. 2016;224:344–350. doi: 10.1016/j.snb.2015.10.009. [DOI] [Google Scholar]
- Yin D. Feng J. Ma R. Liu Y. F. Zhang Y. L. Zhang X. L. Bi Y. G. Chen Q. D. Sun H. B. Nat. Commun. 2016;7:11573. doi: 10.1038/ncomms11573. [DOI] [PMC free article] [PubMed] [Google Scholar]
- Lou Z. Li L. Wang L. Shen G. Small. 2017;13:1701791. doi: 10.1002/smll.201701791. [DOI] [PubMed] [Google Scholar]
Associated Data
This section collects any data citations, data availability statements, or supplementary materials included in this article.


